Time Resolved Stereoscopic PIV in Pipe Flow. Visualizing 3D Flow ...
Time Resolved Stereoscopic PIV in Pipe Flow. Visualizing 3D Flow ...
Time Resolved Stereoscopic PIV in Pipe Flow. Visualizing 3D Flow ...

Create successful ePaper yourself
Turn your PDF publications into a flip-book with our unique Google optimized e-Paper software.
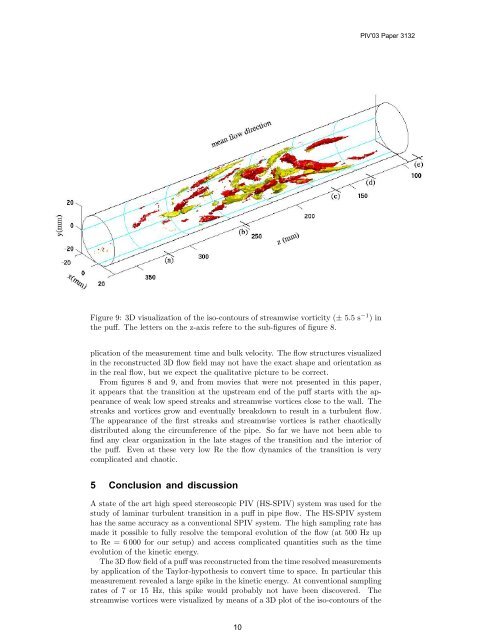
<strong>PIV</strong>’0 3 Paper 3132Figure 9: <strong>3D</strong> visualization of the iso-contours of streamwise vorticity (± 5.5 s −1 ) <strong>in</strong>the puff. The letters on the z-axis refere to the sub-figures of figure 8.plication of the measurement time and bulk velocity. The flow structures visualized<strong>in</strong> the reconstructed <strong>3D</strong> flow field may not have the exact shape and orientation as<strong>in</strong> the real flow, but we expect the qualitative picture to be correct.From figures 8 and 9, and from movies that were not presented <strong>in</strong> this paper,it appears that the transition at the upstream end of the puff starts with the appearanceof weak low speed streaks and streamwise vortices close to the wall. Thestreaks and vortices grow and eventually breakdown to result <strong>in</strong> a turbulent flow.The appearance of the first streaks and streamwise vortices is rather chaoticallydistributed along the circumference of the pipe. So far we have not been able tof<strong>in</strong>d any clear organization <strong>in</strong> the late stages of the transition and the <strong>in</strong>terior ofthe puff. Even at these very low Re the flow dynamics of the transition is verycomplicated and chaotic.5 Conclusion and discussionA state of the art high speed stereoscopic <strong>PIV</strong> (HS-S<strong>PIV</strong>) system was used for thestudy of lam<strong>in</strong>ar turbulent transition <strong>in</strong> a puff <strong>in</strong> pipe flow. The HS-S<strong>PIV</strong> systemhas the same accuracy as a conventional S<strong>PIV</strong> system. The high sampl<strong>in</strong>g rate hasmade it possible to fully resolve the temporal evolution of the flow (at 500 Hz upto Re = 6 000 for our setup) and access complicated quantities such as the timeevolution of the k<strong>in</strong>etic energy.The <strong>3D</strong> flow field of a puff was reconstructed from the time resolved measurementsby application of the Taylor-hypothesis to convert time to space. In particular thismeasurement revealed a large spike <strong>in</strong> the k<strong>in</strong>etic energy. At conventional sampl<strong>in</strong>grates of 7 or 15 Hz, this spike would probably not have been discovered. Thestreamwise vortices were visualized by means of a <strong>3D</strong> plot of the iso-contours of the10