Area of Exceptionality Number of Students Identified 2008-09 2009 ...
Area of Exceptionality Number of Students Identified 2008-09 2009 ...
Area of Exceptionality Number of Students Identified 2008-09 2009 ...

You also want an ePaper? Increase the reach of your titles
YUMPU automatically turns print PDFs into web optimized ePapers that Google loves.
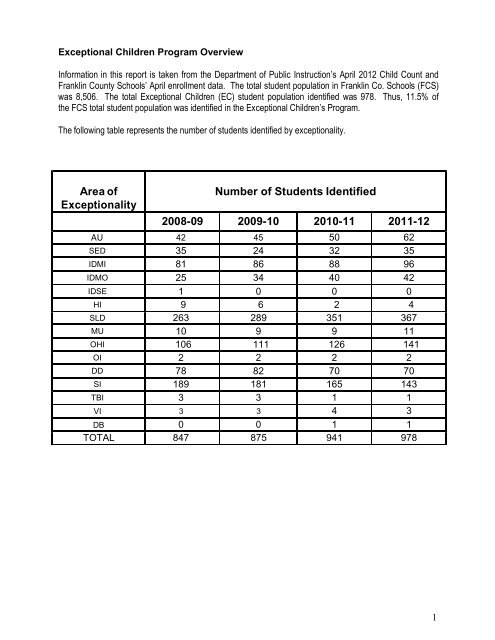
Exceptional Children Program OverviewInformation in this report is taken from the Department <strong>of</strong> Public Instruction’s April 2012 Child Count andFranklin County Schools’ April enrollment data. The total student population in Franklin Co. Schools (FCS)was 8,506. The total Exceptional Children (EC) student population identified was 978. Thus, 11.5% <strong>of</strong>the FCS total student population was identified in the Exceptional Children’s Program.The following table represents the number <strong>of</strong> students identified by exceptionality.<strong>Area</strong> <strong>of</strong><strong>Exceptionality</strong><strong>Number</strong> <strong>of</strong> <strong>Students</strong> <strong>Identified</strong><strong>2008</strong>-<strong>09</strong> 20<strong>09</strong>-10 2010-11 2011-12AU 42 45 50 62SED 35 24 32 35IDMI 81 86 88 96IDMO 25 34 40 42IDSE 1 0 0 0HI 9 6 2 4SLD 263 289 351 367MU 10 9 9 11OHI 106 111 126 141OI 2 2 2 2DD 78 82 70 70SI 189 181 165 143TBI 3 3 1 1VI 3 3 4 3DB 0 0 1 1TOTAL 847 875 941 9781
Program Overview <strong>of</strong> <strong>Exceptionality</strong> by SchoolThe table below summarizes the number <strong>of</strong> students by exceptionality and the percentage <strong>of</strong> studentsidentified as EC in relation to the school’s total student population based on data for the Department <strong>of</strong>Public Instruction’s April 1 Child Count Franklin County Schools’ April enrollment data.Elementary Schools:AU DD SED IDMI HI LD MU OH OI SI IDSETBI IDMO VITotalStudentPopulationTotal ECStudentPopulationPercent inSpecialEducationBES 4 7 3 9 1 16 1 18 1 20 0 0 2 0 712 82 11.5%EBES 2 2 2 5 0 38 0 11 0 16 0 0 0 0 472 76 16.1%FES 1 1 2 4 0 19 0 10 0 13 0 0 0 0 483 50 10.4%LES 9 30 2 3 1 12 2 4 0 16 0 0 3 0 544 82 15.1%LGMES 2 5 2 2 0 17 1 6 0 10 0 0 3 1 557 49 8.8%LMES 0 9 0 5 0 11 0 4 0 9 0 0 1 0 295 39 13.2%RES 5 10 3 7 0 26 0 2 0 18 0 0 0 0 567 71 12.5%YES 11 0 0 3 0 15 0 8 0 10 0 0 3 0 459 50 10.9%CO* 2 6 0 0 0 1 0 0 0 24 0 0 0 0 33TOTAL 36 70 14 38 2 155 4 63 1 136 0 0 12 1 4089 532 13.0%* CO = Pre-k served at daycare/early childhood settings carried on Central Office count2
Program Overview <strong>of</strong> <strong>Exceptionality</strong> by School (cont.)Middle Schools:AU DD BED IDMI HI LD MU OH OI SI IDSE TBI IDMO VI Total Total EC Percent inStudent Population SpecialPopulationEducationBMS 6 0 2 8 1 32 0 18 0 2 0 0 5 0 698 74 10.6%CCMS 4 0 4 2 0 39 2 15 0 2 0 0 4 0 826 72 8.7%TLMS 0 0 2 9 1 27 1 9 0 1 0 0 2 2 437 54 12.4%TOTAL 10 0 8 19 2 98 3 42 0 5 0 0 11 2 1961 200 10.2%High Schools:AU DB DD BED IDMI HI LD MU OH OI SI IDSE TBI IDMO VI Total Total EC Percent inStudent Population SpecialPopulationEducationBHS 0 1 0 4 16 0 45 1 7 1 2 0 0 8 0 853 85 10.0%ECHS 0 0 0 0 0 0 1 0 1 0 0 0 0 0 0 95 2 2.1%FHS 6 0 0 7 13 0 41 2 17 0 0 0 0 4 0 907 90 9.9%LHS 10 0 0 2 10 0 27 1 11 0 0 0 1 7 0 601 69 11.5%TOTAL 16 1 0 13 39 0 114 4 36 1 2 0 1 19 0 2456 246 10.0%3
Program Overview <strong>of</strong> Gender and Ethnicity by SchoolThe next tables are representative <strong>of</strong> the gender and racial composition <strong>of</strong> the various exceptionalities byschool based on the April 2011 Child Count.Elementary Schools:Black White Hispanic AmericanIndianMultiracial Asian Male FemaleBES 23 46 10 0 3 0 46 36EBES 24 36 9 4 3 0 46 30FES 28 17 5 0 0 0 35 15LES 43 28 10 0 1 0 57 25LGMES 17 25 4 0 3 0 33 16LMES 17 14 6 0 2 0 29 10RES 17 48 6 0 0 0 45 26YES 13 31 5 0 1 0 37 13CO* 11 16 6 0 0 0 27 6TOTAL 193 261 61 4 13 0 355 177At the elementary level, 36% <strong>of</strong> EC students are Black, 49% are White, 12% are Hispanic, 3% areAmerican Indian, Multi-racial, and Asian. By gender, 67% are males and 33% are females.4
Program Overview <strong>of</strong> Gender and Ethnicity by School (cont.)Middle Schools:Black White Hispanic AmericanIndianMultiracial Asian Male FemaleBMS 31 30 10 0 3 0 57 17CCMS 30 33 6 0 3 0 53 19TLMS 30 16 6 0 2 0 32 22TOTAL 91 79 22 0 8 0 142 58At the middle school level, 46% <strong>of</strong> EC students are Black, 40% are White, 11% are Hispanic, and 3% areMultiracial. By gender, 72% are males and 28% are females.High Schools:Black White Hispanic AmericanIndianMultiracial Asian Male FemaleBHS 31 38 16 0 0 0 57 28ECHS 1 1 0 0 0 0 0 2FHS 40 44 3 0 2 1 62 28LHS 38 29 1 0 1 0 48 21TOTAL 110112 20 0 3 1 167 79At the high school level, 45% <strong>of</strong> EC students are Black, 45% are White, 8% are Hispanic, and 2% areAmerican Indian and Multiracial. By gender, 68% are males and 32% are females.5