HII regions slides
HII regions slides
HII regions slides
You also want an ePaper? Increase the reach of your titles
YUMPU automatically turns print PDFs into web optimized ePapers that Google loves.
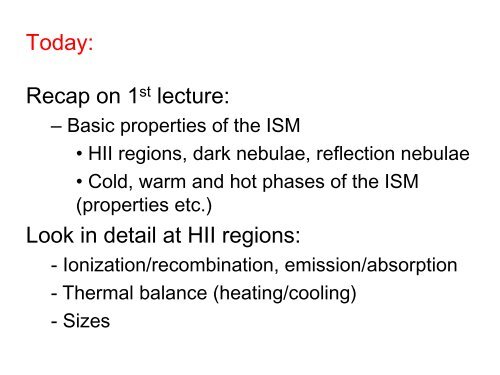
Today:Recap on 1 st lecture:– Basic properties of the ISM• <strong>HII</strong> <strong>regions</strong>, dark nebulae, reflection nebulae• Cold, warm and hot phases of the ISM(properties etc.)Look in detail at <strong>HII</strong> <strong>regions</strong>:- Ionization/recombination, emission/absorption- Thermal balance (heating/cooling)- Sizes
ISM:ISM: why?built from remains of stars(i) during life: stellar winds (slow and steady during lifetime)(ii) end of life: ejected massive envelopes (PN, novae)(iii) end of life: supernova explosionsThe ISM is a transitory phase of matter but plays a majorrole1) stars are re-born from it2) planets are formed from it3) we are born from it!
Distance = 450 pcDiameter ~ 1° (similarto the full moon)Composition:• Ionized gas:H ~ 90% (by number)He ~ 10% (by number)•
The Trapezium Clusterdominant star: 1 Ori-Cspectral type O6V: T ~ 20 000 Kemits a great number of energeticphotons that ionize the gas
Dark CloudsBok globules• relatively much denser that general diffuse ISMclouds:densities ~10 4 - 10 9 particles per cm 3• made up of atoms, molecules and dust particles
Reflection nebulae
ISM: average properties• Mean density of ISM (in our Galaxy) ~ 10 6 particles/m 3 (1 particle/cm 3 )but is HIGHLY CLUMPED: filling factor ~3%.• The GAS is mainly:Hydrogen (90%)Helium (10%)metals (C,N,O, ... Fe)
A global model:the 3+1 phases of the ISM• Cold, neutral medium (CNM)n ~ 110 3 /cm 3 , T < 100 K, volume fraction: ~15%• Hot, ionized medium (HIM)n ~ 10 -4 10 -2 /cm 3 , T ~ 10 6 10 7 K, volume fraction: ~3070%• Warm interface media• Warm ionized medium (WIM)n ~ 0.01 /cm 3 , T ~ 1000 K, volume fraction: ~2050%hydrogen ionization fraction (X H ) ~ 70%• Warm neutral medium (WNM)n ~ 0.110 /cm 3 , T ~ 10005000 K, volume fraction: ~1020%hydrogen ionization fraction (X H ) ~ 10% Dark neutral (molecular) cloudsn ~ 10 3 10 6 /cm 3 , T ~ 10 50 K, volume fraction:
A global view
Hot, ionized medium (HIM)Arises through the heating and energy input from overlapping Supernovaeexplosions and their remnants: directly seen in X-rays.408 MHz (radio)• Supernovae occur in the Galactic plane: causes hot gas to rise to highdistances above/below the plane of the Galaxy• Gives rise to a halo of hot gas around the galaxy.• This gas then cools and falls back to the galactic plane, and is replenished byfurther SN: the Galactic Fountain model.
Cold, neutral medium (CNM)• dominated by diffuse clouds with n ~ 10 1 10 3 /cm 3 , T ~ 30100 K,individual cloud radii = few pc• cold enough that simple molecules can form, e.g. H 2 and CO.• however, most INTERSTELLAR MOLECULES are mainly found in thedenser DARK CLOUDS (Barnard Objects and Bok Globules) with n ~10 6 10 7 /cm 3 and T ~ 10 K.• Still denser <strong>regions</strong> are the GIANT MOLECULAR CLOUDS with n ~ 10 10/cm 3 and T ~ 50 K. These are associated with sites of new STARFORMATION.
M101
www.milkywayproject.org
Today:<strong>HII</strong> <strong>regions</strong>:- Ionization/recombination, emission/absorption- Thermal balance (heating/cooling)- Sizes• The addition of metals- Forbidden lines- Metal line cooling- Density/temperature diagnostics
Lagoon nebula
Rosette Nebula2 O-stars
PhotoionisationPhotoionisation: the removal of electrons from gas atoms by photons.H + (ionizing photon) p + e (Eqn. 1)
Photoionisation5432113.6 eV = < 912 Å
Photoionisation: the removal of electrons from gas atoms by photons.H + (ionizing photon) p + e (Eqn. 1)For Hydrogen (most abundant atom) photons need to have an energyof at least 13.6 eV (corresponding to < 912 Å)13.6 eV therefore = the “Ionisation Potential” of Hydrogen (I H )= called one RydbergOnly stars with T > 20 000 K (spectral types O and B) emit ‘ionising’photonsISM = low density all Hydrogen is assumed to be in ground state (n = 1) need only consider photoionsation from n = 1 state
RecombinationAttraction between protons and electrons leads to the recapture of theelectron.p + e H + (ionizing photon)
Balmer seriesLyman series(UV)Recombination cascade in H-atom5HHH4H3H211 æ 1 1= Rç-2 2l è N nö÷øPaschen series (IR)N = no. of inner orbirtn = No. of outer orbitR = Rydberg const.H
in summary
Optical SpectrumPlanetary Nebula: NGC 3242(ESO 1.5-m in Chile)Blue = recombination lines of H and HeRed = forbidden lines of ‘metals’
Thermalization of energies and ionizationbalanceTo a good approx. the nebula contains only neutral H, protons (p), and electrons(e )The energy of the free electrons can be “anything” above 13.6 eVThe total energy available for photoionization depends on the total number ofphotons.This is a function of the effective temperature (T eff ) of the ionizing starThe energy is spread out (shared) between all the particles (by collisions)and acquires a single ‘kinetic temperature’ for all 3 types of particle.We say the plasma becomes ‘thermalized’.The distribution of velocities within the gas can now be described by a‘Maxwellian distribution’
AtomsThe Maxwellian DistributionVelocity
Photoionisation rate [number of events/m 3 /sec]:N PI = a n HI J [m -3 s -1 ]a = photoionsation cross section (= 6.810 -22 m 2 )n HI = number density of neutral H (HI)J = rate of incident ionising photons (with E >13.6 eV) (m -2 s -1 )
cross sectionse nucleuselectric fieldcross section = likelihood (probability) of interaction between particles
Ionisation balanceEquilibrium occurs when there is a balance between the forward and backwardratesi.e. Photoionization rate, N PI = Recombination rate, N RH + (ionising photon) p + e The degree of ionisation can be described as:n e = n p = X nX = fraction of ionised H atomsn = number density of H nuclei (proton+neutral atom densities)n HI = n – X nn HI = number density of neutral H (HI)Now we can use these equations in the previous relations…
For a typical O-star (e.g. the O6V star in the Trapezium)S = 10 49 s -1Typical nebula, n = 10 8 m -3 ; T e = 10 4 KAt r = 1 pc, J = 8.410 14 m 2 s -1giving X = 0.9999999i.e. the <strong>HII</strong> region is almost fully ionised!We can calculate this for a range of r-values X as a function of r
ionisation structure
M43Real examples1. no. of ionising photons- Hotter star- More hot stars2. amount of gas (gas density)IC 1274
Thermal balance in ionized nebulaePhotoionization adds kinetic energy (KE) into the H cloud since it creates hot, fastphotoelectrons.T can increase indefinitely though… Energy must be lost somehowEnergy can be lost through photons: H recombination means KE of e photonwhich can escapeOn average, heat lost per recombination = 3/2 k T eso Cooling rate is:L = (3/2 k T e ) N R [J m -3 s -1 ]Energy input, or the Heating rateG = N PI Q [J m -3 s -1 ]Q = the heating energy injected into the gas per photoionization (in Joules)in equilibrium, G = L (and N R = N PI ) T e = (2/3)Q/k.
However, Q per ionization is: (3/2) kT T e = T For OB-type ionizing stars T = 30 000 – 60 000 KThese temperatures are much higher than observationsTypical nebula gas temperature has T e ~ 10 000 K. There must be other ways to cool the gasWhat if we relax our assumption of a pure H nebula?
Metals• Real nebulae contain more than just H• Metals (heavy elements, C, N, O, Ne, S, Ar, Cl, etc.) are found inproportion to Hydrogen of ~10 -4 – 10 -8H recombination = ALLOWED transitionshigh probability of occurring (~10 9 per sec)
excitation/de-excitation of bound electronsphotonscollisionsabsorption/emissionnon-radiativeexcitation/de-excitation
energy levels (➙ transitions) in metals are not as simple as H!n = 3n = 2n = 1
Collisionally excited lines (CELs)Bang!n = 3n = 2n = 1
Forbidden linesForbidden line: arises when an electron is excited by a collision into a‘metastable state’.When densities are higher (e.g. our atmos. greater than about 10 8 percm 3 ), electron would almost immediately be knocked out of metastable stateby collision and not be given time to emit a photon (collisional de-excitation =no photon).But in a low density nebula, the time between collisions ~ 10 10,000seconds(v. long time) allowed time to radiate spontaneouslyIn a nebular environment, practically every ion goes to the ground state byforbidden radiationThe term ‘Forbidden’ refers to quantum mechanical rules - a little misleading!More intuative name: Collisionally excited lines (CELs) - line emissionfollowing collision with electron
O +CELs (forbidden lines) are written with [ ] e.g. [OII] 3726Å
1S 05.4 eV1D 22.5 eVcritical density forcollisional de-excitation= 7 10 5 cm -323P 100 eV10 5 cm -3 = density where collisional deexcitationof many of the bright linesbegins to matter
compare energy level diagrams1S 05.4 eV1D 22.5 eV23P 100 eV
(N + )(O 2+ )
Forbidden line coolingtransition rates very low: ~10 -3 100 per sec(compared to H recombination rates: 10 9 per sec)Therefore photons are v. likely to escape nebula before beingabsorbed can ignore absorptionThey can remove a lot of heat from the nebula, thus solving ourproblemCommon forbidden lines:Optical: [OIII] 4959,5007 Å, [NII] 6548,6584 Å, [SII] 6717,6731 ÅInfrared: [OIII] 52,88 m, [NIII] 57 m
Consequence of forbidden-line cooling:the higher the metallicity (i.e. heavy-element content) of anebula, the faster it cools to thermal equilibriumand the stronger the forbidden lines are
www.jodcast.netTopical podcast with two monthly episodes,featuring interviews, news items, night sky,“Ask an astronomer”, humour(and occasionally videos)
energyTemperaturesObservation T e of ~7000–10000 K for <strong>HII</strong> <strong>regions</strong>~9000–15000 K for PNe
DensitiesObservations n e ~ 100 cm -3 for <strong>HII</strong> <strong>regions</strong>~ a few 1000 cm -3 for PNe
AbundancesNow we know T e and n ewe can calculate the abundance of all the different ions emitting the forbiddenlinesFor example in the case of oxygen ions (but also for ions of C, N, Ne, S, Ar, Cletc):N(O 2+ )N(H + ) ~n ef (T e)I(l4959)I(Hb)n e = electron densityf(T e ) = fraction of O 2+ ions able to emit at 4959 Å (strong dependence on nebular temp)I(4959)/I(H) = flux of the [OIII] 4959 Å line relative to H Gives the number of O ++ ions relative to the number of H + (the most abundant ion in anebula).
Fraction of O2+ ions able to emit 4959-Afraction of O 2+ ions able to emit 4959n i(T e)2000 4000 6000 8000 10000 12000 14000 16000Temperature of nebula (K)Measure forbidden lines from all ionic stages of an element (e.g. O, O + ,O 2+ )add up all the abundances to find the total abundance relative tohydrogen.
Problem:We need to know abundance of all ions of particular element to reallyknow its abundance - not always possiblesome lines are weak need to use big telescopeFor more distant objects (e.g. galaxies), this becomes even more of aproblem!some lines are unobservable ionization corrections (theoretical)
End of last lecture
Last lecture(s):Recap on essentials from last lectureLooked in detail at: <strong>HII</strong> <strong>regions</strong>• Photoionization and recombination• Heating and cooling processes• H heating problem ➙ Metals ➙ Forbidden lines• Temp and density diagnostics, abundances
Today:<strong>HII</strong> <strong>regions</strong>: Practical methods & examplesCooler phases of ISM - non-ionised material
Forbidden line =Collisionally excited lines (CELs)n = 3n = 2n = 1
compare energy level diagrams1S 05.4 eV1D 22.5 eV23P 100 eV
energyTemperaturesObservation T e of ~7000–10000 K for <strong>HII</strong> <strong>regions</strong>~9000–15000 K for PNe
DensitiesObservations n e ~ 100 cm -3 for <strong>HII</strong> <strong>regions</strong>~ a few 1000 cm -3 for PNe
Now we know T e and n ewe can calculate the abundance of all the different ions emitting theforbidden linesadd up all the abundances to find the total abundance relative toHydrogen.Problem:We need to know abundance of all ions of particular element to reallyknow its abundance - not always possiblesome lines are weak need to use big telescopeFor more distant objects (e.g. galaxies), this becomes even more of aproblem!some lines are unobservable ionization corrections (theoretical)
Practical methods and examples
30 Dor (HST ACS)• Observe with spectrograph• Measure line strengths (“fluxes”) of forbidden lines and representative Hrecomb. line (e.g. H)• Use ratios to calculate temp and density• Calculate abundances relative to H
eal example
n e
• End of stellar existence for low- to medium- massstars• Important source of heavy metals which enrich ISM• Often only source of information about abundances inexternal systems• Therefore, useful to know what’s in them
So how do we find out what’s in them?• Spectroscopic analysis• Historically relied on brightest emission lines –collisionally excited lines• These are easily observable, but very very sensitive tophysical conditions• Small error in assumed temperature = big error in derivedabundance
Optical Recombination Lines• ORLs of hydrogen and helium are strong, but thoseof heavy elements are much weaker• Much less sensitive to physical conditions, so shouldbe more reliable to derive abundances from• Should be…
…but is it?• Unfortunate problem – in PNe they always givehigher abundances relative to hydrogen than CELs• Factors range from 3 30 and beyond
Possible solutions?• Possibility 1: Temperature fluctuations in homogeneousgas– Hotter <strong>regions</strong> preferentially emit CELs, cooler<strong>regions</strong> preferentially emit ORLs. Assuming uniformtemperature results in underestimated CELabundances.Easily ruled out with high-res spectroscopy
Any other ideas?• Possibility 2: density fluctuations in chemicallyhomogeneous gas– Very dense <strong>regions</strong> (n e ~10 6 cm -3 ) would quenchemission of [O III] 4959,5007 lines– [O III]4363 has higher critical density and is notquenched. Therefore [O III] ratio underestimated,T e overestimated, CEL abundancesunderestimated.Measuring density of hydrogen gas (through method wehaven’t seen) rules this out
Any other ideas?• Possibility 3: Chemical inhomogeneities1. Strongly metal-rich zone near central stars couldgive rise to observed spectra – ruled out byspatially-resolved analysis2. Small metal-rich knots (too small to be directlyresolved), cooled strongly by high metal content
PN: Abell 30NGC 1501Abell 30
Knots: Abell 30• Results of empirical analysis:T([O III]) ~16000 KT(He I) ~500010000 KT(O II)
HST imaging
Conclusions• Cold H-deficient knots are confirmed as existing inplanetary nebulae• Simple temperature fluctuations are ruled out fromspatially resolved spectroscopy• Evidence strongly suggests existence of cold metalrichknots in most planetary nebulae.
Open questions• No direct observations in vast majority of cases. Wheredid the knots come from? Why are they there?• What is their distribution?• What is overall chemical content of PNe?


