The efficiency of contraction in rabbit skeletal muscle fibres ...
The efficiency of contraction in rabbit skeletal muscle fibres ...
The efficiency of contraction in rabbit skeletal muscle fibres ...

Create successful ePaper yourself
Turn your PDF publications into a flip-book with our unique Google optimized e-Paper software.
J. Physiol. 517.3 Efficiency <strong>of</strong> <strong>muscle</strong> <strong>contraction</strong><br />
849<br />
shorten<strong>in</strong>g was 3·6-fold greater than dur<strong>in</strong>g isometric<br />
<strong>contraction</strong>. <strong>The</strong>re was no evidence <strong>of</strong> a decrease <strong>in</strong> ATPase<br />
rate at high shorten<strong>in</strong>g velocities. A hyperbola is shown<br />
through the data to describe the relationship (see legend to<br />
Fig. 8).<br />
Efficiency <strong>of</strong> <strong>muscle</strong> <strong>contraction</strong><br />
<strong>The</strong> ratio <strong>of</strong> power output to the energy released by ATP<br />
hydrolysis is shown <strong>in</strong> Fig. 9, us<strong>in</strong>g 50 kJ mol¢ for the free<br />
energy <strong>of</strong> ATP hydrolysis (Kushmerick & Davies, 1969;<br />
Woledge et al. 1985). This value was obta<strong>in</strong>ed from the free<br />
energy <strong>of</strong> phosphocreat<strong>in</strong>e breakdown <strong>in</strong> <strong>muscle</strong> under <strong>in</strong><br />
vivo conditions, and may be lower than the correct value for<br />
ourexperimentalconditionswherePéconcentrationislow.<br />
Efficiency was zero where no work was performed, namely<br />
dur<strong>in</strong>g isometric <strong>contraction</strong> or shorten<strong>in</strong>g at zero load.<br />
Us<strong>in</strong>g the hyperbolic fit shown <strong>in</strong> Fig. 8, and the<br />
relationship for power output derived from Hill’s force—<br />
velocity curve, a mean <strong>efficiency</strong> curve was calculated. This<br />
is shown as the cont<strong>in</strong>uous l<strong>in</strong>e <strong>in</strong> Fig. 9. From this curve, a<br />
maximal <strong>efficiency</strong> <strong>of</strong> 0·36 was derived at a shorten<strong>in</strong>g<br />
velocity <strong>of</strong> 0·27 ML s¢, correspond<strong>in</strong>g to PÏPï = 0·51.<br />
Effect <strong>of</strong> temperature and sarcomere length on the<br />
ATPase rate constant <strong>in</strong> the first turnover<br />
<strong>The</strong> ATPase rate constant measured after the photolytic<br />
release <strong>of</strong> ATP has been found to decrease with time (He et<br />
al. 1997) and with the amount <strong>of</strong> ATP hydrolysed (He et al.<br />
1998b). <strong>The</strong> decrease was found to be affected by the<br />
sarcomerelength,s<strong>in</strong>ce<strong>in</strong>experimentsatlongsarcomere<br />
length the ATPase rate appears to reach a relatively<br />
Figure 7. Relationship between the power output and<br />
the applied shorten<strong>in</strong>g velocity<br />
<strong>The</strong> power output was obta<strong>in</strong>ed by multiply<strong>in</strong>g the average<br />
force dur<strong>in</strong>g the shorten<strong>in</strong>g period by the average shorten<strong>in</strong>g<br />
velocity. <strong>The</strong> power (W) is force (N) ² velocity (m s¢). Here<br />
we used force <strong>in</strong> kN m¦Â and shorten<strong>in</strong>g velocity <strong>in</strong> ML s¢,<br />
where ML had dimensions <strong>of</strong> reciprocal length, so that power<br />
was kN m¦Â ² m¢ s¢, or kN m¦Å s¢, correspond<strong>in</strong>g to<br />
N l¢ s¢, namely W l¢. <strong>The</strong> cont<strong>in</strong>uous l<strong>in</strong>e was calculated<br />
fromthevalues<strong>of</strong>aÏPïandbobta<strong>in</strong>ed from the fit to the<br />
force—velocity relationship <strong>in</strong> Fig. 6.<br />
Figure 8. Relationship between the ATPase rate<br />
constant and the applied shorten<strong>in</strong>g velocity<br />
<strong>The</strong> ATPase rate constant was obta<strong>in</strong>ed from the gradient <strong>of</strong><br />
the fluorescence signal dur<strong>in</strong>g the shorten<strong>in</strong>g period, as<br />
described for Fig. 1, and was divided by the mean active site<br />
concentration dur<strong>in</strong>g the shorten<strong>in</strong>g phase, namely<br />
0·145 mÒ. <strong>The</strong>se data are shown as the filled circles. <strong>The</strong><br />
square symbol at a shorten<strong>in</strong>g velocity <strong>of</strong> zero was the mean<br />
rate constant obta<strong>in</strong>ed for the nom<strong>in</strong>ally isometric phase<br />
immediately prior to the shorten<strong>in</strong>g phase (5·1 ± 0·2 s¢,<br />
n = 41). <strong>The</strong> error bars are shown <strong>in</strong>side the square symbol.<br />
<strong>The</strong>cont<strong>in</strong>uousl<strong>in</strong>eisthebestfit<strong>of</strong>thedatatoahyperbola<br />
correspond<strong>in</strong>g to the equation:<br />
Y = 5·1 + 18·7 ² 1·94 ² VÏ(1 + 1·94 ² V),<br />
where V is the applied shorten<strong>in</strong>g velocity <strong>in</strong> ML s¢, 5·1 s¢<br />
is the ATPase rate constant <strong>in</strong> the isometric state and<br />
18·7 s¢ is the ATPase rate constant above that <strong>in</strong> the<br />
isometric state for shorten<strong>in</strong>g at <strong>in</strong>f<strong>in</strong>ite velocity.<br />
Downloaded from J Physiol (<br />
jp.physoc.org)<br />
by guest on March 5, 2013<br />
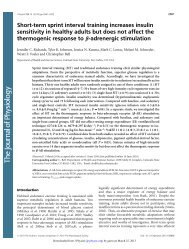
Figure 9. Relationship between the <strong>efficiency</strong> <strong>of</strong><br />
<strong>contraction</strong> and the applied shorten<strong>in</strong>g velocity<br />
<strong>The</strong> <strong>efficiency</strong> <strong>of</strong> <strong>contraction</strong> is the ratio <strong>of</strong> energy output and<br />
energy <strong>in</strong>put. Energy output (<strong>in</strong> W l¢) is the data shown <strong>in</strong><br />
Fig. 7. Energy <strong>in</strong>put is the ATP consumed (<strong>in</strong> mÒ s¢)<br />
multiplied by the free energy <strong>of</strong> hydrolysis (50 kJ mol¢). <strong>The</strong><br />
energy <strong>in</strong>put can be converted from the data shown <strong>in</strong> Fig. 8<br />
by multiply<strong>in</strong>g the rate constant by the mean active site<br />
concentration <strong>of</strong> 0·145 mÒ. <strong>The</strong> cont<strong>in</strong>uous l<strong>in</strong>e is that<br />
calculated by obta<strong>in</strong><strong>in</strong>g the ratio <strong>of</strong> the calculated<br />
relationships <strong>in</strong> Figs 7 and 8. From the cont<strong>in</strong>uous l<strong>in</strong>e, a<br />
maximal <strong>efficiency</strong> <strong>of</strong> 0·36 is obta<strong>in</strong>ed at 0·27 ML s¢,<br />
correspond<strong>in</strong>g to PÏPï = 0·51.