Protein Structure Models for Determining Protein Structure ... - Ecet
Protein Structure Models for Determining Protein Structure ... - Ecet
Protein Structure Models for Determining Protein Structure ... - Ecet

You also want an ePaper? Increase the reach of your titles
YUMPU automatically turns print PDFs into web optimized ePapers that Google loves.
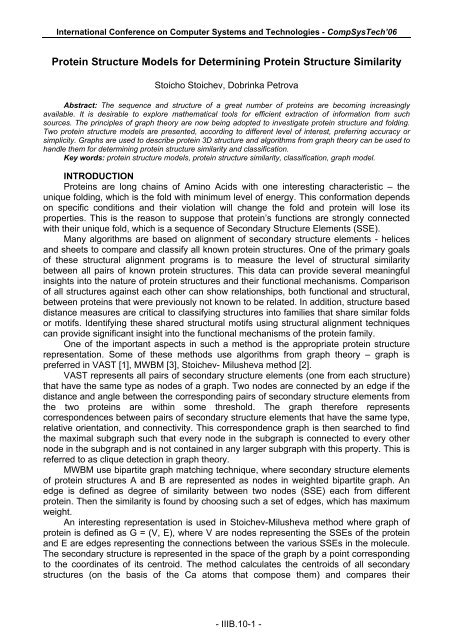
International Conference on Computer Systems and Technologies - CompSysTech’06<strong>Protein</strong> <strong>Structure</strong> <strong>Models</strong> <strong>for</strong> <strong>Determining</strong> <strong>Protein</strong> <strong>Structure</strong> SimilarityStoicho Stoichev, Dobrinka PetrovaAbstract: The sequence and structure of a great number of proteins are becoming increasinglyavailable. It is desirable to explore mathematical tools <strong>for</strong> efficient extraction of in<strong>for</strong>mation from suchsources. The principles of graph theory are now being adopted to investigate protein structure and folding.Two protein structure models are presented, according to different level of interest, preferring accuracy orsimplicity. Graphs are used to describe protein 3D structure and algorithms from graph theory can be used tohandle them <strong>for</strong> determining protein structure similarity and classification.Key words: protein structure models, protein structure similarity, classification, graph model.INTRODUCTION<strong>Protein</strong>s are long chains of Amino Acids with one interesting characteristic – theunique folding, which is the fold with minimum level of energy. This con<strong>for</strong>mation dependson specific conditions and their violation will change the fold and protein will lose itsproperties. This is the reason to suppose that protein’s functions are strongly connectedwith their unique fold, which is a sequence of Secondary <strong>Structure</strong> Elements (SSE).Many algorithms are based on alignment of secondary structure elements - helicesand sheets to compare and classify all known protein structures. One of the primary goalsof these structural alignment programs is to measure the level of structural similaritybetween all pairs of known protein structures. This data can provide several meaningfulinsights into the nature of protein structures and their functional mechanisms. Comparisonof all structures against each other can show relationships, both functional and structural,between proteins that were previously not known to be related. In addition, structure baseddistance measures are critical to classifying structures into families that share similar foldsor motifs. Identifying these shared structural motifs using structural alignment techniquescan provide significant insight into the functional mechanisms of the protein family.One of the important aspects in such a method is the appropriate protein structurerepresentation. Some of these methods use algorithms from graph theory – graph ispreferred in VAST [1], MWBM [3], Stoichev- Milusheva method [2].VAST represents all pairs of secondary structure elements (one from each structure)that have the same type as nodes of a graph. Two nodes are connected by an edge if thedistance and angle between the corresponding pairs of secondary structure elements fromthe two proteins are within some threshold. The graph there<strong>for</strong>e representscorrespondences between pairs of secondary structure elements that have the same type,relative orientation, and connectivity. This correspondence graph is then searched to findthe maximal subgraph such that every node in the subgraph is connected to every othernode in the subgraph and is not contained in any larger subgraph with this property. This isreferred to as clique detection in graph theory.MWBM use bipartite graph matching technique, where secondary structure elementsof protein structures A and B are represented as nodes in weighted bipartite graph. Anedge is defined as degree of similarity between two nodes (SSE) each from differentprotein. Then the similarity is found by choosing such a set of edges, which has maximumweight.An interesting representation is used in Stoichev-Milusheva method where graph ofprotein is defined as G = (V, E), where V are nodes representing the SSEs of the proteinand E are edges representing the connections between the various SSEs in the molecule.The secondary structure is represented in the space of the graph by a point correspondingto the coordinates of its centroid. The method calculates the centroids of all secondarystructures (on the basis of the Ca atoms that compose them) and compares their- IIIB.10-1 -
International Conference on Computer Systems and Technologies - CompSysTech’06coordinates. These two protein graphs are compared to see if they share commonfeatures by largest common subgraph detection algorithm.NEW PROPOSALS FOR PROTEIN STRUCTURE MODELSPreviously discussed alignment algorithms evaluate distance between SSEs to becompared. In this situation one of the most important problems to solve is to definecorrectly the end points of that distance and the way of computing it as a value. Decisions<strong>for</strong> end points can be centroids[2] or other equivalent points from two elements, whichsatisfy some requirements. No matter which of those are used <strong>for</strong> presenting the SSEs allthey have a little disadvantage– they present sequence of points with one point. When thesequence is a chain of Amino Acids, the problem is harder to solve, because the chain israndomly folded, due to the chemical characteristics of the protein as a molecule.Two different protein structure models are proposed here as ways of protein structurerepresentation. Both of them use graph and aim to overcome distance-computing problem.Approaches to solve this problem can be:• to avoid distance-computing when model is constructed;• to evaluate distance between Cα atoms of all Amino Acids which construct thechain, but not between SSEs as a whole.The choice <strong>for</strong> one of those approaches is made according our level of interest, which canbe defined as:• Low level is the one at which constructed models aim to reduce the complexityin protein structure representation and avoid distance computing. These modelscan be used as fast filters to determine if two structures could be similar and <strong>for</strong>classification of proteins in families.• High level – here the accuracy of the model is preferred to its simplicity. <strong>Models</strong>at high level of interest use second approach and could be applied to obtainmore precise results in protein structure comparison.Model at low level of interestThe rule, which governs here, states, that the sequence of secondary structureelements is sufficient to define fold, when at least one SSE is a sheet. Number of visits <strong>for</strong>each SSE is the one parameter in this model. Number of visits, greater than 1, can bereached <strong>for</strong> nodes, representing SSE sheet. The explanation <strong>for</strong> this situation is thatsheets consist of strands. The strands in one sheet could be arranged non sequential.When Amino Acids sequence ‘starts’ a sheet (i.e. makes a strand/strands), but ‘runs’to another sheet or helix and then ‘turns’ back to this unfinished sheet, number of visits ofthe node, representing this sheet is greater than 1.Fig. 1 Sequence of strands in sheets and helix in HIV Type 1Fig.1 shows the sequence of sheets with their strands and helix in structure of HumanImmunodeficiency Virus Type 1. Sequence of that protein starts with second and then firststrand of the first sheet, followed by first and second strand of second sheet, next are thirdand <strong>for</strong>th strand of first sheet, third strand of second sheet and at the end is one helix.- IIIB.10-2 -
International Conference on Computer Systems and Technologies - CompSysTech’06The number of nodes in graph can be further reduced with additional rules:• All strands in sheet are represented by a single node, holding number of thesheet;• Node can represent a single helix or uninterrupted sequence of helices.Fig. 2 Graph Model of HIV Type 1Resulting graph model of HumanImmunodeficiency Virus Type 1 is shown inFig.2.Number of helices: 1- H1;Number of sheets: 2 – S1 and S2;Numbers above each edge defines numberof visits, if there is not a number – this edgeis used only once.Results from the model at low level of interestTargets in this research are different virus proteins, toxins, oxygen-transport proteins,electron transport proteins and blood coagulation proteins. Different virus proteins andtheir graph models are presented here.Starting point <strong>for</strong> the model is the in<strong>for</strong>mation in PDB files, end- resulting graph with allrules <strong>for</strong> its construction. Resulting graphs are small and easy to compare, which isimportant, when the aim is fast comparison. This graph model has one significantadvantage- allows protein from PDB to be checked <strong>for</strong> similarity with already constructedgraph models without constructing the graph model of the new protein. In such case, whenthe purpose is only to conclude if a protein from PDB is similar to a protein withconstructed graph model the sequence of SSEs from PDB file can test if it could begenerated by walking through the graph model.BENCE-JONES IMMUNOGLOBULIN REIVARIABLE PORTION, T39K MUTANTType: VIRUS/VIRAL PROTEINNumber of helices: 1- H1;Number of sheets: 2 – S1 and S2;Fig.3 Graph model of Bence-JonesImmunoglobulinFig.4 Graph model of Foot-And-MouthDisease VirusFOOT-AND-MOUTH DISEASE VIRUS/OLIGOSACCHARIDE RECEPTORType: VIRUS/VIRAL PROTEINNumber of helices: 5- H123 and H45;Number of sheet: 3 – S1, S2 and S3;Rule 2 is applied here <strong>for</strong> low level of interestalgorithm – helices H1, H2 and H3 composeuninterrupted chain of helices, so they arecombined in one node.- IIIB.10-3 -
International Conference on Computer Systems and Technologies - CompSysTech’06Fig. 5 Graph Model of HUMANADENOVIRUS SEROTYPE 2HUMAN ADENOVIRUS SEROTYPE 2FIBRE HEADType: VIRUS/VIRAL PROTEINNumber of helices: 5- H1, H2, H34 and H5;Number of sheets: 2 – S1 and S2;Rule 2 is applied here <strong>for</strong> low level ofinterest algorithm too – helices H3 and H4compose uninterrupted chain of helices, sothey are combined in one node.Graph models, constructed <strong>for</strong> virusproteins (Fig. 2, Fig. 3, Fig. 4 and Fig. 5) canbe compared, using algorithms from graphtheory. Results from comparison of allknown virus proteins could be suitable basisto find out some rules <strong>for</strong> their secondarystructure composition and <strong>for</strong> structure-based functional analysis.Model at high level of interest<strong>Protein</strong> structure model at high level is used, when precise model is necessary. Whenthe accuracy is important characteristic of the representation, evaluation of distances couldbe hardly ignored. To avoid inaccurate evaluation of distances between SSEs secondapproach is applied - SSEs are presented with all Amino Acids, which compose them. Asa result in the model at high level of interest nodes are Amino Acids, presented with theirCα atoms. There are some different points of view to define the edges. The decision tomake here is whether to connect sequence neighbors (Fig.6) Amino Acids or not andwhether to take care of spatial neighbors, which belong to one SSE. After building andanalyzing different models to limit the complexity sequence neighbors are excluded fromrules, which define edges. Edges in the model are between spatial neighbors.Fig.6 A schematicrepresentation of thesequential and spatialneighbors of a Amino Acid iA distance threshold is taken and Amino Acids withCα, which fall within the sphere with threshold as aradius are spatial neighbors of Amino Acid i.Edges in the model are defined according the rules:There is an edge between two nodes if1. The nodes represent two Amino Acids fromdifferent structure elements; and2. The nodes represent two Amino Acids,which are spatial neighbors, i.e. thedistance between them is below giventhreshold.Equation (1) is used to evaluate the distance betweenCα atoms of Amino Acids x and y from different SSEs.D(x,y)=∑ ( x i− y i)Fig. 7 shows graph models <strong>for</strong> HIV Type 1resulting from different distance threshold andincluding or excluding rule 1 <strong>for</strong> edge definition. Spatial neighbors from different SSEscan’t be captured with distance threshold 10A. Fig. 7(a) shows graph model with spatialneighbors within one SSE. When threshold is 15A graph model construction could includerule 1 from edge definition – Fig.7(c), or exclude it – Fig. 7(b). Resulting graphs <strong>for</strong> twoNi=12(1)- IIIB.10-4 -
International Conference on Computer Systems and Technologies - CompSysTech’06proteins can be compared to see if they share common features by graph isomorphismdetection methods.(a) distance– 10 A, rule 2 (b) distance– 15 A, rule 2 (c) distance– 15 AFig. 7 Adjacency matrices of graph models of HIV Type 1; (a) all spatial neighbors anddistance 10 A; (b) all spatial neighbors and distance 15 A; (c) spatial neighbors fromdifferent SSEs and distance 15 ATable1 shows results <strong>for</strong> graph models of HIV Type 1 constructed with MWBM,STOICHEV-MILUSHEVA method and current method- low level of interest and high levelof interest. Numbers of nodes and numbers of edges are compared as elements in theresulting models. Number of nodes and number of edges in graph model, constructed byMWBM technique can’t be defined without knowing the value of n, where n is the numberof SSEs of the protein, which will be compared with HIV Type 1. This technique doesn’tallow constructing a model <strong>for</strong> a single protein, but only <strong>for</strong> two proteins to be compared. Ifparameter n = 0, number of nodes and edges will define part of the model, thatcorresponds to representation of HIV Type 1. Stoichev- Milusheva method and currentmethod at low level of interest produce similar results as number of nodes and edges, butcurrent method has an advantage- it decreases the complexity in graph modelconstruction by avoiding distance computing. Nodes and edges in model at high level ofinterest are many in number in accordance with high precision and accuracy of the model.Table 1 - number of nodes and edges of graph model of HIV Type 1NumberofnodesNumberofedgesMWBMSTOICHEV-MILUSHEVAMETHODCURRENT METHOD-LOW LEVEL OFINTERESTHIGH LEVEL OFINTEREST- FIG 7(A)3 + n3 3 433 nDepends onprecision5 182CONCLUSIONS AND FUTURE WORKTwo models of protein structure are presented, depending on level of interest. Theserepresentations are suitable <strong>for</strong> further work on constructing algorithms <strong>for</strong> proteinstructure similarity detection and classifying proteins in families, superfamilies and classes.Usage of light representation (model at low level) reduces the number of nodes and rules,- IIIB.10-5 -
International Conference on Computer Systems and Technologies - CompSysTech’06associated with edges, so the resulting graphs can be easy compared. The effect ofapplying the rules <strong>for</strong> reducing nodes of the model will be further analyzed. Model at lowlevel of interest has as an advantage its simplicity, while model at high level of interestaccentuate to accuracy of the result. <strong>Protein</strong> structure graph models at high level ofinterest will be analyzed <strong>for</strong> determining optimal distance threshold and appropriate rules<strong>for</strong> edge definition.As <strong>for</strong> comparison with other methods, mentioned above, here is some statistics <strong>for</strong>number or nodes and edges <strong>for</strong> different methods. When parameter n = 0, values <strong>for</strong>number of nodes and edges are <strong>for</strong> part of the model, corresponding to a single protein.Table 2 - number of nodes of graph modelsG1 (Fig.2)G2 (Fig.3)G3 (Fig.4)G4 (Fig.5)MWBG STOICHEV/MILUSHEVAMETHODCURRENT METHOD-LOW LEVEL3 + n3 33 + n3 38 + n8 57 + n7 6Table 3 - number of edges of graph modelsG1 (Fig.2)G2 (Fig.3)G3 (Fig.4)G4 (Fig.5)MBGM STOICHEV/MILUSHEVAMETHODCURRENTMETHOD – LOW LEVEL3 nDepends on precision 53 nDepends on precision 68 nDepends on precision 87 nDepends on precision 10REFERENCES[1] Gibrat, J.F., Madel, T., and Bryant, S.H. (1996) Surprising similarities in structurecomparison. Curr. Opin. Struct. Biol., 6, 377-385.[2] Stoichev.St., Milusheva,Il.- private communication[3] Wang, Y., Makedon, F., Ford, J. A Bipartite Graph Matching Framework <strong>for</strong>Finding Correspondences between Structural Elements in Two <strong>Protein</strong>s. In Proceedings ofthe 26th Annual International Conference of the IEEE Engineering in Medicine and BiologySociety, pages 2972-2975, San Francisco, Cali<strong>for</strong>nia, 2004ABOUT THE AUTHORSProf. Doctor of Technical Sciences Stoicho D. Stoichev, Department of ComputerSystems, Technical University at Sofia, Phone: +359 965 33 85 , Е-mail: stoi@tu-sofia.bgPhD student Dobrinka Petrova, Department of Computer Systems, TechnicalUniversity at Sofia, branch Plovdiv, Phone: +359 32 659 704, E-mail:d_petrova2000@yahoo.com- IIIB.10-6 -