The Brief Symptom Inventory (BSI) - Service correctionnel du Canada
The Brief Symptom Inventory (BSI) - Service correctionnel du Canada
The Brief Symptom Inventory (BSI) - Service correctionnel du Canada

You also want an ePaper? Increase the reach of your titles
YUMPU automatically turns print PDFs into web optimized ePapers that Google loves.
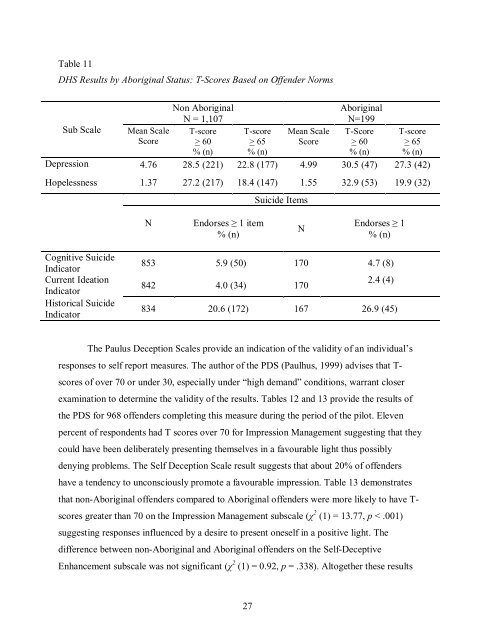
Table 11<br />
DHS Results by Aboriginal Status: T-Scores Based on Offender Norms<br />
Non Aboriginal<br />
Aboriginal<br />
N = 1,107<br />
N=199<br />
Sub Scale Mean Scale T-score T-score Mean Scale T-Score T-score<br />
Score > 60 > 65 Score > 60 > 65<br />
% (n) % (n)<br />
% (n) % (n)<br />
Depression 4.76 28.5 (221) 22.8 (177) 4.99 30.5 (47) 27.3 (42)<br />
Hopelessness 1.37 27.2 (217) 18.4 (147) 1.55 32.9 (53) 19.9 (32)<br />
Cognitive Suicide<br />
Indicator<br />
Current Ideation<br />
Indicator<br />
Historical Suicide<br />
Indicator<br />
N<br />
Endorses ≥ 1 item<br />
% (n)<br />
27<br />
Suicide Items<br />
N<br />
Endorses ≥ 1<br />
% (n)<br />
853 5.9 (50) 170 4.7 (8)<br />
842 4.0 (34) 170<br />
2.4 (4)<br />
834 20.6 (172) 167 26.9 (45)<br />
<strong>The</strong> Paulus Deception Scales provide an indication of the validity of an indivi<strong>du</strong>al’s<br />
responses to self report measures. <strong>The</strong> author of the PDS (Paulhus, 1999) advises that T-<br />
scores of over 70 or under 30, especially under “high demand” conditions, warrant closer<br />
examination to determine the validity of the results. Tables 12 and 13 provide the results of<br />
the PDS for 968 offenders completing this measure <strong>du</strong>ring the period of the pilot. Eleven<br />
percent of respondents had T scores over 70 for Impression Management suggesting that they<br />
could have been deliberately presenting themselves in a favourable light thus possibly<br />
denying problems. <strong>The</strong> Self Deception Scale result suggests that about 20% of offenders<br />
have a tendency to unconsciously promote a favourable impression. Table 13 demonstrates<br />
that non-Aboriginal offenders compared to Aboriginal offenders were more likely to have Tscores<br />
greater than 70 on the Impression Management subscale (χ 2 (1) = 13.77, p < .001)<br />
suggesting responses influenced by a desire to present oneself in a positive light. <strong>The</strong><br />
difference between non-Aboriginal and Aboriginal offenders on the Self-Deceptive<br />
Enhancement subscale was not significant (χ 2 (1) = 0.92, p = .338). Altogether these results