Unit 4 MSG Central Tendencies - Cobb Learning
Unit 4 MSG Central Tendencies - Cobb Learning
Unit 4 MSG Central Tendencies - Cobb Learning

You also want an ePaper? Increase the reach of your titles
YUMPU automatically turns print PDFs into web optimized ePapers that Google loves.
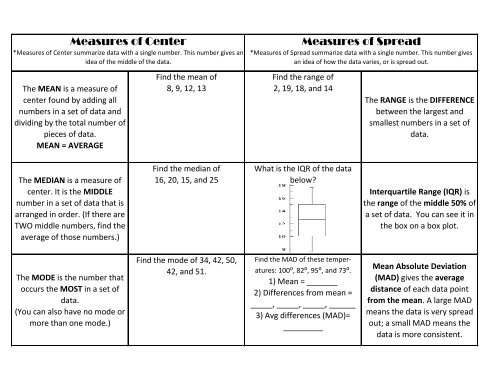
Measures of Center*Measures of Center summarize data with a single number. This number gives anidea of the middle of the data.Measures of Spread*Measures of Spread summarize data with a single number. This number givesan idea of how the data varies, or is spread out.The MEAN is a measure ofcenter found by adding allnumbers in a set of data anddividing by the total number ofpieces of data.MEAN = AVERAGEFind the mean of8, 9, 12, 13Find the range of2, 19, 18, and 14The RANGE is the DIFFERENCEbetween the largest andsmallest numbers in a set ofdata.The MEDIAN is a measure ofcenter. It is the MIDDLEnumber in a set of data that isarranged in order. (If there areTWO middle numbers, find theaverage of those numbers.)Find the median of16, 20, 15, and 25What is the IQR of the databelow?Interquartile Range (IQR) isthe range of the middle 50% ofa set of data. You can see it inthe box on a box plot.The MODE is the number thatoccurs the MOST in a set ofdata.(You can also have no mode ormore than one mode.)Find the mode of 34, 42, 50,42, and 51.Find the MAD of these temperatures:100⁰, 82⁰, 95⁰, and 73⁰.1) Mean = _______2) Differences from mean =_____, _____, _____, ______3) Avg differences (MAD)=_________Mean Absolute Deviation(MAD) gives the averagedistance of each data pointfrom the mean. A large MADmeans the data is very spreadout; a small MAD means thedata is more consistent.
Glue or tape this piece onto your <strong>MSG</strong>! :)Cut the flaps below and fold them over the other side.RangEMeanIQRMADGlue or tape this piece onto your <strong>MSG</strong>! :)MedianModeModeMode