JMET 2009 - Testfunda
JMET 2009 - Testfunda
JMET 2009 - Testfunda

Create successful ePaper yourself
Turn your PDF publications into a flip-book with our unique Google optimized e-Paper software.
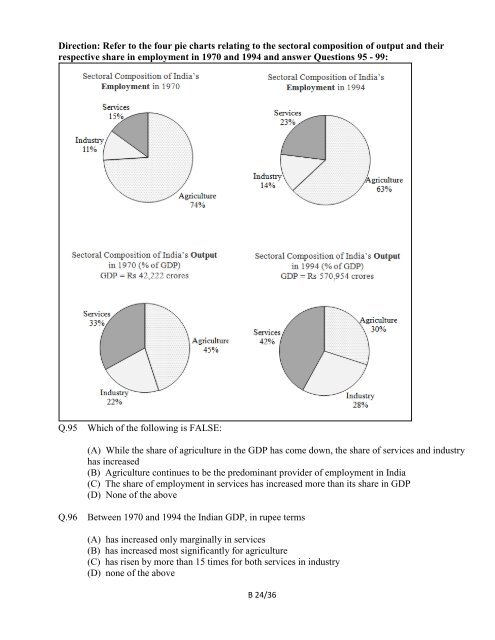
Direction: Refer to the four pie charts relating to the sectoral composition of output and their<br />
respective share in employment in 1970 and 1994 and answer Questions 95 - 99:<br />
Q.95 Which of the following is FALSE:<br />
(A) While the share of agriculture in the GDP has come down, the share of services and industry<br />
has increased<br />
(B) Agriculture continues to be the predominant provider of employment in India<br />
(C) The share of employment in services has increased more than its share in GDP<br />
(D) None of the above<br />
Q.96 Between 1970 and 1994 the Indian GDP, in rupee terms<br />
(A) has increased only marginally in services<br />
(B) has increased most significantly for agriculture<br />
(C) has risen by more than 15 times for both services in industry<br />
(D) none of the above<br />
B 24/36