JMET 2009 - Testfunda
JMET 2009 - Testfunda
JMET 2009 - Testfunda

Create successful ePaper yourself
Turn your PDF publications into a flip-book with our unique Google optimized e-Paper software.
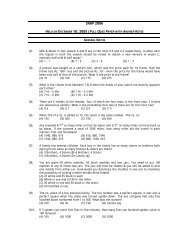
Q.97 Between 1970 and 1994 the GDP of India in agriculture<br />
(A) decreased by 15%<br />
(B) increased by about 9 times<br />
(C) cannot be calculates based on the data given<br />
(D) none of the above<br />
Q.98 In 1970 the contribution to GDP from services in rupee terms was<br />
(A) less than Rs. 10,000 crores<br />
(B) more than Rs. 15,000 crores<br />
(C) between Rs. 10,000 and 15,000 crores<br />
(D) none of the above<br />
Q.99 In 1994 if the share of industry in output (GDP) was 30 % instead of 28 %, then in rupee terms,<br />
it would have been<br />
(A) less than Rs. 100,000 crores<br />
(B) more than Rs. 200,000 crores<br />
(C) more than Rs. 150,000 crores<br />
(D) between Rs. 100,000 and 150,000 crores<br />
Direction: Questions 100- 140 are based on the following information:<br />
Foreign Direct Investment Flows<br />
Outflows (Area of Origin) Inflows (Destination)<br />
Year 1970 1980 1990 1970 1980 1990<br />
High Income Countries (FDI as a percentage of total)<br />
USA 46 21 21.8 11.2 30 20<br />
Europe 42.5 51.6 44.6 43.8 35.6 38.8<br />
Japan 5.4 14 5.4 0.6 0.5 0.6<br />
Oceania 1 2.2 1 6 4.8 2.4<br />
Total 94.9 88.8 72.8 61.6 70.9 61.9<br />
Developing and Transition Countries (FDI as a percentage of total)<br />
Latin America 0.5 1 2.2 12.8 9 11<br />
Africa 0.4 1.5 0.5 4.5 2.5 1.8<br />
Asia 0.5 3.8 9.5 6.6 13 18.6<br />
Eastern<br />
0 0 0.4 0 0.5 3<br />
Europe<br />
Total 1.2 6.3 12.6 23.9 25 34.4<br />
World (In billion dollars)<br />
FDI 23.7 124.4 523.3 21 113.9 530.2<br />
Q.100 Amongst all the high income countries, the region / country which has the maximum share in<br />
FDI flows is<br />
(A) U.S.A (B) Europe (C) Japan (D) Oceania<br />
B 25/36