Memento on EViews Output - Jonathan Benchimol
Memento on EViews Output - Jonathan Benchimol
Memento on EViews Output - Jonathan Benchimol

You also want an ePaper? Increase the reach of your titles
YUMPU automatically turns print PDFs into web optimized ePapers that Google loves.
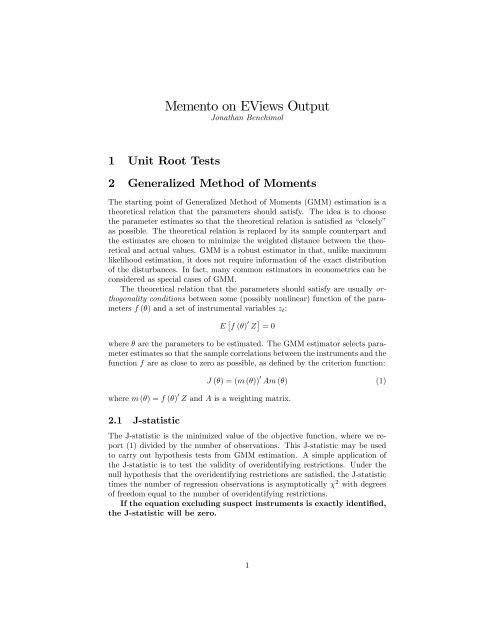
<str<strong>on</strong>g>Memento</str<strong>on</strong>g> <strong>on</strong> <strong>EViews</strong> <strong>Output</strong>J<strong>on</strong>athan <strong>Benchimol</strong>1 Unit Root Tests2 Generalized Method of MomentsThe starting point of Generalized Method of Moments (GMM) estimati<strong>on</strong> is atheoretical relati<strong>on</strong> that the parameters should satisfy. The idea is to choosethe parameter estimates so that the theoretical relati<strong>on</strong> is satisfied as “closely”as possible. The theoretical relati<strong>on</strong> is replaced by its sample counterpart andthe estimates are chosen to minimize the weighted distance between the theoreticaland actual values. GMM is a robust estimator in that, unlike maximumlikelihood estimati<strong>on</strong>, it does not require informati<strong>on</strong> of the exact distributi<strong>on</strong>of the disturbances. In fact, many comm<strong>on</strong> estimators in ec<strong>on</strong>ometrics can bec<strong>on</strong>sidered as special cases of GMM.The theoretical relati<strong>on</strong> that the parameters should satisfy are usually orthog<strong>on</strong>alityc<strong>on</strong>diti<strong>on</strong>s between some (possibly n<strong>on</strong>linear) functi<strong>on</strong> of the parametersf (θ) and a set of instrumental variables z t :E [ f (θ) ′ Z ] = 0where θ are the parameters to be estimated. The GMM estimator selects parameterestimates so that the sample correlati<strong>on</strong>s between the instruments and thefuncti<strong>on</strong> f are as close to zero as possible, as defined by the criteri<strong>on</strong> functi<strong>on</strong>:where m (θ) = f (θ) ′ Z and A is a weighting matrix.2.1 J-statisticJ (θ) = (m (θ)) ′ Am (θ) (1)The J-statistic is the minimized value of the objective functi<strong>on</strong>, where we report(1) divided by the number of observati<strong>on</strong>s. This J-statistic may be usedto carry out hypothesis tests from GMM estimati<strong>on</strong>. A simple applicati<strong>on</strong> ofthe J-statistic is to test the validity of overidentifying restricti<strong>on</strong>s. Under thenull hypothesis that the overidentifying restricti<strong>on</strong>s are satisfied, the J-statistictimes the number of regressi<strong>on</strong> observati<strong>on</strong>s is asymptotically χ 2 with degreesof freedom equal to the number of overidentifying restricti<strong>on</strong>s.If the equati<strong>on</strong> excluding suspect instruments is exactly identified,the J-statistic will be zero.1
2.2 Coeffi cient of Determinati<strong>on</strong>The Coeffi cient of determinati<strong>on</strong> (R 2 ) is a statistic that will give some informati<strong>on</strong>about the goodness of fit of a model. In regressi<strong>on</strong>, the coeffi cient ofdeterminati<strong>on</strong> is a statistical measure of how well the regressi<strong>on</strong> line approximatesthe real data points. An R 2 of 1.0 indicates that the regressi<strong>on</strong> lineperfectly fits the data.2.3 Adjusted Coeffi cient of Determinati<strong>on</strong>The Adjusted Coeffi cient of Determinati<strong>on</strong> (Adjusted R 2 ) is a modificati<strong>on</strong> ofR 2 that adjusts for the number of explanatory terms in a model. Unlike R 2 ,the Adjusted R 2 increases <strong>on</strong>ly if the new term improves the model more thanwould be expected by chance. The Adjusted R 2 can be negative (in very poorlyspecified regressi<strong>on</strong> equati<strong>on</strong>s.), and will always be less than or equal to R 2 .Adjusted R 2 does not have the same interpretati<strong>on</strong> as R 2 . As such, care mustbe taken in interpreting and reporting this statistic. Adjusted R 2 is particularlyuseful in the feature selecti<strong>on</strong> stage of model building. Adjusted R 2 is not alwaysbetter than R 2 : adjusted R 2 will be more useful <strong>on</strong>ly if the R 2 is calculated based<strong>on</strong> a sample, not the entire populati<strong>on</strong>. For example, if our unit of analysis isa state, and we have data for all counties, then Adjusted R 2 will not yield anymore useful informati<strong>on</strong> than R 2 .2.4 Mean Dependent VariableThe value of the Mean dependent variable is the mean of the observati<strong>on</strong>s ofthe dependent variable.2.5 S.D. Dependent VariableThe value of the S.D. dependent variable is the estimated standard deviati<strong>on</strong> ofthe dependent variable.2.6 S.E. of Regressi<strong>on</strong>The S.E. of Regressi<strong>on</strong> is a summary measure of the size of the equati<strong>on</strong>’serrors. The unbiased estimate of it is calculated as the square root of thesum of squared residuals divided by the number of usable observati<strong>on</strong>s minusthe number of regressors (including the c<strong>on</strong>stant). This measure should becloser to zero.2.7 Sum of Squared ResidualThe residual sum of squares (RSS) is the sum of squares of residuals. It isthe discrepancy between the data and our estimati<strong>on</strong> model. As smaller thisdiscrepancy is, better our estimati<strong>on</strong> will be.2
2.8 Prob(F-statistic)To test the success of the regressi<strong>on</strong> model, a test can be performed <strong>on</strong> R 2 . Usually,we accept that the regressi<strong>on</strong> model is useful when the Prob(Fstatistic)is smaller than the desired significance level, for example0.05 (for 5% significance level).2.9 Durbin-Wats<strong>on</strong> statisticThe Durbin-Wats<strong>on</strong> statistic is a test statistic used to detect the presence ofautocorrelati<strong>on</strong> in the residuals from a regressi<strong>on</strong> analysis. Its value always liesbetween 0 and 4.A value of 2 indicates there appears to be no autocorrelati<strong>on</strong>. If the Durbin-Wats<strong>on</strong> statistic is substantially less than 2, there is evidence of positive serialcorrelati<strong>on</strong> and values much above 2 are indicative of negative serial correlati<strong>on</strong>.As a rough rule of thumb, if Durbin-Wats<strong>on</strong> statistic is less than 1.0, there maybe cause for alarm. Small values of Durbin-Wats<strong>on</strong> statistic indicate successiveerror terms are, <strong>on</strong> average, close in value to <strong>on</strong>e another, or positively correlated.Large values of Durbin-Wats<strong>on</strong> statistic indicate successive error termsare, <strong>on</strong> average, much different in value to <strong>on</strong>e another, or negatively correlated.How much below or above 2 is required for significance depends <strong>on</strong> the numberof usable observati<strong>on</strong>s and the number of independent variables (excluding thec<strong>on</strong>stant).The Durbin-Wats<strong>on</strong> test is a test for first-order serial correlati<strong>on</strong> in theresiduals of a time series regressi<strong>on</strong>. A value of 2.0 for the Durbin-Wats<strong>on</strong>statistic indicates that there is no serial correlati<strong>on</strong> but this result isbiased toward the finding that there is no serial correlati<strong>on</strong> if laggedvalues of the regressors are in the regressi<strong>on</strong>.2.10 Determinant residual covarianceThe Determinant residual covariance is the determinant of the residual covariancematrix. If the determinant of the residual covariance matrix iszero, the estimates are effi cient. But, if a comparis<strong>on</strong> of two determinantsof each’s residual covariance matrix shows a value, for example, >100 for theoriginal VAR and a value near to zero for the log-VAR, then a linearly dependentcovariance matrix seems unlikely, the zero-value must be due to very smallcovariances (but these are caused by the transformati<strong>on</strong> into log-units, and mustnot be due to a real improvement of the model).3 Maximum likelihoodMaximum Likelihood Estimati<strong>on</strong> (MLE) is a popular statistical method used tocalculate the best way of fitting a mathematical model to some data. Modelingreal world data by estimating maximum likelihood offers a way of tuning thefree parameters of the model to provide an optimum fit.3
The likelihood and log-likelihood functi<strong>on</strong>s are the basis for deriving estimatorsfor parameters, given data. While the shapes of these two functi<strong>on</strong>sare different, they have their maximum point at the same value. In fact, thevalue of p that corresp<strong>on</strong>ds to this maximum point is defined as the MaximumLikelihood Estimate (MLE). This is the value that is “mostly likely" relative tothe other values. This is a simple, compelling c<strong>on</strong>cept and it has a host of goodstatistical properties.3.1 Log likelihoodThe shape of the log-likelihood functi<strong>on</strong> is important in a c<strong>on</strong>ceptual way. If thelog-likelihood functi<strong>on</strong> is relatively flat, <strong>on</strong>e can make the interpretati<strong>on</strong> thatseveral (perhaps many) values of p are nearly equally likely. They are relativelyalike. This is quantified as the sampling variance or standard error. If the loglikelihoodfuncti<strong>on</strong> is fairly flat, this implies c<strong>on</strong>siderable uncertainty and this isreflected in large sampling variances and standard errors, and wide c<strong>on</strong>fidenceintervals.On the other hand, if the log-likelihood functi<strong>on</strong> is fairly peaked near itsmaximum point, this indicates some values of p are relatively very likely comparedto others. There is some c<strong>on</strong>siderable degree of certainty implied and thisis reflected in small sampling variances and standard errors, and narrow c<strong>on</strong>fidenceintervals. So, the log-likelihood functi<strong>on</strong> at its maximum pointis important as well as the shape of the functi<strong>on</strong> near this maximumpoint.3.2 Avg. log likelihoodAverage log likelihood is the log likelihood (i.e. the maximized value of thelog likelihood functi<strong>on</strong>) divided by the number of observati<strong>on</strong>s. The maximizati<strong>on</strong>of the log-likelihood is the same as the maximizati<strong>on</strong> of theaverage log likelihood. This statistic is useful in order to compare models.3.3 Akaike Informati<strong>on</strong> Criteri<strong>on</strong>Akaike’s Informati<strong>on</strong> Criteri<strong>on</strong> (AIC) is a measure of the goodness of fit of anestimated statistical model. It is grounded in the c<strong>on</strong>cept of entropy. The AIC isan operati<strong>on</strong>al way of trading off the complexity of an estimated model againsthow well the model fits the data.The preferred model is the <strong>on</strong>e with the lowest AIC value. TheAIC methodology attempts to find the model that best explains the data witha minimum of free parameters. By c<strong>on</strong>trast, more traditi<strong>on</strong>al approaches tomodeling start from a null hypothesis. The AIC penalizes free parameters lessstr<strong>on</strong>gly than does the Schwarz criteri<strong>on</strong>.4
3.4 Schwarz Informati<strong>on</strong> Criteri<strong>on</strong>The Bayesian informati<strong>on</strong> criteri<strong>on</strong> (BIC) is a statistical criteri<strong>on</strong> for modelselecti<strong>on</strong>. The BIC is sometimes also named the Schwarz criteri<strong>on</strong>, or Schwarzinformati<strong>on</strong> criteri<strong>on</strong> (SIC). It is so named because Gide<strong>on</strong> E. Schwarz (1978)gave a Bayesian argument for adopting it.Given any two estimated models, the model with the lower value ofBIC is the <strong>on</strong>e to be preferred. The BIC is an increasing functi<strong>on</strong> of residualsum of squares and an increasing functi<strong>on</strong> of the number of free parameters tobe estimated (for example, if the estimated model is a linear regressi<strong>on</strong>, it is thenumber of regressors, including the c<strong>on</strong>stant). That is, unexplained variati<strong>on</strong>in the dependent variable and the number of explanatory variables increase thevalue of BIC. Hence, lower BIC implies either fewer explanatory variables, betterfit, or both. The BIC penalizes free parameters more str<strong>on</strong>gly than does theAkaike informati<strong>on</strong> criteri<strong>on</strong>.3.5 Hannan-Quinn Informati<strong>on</strong> Criteri<strong>on</strong>Ideally AIC and SBIC should be as small as possible (note that all can benegative). Similarly, the Hannan-Quinn Informati<strong>on</strong> Criteri<strong>on</strong> (HQIC)should be also as small as possible. Therefore the model to be chosen shouldbe the <strong>on</strong>e with the lowest value of informati<strong>on</strong> criteria test.3.6 Determinant residual covarianceMaximizing the likelihood value is equivalent to minimizing the determinantof the residual covariance matrix. Thus, the determinant of the residual covariancematrix and not the residuals itself are minimized. As smaller thisdeterminant is, better our estimati<strong>on</strong> will be.4 Summary tableType Optimal AcceptableR 2 and Adjusted R 2 → 1 > 0, 8J-statistic → 0 < 0, 1Mean dependant variable → +∞ > 100S.E. of Regressi<strong>on</strong> → 0 Choose the lower value (comparis<strong>on</strong>)Residual sum of squares → 0 Choose the lower value (comparis<strong>on</strong>)Prob(F-statistic) → 0 < 0, 05Durbin-Wats<strong>on</strong> statistic → 2 1.8 < DW < 2.2 (Under c<strong>on</strong>diti<strong>on</strong>s)Determinant residual covariance → 0 Choose the lower value (comparis<strong>on</strong>)Log-Likelihood → +∞ > 10 3Average Log-Likelihood → +∞ > 10AIC → −∞ Choose the lower value (comparis<strong>on</strong>)SIC → −∞ Choose the lower value (comparis<strong>on</strong>)HQIC → −∞ Choose the lower value (comparis<strong>on</strong>)5