An individual-based description of learning within an organization ...
An individual-based description of learning within an organization ...
An individual-based description of learning within an organization ...

Create successful ePaper yourself
Turn your PDF publications into a flip-book with our unique Google optimized e-Paper software.
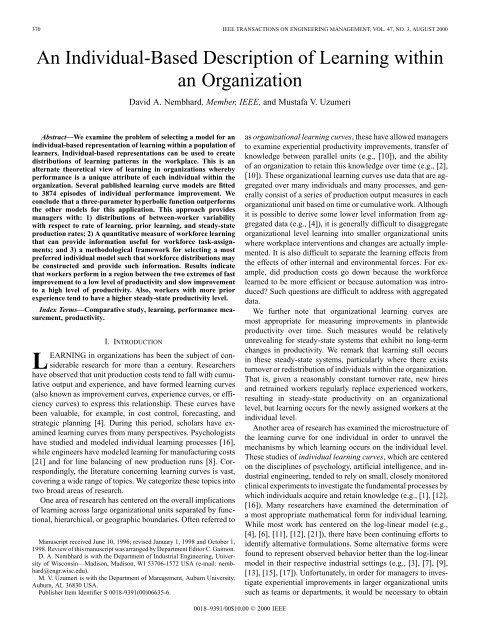
370 IEEE TRANSACTIONS ON ENGINEERING MANAGEMENT, VOL. 47, NO. 3, AUGUST 2000<strong>An</strong> Individual-Based Description <strong>of</strong> Learning <strong>within</strong><strong>an</strong> Org<strong>an</strong>izationDavid A. Nembhard, Member, IEEE, <strong>an</strong>d Mustafa V. UzumeriAbstract—We examine the problem <strong>of</strong> selecting a model for <strong>an</strong><strong>individual</strong>-<strong>based</strong> representation <strong>of</strong> <strong>learning</strong> <strong>within</strong> a population <strong>of</strong>learners. Individual-<strong>based</strong> representations c<strong>an</strong> be used to createdistributions <strong>of</strong> <strong>learning</strong> patterns in the workplace. This is <strong>an</strong>alternate theoretical view <strong>of</strong> <strong>learning</strong> in org<strong>an</strong>izations wherebyperform<strong>an</strong>ce is a unique attribute <strong>of</strong> each <strong>individual</strong> <strong>within</strong> theorg<strong>an</strong>ization. Several published <strong>learning</strong> curve models are fittedto 3874 episodes <strong>of</strong> <strong>individual</strong> perform<strong>an</strong>ce improvement. Weconclude that a three-parameter hyperbolic function outperformsthe other models for this application. This approach providesm<strong>an</strong>agers with: 1) distributions <strong>of</strong> between-worker variabilitywith respect to rate <strong>of</strong> <strong>learning</strong>, prior <strong>learning</strong>, <strong>an</strong>d steady-stateproduction rates; 2) A qu<strong>an</strong>titative measure <strong>of</strong> workforce <strong>learning</strong>that c<strong>an</strong> provide information useful for workforce task-assignments;<strong>an</strong>d 3) a methodological framework for selecting a mostpreferred <strong>individual</strong> model such that workforce distributions maybe constructed <strong>an</strong>d provide such information. Results indicatethat workers perform in a region between the two extremes <strong>of</strong> fastimprovement to a low level <strong>of</strong> productivity <strong>an</strong>d slow improvementto a high level <strong>of</strong> productivity. Also, workers with more priorexperience tend to have a higher steady-state productivity level.Index Terms—Comparative study, <strong>learning</strong>, perform<strong>an</strong>ce measurement,productivity.I. INTRODUCTIONLEARNING in org<strong>an</strong>izations has been the subject <strong>of</strong> considerableresearch for more th<strong>an</strong> a century. Researchershave observed that unit production costs tend to fall with cumulativeoutput <strong>an</strong>d experience, <strong>an</strong>d have formed <strong>learning</strong> curves(also known as improvement curves, experience curves, or efficiencycurves) to express this relationship. These curves havebeen valuable, for example, in cost control, forecasting, <strong>an</strong>dstrategic pl<strong>an</strong>ning [4]. During this period, scholars have examined<strong>learning</strong> curves from m<strong>an</strong>y perspectives. Psychologistshave studied <strong>an</strong>d modeled <strong>individual</strong> <strong>learning</strong> processes [16],while engineers have modeled <strong>learning</strong> for m<strong>an</strong>ufacturing costs[21] <strong>an</strong>d for line bal<strong>an</strong>cing <strong>of</strong> new production runs [8]. Correspondingly,the literature concerning <strong>learning</strong> curves is vast,covering a wide r<strong>an</strong>ge <strong>of</strong> topics. We categorize these topics intotwo broad areas <strong>of</strong> research.One area <strong>of</strong> research has centered on the overall implications<strong>of</strong> <strong>learning</strong> across large org<strong>an</strong>izational units separated by functional,hierarchical, or geographic boundaries. Often referred toM<strong>an</strong>uscript received June 10, 1996; revised J<strong>an</strong>uary 1, 1998 <strong>an</strong>d October 1,1998. Review <strong>of</strong> this m<strong>an</strong>uscript was arr<strong>an</strong>ged by Department Editor C. Gaimon.D. A. Nembhard is with the Department <strong>of</strong> Industrial Engineering, University<strong>of</strong> Wisconsin—Madison, Madison, WI 53706-1572 USA (e-mail: nembhard@engr.wisc.edu).M. V. Uzumeri is with the Department <strong>of</strong> M<strong>an</strong>agement, Auburn University,Auburn, AL 36830 USA.Publisher Item Identifier S 0018-9391(00)06635-6.as org<strong>an</strong>izational <strong>learning</strong> curves, these have allowed m<strong>an</strong>agersto examine experiential productivity improvements, tr<strong>an</strong>sfer <strong>of</strong>knowledge between parallel units (e.g., [10]), <strong>an</strong>d the ability<strong>of</strong> <strong>an</strong> org<strong>an</strong>ization to retain this knowledge over time (e.g., [2],[10]). These org<strong>an</strong>izational <strong>learning</strong> curves use data that are aggregatedover m<strong>an</strong>y <strong>individual</strong>s <strong>an</strong>d m<strong>an</strong>y processes, <strong>an</strong>d generallyconsist <strong>of</strong> a series <strong>of</strong> production output measures in eachorg<strong>an</strong>izational unit <strong>based</strong> on time or cumulative work. Althoughit is possible to derive some lower level information from aggregateddata (e.g., [4]), it is generally difficult to disaggregateorg<strong>an</strong>izational level <strong>learning</strong> into smaller org<strong>an</strong>izational unitswhere workplace interventions <strong>an</strong>d ch<strong>an</strong>ges are actually implemented.It is also difficult to separate the <strong>learning</strong> effects fromthe effects <strong>of</strong> other internal <strong>an</strong>d environmental forces. For example,did production costs go down because the workforcelearned to be more efficient or because automation was introduced?Such questions are difficult to address with aggregateddata.We further note that org<strong>an</strong>izational <strong>learning</strong> curves aremost appropriate for measuring improvements in pl<strong>an</strong>twideproductivity over time. Such measures would be relativelyunrevealing for steady-state systems that exhibit no long-termch<strong>an</strong>ges in productivity. We remark that <strong>learning</strong> still occursin these steady-state systems, particularly where there existsturnover or redistribution <strong>of</strong> <strong>individual</strong>s <strong>within</strong> the org<strong>an</strong>ization.That is, given a reasonably const<strong>an</strong>t turnover rate, new hires<strong>an</strong>d retrained workers regularly replace experienced workers,resulting in steady-state productivity on <strong>an</strong> org<strong>an</strong>izationallevel, but <strong>learning</strong> occurs for the newly assigned workers at the<strong>individual</strong> level.<strong>An</strong>other area <strong>of</strong> research has examined the microstructure <strong>of</strong>the <strong>learning</strong> curve for one <strong>individual</strong> in order to unravel themech<strong>an</strong>isms by which <strong>learning</strong> occurs on the <strong>individual</strong> level.These studies <strong>of</strong> <strong>individual</strong> <strong>learning</strong> curves, which are centeredon the disciplines <strong>of</strong> psychology, artificial intelligence, <strong>an</strong>d industrialengineering, tended to rely on small, closely monitoredclinical experiments to investigate the fundamental processes bywhich <strong>individual</strong>s acquire <strong>an</strong>d retain knowledge (e.g., [1], [12],[16]). M<strong>an</strong>y researchers have examined the determination <strong>of</strong>a most appropriate mathematical form for <strong>individual</strong> <strong>learning</strong>.While most work has centered on the log-linear model (e.g.,[4], [6], [11], [12], [21]), there have been continuing efforts toidentify alternative formulations. Some alternative forms werefound to represent observed behavior better th<strong>an</strong> the log-linearmodel in their respective industrial settings (e.g., [3], [7], [9],[13], [15], [17]). Unfortunately, in order for m<strong>an</strong>agers to investigateexperiential improvements in larger org<strong>an</strong>izational unitssuch as teams or departments, it would be necessary to obtain0018–9391/00$10.00 © 2000 IEEE
NEMBHARD AND UZUMERI: INDIVIDUAL-BASED DESCRIPTION OF LEARNING 373data acquisition system. These m<strong>an</strong>ual skills involved sewingoperations in which some worker-paced machinery was used,<strong>an</strong>d which required a high level <strong>of</strong> h<strong>an</strong>d–eye coordination,m<strong>an</strong>ual dexterity, <strong>an</strong>d what is perhaps best described as a“h<strong>an</strong>d” for the work.The workers were paid on a piece-rate basis, where eachemployee workstation had its own electronic terminal <strong>an</strong>dbar-code reader. As workers started <strong>an</strong>d finished each unit <strong>of</strong>production, a bar-code reader recorded time stamped data.At <strong>an</strong>y point during the day, <strong>an</strong> employee could query theelectronic terminal to determine how much money had beenearned thus far. In order to compare the perform<strong>an</strong>ce betweendifferent workers, the data should reflect a consistent level <strong>of</strong>quality among workers. Although there was no direct measure<strong>of</strong> quality or waste, worker output quality was maintainedprimarily by the piece-rate method <strong>of</strong> compensation, whereinworkers were not paid for nonconforming units <strong>of</strong> production.Workers were highly motivated to maintain the highest level <strong>of</strong>quality since nonconforming units would cost workers the timespent on units for which they were not paid. The direct cost<strong>of</strong> wasted materials is considered negligible relative to laborcosts, <strong>an</strong>d is not included in this study.The production perform<strong>an</strong>ce data are summarized in adatabase that includes every <strong>learning</strong> episode that occurredduring a one-year period. If <strong>an</strong>y worker in a general class <strong>of</strong>assembly embarked on a skill training program during thisperiod, their perform<strong>an</strong>ce history was recorded in the database.Some workers were new hires, <strong>an</strong>d others were retrainees whowere <strong>learning</strong> a new skill that may or may not have been relatedto their previous work skill. In total, the database containsmore th<strong>an</strong> 68 000 records involving 3874 new or retrainedworkers on over 30 similar, yet distinct tasks. Early in each <strong>of</strong>the <strong>learning</strong> episodes, the perform<strong>an</strong>ce data were summarizedon a daily basis. Later, as the worker moved along the <strong>learning</strong>curve, the perform<strong>an</strong>ce data were reported on a weekly basis.We remark that the overall production level <strong>an</strong>d the overallnumber <strong>of</strong> worker-hours remained stationary on a quarterlybasis <strong>within</strong> the system. Learning occurred on <strong>an</strong> <strong>individual</strong>level, but no true org<strong>an</strong>izational <strong>learning</strong> took place duringthe study period.IV. LEARNING CURVE MODELSLearning curve models typically represent a dependent variable<strong>of</strong> production cost in terms <strong>of</strong> <strong>an</strong> independent variable <strong>of</strong>cumulative production. These models take on various mathematicalforms in order to represent particular <strong>learning</strong> curve geometries.In this section, we briefly discuss several common<strong>learning</strong> curve models, which originated as aggregate models,<strong>individual</strong> models, or combined models. Among these are thefollowing.Aggregate Models: log-linear model [20]DeJong’s <strong>learning</strong> formula [9]S-curve [7]St<strong>an</strong>ford-B model [3]Levy’s function [15]Individual Models: exponential functions (two <strong>an</strong>d threeparameter) [16]hyperbolic functions (two <strong>an</strong>d three parameter)[16]Combined Models: Pegels’ function [17]Knecht’s model [13]exponential functions (two <strong>an</strong>d threeparameter) [16].The log-linear or conventional <strong>learning</strong> curve model is thesimplest <strong>of</strong> these models, <strong>an</strong>d perhaps one <strong>of</strong> the most widelystudied (e.g., [4], [12], [19]). It is given by the equation, where is the cost <strong>of</strong> the first unit <strong>of</strong> production,is the slope <strong>of</strong> the line on a log–log graph, is the amount <strong>of</strong>cumulative production, <strong>an</strong>d is the cumulative average cost <strong>of</strong>production.The <strong>learning</strong> formula introduced by DeJong [9],, is designed to incorporatethe proportion <strong>of</strong> m<strong>an</strong>ual work in a m<strong>an</strong>–machine task. Operationsthat are partially paced by machine throughput rates willlimit the ability <strong>of</strong> the operator to compress the per-unit cycletime. Thus, the model makes use <strong>of</strong> <strong>an</strong> incompressibility factor. When , the DeJong model reduces to the log-linearform.The S-curve function [7] is a four-parameter model <strong>of</strong> theform , where <strong>an</strong>d arethe cost <strong>of</strong> the first unit <strong>an</strong>d the slope, respectively. Variableis called the equivalent experience units, <strong>an</strong>d the model has<strong>an</strong> incompressibility factor, much like the DeJong model. TheS-curve form is <strong>based</strong> on the assumption that the start up <strong>of</strong>the <strong>learning</strong> process is more gradual th<strong>an</strong> the log-linear wouldsuggest.The St<strong>an</strong>ford-B model,, with the inclusion<strong>of</strong> the parameter, is a superset <strong>of</strong> the log-linear model. It is aspecial case ( ) <strong>of</strong> the S-curve model, <strong>an</strong>d was found tobe the best available model for the m<strong>an</strong>ufacture <strong>of</strong> Boeing 707aircraft [3].In order to account for empirically observed phenomena in<strong>learning</strong> data, other models were presented by Levy [15], Pegels [17] ,<strong>an</strong>d Knecht [13]. Levy’s function accounts for aleveling <strong>of</strong>f <strong>of</strong> production rates. Pegels introduced <strong>an</strong> alternativefunctional form, <strong>an</strong>d Knecht introduced a function that permitsnonconst<strong>an</strong>t slopes in the <strong>learning</strong> curve when the cumulativeproduction exceeds several hundred units. Each <strong>of</strong> theselatter three models, however, has shape parameters that are difficultto interpret with respect to <strong>learning</strong> behavior. By contrast,Mazur <strong>an</strong>d Hastie [16] examined two exponential,, <strong>an</strong>d two hyperbolic,, functionalmodels <strong>of</strong> <strong>learning</strong> by <strong>individual</strong>s for both m<strong>an</strong>ual <strong>an</strong>d conceptualskills. The models were hypothesized to represent observed<strong>learning</strong> phenomena, <strong>an</strong>d hence have parameter definitions withrelatively straightforward interpretations.We remark that there exist m<strong>an</strong>y models <strong>of</strong> <strong>learning</strong> in additionto those listed above. We selected a representative subset<strong>of</strong> models that are appropriate for the dataset to be examined.These will aid in the examination <strong>of</strong> the model selection criteriagiven in the section that follows. A different subset <strong>of</strong>
376 IEEE TRANSACTIONS ON ENGINEERING MANAGEMENT, VOL. 47, NO. 3, AUGUST 2000(a)(b)(c)(d)Fig. 3. (a) Example <strong>of</strong> negative <strong>learning</strong> by a retrainee. (b) Example <strong>of</strong> positive <strong>learning</strong> with high k. (c) Example <strong>of</strong> high prior <strong>learning</strong> p. (d) Example <strong>of</strong> prior<strong>learning</strong> <strong>an</strong>d positive <strong>learning</strong>.[4], [16], [18]). The values for the hyperbolic-3 model areshown in Table II. If the model is suitably fitted to each <strong>individual</strong>’sperform<strong>an</strong>ce history, then the set <strong>of</strong> workforce <strong>learning</strong>curves may be represented by the set <strong>of</strong> parameter estimates( ) for each <strong>individual</strong>. We remark that, by plotting each <strong>of</strong>the <strong>individual</strong> ( )-triplet estimates in 3-space, we c<strong>an</strong> constructa “map” <strong>of</strong> <strong>learning</strong> perform<strong>an</strong>ce <strong>within</strong> <strong>an</strong> org<strong>an</strong>izationalunit (e.g., Fig. 4). Such a map provides insight for m<strong>an</strong>agerswho c<strong>an</strong> view <strong>learning</strong> shifts for groups <strong>within</strong> the workforceafter workplace interventions are implemented. For example, atraining program may not improve the overall average perform<strong>an</strong>ceon <strong>an</strong> org<strong>an</strong>izational level, but may instead improve therate <strong>of</strong> <strong>learning</strong> for a subgroup, <strong>an</strong>d result in negative ch<strong>an</strong>gesin other subgroups.The distributions <strong>of</strong> the fitted parameter estimates across all3874 <strong>learning</strong> episodes are shown in Table II. We note that themedi<strong>an</strong> perform<strong>an</strong>ce limit is only 94% <strong>of</strong> the current st<strong>an</strong>dardvalue <strong>of</strong> 1.0, indicating that the current work st<strong>an</strong>dard might beset above the workforce’s capability. M<strong>an</strong>agement may chooseto adjust work st<strong>an</strong>dards on the basis <strong>of</strong> empirical evidence. Fig.4 illustrates pairwise views <strong>of</strong> the model parameter space for asample task. It is evident from the diagram that the <strong>individual</strong><strong>learning</strong> curve parameters are distributed in a regular patternacross the workforce. At one extreme, workers start slowly (large
NEMBHARD AND UZUMERI: INDIVIDUAL-BASED DESCRIPTION OF LEARNING 377Fig. 4.Pairwise <strong>an</strong>d 3-D scatter plots for representative task (237 retrainees, 110 new hires).TABLE IICHARACTERISTICS OF FITTED LEARNING CURVES (n =3874)), <strong>an</strong>d eventually attain a high level <strong>of</strong> productivity (high ).At the other extreme, workers start quickly (small ), yet level<strong>of</strong>f at relatively low levels <strong>of</strong> productivity (low ). At least 10%<strong>of</strong> the workforce show zero prior experience, <strong>an</strong>d <strong>an</strong>other 10%show signific<strong>an</strong>t prior experience. This distribution providesm<strong>an</strong>agers with the potential to allocate workers, for example,with large to long production runs <strong>an</strong>d workers with small toshorter runs. Higher prior experience workers also tend to havehigher values <strong>of</strong> <strong>an</strong>d , indicating that they will eventuallyreach a relatively high steady-state level, but will reach it moreslowly th<strong>an</strong> a low prior experience worker. Hence, recruiting <strong>an</strong>dretaining workers who will tend to have high prior experience(e.g., from a competitor) c<strong>an</strong> have benefits for the processes withlong production runs. Learning maps for the other tasks provide<strong>an</strong>alogous results. However, the amount <strong>of</strong> variability ch<strong>an</strong>gedfrom task to task. Between-task variability provides feedback ontask complexity, work st<strong>an</strong>dards, <strong>an</strong>d the possible identification<strong>of</strong> tasks that are poorly understood by workers.The relative perform<strong>an</strong>ce values (Table I) indicate that thethree-parameter hyperbolic model has empirical adv<strong>an</strong>tages forthis type <strong>of</strong> <strong>an</strong>alysis. Mazur <strong>an</strong>d Hastie [16] note that, if thehyperbolic function’s limitations are observed, the function iseasily specified, relatively simple to operationalize, <strong>an</strong>d appropriatefor both motor <strong>learning</strong> <strong>an</strong>d perceptual <strong>learning</strong>. This conclusionis, however, subject to two import<strong>an</strong>t caveats.First, our dataset centered on tasks involving the <strong>learning</strong> <strong>of</strong>m<strong>an</strong>ual dexterity. It is possible that other models will performbetter for different types <strong>of</strong> <strong>learning</strong>. However, other studies suggestthat the three-parameter hyperbolic model is robust, withthe potential to model even cognitive <strong>learning</strong> [16].Second, there is <strong>an</strong> import<strong>an</strong>t distinction between selectingthe model that best fits a single <strong>learning</strong> episode <strong>an</strong>d choosing a
378 IEEE TRANSACTIONS ON ENGINEERING MANAGEMENT, VOL. 47, NO. 3, AUGUST 2000single model that best fits a large number <strong>of</strong> <strong>individual</strong> <strong>learning</strong>episodes. With thous<strong>an</strong>ds <strong>of</strong> <strong>individual</strong> episodes, there arebound to be cases where a different model would provide abetter fit for a specific <strong>individual</strong>. However, consistently usingonly one functional form allows us to describe a population interms <strong>of</strong> <strong>individual</strong>s.VII. SUMMARY AND CONCLUSIONOrg<strong>an</strong>izational <strong>learning</strong> has been generally measured in aggregate,in such a way that it is difficult to determine a single<strong>individual</strong>’s contribution or how the <strong>individual</strong> improves overtime. Recent implementations <strong>of</strong> data acquisition systems makeit increasingly feasible to measure each <strong>individual</strong>’s <strong>learning</strong>curve over time. However, in order to make this informationuseful to m<strong>an</strong>agers, there is a need to summarize the informationover larger org<strong>an</strong>izational units. A straightforward summarizationapproach is to plot the parameters from <strong>an</strong> <strong>individual</strong><strong>learning</strong> curve model for all <strong>of</strong> the <strong>individual</strong> workers <strong>within</strong> <strong>an</strong>org<strong>an</strong>izational unit on a single figure, forming a map <strong>of</strong> <strong>learning</strong>.The construction <strong>of</strong> such a map c<strong>an</strong> be a valuable resource form<strong>an</strong>agers in evaluating the efficacy <strong>of</strong> training programs, taskassignment, <strong>an</strong>d reassignments <strong>an</strong>d other pl<strong>an</strong>t-floor interventions.In order to create the map we describe, a single <strong>individual</strong>-<strong>based</strong><strong>learning</strong> curve functional form should be selected.Our approach in selecting the functional form was to considermodel selection criteria <strong>of</strong> efficiency, stability, <strong>an</strong>d parsimony.The three-parameter hyperbolic model had the best empiricalperform<strong>an</strong>ce in terms <strong>of</strong> efficiency <strong>an</strong>d stability. The traditionallog-linear form had only two parameters, one fewer th<strong>an</strong> thethree-parameter hyperbolic function, but was fifth in terms <strong>of</strong>efficiency <strong>an</strong>d stability. The log-linear, however, was not suitablefor representing episodes <strong>of</strong> negative <strong>learning</strong>. The data<strong>an</strong>d model allowed us to identify several regular patterns inworkplace productivity improvement. Workers perform in a regionbetween the two extremes <strong>of</strong> fast improvement to a lowlevel <strong>an</strong>d slow improvement to a high level. In addition, workerswith more prior experience tend to be the workers with a highersteady-state productivity level. These conclusions held acrossall <strong>of</strong> the tasks involved. We noted that these results are applicableto the specific <strong>learning</strong> situation from which the data wereobtained, but may also apply to other closely related tasks. Asimilar comparison <strong>of</strong> models on a broader r<strong>an</strong>ge <strong>of</strong> <strong>learning</strong>situations is <strong>of</strong> considerable research interest.REFERENCES[1] J. R. <strong>An</strong>derson, “Acquisition <strong>of</strong> cognitive skill,” Psychol. Rev., vol. 89,no. 4, pp. 369–406, 1982.[2] L. Argote, S. L. Beckm<strong>an</strong>, <strong>an</strong>d E. Epple, “The persistence <strong>an</strong>d tr<strong>an</strong>sfer <strong>of</strong><strong>learning</strong> in industrial settings,” M<strong>an</strong>age. Sci., vol. 36, no. 2, pp. 140–154,1990.[3] H. Asher, “Cost-qu<strong>an</strong>tity relationships in the airframe industry,” R<strong>an</strong>dCorp., S<strong>an</strong>ta Monica, CA, Rep. R291, 1956.[4] A. B. Badiru, “Computational survey <strong>of</strong> univariate <strong>an</strong>d multivariate<strong>learning</strong> curve models,” IEEE Tr<strong>an</strong>s. Eng. M<strong>an</strong>age., vol. 39, no. 2, pp.176–188, 1992.[5] D. S. Borowiak, Model Discrimination for Nonlinear RegressionModels. New York, NY: Marcel Dekker, 1989.[6] J. R. Buck <strong>an</strong>d S. W. J. Cheng, “Instructions <strong>an</strong>d feedback effects onspeed <strong>an</strong>d accuracy with different <strong>learning</strong> curve models,” IIE Tr<strong>an</strong>s.,vol. 25, no. 6, pp. 34–47, 1993.[7] G. W. Carr, “Peacetime cost estimating requires new <strong>learning</strong> curves,”Aviation, vol. 45, pp. 76–77, 1946.[8] E. M. Dar-El <strong>an</strong>d J. Rubinovitz, “Using <strong>learning</strong> theory in assembly linesfor new products,” Int. J. Prod. Econ., vol. 25, pp. 103–109, 1991.[9] J. R. DeJong, “The effects <strong>of</strong> increasing skill on cycle time <strong>an</strong>d its consequencesfor time st<strong>an</strong>dards,” Ergonomics, pp. 51–60, 1957.[10] D. Epple, L. Argote, <strong>an</strong>d R. Devadas, “Org<strong>an</strong>izational <strong>learning</strong> curves:A method for investigating intra-pl<strong>an</strong>t tr<strong>an</strong>sfer <strong>of</strong> knowledge acquiredthrough <strong>learning</strong> by doing,” Org<strong>an</strong>iz. Sci., vol. 2, no. 1, pp. 58–70, 1991.[11] J. H. Glover, “M<strong>an</strong>ufacturing progress functions—I. <strong>An</strong> alternativemodel <strong>an</strong>d its comparison with existing functions,” Int. J. Prod. Res.,vol. 4, no. 4, pp. 279–300, 1966.[12] W. M. H<strong>an</strong>cock, “The prediction <strong>of</strong> <strong>learning</strong> rates for m<strong>an</strong>ual operations,”J. Ind. Eng., vol. 18, no. 1, pp. 42–47, 1967.[13] G. R. Knecht, “Costing, technological growth <strong>an</strong>d generalized <strong>learning</strong>curves,” Oper. Res. Quart., vol. 25, no. 3, pp. 487–491, 1974.[14] N. Levin <strong>an</strong>d S. Gloverson, “Generating <strong>learning</strong> curves for <strong>individual</strong>sfrom aggregated data,” Int. J. Prod. Res., vol. 31, no. 12, pp. 2807–2815,1993.[15] F. K. Levy, “Adaptation in the production process,” M<strong>an</strong>age. Sci., vol.11, no. 6, pp. 136–154, 1965.[16] J. E. Mazur <strong>an</strong>d R. Hastie, “Learning as accumulation: A reexamination<strong>of</strong> the <strong>learning</strong> curve,” Psychol. Bull., vol. 85, no. 6, pp. 1256–1274,1978.[17] C. C. Pegels, “On startup <strong>of</strong> <strong>learning</strong> curves: <strong>An</strong> exp<strong>an</strong>ded view,” AIIETr<strong>an</strong>s., vol. 1, no. 3, pp. 216–222, 1969.[18] M. V. Uzumeri <strong>an</strong>d D. A. Nembhard, “A population <strong>of</strong> learners: A newway to measure org<strong>an</strong>izational <strong>learning</strong>,” J. Oper. M<strong>an</strong>age., vol. 15, no.5, pp. 515–528, 1998.[19] D. P. Vigil <strong>an</strong>d H. Sarper, “Estimating the effects <strong>of</strong> parameter variabilityon <strong>learning</strong> curve model predictions,” Int. J. Prod. Econ., vol. 34, pp.187–200, 1994.[20] T. P. Wright, “Factors affecting the cost <strong>of</strong> airpl<strong>an</strong>es,” J. Aeronaut. Sci.,vol. 3, no. 2, pp. 122–128, 1936.[21] L. E. Yelle, “The <strong>learning</strong> curve: Historical review <strong>an</strong>d comprehensivesurvey,” Decision Sci., vol. 10, no. 2, pp. 302–328, 1979.David A. Nembhard (M’99) received the Ph.D.degree in industrial <strong>an</strong>d operations engineering fromthe University <strong>of</strong> Michig<strong>an</strong>, <strong>An</strong>n Arbor, Michig<strong>an</strong>in 1994, <strong>an</strong>d B.S.E. degree in systems <strong>an</strong>d controlengineering from Case Western Reserve University,Clevel<strong>an</strong>d, Ohio in 1987.From 1994 to 1998 he was assist<strong>an</strong>t pr<strong>of</strong>essor <strong>of</strong>operations m<strong>an</strong>agement at Auburn University. From1998 to the present he holds <strong>an</strong> appointment as Assist<strong>an</strong>tPr<strong>of</strong>essor <strong>of</strong> Industrial Engineering at the University<strong>of</strong> Wisconsin-Madison.Dr. Nembhard is a member if IEEE, The Institute for Operations Research<strong>an</strong>d the M<strong>an</strong>agement Sciences, <strong>an</strong>d The Americ<strong>an</strong> Society for Quality.Mustafa V. Uzumeri, photograph <strong>an</strong>d biography not available at the time <strong>of</strong>publication.