2001 Tourism Statistics
2001 Tourism Statistics
2001 Tourism Statistics

You also want an ePaper? Increase the reach of your titles
YUMPU automatically turns print PDFs into web optimized ePapers that Google loves.
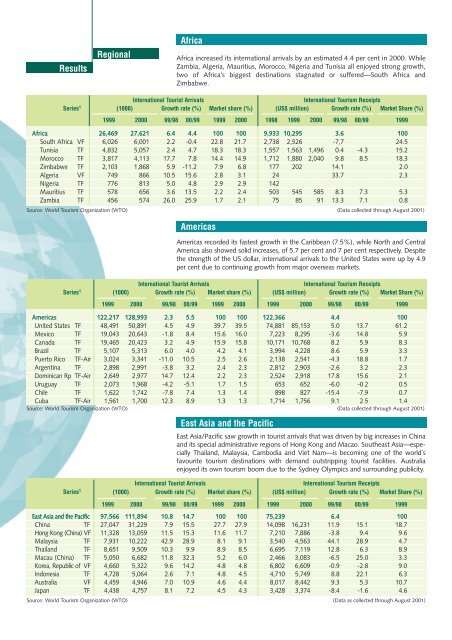
ResultsRegionalAfricaAfrica increased its international arrivals by an estimated 4.4 per cent in 2000. WhileZambia, Algeria, Mauritius, Morocco, Nigeria and Tunisia all enjoyed strong growth,two of Africa’s biggest destinations stagnated or suffered—South Africa andZimbabwe.International Tourist ArrivalsInternational <strong>Tourism</strong> ReceiptsSeries 1 (1000) Growth rate (%) Market share (%) (US$ million) Growth rate (%) Market Share (%)1999 2000 99/98 00/99 1999 2000 1998 1999 2000 99/98 00/99 1999Africa 26,469 27,621 6.4 4.4 100 100 9,933 10,295 3.6 100South Africa VF 6,026 6,001 2.2 -0.4 22.8 21.7 2,738 2,526 -7,7 24.5Tunisia TF 4,832 5,057 2.4 4.7 18.3 18.3 1,557 1,563 1,496 0.4 -4.3 15.2Morocco TF 3,817 4,113 17.7 7.8 14.4 14.9 1,712 1,880 2,040 9.8 8.5 18.3Zimbabwe TF 2,103 1,868 5.9 -11.2 7.9 6.8 177 202 14.1 2.0Algeria VF 749 866 10.5 15.6 2.8 3.1 24 33.7 2.3Nigeria TF 776 813 5.0 4.8 2.9 2.9 142Mauritius TF 578 656 3.6 13.5 2.2 2.4 503 545 585 8.3 7.3 5.3Zambia TF 456 574 26.0 25.9 1.7 2.1 75 85 91 13.3 7.1 0.8Source: World <strong>Tourism</strong> Organization (WTO) (Data collected through August <strong>2001</strong>)AmericasAmericas recorded its fastest growth in the Caribbean (7.5%), while North and CentralAmerica also showed solid increases, of 5.7 per cent and 7 per cent respectively. Despitethe strength of the US dollar, international arrivals to the United States were up by 4.9per cent due to continuing growth from major overseas markets.International Tourist ArrivalsInternational <strong>Tourism</strong> ReceiptsSeries 1 (1000) Growth rate (%) Market share (%) (US$ million) Growth rate (%) Market Share (%)1999 2000 99/98 00/99 1999 2000 1999 2000 99/98 00/99 1999Americas 122,217 128,993 2.3 5.5 100 100 122,366 4.4 100United States TF 48,491 50,891 4.5 4.9 39.7 39.5 74,881 85,153 5.0 13.7 61.2Mexico TF 19,043 20,643 -1.8 8.4 15.6 16.0 7,223 8,295 -3.6 14.8 5.9Canada TF 19,465 20,423 3.2 4.9 15.9 15.8 10,171 10,768 8.2 5.9 8.3Brazil TF 5,107 5,313 6.0 4.0 4.2 4.1 3,994 4,228 8.6 5.9 3.3Puerto Rico TF-Air 3,024 3,341 -11.0 10.5 2.5 2.6 2,138 2,541 -4.3 18.8 1.7Argentina TF 2,898 2,991 -3.8 3.2 2.4 2.3 2,812 2,903 -2.6 3.2 2.3Dominican Rp TF-Air 2,649 2,977 14.7 12.4 2.2 2.3 2,524 2,918 17.8 15.6 2.1Uruguay TF 2,073 1,968 -4.2 -5.1 1.7 1.5 653 652 -6.0 -0.2 0.5Chile TF 1,622 1,742 -7.8 7.4 1.3 1.4 898 827 -15.4 -7.9 0.7Cuba TF-Air 1,561 1,700 12.3 8.9 1.3 1.3 1,714 1,756 9.1 2.5 1.4Source: World <strong>Tourism</strong> Organization (WTO) (Data collected through August <strong>2001</strong>)East Asia and the PacificEast Asia/Pacific saw growth in tourist arrivals that was driven by big increases in Chinaand its special administrative regions of Hong Kong and Macao. Southeast Asia—especiallyThailand, Malaysia, Cambodia and Viet Nam—is becoming one of the world´sfavourite tourism destinations with demand outstripping tourist facilities. Australiaenjoyed its own tourism boom due to the Sydney Olympics and surrounding publicity.International Tourist ArrivalsInternational <strong>Tourism</strong> ReceiptsSeries 1 (1000) Growth rate (%) Market share (%) (US$ million) Growth rate (%) Market Share (%)1999 2000 99/98 00/99 1999 2000 1999 2000 99/98 00/99 1999East Asia and the Pacific 97,566 111,894 10.8 14.7 100 100 75,239 6.4 100China TF 27,047 31,229 7.9 15.5 27.7 27.9 14,098 16,231 11.9 15.1 18.7Hong Kong (China) VF 11,328 13,059 11.5 15.3 11.6 11.7 7,210 7,886 -3.8 9.4 9.6Malaysia TF 7,931 10,222 42.9 28.9 8.1 9.1 3,540 4,563 44.1 28.9 4.7Thailand TF 8,651 9,509 10.3 9.9 8.9 8.5 6,695 7,119 12.8 6.3 8.9Macau (China) TF 5,050 6,682 11.8 32.3 5.2 6.0 2,466 3,083 -6.5 25.0 3.3Korea, Republic of VF 4,660 5,322 9.6 14.2 4.8 4.8 6,802 6,609 -0.9 -2.8 9.0Indonesia TF 4,728 5,064 2.6 7.1 4.8 4.5 4,710 5,749 8.8 22.1 6.3Australia VF 4,459 4,946 7.0 10.9 4.6 4.4 8,017 8,442 9.3 5.3 10.7Japan TF 4,438 4,757 8.1 7.2 4.5 4.3 3,428 3,374 -8.4 -1.6 4.6Source: World <strong>Tourism</strong> Organization (WTO) (Data as collected through August <strong>2001</strong>)