How does education affect labour market outcomes? - Review of ...
How does education affect labour market outcomes? - Review of ...
How does education affect labour market outcomes? - Review of ...

You also want an ePaper? Increase the reach of your titles
YUMPU automatically turns print PDFs into web optimized ePapers that Google loves.
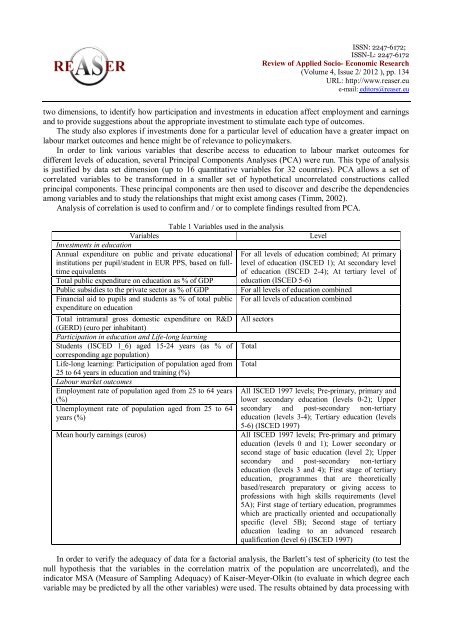
ISSN: 2247-6172;ISSN-L: 2247-6172<strong>Review</strong> <strong>of</strong> Applied Socio- Economic Research(Volume 4, Issue 2/ 2012 ), pp. 134URL: http://www.reaser.eue-mail: editors@reaser.eutwo dimensions, to identify how participation and investments in <strong>education</strong> <strong>affect</strong> employment and earningsand to provide suggestions about the appropriate investment to stimulate each type <strong>of</strong> <strong>outcomes</strong>.The study also explores if investments done for a particular level <strong>of</strong> <strong>education</strong> have a greater impact on<strong>labour</strong> <strong>market</strong> <strong>outcomes</strong> and hence might be <strong>of</strong> relevance to policymakers.In order to link various variables that describe access to <strong>education</strong> to <strong>labour</strong> <strong>market</strong> <strong>outcomes</strong> fordifferent levels <strong>of</strong> <strong>education</strong>, several Principal Components Analyses (PCA) were run. This type <strong>of</strong> analysisis justified by data set dimension (up to 16 quantitative variables for 32 countries). PCA allows a set <strong>of</strong>correlated variables to be transformed in a smaller set <strong>of</strong> hypothetical uncorrelated constructions calledprincipal components. These principal components are then used to discover and describe the dependenciesamong variables and to study the relationships that might exist among cases (Timm, 2002).Analysis <strong>of</strong> correlation is used to confirm and / or to complete findings resulted from PCA.Table 1 Variables used in the analysisVariablesLevelInvestments in <strong>education</strong>Annual expenditure on public and private <strong>education</strong>al For all levels <strong>of</strong> <strong>education</strong> combined; At primaryinstitutions per pupil/student in EUR PPS, based on fulltimeequivalents<strong>of</strong> <strong>education</strong> (ISCED 2-4); At tertiary level <strong>of</strong>level <strong>of</strong> <strong>education</strong> (ISCED 1); At secondary levelTotal public expenditure on <strong>education</strong> as % <strong>of</strong> GDP <strong>education</strong> (ISCED 5-6)Public subsidies to the private sector as % <strong>of</strong> GDP For all levels <strong>of</strong> <strong>education</strong> combinedFinancial aid to pupils and students as % <strong>of</strong> total public For all levels <strong>of</strong> <strong>education</strong> combinedexpenditure on <strong>education</strong>Total intramural gross domestic expenditure on R&D(GERD) (euro per inhabitant)Participation in <strong>education</strong> and Life-long learningStudents (ISCED 1_6) aged 15-24 years (as % <strong>of</strong>corresponding age population)Life-long learning: Participation <strong>of</strong> population aged from25 to 64 years in <strong>education</strong> and training (%)Labour <strong>market</strong> <strong>outcomes</strong>Employment rate <strong>of</strong> population aged from 25 to 64 years(%)Unemployment rate <strong>of</strong> population aged from 25 to 64years (%)Mean hourly earnings (euros)All sectorsTotalTotalAll ISCED 1997 levels; Pre-primary, primary andlower secondary <strong>education</strong> (levels 0-2); Uppersecondary and post-secondary non-tertiary<strong>education</strong> (levels 3-4); Tertiary <strong>education</strong> (levels5-6) (ISCED 1997)All ISCED 1997 levels; Pre-primary and primary<strong>education</strong> (levels 0 and 1); Lower secondary orsecond stage <strong>of</strong> basic <strong>education</strong> (level 2); Uppersecondary and post-secondary non-tertiary<strong>education</strong> (levels 3 and 4); First stage <strong>of</strong> tertiary<strong>education</strong>, programmes that are theoreticallybased/research preparatory or giving access topr<strong>of</strong>essions with high skills requirements (level5A); First stage <strong>of</strong> tertiary <strong>education</strong>, programmeswhich are practically oriented and occupationallyspecific (level 5B); Second stage <strong>of</strong> tertiary<strong>education</strong> leading to an advanced researchqualification (level 6) (ISCED 1997)In order to verify the adequacy <strong>of</strong> data for a factorial analysis, the Barlett’s test <strong>of</strong> sphericity (to test thenull hypothesis that the variables in the correlation matrix <strong>of</strong> the population are uncorrelated), and theindicator MSA (Measure <strong>of</strong> Sampling Adequacy) <strong>of</strong> Kaiser-Meyer-Olkin (to evaluate in which degree eachvariable may be predicted by all the other variables) were used. The results obtained by data processing with