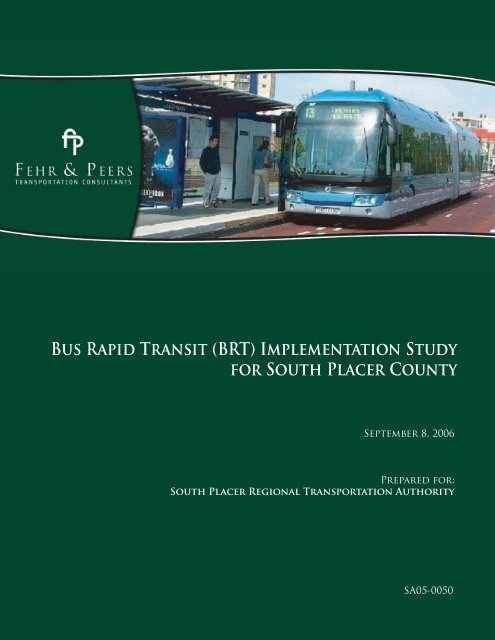
Bus Rapid Transit (BRT) Implementation Study for South ... - pctpa
Bus Rapid Transit (BRT) Implementation Study for South ... - pctpa
Bus Rapid Transit (BRT) Implementation Study for South ... - pctpa

Create successful ePaper yourself
Turn your PDF publications into a flip-book with our unique Google optimized e-Paper software.
<strong>Bus</strong> <strong>Rapid</strong> <strong>Transit</strong> (<strong>BRT</strong>) <strong>Implementation</strong> <strong>Study</strong><strong>for</strong> <strong>South</strong> Placer CountySeptember 8, 2006Prepared <strong>for</strong>:<strong>South</strong> Placer Regional Transportation AuthoritySA05-0050
<strong>Bus</strong> <strong>Rapid</strong> <strong>Transit</strong> (<strong>BRT</strong>) <strong>Implementation</strong> <strong>Study</strong> <strong>for</strong> south Placer CountySeptember 8, 2006TABLE OF CONTENTS1.0 INTRODUCTION...................................................................................................................................... 11.1 <strong>Study</strong> Purpose .................................................................................................................................. 11.2 <strong>Study</strong> Organization ........................................................................................................................... 12.0 BASIC CONCEPTS OF <strong>BRT</strong>................................................................................................................... 32.1 Running Ways................................................................................................................................... 33.0 EXISTING TRANSPORTATION FACILITIES ......................................................................................... 54.0 POTENTIAL <strong>BRT</strong> MARKET .................................................................................................................. 104.1 Development Project Review.......................................................................................................... 104.2 Future Travel Demand Forecasts................................................................................................... 144.3 Land Use Thresholds to Support <strong>Transit</strong>........................................................................................ 174.4 Preliminary <strong>BRT</strong> Station Land Use Evaluation............................................................................... 224.5 Preliminary <strong>BRT</strong> Ridership Forecasts ............................................................................................ 224.6 Summary of Potential <strong>BRT</strong> Market Review .................................................................................... 225.0 REVIEW OF POTENTIAL TRANSIT CORRIDORS.............................................................................. 285.1 Watt Avenue Corridor ..................................................................................................................... 285.2 Pleasant Grove Boulevard Corridor................................................................................................ 295.3 Blue Oaks Boulevard Corridor........................................................................................................ 295.4 Placer Parkway Corridor................................................................................................................. 305.5 State Route 65 Corridor.................................................................................................................. 305.6 Interstate 80 Corridor...................................................................................................................... 315.7 Roseville Parkway Corridor ............................................................................................................ 315.8 Douglas Boulevard Corridor ........................................................................................................... 315.9 Eureka Road Corridor..................................................................................................................... 325.10 Summary of Potential <strong>BRT</strong> Corridor Review .................................................................................. 326.0 <strong>BRT</strong> ROUTE PLAN................................................................................................................................ 356.1 Background..................................................................................................................................... 356.2 Candidate <strong>BRT</strong> Routes................................................................................................................... 366.3 Recommended Corridor Improvements ......................................................................................... 377.0 <strong>BRT</strong> STATION PLAN ............................................................................................................................ 437.1 <strong>BRT</strong> Stations................................................................................................................................... 437.2 Recommended <strong>BRT</strong> <strong>Transit</strong> Centers ............................................................................................. 457.3 Recommended <strong>BRT</strong> Stations ......................................................................................................... 468.0 SUGGESTED NEXT STEPS ................................................................................................................. 49i
<strong>Bus</strong> <strong>Rapid</strong> <strong>Transit</strong> (<strong>BRT</strong>) <strong>Implementation</strong> <strong>Study</strong> <strong>for</strong> south Placer CountySeptember 8, 2006LIST OF FIGURESFigure 1 <strong>Study</strong> Area .......................................................................................................................................... 2Figure 2 Existing and Planned Bicycle Facilities............................................................................................... 7Figure 3 Existing Local <strong>Transit</strong> Service and Facilities....................................................................................... 8Figure 4 Existing Commuter <strong>Transit</strong> Service and Facilities .............................................................................. 9Figure 5 Planned Transportation and Development Projects ......................................................................... 11Figure 6 Potential <strong>BRT</strong> Stations Area Evaluation ........................................................................................... 27Figure 7 Potential <strong>Transit</strong> Corridors ................................................................................................................ 34Figure 8 Potential <strong>BRT</strong> Routes ....................................................................................................................... 39Figure 9 <strong>BRT</strong> Route 1 Improvements ............................................................................................................. 40Figure 10 <strong>BRT</strong> Route 2 Improvements ........................................................................................................... 41Figure 11 <strong>BRT</strong> Route 3 Improvements ........................................................................................................... 42Figure 12 Recommended Station Locations................................................................................................... 48LIST OF TABLESTable 1 <strong>Study</strong> Area Planned Roadway Improvements by Year 2025 ............................................................... 6Table 2 2025 Land Use Projections ................................................................................................................ 15Table 3 Select Zone Analysis Summary.......................................................................................................... 21Table 4 <strong>Transit</strong> Modes Related to Residential Density Criteria....................................................................... 23Table 5 Suggested <strong>BRT</strong> <strong>Transit</strong> Center Elements .......................................................................................... 46Table 6 Suggested <strong>BRT</strong> Station Elements...................................................................................................... 47ii
<strong>Bus</strong> <strong>Rapid</strong> <strong>Transit</strong> (<strong>BRT</strong>) <strong>Implementation</strong> <strong>Study</strong> <strong>for</strong> south Placer CountySeptember 8, 2006EXECUTIVE SUMMARYThe <strong>South</strong> Placer Regional Transportation Authority (SPRTA) developed a <strong>Bus</strong> <strong>Rapid</strong> <strong>Transit</strong> (<strong>BRT</strong>)<strong>Implementation</strong> <strong>Study</strong> <strong>for</strong> south Placer County to provide guidance to agencies and developers about the landuse and station requirements <strong>for</strong> a future <strong>BRT</strong> system, as well as to recommend future <strong>BRT</strong> routes andstations in rapidly developing areas of south Placer County.<strong>BRT</strong> is an elaboration of the express bus concept that incorporates many light-rail transit principles. TheFederal <strong>Transit</strong> Administration (FTA) defines <strong>BRT</strong> as “a rapid mode of transportation that can provide thequality of rail transit and the flexibility of buses.” In many respects, <strong>BRT</strong> is rubber-tired light rail transit (LRT),but with greater operating flexibility and potentially lower costs. The main features of <strong>BRT</strong> include dedicatedrunning ways, attractive stations, distinctive and easy-to-board vehicles, off-street fare collections, use of ITStechnologies, and frequent all-day service (typically between 5 a.m. and midnight).The evaluation of the potential <strong>BRT</strong> market in south Placer County provided in Section 4 indicates that thetype, mix and density of land use planned <strong>for</strong> the following developments make them strong candidates <strong>for</strong>housing future <strong>BRT</strong> stations. The Hewlett-Packard (H-P) campus area and the Taylor park-and-ride centerare existing activity centers that are good candidates <strong>for</strong> <strong>BRT</strong> stations.• Placer Ranch Specific Plan area, particularly the planned CSUS – Placer Campus• Galleria Mall expansion project• West Roseville Specific Plan Town Center• Placer Vineyards Center at Watt Avenue• Planned Corporate Center at SR 65/Blue Oaks BouelvardThree <strong>BRT</strong> routes described in Section 6 would serve the candidate <strong>BRT</strong> stations described above. For eachof the three routes, specific improvements are identified ranging from dedicated High Occupancy Vehicle(HOV)/transit lanes to intersection queue jump lanes to transit signal priority.An evaluation of the opportunities and constraints <strong>for</strong> nine potential transit corridors, as well as projectedroadway volumes and land use <strong>for</strong>ecasts, yields the following conclusions:‣ Watt Avenue is an ideal corridor to provide <strong>BRT</strong> service <strong>for</strong> the following reasons.• Designation as a transit corridor in the Placer County General Plan• Designation as a feeder transit corridor in the Sacramento County General Plan• Ability to establish a right-of-way that can support transit• Plans to provide <strong>BRT</strong> service along Watt Avenue in the Sacramento County portionof the corridor‣ Blue Oaks Boulevard is an ideal corridor to provide <strong>BRT</strong> service <strong>for</strong> the following reasons.
<strong>Bus</strong> <strong>Rapid</strong> <strong>Transit</strong> (<strong>BRT</strong>) <strong>Implementation</strong> <strong>Study</strong> <strong>for</strong> south Placer CountySeptember 8, 2006• Designation as a transit corridor in the Placer County General Plan• Eight-lane right-of-way allows <strong>for</strong> development of transit lanes• Central location of this east-west route in south Placer County‣ I-80 is a good corridor to provide <strong>BRT</strong> service to link the south Placer area to the I-80/Wattlight rail station or to downtown Sacramento, given the planned HOV lanes both in PlacerCounty and in Sacramento County.‣ SR 65 would be a good corridor to provide <strong>BRT</strong> service if HOV lanes are developed toprovide competitive travel times <strong>for</strong> transit between Lincoln and I-80.‣ Roseville Parkway is a good corridor to provide <strong>BRT</strong> service because it links several potential<strong>BRT</strong> station locations including the Galleria Mall area and the Taylor park-and-ride lot.As development proceeds, transit service can be phased in over time. Depending on the location, sequenceand level of development, interim transit service may include express bus service, “enhanced” bus service,fixed route service, and/or shuttle service. <strong>BRT</strong> would be feasible when and where a sufficient number ofstation areas are developed at the higher densities necessary to support a new <strong>BRT</strong> route.The following planning actions are recommended to facilitate the implementation of transit service in southPlacer County:• Designate <strong>BRT</strong> station locations in new Specific Plan areas and preserve sufficient right-ofway<strong>for</strong> access, bus pick-up/drop-off areas, and park-and-ride facilities.• Adopt Specific Plans that identify land use types and densities within ½ mile of future <strong>BRT</strong>stations that are supportive of future <strong>BRT</strong> service.• Designate segments of Blue Oaks Boulevard, Fiddyment Road, Watt Avenue, and SunsetBoulevard as potential future <strong>BRT</strong> corridors and preserve sufficient right-of-way to providetwo dedicated arterial/HOV transit lanes in the future.• Designate key intersections as potential future <strong>BRT</strong> bypass locations and preserve sufficientright-of-way to provide queue bypass lanes.• Adopt a funding mechanism <strong>for</strong> new developments that provide <strong>for</strong> capital as well asoperating & maintenance costs <strong>for</strong> future transit service.• Initiate coordinate ef<strong>for</strong>ts with affected jurisdictions and transit agencies to establishmanagement, operational, phasing, and funding plans <strong>for</strong> future transit service.
<strong>Bus</strong> <strong>Rapid</strong> <strong>Transit</strong> (<strong>BRT</strong>) <strong>Implementation</strong> <strong>Study</strong> <strong>for</strong> south Placer CountySeptember 8, 20061.0 INTRODUCTION1.1 STUDY PURPOSEThe <strong>South</strong> Placer Regional Transportation Authority (SPRTA) contracted with Fehr & Peers to develop a <strong>Bus</strong><strong>Rapid</strong> <strong>Transit</strong> (<strong>BRT</strong>) <strong>Implementation</strong> <strong>Study</strong> <strong>for</strong> south Placer County. Figure 1 shows the study area of southPlacer County. This study builds on the Conceptual <strong>BRT</strong> Plan <strong>for</strong> <strong>South</strong> Placer County (April 11, 2005)prepared <strong>for</strong> Placer County. The Conceptual <strong>BRT</strong> Plan was designed to provide guidance to the county anddevelopers about the land use and station requirements <strong>for</strong> a future <strong>BRT</strong> system as well as to provide ageneral conceptual alignment.The purpose of developing this plan is to provide guidance to agencies and developers about the land useand station requirements <strong>for</strong> a future <strong>BRT</strong> system as well as to recommend future <strong>BRT</strong> routes and stations inrapidly developing areas of south Placer County. Key objectives of this plan are listed below.• Identify existing and future regional transit services that should be integrated with a future <strong>BRT</strong>system in south Placer County.• Review current development plans/proposals and their potential to support <strong>BRT</strong> service.• Review eight potential transit corridors.• Recommend <strong>BRT</strong> routes and associated station locations <strong>for</strong> potential incorporation in the circulationand land use elements of local general plans and relevant specific plans.• Identify candidate transit improvements to the study corridors.1.2 STUDY ORGANIZATIONThe remainder of this report is organized into four sections. Section 2 describes the basic concepts of <strong>BRT</strong>.Section 3 describes existing transportation facilities in south Placer County. Section 4 summarizes thepotential <strong>BRT</strong> market in south Placer County. Section 5 provides a review of eight potential <strong>BRT</strong> corridors.Three candidate <strong>BRT</strong> routes are identified in Section 6. The final section contains a description of stationtypes and recommended locations.1
Watt AveDowd AveFiddyment DrFiddyment RoadFoothills BlvdH StLincoln Pkwy·|}þ 65Nicolaus AveNicolaus Road9th StEast Ave1st StFerrari Ranch Rd·|}þ 193Sun City BlvdJoin er PkwyMoore RoadDel Webb BCity of LincolnlvdTwelve Bridges DrE. Catlett RoadSunset Blvd WestAthens RoadIndustrial AveWildcat BlvdWhitney BlvdPark DrPhillip RoadWoodcreek Oaks BlvdBlue Oaks BlvdDel Webb BlvdSunset BlvdWashington Blvd·|}þ 65 §¨¦ 80Lone Tree BlvdFairway DrOaks BlvdCity of Rocklin·|}þ 65Stan<strong>for</strong>d Ranch RoadC rest DrBaseline RoadPleasant Grove BlvdJunction BlvdCity of RosevilleMain StGalleria BlvdAtlantic StSierra College BlvdRoseville PkwyPFE RoadWallerga RoadPlacer CountyFoothills BlvdAtkinson StVernon StRiverside AveSunrise BlvdCirby WaySacramento CountyNNOT TO SCALEN:\Projects\SA05\0050\GIS\Draft\Fig1_<strong>Study</strong>Area.mxdSTUDY AREAFIGURE 1
<strong>Bus</strong> <strong>Rapid</strong> <strong>Transit</strong> (<strong>BRT</strong>) <strong>Implementation</strong> <strong>Study</strong> <strong>for</strong> south Placer CountySeptember 8, 20062.0 BASIC CONCEPTS OF <strong>BRT</strong><strong>BRT</strong> is an elaboration of the express bus concept that incorporates many light-rail transit principles. TheFederal <strong>Transit</strong> Administration (FTA) defines <strong>BRT</strong> as “a rapid mode of transportation that can provide thequality of rail transit and the flexibility of buses.” The <strong>Transit</strong> Cooperative Research Program (TCRP) hasexpanded this basic definition to describe <strong>BRT</strong> as “a flexible, rubber-tired <strong>for</strong>m of rapid transit that combinesstations, vehicles, services, running ways, and ITS elements into an integrated system with strong identity.In many respects, <strong>BRT</strong> is rubber-tired light rail transit (LRT), but with greater operating flexibility andpotentially lower costs. The main features of <strong>BRT</strong> include dedicated running ways, attractive stations,distinctive and easy-to-board vehicles, off-street fare collections, use of ITS technologies, and frequent all-dayservice (typically between 5 a.m. and midnight). The discussion below provides details about the FTAdefinition of these <strong>BRT</strong> elements. Also, a preliminary evaluation checklist <strong>for</strong> differentiating <strong>BRT</strong> service fromlocal, express, or enhanced bus service is provided in Appendix A. This checklist was developed by theSacramento Regional <strong>Transit</strong> (RT) District and helps to define why <strong>BRT</strong> service is different than traditionalbus services.2.1 RUNNING WAYSAs the key element of <strong>BRT</strong> system, running ways should allow rapid and reliable movement of buses withminimal traffic interference and provide a clear sense of presence and permanence. FTA defines fiveclassifications <strong>for</strong> running ways in terms of extent of access control as described below in the TransportationCooperative Research Program (TCRP) Report 90 – <strong>Bus</strong> <strong>Rapid</strong> <strong>Transit</strong> Volume 2: <strong>Implementation</strong>Guidelines, 2003.Class I running ways provide separate lanes with full accesscontrol, allowing uninterrupted flow <strong>for</strong> the transit vehicles.Examples of Class 1 running ways include bus tunnels, gradeseparatedbusways, and reserved freeway lanes. Separatedfrom congestion in local streets at intersections and adjacenthighways, Class I running ways provide the highest travel timesavings, the most reliable travel times and highest degree ofsafety. For this reason, these types of exclusive lanes typicallyoffer the greatest benefits but at the greatest cost.3
<strong>Bus</strong> <strong>Rapid</strong> <strong>Transit</strong> (<strong>BRT</strong>) <strong>Implementation</strong> <strong>Study</strong> <strong>for</strong> south Placer CountySeptember 8, 2006Class II running ways provide exclusive transit lanes that areseparated from the street right-of-way. They provide partial accesscontrol, allowing enhanced but not uninterrupted flow <strong>for</strong> the transitvehicles. An at-grade busway is a typical example of a Class IIrunning way. Because the Class II running ways physicallyseparate <strong>BRT</strong> vehicles from the general stream of traffic, they canguarantee travel times and reliability. However, Class II runningways have to interact with other traffic at cross streets.Class III running ways are physically separated lanes within streetright-of-way, such as arterial median busways and bus streets.Although median arterial busways are physically segregated fromadjacent street traffic lanes, Class III running ways are sometimesused by streetcars and LRT.Class IV running ways are exclusive or semi-exclusive lanes, suchas concurrent and contra flow bus lanes, located within street rightof-way.Class IV running ways are set aside as a designatedarterial lane <strong>for</strong> <strong>BRT</strong> vehicles only. However, in some cases,specified classes of vehicles are allowed to share the designatedlane such as turning vehicles or high-occupancy vehicles.Class V running ways are characterized by mixed traffic operations,where lanes are shared. The running ways have no control ofaccess, such as mixed traffic lanes. Mixed flow lanes are the mostbasic <strong>for</strong>m of Class V running way. Most rubber tired urban transitservice operates on mixed flow lanes. Because other vehiclesshare the same lane as <strong>BRT</strong> vehicles, <strong>BRT</strong> vehicles face delays dueto conflicts with other vehicles.4
<strong>Bus</strong> <strong>Rapid</strong> <strong>Transit</strong> (<strong>BRT</strong>) <strong>Implementation</strong> <strong>Study</strong> <strong>for</strong> south Placer CountySeptember 8, 20063.0 EXISTING TRANSPORTATION FACILITIESExisting and planned transportation facilities (e.g., bicycle, transit, and roadway) were reviewed andsummarized as part of the implementation study process. Figure 2 shows the existing and planned bicyclefacilities in the study area. Figure 3 shows existing local bus service, transfer stations, park-and-ride lots, andbus stops Figure 4 shows the existing commuter transit services and facilities.The key planned roadway improvements in the study area are summarized in Table 1. These improvementsare based on the Tier 1 roadway improvements contained in the Metropolitan Transportation Plan (MTP) <strong>for</strong>2025 and other funded and development conditioned improvements identified by Placer County and City ofRoseville staff.5
<strong>Bus</strong> <strong>Rapid</strong> <strong>Transit</strong> (<strong>BRT</strong>) <strong>Implementation</strong> <strong>Study</strong> <strong>for</strong> south Placer CountySeptember 8, 2006TABLE 1. STUDY AREA PLANNED ROADWAY IMPROVEMENTS BY YEAR 2025Roadway Improvement SourceBaseline Rd Widen from 2 to 4 lanes, from Fiddyment Rd to Brady Ln MTPBaseline Rd Widen from 2 to 6 lanes, from Sutter County Line to Fiddyment Rd CountyBlue Oaks Blvd Extend with 4 lanes, from Fiddyment Rd to west side of WRSP RosevilleDouglas Blvd Widen from 4 to 6 lanes, from Cavitt Stallman Rd south to Sierra College Blvd MTPFiddyment Rd Widen to 4 lanes, from Pleasant Grove Blvd to Northern City limits RosevilleFiddyment Rd Widen to 4 lanes, from Baseline Road to north end of WRSP RosevilleFoothills Blvd Extend with 2 lanes, from Sunset Blvd to Athens Rd CountyFoothills Blvd Extend with 2 lanes, from City Limits to Sunset Boulevard CountyFoothills Blvd Widen from 4 to 6 lanes, from Cirby Way to Pleasant Grove Blvd MTPNelson Rd Widen from 2 to 4 lanes, from SR 65 Bypass to Nicolaus Rd MTPPFE Rd Widen from 2 to 4 lanes, from North Antelope Rd to Roseville City Limits MTPPhilip Rd Realign with 2 lanes, between Blue Oaks Blvd and Bob Doyle Dr RosevillePlacer Parkway Construct 4 lanes between SR 65 and Fiddyment Road CountyPlacer Parkway Construct 2 lanes between Fiddyment Road and Pleasant Grove Blvd. CountyPlacer Parkway Construct 4 lanes between Pleasant Grove Blvd. and SR 99 CountyPleasant Grove Blvd Widen from 4 to 6 lanes, from Foothills Blvd to Woodcreek Oaks Blvd RosevillePleasant Grove Blvd Widen from 2 to 4 lanes, from Woodcreek Oaks Blvd to Sun City Blvd MTPPleasant Grove Blvd Extend with 4 lanes, from current terminus to West Side Drive RosevillePleasant Grove Blvd Extend with 2 lanes, west of West Side Drive RosevilleRoseville Pkwy Extend over Union Pacific Rail Road tracks RosevilleRoseville Pkwy Construct 4 lanes, from Washington Blvd to Foothills Blvd RosevilleRoseville Pkwy Widen from 2 to 4 lanes, from City Limits to Sierra College Blvd MTPSR 65 Lincoln Bypass New 4 lane expressway/freeway, from Industrial Blvd to south of Yuba County line MTPSR 65 Construct Sunset Blvd interchange MTPSR 65 Widen from 2 to 4 lanes, from Gladding to Ferrari Ranch Road MTPSR 65 Construct NB slip ramp at Pleasant Grove Blvd. interchange RosevilleSR 99 Construct Riego Rd interchange MTPSierra College Blvd Widen from 2 to 4 lanes, from Route 193 to Loomis Town Limits MTPSierra College Blvd Widen from 2 to 4 lanes, from <strong>South</strong> Rocklin City Limits to Douglas MTPSierra College Blvd Widen from 4 to 6 lanes, from Roseville City limits to Sacramento County Line MTPSierra College Blvd Widen to 6 lanes, from I-80 to <strong>South</strong> Rocklin City Limits MTPSunset Blvd Extend with 2 lanes, from Cincinnati Ave to Foothills Blvd CountySunset Blvd Widen from 2 to 4 lanes, from SR 65 to Cincinnati Ave CountySunset Blvd Extend with 2 lanes, from Foothills Blvd to Fiddyment Rd CountyWalerga Rd Widen from 2 to 4 lanes, from Baseline Rd to Sacramento County Line MTPWalerga Rd Widen bridge at Dry Creek from 2 to 4 lanes MTPWatt Ave Widen from 2 to 4 lanes, from Baseline Rd to Sacramento County Line MTPWoodcreek Oaks Blvd Widen from 2 to 4 lanes, from Junction Blvd to northern city limits MTPNotes: WRSP = West Roseville Specific PlanSource: SACOG Metropolitan Transportation Plan, 2005; Placer County and City of Roseville, 2004.6
Watt AveDowd AveFiddyment DrFiddyment RoadFoothills BlvdH StLincoln PkwyLEGENDExisting and Planned Bicycle FacilitiesClass I Bike Path·|}þ 65Class II Bike LaneNicolaus AveClass III Bike RouteNicolaus Road9th StEast AvePlanned Class I Bike PathPlanned Class II Bike LaneJoiner Pkwy1st StFerrari Ranch Rd·|}þ 193Sun City BlvdMoore RoadPlanned Class III Bike RouteNOTE:Bicycle facility in<strong>for</strong>mation within City of Roseville andLincoln provided by Bicycle Master Plans (2002).City of Rocklin and Placer County bicycle facilitiesprovided by Placer County Bicycle Master Plan.Planned facilities also identified <strong>for</strong> proposed specific plans.E. Catlett RoadDel Webb BCity of LincolnlvdTwelve Bridges DrSunset Blvd WestAthens RoadIndustrial AveWildcat BlvdWhitney BlvdPark DrPhillip RoadWoodcreek Oaks BlvdBlue Oaks BlvdDel Webb BlvdSunset BlvdWashington Blvd·|}þ 65 §¨¦ 80Lone Tree BlvdFairway DrOaks BlvdCity of Rocklin·|}þ 65Stan<strong>for</strong>d Ranch RoadC rest DrBaseline RoadPleasant Grove BlvdJunction BlvdCity of RosevilleMain StGalleria BlvdAtlantic StRoseville PkwySierra College BlvdPFE RoadWallerga RoadPlacer CountySacramento CountyFoothills BlvdAtkinson StVernon StRiverside AveSunrise BlvdCirby WayNNOT TO SCALEN:\Projects\SA05\0050\GIS\Draft\Fig2_Bikeways.mxdEXISTING AND PLANNEDBICYCLE FACILITIESFIGURE 2
Watt AveDowd AveFiddyment DrFiddyment RoadFoothills BlvdH StLincoln PkwyLEGENDWise RoadCity <strong>Transit</strong> ServicesCity of Roseville <strong>Transit</strong>·|}þ 65City of Lincoln <strong>Transit</strong>dPlacer County <strong>Transit</strong> (PCT) ServiceNicolaus AveLincoln to Sierra College!( <strong>Bus</strong> Stop¾)T<strong>Bus</strong> Transfer StationII7 ~ Park-n-Ride!(!(Nicolaus Road!(!(Joiner Pkwy9th St!( !( !( !(!(!(1st St!(!(¾) TEast Ave!(!(Ferrari Ra nch RdDel Webb BCity of LincolnSun City Blvdlvd·|}þ 193II7 ~Twelve Bridges DrE. Catlett RoadSunset Blvd WestAthens RoadIndustrial AveWildcat BlvdWhitney BlvdPark DrKing RoadPhillip RoadBaseline RoadPFE RoadWallerga Road!(!(!(!(Blue Oaks BlvdDel Webb Blvd!(Junction BlvdWoodcreek Oaks Blvd!(!(!(¾)T!(!(!(!(!(!( !(!( !(II7 ~Pleasant Grove Blvd!(!(!(!(!(!(!(!(!( !(!( !(Placer CountySacramento County!( !(!( !(!(!(!(II7 ~Foothills Blvd!(!(!(!(!(!(!(!(!(!( !( !( !(!(Sunset BlvdWashington BlvdAtkinson St·|}þ 65 §¨¦ 80!(!(!(!(!(!(!(!( !(Vernon StRiverside AveLone Tree Blvd!(!( !(!(!(!( !(II7 ~!(!( !(!(¾)T!( !(!(¾)T !(!(!( !( !(!(!( !( !( !( !( !( !( !( !( !(II7 ~!(!(!( !(!(!(Fairway Dr!(Oaks BlvdCity of RocklinMain St·|}þ 65City of RosevilleII7 ~II7 ~!(¾)T II7 ~!(!(!(!(!( !(Stan<strong>for</strong>d Ranch Road!(II7 ~Galleria BlvdAtlantic StSunrise Blvd!(!(II7 ~Cirby Way!(!( !(!(!(!(!(!(!(Crest Dr!(II7 ~!(Rosev!(!(!(!(II7 ~ille Pkwy!(!( !(!(Sierra College Blvd!(!(!(NII7 ~NOT TO SCALEN:\Projects\SA05\0050\GIS\Draft\Fig3_Local<strong>Transit</strong>.mxdEXISTING LOCAL TRANSITSERVICES AND FACILITIESFIGURE 3
Fiddyment DrFiddyment RoadFoothills BlvdH StLincoln PkwyWise RoadLEGEND·|}þ 65Taylor Road Express <strong>Bus</strong>Placer County <strong>Transit</strong> (PCT) ServiceAuburn to Watt Ave Light RailRoadWallerga RoadBlue Oaks BlvdDel Webb BlvdJunction BlvdNicolaus RoadAthens RoadWoodcreek Oaks BlvdIndustrial AveSunset Blvd!!!!!!!!!!!!!!!!!!!!!!!!!!!!!!! ! ! !!!!!!!!!!!!!!!!!!!!!!!!( P!( P·|}þ 65 !( PCity of Roseville I~!( P!( I~ !( !( P !( !( P I~!( P!( P") T!(!(!(!(!(Pleasant Grove BlvdPlacer CountySacramento CountyJoiner Pkwy9th StFoothills Blvd1st StWashington BlvdAtkinson StFerrari Ra! ! ! ! ! ! ! ! ! ! !! ! ! ! ! ! ! ! ! ! ! !Wildcat BlvdVernon StRiverside Ave!( !( !( !(!( TEast Avench RdDel Webb BCity of LincolnMain StLone Tree BlvdFairway Dr!( P!( PSun City BlvdlvdOaks BlvdWhit ney BlvdGalleria Blvd!!!!!!!!!!!!!!!!!!!!!!!!!!!!!!!!! ! ! ! ! ! ! ! ! ! ! ! ! ! ! ! ! ! ! ! ! ! ! ! ! ! ! ! ! ! ! !Twelve Bridges D rStan<strong>for</strong>d Ranch RoadAtlantic StSunrise Blvd·|}þ 193·|}þ 65 City of Rocklin§¨¦ 80Cirby WayPark DrC rest Dr!!!!!Roseville PkwyColfax - Downtown Sacramento Commuter ServiceI~ <strong>Bus</strong> Stop!( <strong>Bus</strong> Stop") T <strong>Bus</strong> Transfer Station!( T Existing PCT/Roseville <strong>Transit</strong>/RT Transfer Station!( P Park and RideSierra College BlvdKing RoadI~!( P! ! ! ! ! ! ! ! ! ! ! ! ! ! !I~Douglas BlvdBarton Road! ! ! ! ! ! ! ! ! ! ! ! ! ! ! !NAuburNOT TO SCALEN:\Projects\SA05\0050\GIS\Draft\Fig4_Commuter<strong>Transit</strong>.mxdEXISTING COMMUTER TRANSITSERVICES AND FACILITIESFIGURE 4
<strong>Bus</strong> <strong>Rapid</strong> <strong>Transit</strong> (<strong>BRT</strong>) <strong>Implementation</strong> <strong>Study</strong> <strong>for</strong> south Placer CountySeptember 8, 20064.0 POTENTIAL <strong>BRT</strong> MARKETThis section describes the potential <strong>BRT</strong> market <strong>for</strong> south Placer County. The market assessment includes areview of potential development projects, future travel demand <strong>for</strong>ecasts, and a summary of a <strong>BRT</strong> stationland use evaluation.4.1 DEVELOPMENT PROJECT REVIEWFigure 5 shows potential major transportation and development projects in the study area.Placer Ranch Specific PlanThe PSRP would be located approximately one mile west of the SR 65 and Sunset Boulevard interchange. Itincludes 6,758 dwelling units and 10.5 million square feet of non-residential uses on 2,213 acres. The projectincludes a planned Sacramento State – Placer Campus that would house 25,000 full time equivalent studentsat build-out on 290 acres. The residential units include 1,740 campus housing units on 46 acres and 5,018other housing units on 481 acres. The non-residential uses include 2.2 million square feet ofoffice/professional uses, 2.5 million square feet of business park uses, 4.2 million square feet of light industrialuses, 1.2 million square feet of commercial uses, and 0.4 million square feet of public/quasi-public uses.West Roseville Specific PlanThe WRSP is generally located west of Fiddyment Drive and north of Pleasant Grove Boulevard. It includes8,430 units on 3,162 acres. Approximately 74% of the units are planned as single family residences. Theplan includes a village center with 825 medium to high-density units. The plan also includes 34.3 acres ofindustrial uses, 74.2 acres of light industrial uses, 19.6 acres of business professional uses, and 34.1 acres ofcommunity commercial uses.Sierra Vista Specific PlanThe SVSP would be located north and east of the intersection of Baseline Road and Watt Avenue. It includes10,000 dwelling units and 1.1 million square feet of non-residential uses. The residential units include 7,500single family units and 2,500 multi-family units. The non-residential uses include 600,000 square feet of retailuses and 490,000 square feet of office uses.Regional University Specific PlanThe RUSP would be located to the west of the West Roseville Specific Plan and south of Pleasant GroveCreek. The 1,136 acre plan includes both a university campus and an adjoining mixed-use community. Thecampus would serve 6,000 students and include 1,155 housing units on 600 acres. The 537 acre mixed-usecommunity includes 3,157 residential units on 317 acres and a 22 acre commercial core.10
Locust RoadBreweBrewer RoadDowd AveFiddyment DrFiddyment RoadFoothills BlvdH StWildcat BLincoln PkwyLEGENDWise RoadWise RoadPlanned and Potential Future RoadwaysPlacer Parkway AlternativesLincoln BypassArterialCollectorNicolaus AveLincoln Bypass·|}þ 65FoskettRanchNicolaus Road9th StLincolnHighlandsEast AveSources:Placer County Department of Public Works - Transportation DivisionCity of LincolnCity of RosevilleWest Roseville Specific PlanPlacer Vineyards Specific PlanPlacer Ranch Specific PlanRegional University Specific PlanSutter CountyPlacer CountyMoore RoadE. Catlett RoadPhillip RoadSunset Blvd WestCreekviewThree D NorthThree D <strong>South</strong>Aitken PropertyPlacerRanchAthens RoadJoiner PkwyLincolnCrossingVillage 7Lincoln 270Industrial Ave1st StFerrari RaSunsetIndustrialSunset Blvdnch RdDel Webb BlvdLone Tree BlvdSun City Blvd·|}þ 193SterlingPointe·|}þ 65lvdOaks BlvdTwelve Bridges DrWhitneyRanchWhitney BlvdRegionalUniversityWest RosevilleSpecific PlanWoodcreek Oaks BlvdBlue Oaks BlvdDel Webb BlvdWashington BlvdFairway Dr·|}þ 65Stan<strong>for</strong>d Ranch RoadCurryCreekBaseline RoadSierraVistaPleasant Grove BlvdJunction BlvdMain StGalleria BlvdAtlantic StPlacer VineyardsWatt AveRioloVineyardsPFE RoadWallerga RoadDry Creek -W e s t P l a c e rSacramento CountyFoothills BlvdAtkinson StVernon StRiverside AveSunrise BlvdNCirby WayNOT TO SCALEN:\Projects\SA05\0050\GIS\Draft\Fig5_Projects.mxdPLANNED MAJOR TRANSPORTATIONAND DEVELOPMENT PROJECTSFIGURE 5
<strong>Bus</strong> <strong>Rapid</strong> <strong>Transit</strong> (<strong>BRT</strong>) <strong>Implementation</strong> <strong>Study</strong> <strong>for</strong> south Placer CountySeptember 8, 2006Placer Vineyards Specific PlanThe PVSP would be located to the south of Baseline Road and west of Dry Creek Parkway and WalergaRoad. The 5,148 acre plan area includes 14,132 dwelling units, 80 acres of commercial development, 160acres of office and professional development, and 300 acres of professional/light industrial development. Theproject includes approximately 2,850 proposed high density residential units on 190 acres.Curry Creek Community PlanThe CCCP would be located to the west of the planned Watt Avenue Extension, between the RegionalUniversity Specific Plan area and the Placer Vineyards Specific Plan area. The County is still determiningscope/uses. It is expected to include approximately 16,000 residential units and 4 million square feet of nonresidentialuses on approximately 3,000 acres. Approximately 85 percent of the residential units areanticipated to be single family units. The non-residential uses include approximately 2 million square feet ofretail uses and 2 million square feet of office uses.Riolo VineyardsThe Riolo Vineyards project would be located north of PFE Road, west of Walerga Road and east of WattAvenue. The 319 acre project includes 805 residential units, 88,000 square feet of retail uses, andneighborhood parks.Sunset Industrial AreaThe Sunset Industrial Area is located both east and west of SR 65, immediately north and south of SunsetBoulevard. The land use designations <strong>for</strong> the 8,899 acre area includes 3,615 acres of agricultural, 2,819acres of industrial, 923 acres of business park, 778 acres of public facility, 704 acres of open space, and 60acres of general commercial. The SR 65 <strong>Bus</strong>iness Park Area, one of ten planning areas within the SunsetIndustrial Area, is located at the junction of SR 65 and Whitney Boulevard.Whitney Ranch Specific PlanThe Whitney Ranch Specific Plan would be located northeast of the SR 65/Sunset Boulevard interchange. Itincludes 4,337 units on 1,296 acres. The project also includes a high school, three elementary schools, 33.9acres of commercial uses, and a 9.6 acres business park. Approximately 73 percent of the residential unitsare planned as single family residences.Lincoln 270 Specific PlanThe project would be located between SR 65 and Industrial Avenue, immediately north and south of TwelveBridges Drive. The 279 acre area includes 58 acres of general commercial, a 48 acre business park, 38acres of light industrial, a 32 acre medical campus, and 102 acres of open space.12
<strong>Bus</strong> <strong>Rapid</strong> <strong>Transit</strong> (<strong>BRT</strong>) <strong>Implementation</strong> <strong>Study</strong> <strong>for</strong> south Placer CountySeptember 8, 2006Lincoln Crossing Specific PlanThe LCSP would be located in southwest Lincoln just northeast and west of the junction of SR 65 and theplanned Lincoln Bypass. It includes 2,958 units on 1,070 acres. Approximately 80% of the units are plannedas single family residences.Aitken PropertyThe Aitken property is located in southwest Lincoln just northwest of the junction of SR 65 and the plannedLincoln Bypass. It includes 472 units on 156 acres. All of the units are planned as single family residences.Three D <strong>South</strong>The Three D <strong>South</strong> project is located in west Lincoln along the west side of the Lincoln Bypass. It includes185 units on 70 acres. All of the units are planned as single family residences.Foskett Ranch Specific PlanThe Foskett Ranch is located in north Lincoln on the west side of SR 65. It includes 323 units on 290 acres.Approximately two-thirds of the units are planned as single family residences.Lincoln HighlandsThe Lincoln Highlands project is located in north Lincoln on the east side of SR 65. It includes 196 units on48 acres. All of the units are planned as single family residences.MeadowlandsThe Meadowlands is located in north Lincoln on the east side of SR 65. It includes 84 units on 20 acres. Allof the units are planned as single family residences.Lincoln SOIThe Lincoln SOI area includes 31,551 dwelling units and 13.6 million square feet of non-residential uses. Thenon-residential uses include 5.8 million square feet of retail uses, 5.7 million square feet of office uses, and2.1 million square feet of industrial uses. The SOI is being considered via a comprehensive General PlanUpdate.Galleria ExpansionThe Galleria Expansion project is located in the City of Roseville south of State Route 65, north of RosevilleParkway, and west of Galleria Boulevard. The existing retail project includes the addition of approximately487,800 gross square feet of retail uses and new parking structures to the existing 1.28 million square footRoseville Galleria Mall.13
<strong>Bus</strong> <strong>Rapid</strong> <strong>Transit</strong> (<strong>BRT</strong>) <strong>Implementation</strong> <strong>Study</strong> <strong>for</strong> south Placer CountySeptember 8, 2006Metro Air ParkMetro Air Park is located in the northern portion of Sacramento County on the east side of SacramentoInternational Airport and the north side of I-5. The 1,900 acre development includes 8.6 million square feet ofindustrial and office space, a hotel and a golf course.<strong>South</strong> Sutter County Specific PlanThe <strong>South</strong> Sutter County Specific Plan is located just north of the Sutter County/Sacramento County line andalong the State Route 70/99 corridor. The 7,360 acre development includes up to 3,600 acres of businessand industrial uses, 17,500 residential units, and 1,000 acres of school, park, retail, and community facilityuses.4.2 FUTURE TRAVEL DEMAND FORECASTSThe landscape of south Placer County will change rather dramatically over the coming years due to plannedpopulation and employment growth. Much of this growth will occur in planned developments. Accompanyingthe growth will be improvements to the transportation system. Land use <strong>for</strong>ecasts and roadway trafficvolumes derived from the Placer County “Super Cumulative” travel demand model are used in this study toidentify locations that are good candidates <strong>for</strong> <strong>BRT</strong> stations and potential <strong>BRT</strong> routes. The Super Cumulativetravel demand model assumes a total level of development that is similar to the Blueprint land use projectionsadopted by the Sacramento Area Council of Governments, but has a different geographic allocation ofdevelopment.The model was calibrated and validated to 2004 conditions in western Placer County and has the ability to<strong>for</strong>ecast daily, AM peak hour, and PM peak hour traffic volumes.The traffic volume <strong>for</strong>ecasts are based on the land use inputs summarized in Table 2 <strong>for</strong> the south PlacerCounty area. The land use projections were developed in cooperation with Placer County, City of Roseville,City of Rocklin, City of Lincoln, and Sutter County staff and reflect potential development levels of eachdevelopment area or project. The amount of development assumed in the Super Cumulative travel modelincludes anticipated build-out of existing general plans <strong>for</strong> Placer County, Roseville, Rocklin, and Lincoln plusadditional growth beyond existing general plan levels or geographic areas. Additional growth was specificallyassumed <strong>for</strong> Placer Ranch and the Lincoln SOI Expansion Area.14
<strong>Bus</strong> <strong>Rapid</strong> <strong>Transit</strong> (<strong>BRT</strong>) <strong>Implementation</strong> <strong>Study</strong> <strong>for</strong> south Placer CountySeptember 8, 2006JurisdictionPlacer Co.RosevilleTABLE 2. SUPER CUMULATIVE LAND USE PROJECTIONSNew Development Area orResidentialDwellingEmployment (1,000 sq. ft.)ProjectUnits Retail Office Industrial- Placer Vineyards14,132 1,855 1,7640- Regional University 2 4,387 215 270- Placer Ranch6,758 1,046 5,242 4,186- Sunset Industrial Area 10 357 912 7,851- Riolo Vineyards828 88 00- Curry Creek16,200 2,025 2,1240- General Plan Area60,002 14,400 15,319 17,401- MOU Remainder Area12,600 780 1,0200CollegeEnrollment025,0000006,00000Rocklin - General Plan Area 28,606 4,586 2,848 6,494 23,000- Existing General Plan Area22,123 2,948 3,622 8,161 5,000Lincoln - SOI Expansion Area31,551 5,824 5,663 2,0680Sutter Co. - <strong>South</strong> Sutter Specific Plan 17,500 2,188 750 1,500 0Notes: (1) This is the remainder area not included in the Placer Ranch Specific Plan.(2) The CMU designation of the specific plan allows <strong>for</strong> office uses.SOI = Sphere of InfluenceSource: DKS Associates, 2005 and Fehr & Peers, 2005The circulation network needed to serve the proposed developments in south Placer County is currentlyunder development. The Super Cumulative Model is being used by the involved jurisdictions both as acommon base to evaluate the environmental impacts of proposed projects as well as to evaluate a series ofcirculation alternatives with varying roadway alignments and widths in south Placer County. The projectedvolumes on key arterial streets vary depending on the alignment of individual roadways associated with eachof the circulation alternatives. The circulation alternatives that are being studied include the northerlyalignment alternative, whose western terminus is a new interchange at SR 65/Sankey Road, <strong>for</strong> the plannedPlacer Parkway. The alignment alternatives include a new interchange either at the northern terminus of WattAvenue or the western terminus of Blue Oaks Boulevard.The range of daily traffic volumes <strong>for</strong>ecast <strong>for</strong> segments of the major freeway and roadway facilities in southPlacer County, developed by applying the Super Cumulative Model <strong>for</strong> each of the circulation alternatives, isshown below.Watt Avenue• North of Baseline Road: 52,000 – 62,00015
<strong>Bus</strong> <strong>Rapid</strong> <strong>Transit</strong> (<strong>BRT</strong>) <strong>Implementation</strong> <strong>Study</strong> <strong>for</strong> south Placer CountySeptember 8, 2006Fiddyment Road• North of Baseline Road: 43,000 – 48,000• North of Blue Oaks Road: 32,000 – 46,000Foothills Boulevard• North of Blue Oaks Road: 46,000 – 47,000State Route 65• North of Placer Parkway: 79,000 – 84,000• <strong>South</strong> of Blue Oaks Boulevard: 87,000 - 91,000• North of I-80: 149,000-152,000Baseline Road• East of Watt Avenue: 35,000 – 52,000• East of Fiddyment Drive: 49,000 - 50,000Pleasant Grove Boulevard• East of Watt Avenue: 8,000 – 23,000• East of Fiddyment Drive: 35,000 - 37,000Blue Oaks Boulevard• East of Watt Avenue: 29,000 – 32,000• East of Fiddyment Drive: 40,000 - 42,000• East of Foothills Road: 58,000 – 59,000Sunset Road• East of Watt Avenue: 24,000 – 34,000• East of Foothills Road: 44,000 – 46,000Placer Parkway• East of Watt Avenue: 79,000 – 84,000• East of Fiddyment Drive: 87,000 - 91,000• East of Foothills Road: 92,000 – 94,00016
<strong>Bus</strong> <strong>Rapid</strong> <strong>Transit</strong> (<strong>BRT</strong>) <strong>Implementation</strong> <strong>Study</strong> <strong>for</strong> south Placer CountySeptember 8, 20064.3 LAND USE THRESHOLDS TO SUPPORT BUS RAPID TRANSITLiterature review indicates that there are four main land use factors affecting transit use – residential density,employment intensity, land use diversity, and university uses.Residential DensityAt the residential (production) end, the principal land use factors that can promote transit ridership have beenaptly summarized as the three Ds: Density, Diversity (land use mixture) and Design (e.g., provision ofconvenient sidewalks and other pedestrian amenities that encourage walking). A fourth D – accessibility toconcentrated regional Destinations (such as downtown Sacramento) is also a key factor in transit use. Ofthese four D-factors, density in the transit corridor and the intensity of the concentration at the destination endof the corridor are viewed as the most significant quantifiable land use variables. 1The effectiveness of increased densities near transit in promoting transit ridership is borne out by anabundance of studies over time. Most of the debate in the literature is not over the efficacy of density inpromoting transit use, but over the degree of effectiveness and the means, specific mechanisms and cofactorsthat induce ridership in higher density settings. A positive correlation between density and transit isnot inevitable – high density in an area without transit service, or with transit service that does not meetresidents’ needs, may have negligible effects on transit use. However, density near transit increases transitpatronage by reducing the time and cost of accessing transit and <strong>for</strong> those within walking distance, eliminatingthe need <strong>for</strong> a vehicle to access transit.Nation-wide DataAn analysis of the 1995 Nationwide Personal Transportation <strong>Study</strong> (NPTS) found that the public transit share<strong>for</strong> all trips was as follows.• 2.9 percent <strong>for</strong> all densities of between 250 and 1,000 persons per square mile• 3.1 percent <strong>for</strong> all densities of between 1,000 and 4,000 persons per square mile• 3.0 percent <strong>for</strong> all densities of between 4,000 and 10,000 persons per square mile• 11 percent <strong>for</strong> densities above 10,000 per square mile.1 Going beyond land use (and the scope of this memo) yet another D, Demographics, is a very significant factor (especially if carownership is included with income, ethnicity/immigrant status as a demographic variable). For example, Dowell Myers of the School ofPolicy, Planning and Development, University of <strong>South</strong>ern Cali<strong>for</strong>nia has established that recent immigrants are much more likely to usetransit (presentation to the Alameda County CMA on April 27th, 2000). Myers research indicates that immigrants’ travel habits convergeover time, and there is little difference between the travel patterns of native-born and those of immigrants who have been in the U.S. <strong>for</strong>several decades.17
<strong>Bus</strong> <strong>Rapid</strong> <strong>Transit</strong> (<strong>BRT</strong>) <strong>Implementation</strong> <strong>Study</strong> <strong>for</strong> south Placer CountySeptember 8, 2006The significant increase in transit mode share that occurs when densities are greater than 10,000 persons persquare mile is related to average residential dwelling unit densities greater than six units per acre. Thisanalysis also showed that bicycle and walk had a larger share than transit at all density levels.Holtzclaw et al’s recent (2002) study confirms numerous studies by Holtzclaw and others that a doubling indensity results in a 25 percent reduction in vehicle miles traveled (vmt). Only a fraction of this reduction isdue to more transit use and Holtzclaw’s principle data source (e.g., Department of Motor Vehicles odometerchecks) makes transit’s specific contribution difficult to ascertain.Cali<strong>for</strong>nia Specific DataThe 1990 U.S. Census found that 17.8 percent of the total work trips by those living within 1/2 mile of a BARTstation were made on BART (Cervero, 1993). In a survey of station area adult residents living in 11multifamily, mainly rental, housing developments near BART (all but three within one-third mile of BARTstation), Cervero found a higher BART work mode split of 33 percent in the early 1990s.Cervero also studied the effect of proximity to LRT on mode choice in Sacramento. He surveyed residents offour apartment complexes near (generally less than ½ mile walking distance) Sacramento’s LRT and foundthat 12 percent of residents “main trips” (as defined by respondents) were by rail; another 3.2 percent were bybus transit (Cervero, 1993, p. 43). Looking at employment sites in suburban Sacramento that were alsowithin easy walking distance of LRT stations, he found that 6.3 percent of workers arrived by rail and another5.4 percent by bus (ibid, p. 80). It should be noted that while both the apartments and the worksites studiedby Cervero were outside downtown, they were larger and more intensely developed than most suburbandevelopments in the region.A later study using year 2000 Bay Area Travel Survey (BATS) (Cervero and Duncan 2002, p. 12) found that19.6 percent of residents living within 1/2 mile of BART commuted via transit in that year. This is slightlyhigher than the 1990 Census BART mode split <strong>for</strong> workers within the 1/2-mile radius (17.8 percent). Thissuggests that the proximity effects of rail are not too different from when Cervero conducted his earlier study.Employment IntensityA complementary issue that is often overlooked in studies of the land use and transit connection is that of thecommercial densities required to support transit use. Non-residential densities are often referred to as“intensities” and can be expressed in terms of total square footage, total employment, employment density, orfloor area ratio (FAR). Frank and Pivo (1995) found employment densities to be as or more important thanresidential densities. Using Seattle-area data, they found that bus transit ridership to employment centersrises to about 10 percent of all work trips when there are about 100 employees/acre, and exceeds 33 percentwhen employment densities exceed 200/acre. Dill (2003) studied the land use effects on rail ridership in theBay Area at the work end using large-scale employer-based surveys conducted in the early 1990s. Datawere obtained <strong>for</strong> BART station area employers as well as Caltrain and Santa Clara light rail (Valley <strong>Transit</strong>Authority or VTA) station area employers. Employers not near rail serve as a comparison group. The results18
<strong>Bus</strong> <strong>Rapid</strong> <strong>Transit</strong> (<strong>BRT</strong>) <strong>Implementation</strong> <strong>Study</strong> <strong>for</strong> south Placer CountySeptember 8, 2006indicate that a worksite’s proximity to a rail station (particularly within ¼ mile) greatly increases the chances ofemployees using rail. Proximity to a BART station had a much greater effect than proximity to a Caltrain orVTA station. Outside of San Francisco, Oakland and Berkeley, Dill found that about 5 to 6 percent of all worktrips to worksites within ½ mile of rail stations were by rail.Specific research findings related to employment intensity <strong>for</strong> potential use in this study are highlighted below.• The Seattle Metro recommended a minimum concentration of 10,000 employees to support costeffectivebus transit. This same study stated that a density of 50 employees per acre would also berequired (Seattle Metro, 1987).• The City of Portland, adopted a minimum 1.0 FAR <strong>for</strong> development within identified light rail stationareas (City of Portland, 2000).• Pushkarev and Zupan identified intensities <strong>for</strong> employment or the destination end of the service (i.e.,the CBD). For light rail transit (LRT) this is quantified as 20 – 50 million square feet of non-residentialfloorspace. (Regional Plan Association, Figure 6.4) This corresponds to 50,000 – 125,000 employeesassuming one employee/400 square feet.• The U.S. DOT/Snohomish County <strong>Transit</strong> Oriented Development (TOD) Guidelines states that FARsabove 2.0 are required to effectively support bus transit. Lower density employment areas maygenerate enough traffic to clog roads but insufficient riders to sustain effective bus service. Bycomparison, a typical suburban office complex has an FAR of 0.5 or less (Cervero, 1993b).Over what area do these densities and intensities need to occur? Cervero and Duncan (2002, p. 14) suggestthat a one-mile radius of the destination transit station is relevant. The preponderance of other studiessuggest that between one-quarter and one-half mile is the upper limit of what most Americans are willing towalk <strong>for</strong> transit access purposes. (See Cervero and Seskin, TCRP Research Results Digest, June, 1995,esp. Figures 14-16).Land Use DiversityWith respect to land use mixture (or Diversity) as a stimulus to transit ridership, the research record isdecidedly mixed. A study of the 1985 American Housing Survey, which includes questions about householdtravel (Cervero 1996 Transportation Research-A), illustrates these mixed results.• If retail shops are within 300 ft. of the transit station, transit ridership is encouraged.• If retail is 300 feet to 1 mile away from the station, residents are likely to drive and link a short shoptrip onto their journey to work.This study further finds that mixed land use does seem to encourage non-motorized trips, and is in fact abetter predictor of non-motorized trips than is residential density.19
<strong>Bus</strong> <strong>Rapid</strong> <strong>Transit</strong> (<strong>BRT</strong>) <strong>Implementation</strong> <strong>Study</strong> <strong>for</strong> south Placer CountySeptember 8, 2006On the other hand, the conditions at the employment end may be different. Cervero concluded in anotherstudy (1989) that suburban employment centers (SECs) with significant retail exhibited a 3 percent increasein transit/ridesharing use with every 10 percent increase in retail uses in the SEC. The ability to accomplishmidday errands and convenience shopping without a car influences some commuters to take transit. (Seeabove <strong>for</strong> a discussion of employment density and bus/rail ridership).University UsesCertain types of land use are “special generators” with respect to producing transit ridership; college anduniversity campuses are excellent examples of a special transit generator. Most university communities havehigher transit ridership compared to other land uses and good transit station access by vehicles, bicycles, andpedestrians. A comparison by Balsas (2003) found that the average level of transit use at eight universitycampuses was more than five times as high as transit ridership in the general population as revealed by the1995 NPTS.While high levels of transit use at university campuses has been documented extensively (e.g., Toor andHavlick, 2004), and programs to promote transit at universities have also been closely tracked (e.g., Brown,Hess and Shoup, 2001) few, if any, studies have attempted to directly model the effect of a nearby collegecampus on LRT or <strong>BRT</strong> ridership. Fehr & Peers’ ongoing research on LRT ridership in Sacramento, SaltLake City, and elsewhere may provide additional data and tools <strong>for</strong> estimating the university effect in the nearfuture, but in<strong>for</strong>mation to date is limited to analogue comparisons.Land Use Thresholds to Support <strong>Transit</strong>A variety of sources recommend residential densities of at least 4 dwelling units per acre or more <strong>for</strong> minimal(bus) transit service to be viable (Pusharkev & Zupan, 1983; ITE, 1989). Another study stated that 7 to 15dwelling units per acre can support local bus service (USDOT/Snohomish County Transportation Authority,1989). Pushkarev and Zupan (1977) examined this question thoroughly in the 1970s; their key conclusionsregarding density thresholds <strong>for</strong> various modes of transit are shown in Table 4. Pushkarev and Zupan’scriteria have been used regularly, and have generally been substantiated by other research.Two important caveats regarding Pushkarev and Zupan study are listed below.• The study is 25 years old, and much of the data is older.• Much of Pushkarev and Zupan’s data was drawn from the New York region, which, particularly in the1970s, had a bias toward transit use, while all other factors held equal.The level of auto-ownership and auto-oriented development in south Placer County in 2004 means that thereis considerably less tendency to use transit compared to the New York region. Thus while the land usethresholds <strong>for</strong> various types of transit developed by Pushkarev and Zupan are still valid, they should generallybe viewed as absolute minimum thresholds in auto-oriented regions.20
<strong>Bus</strong> <strong>Rapid</strong> <strong>Transit</strong> (<strong>BRT</strong>) <strong>Implementation</strong> <strong>Study</strong> <strong>for</strong> south Placer CountySeptember 8, 2006TABLE 3. TRANSIT MODES RELATED TO RESIDENTIAL DENSITY CRITERIAMinimum NecessaryModeServiceResidential DensityRemarks(dwelling units per acre)Many origins to manydestinations6Only if labor costs are not morethan twice those of taxisDial-a-busFixed destinations orsubscription service3.5 to 5Lower figure if labor costs twicethose of taxis; higher if thrice thoseof taxisLocal bus“Minimum,” ½ mile routespacing, 20 buses per day“Intermediate,” ½ mile routespacing, 40 buses per day“Frequent,” ½ mile routespacing, 120 buses per day4715Average, varies as a function ofdowntown size and distance fromresidential area to downtown15Express busFive buses during two hourAverage density overFrom 10 to 15 miles away to-reached on footpeak periodtwo square milelargest downtowns onlytributary areaExpress bus3From 10 to 20 miles away to-reached by auto(Park & Ride)Five to ten buses during twohour peak periodAverage density over20 square miledowntowns larger than 20 millionsquare feet of non-residential floortributary areaspaceLight railFive minute headways orbetter during peak hour9Average density <strong>for</strong> acorridor of 25 to 100square milesTo downtowns of 20 to 50 millionsquare feet of non-residential floorspace<strong>Rapid</strong> transitFive minute headways orbetter during peak hour12Average density <strong>for</strong> acorridor of 100 to 150square milesTo downtowns larger than 50million square feet of nonresidentialfloor spaceCommuter railTwenty trains a day 1 to 2Only to largest downtowns, if railline existsSource: Pushkarev and Zupan, 1977.21
<strong>Bus</strong> <strong>Rapid</strong> <strong>Transit</strong> (<strong>BRT</strong>) <strong>Implementation</strong> <strong>Study</strong> <strong>for</strong> south Placer CountySeptember 8, 20064.4 <strong>BRT</strong> STATION LAND USE EVALUATIONThe following evaluation was initially prepared <strong>for</strong> the Conceptual <strong>BRT</strong> Plan <strong>for</strong> south Placer County (April 11,2005), prepared by Fehr & Peers <strong>for</strong> the Placer County Department of Public Works. The station land useevaluation has been updated to reflect new land use data included in the Super Cumulative travel demandmodel.As the first step of identifying the potential <strong>BRT</strong> station, future land uses (i.e., population plus employment)were evaluated within the study area. Based on the station evaluation criteria described above and the landuse <strong>for</strong>ecasts, the south Placer area was divided into ½-mile grids using GIS analysis tools and ratedaccording to potential station development levels to identify the best candidate sites <strong>for</strong> future <strong>BRT</strong> stationsbased on current development plans. As shown in Figure 6, 15 initial station locations were identified throughthis review. Figure 6 shows the station location, station development level, and analogue ridershipin<strong>for</strong>mation <strong>for</strong> each station development level.The station development levels measure land use intensity in relation to increasing levels of potentialridership based on empirical data. Fehr & Peers determined a range of potential transit ridership <strong>for</strong> eachdevelopment level by identifying actual year 2000 ridership at existing analogous rail stations in Sacramentoand San Francisco Bay Area regions. These analogue stations are from a database developed by Fehr &Peers on over 80 rail station sites in northern Cali<strong>for</strong>nia. This database includes station ridership as well asstation area data on population and employment, transit service levels and other characteristics. Specifically,this database covers 40 BART stations, 33 Caltrain stations, and 11 non-downtown Sacramento LRT stations.Analogue stations <strong>for</strong> the potential <strong>BRT</strong> stations in south Placer County were identified primarily on the basisof station area population and employment (focusing on the area within one-half mile of the potential stationsite). An attempt was made to identify a “lower ridership” and “higher ridership” analogue station from boththe Sacramento and Bay Area region. Thus up to four existing analogue stations were identified <strong>for</strong> eachpotential <strong>BRT</strong> station in south Placer County.The station development level and analogue ridership in<strong>for</strong>mation on Figure 6 can be used to gauge thepotential ridership of identified station locations based on current land use plans and to compare the individualstation locations against each other. As shown, there is no ridership data <strong>for</strong> the low end of Level 1 and highend of Levels 5 and 6 because the analogue stations in Sacramento are not available.Figure 6 shows that the Placer Ranch Specific Plan area and the Galleria Mall area are two candidate <strong>BRT</strong>station sites with high ridership potential. To supplement the land use projections described above, additionaltravel in<strong>for</strong>mation was developed to assist in identifying potential <strong>BRT</strong> travel markets and corridors. Theprojected origins and destinations of travelers from the Placer Ranch and Galleria Mall areas weredetermined using the Super Cumulative Model. Table 3 shows the projected number of total daily persontrips, as aggregated into home-based-work (HBW) trips and non-home-based-work (Non-HBW) trips.22
<strong>Bus</strong> <strong>Rapid</strong> <strong>Transit</strong> (<strong>BRT</strong>) <strong>Implementation</strong> <strong>Study</strong> <strong>for</strong> south Placer CountySeptember 8, 2006TABLE 4. SELECT ZONE ANALYSIS SUMMARY 1Land Use GroupHBW DailyPerson-Trips 2Non-HBW DailyPerson-Trips 2Total Daily Person-Trips 2Placer Ranch – Residential 16,148 73,172 89,320Placer Ranch – University 7,139 79,849 86,988Placer Ranch – Employment 26,671 65,259 91,930Galleria Area – Retail 16,942 136,634 153,575Notes:1 Based on Placer County Supercumulative TDF model.2One-way person-trip.Source: Fehr & Peers, 2006.The travel model <strong>for</strong>ecasts that the Placer Ranch residential, university, and employment uses will generateapproximately 270,000 daily person trips, while the Galleria area retail uses will generate approximately150,000 daily person trips. Approximately 84 percent of the person trips generated by uses in these twoareas are non-HBW trips.A review of the assignment of trips from those areas provides the following in<strong>for</strong>mation on theorigins/destinations:‣ The most heavily traveled routes <strong>for</strong> the Placer Ranch uses are listed below.• East: Sunset Blvd., Placer Parkway & Blue Oaks to SR 65• <strong>South</strong>: Watt Ave. & Fiddyment Rd. to I-80• West: Placer Parkway to SR 70/99 and I-5• North: Fiddyment Rd. & SR 65 to Lincoln‣ The most heavily traveled routes <strong>for</strong> the Galleria retail uses are listed below.• East: SR 65 to I-80• <strong>South</strong>: Sunrise Blvd. & Hazel Ave. to Highway 50• West: I-80• North: SR 65 to Lincoln23
<strong>Bus</strong> <strong>Rapid</strong> <strong>Transit</strong> (<strong>BRT</strong>) <strong>Implementation</strong> <strong>Study</strong> <strong>for</strong> south Placer CountySeptember 8, 2006‣ Major origins/destinations <strong>for</strong> the Placer Ranch uses include Sacramento County via eitherthe Watt Avenue/Fiddyment Road corridor or the SR 65/I-80 corridor, Roseville via FiddymentRoad/Rocklin via SR 65, and Lincoln via the Fiddyment Road/SR 65 corridor.‣ Major origins/destinations <strong>for</strong> the Galleria retail uses include Sacramento County via eitherthe I-80 corridor or the Sunrise Boulevard/Hazel Avenue corridor, Roseville/Rocklin via SR 65or Roseville Parkway, and Lincoln via the SR 65 corridor.‣ As expected, HBW trips generally extended further (i.e., have longer trip lengths) than Non-HBW trips. This finding is consistent with the results of the SACOG household travel survey.‣ Placer Ranch – Residential:• 12 percent of HBW residential person-trips to Sac County• 3 percent of Non-HBW residential person-trips to Sac County‣ Placer Ranch – University:• 21 percent of HBW university trips north from Lincoln• 15 percent of HBW trips south from Sac County• 13 percent of Non-HBW trips from Lincoln• 11 percent of Non-HBW trips from Sac County‣ Placer Ranch – Employment:• 31 percent of HBW trips north from Lincoln• 22 percent of HBW employment trips south from Sac County• 17 percent of Non-HBW trips from Lincoln• 17 percent of Non-HBW trips from Sac County‣ Galleria Area – Retail:• 10 percent of Non-HBW south from Sac County• 5 percent of Non-HBW north from Lincoln4.5 PRELIMINARY <strong>BRT</strong> RIDERSHIP FORECASTSThe PCTPA is currently preparing a Long-Range <strong>Transit</strong> Plan <strong>for</strong> Placer County <strong>Transit</strong> Operators. As part ofthe development of the Long-Range <strong>Transit</strong> Plan, ridership <strong>for</strong>ecasts were prepared <strong>for</strong> three long-rangetransit system alternatives. The transit system alternatives included varying levels of <strong>BRT</strong> service. Thefollowing is a summary of the ridership results <strong>for</strong> each of the three alternatives, as documented in the DraftConceptual Service Plan.‣ Funding-Constrained Scenario:• Single <strong>BRT</strong> line• Extends planned <strong>BRT</strong> line on Watt Avenue, in Sacramento County, north to PlacerRanch via planned Placer Vineyards and West Roseville Specific Plan areas24
<strong>Bus</strong> <strong>Rapid</strong> <strong>Transit</strong> (<strong>BRT</strong>) <strong>Implementation</strong> <strong>Study</strong> <strong>for</strong> south Placer CountySeptember 8, 2006• Assumes hourly headways during peak period and off-peak period• Model <strong>for</strong>ecasts approximately 1,200 daily boardings <strong>for</strong> <strong>BRT</strong> line‣ Long-Range Scenario 1:• Single <strong>BRT</strong> line• Extends <strong>BRT</strong> line on Watt Avenue north to planned Placer Ranch area via plannedPlacer Vineyards and West Roseville Specific Plan areas• Assumes 15 minute headways during both peak period and off-peak periods• Model <strong>for</strong>ecasts approximately 2,750 daily boardings <strong>for</strong> <strong>BRT</strong> line‣ Long-Range Scenario 2:• Three <strong>BRT</strong> lines• <strong>BRT</strong> Line 1 - Extends <strong>BRT</strong> line on Watt Avenue north to Placer Ranch via plannedPlacer Vineyards and West Roseville Specific Plan areas• <strong>BRT</strong> Line 2 – New <strong>BRT</strong> line from Watt/I-80 light rail station to planned Placer Rancharea via I-80, Galleria Boulevard, Roseville Parkway, Washington Boulevard, BlueOaks Boulevard, and Fiddyment Drive• <strong>BRT</strong> Line 3 – New <strong>BRT</strong> line from Galleria Mall area to Sunrise light rail station viaRoseville Parkway, Douglas Boulevard, Sierra College Boulevard, Hazel Avenue,and Folsom Boulevard• Assumes 15 minute headways during peak periods and 30 minute headways duringoff-peak periods• Model <strong>for</strong>ecasts approximately 5,870 total daily boardings <strong>for</strong> all three <strong>BRT</strong> linesThe boardings identified above <strong>for</strong> each of the alternatives represent boardings made in Placer County only.The total number of daily boardings <strong>for</strong> Long-Range Scenario 2, including boardings in Sacramento County, isapproximately 8,200. The 5,870 boardings <strong>for</strong>ecast <strong>for</strong> the three <strong>BRT</strong> routes, <strong>for</strong> Long-Range Scenario 2,comprise about 30 percent of the total transit boardings <strong>for</strong>ecast <strong>for</strong> the 61 future bus routes (e.g., with <strong>BRT</strong>representing 3 of the 61 routes) included in this alternative.4.6 SUMMARY OF POTENTIAL <strong>BRT</strong> MARKET REVIEWAn evaluation of the projected roadway volumes, land use <strong>for</strong>ecasts, and travel patterns described aboveyields the following conclusions.‣ The type, mix and density of uses planned <strong>for</strong> the Placer Ranch Specific Plan area make itthe candidate <strong>BRT</strong> station site with the highest ridership potential.‣ The existing and planned uses in the Galleria Mall area make it a candidate <strong>BRT</strong> station sitewith high ridership potential.‣ The existing and planned uses in the H-P Campus area make it a candidate <strong>BRT</strong> station sitewith high ridership potential.25
<strong>Bus</strong> <strong>Rapid</strong> <strong>Transit</strong> (<strong>BRT</strong>) <strong>Implementation</strong> <strong>Study</strong> <strong>for</strong> south Placer CountySeptember 8, 2006‣ The uses planned <strong>for</strong> the following locations make them good candidate <strong>BRT</strong> station sites.• West Roseville Specific Plan Town Center• Placer Vineyards Center at Watt Avenue• Planned Corporate Center at SR 65/Blue Oaks Boulevard‣ The existing Taylor park-and-ride lots is a good candidate <strong>BRT</strong> station site, given its location(i.e., proximity to I-80) and its planned expansion.26
dBrewer RoadDowd AveFiddyment DrLocust RoadBrFoothills BlvdFiddyment RoadH StLincoln PkwyLEGEND·|}þ 65Planned DevelopmentFoskettRanchLincolnHighlandsStation Development Level (Population + Employment + Student)1 (0 - 2,000)Moore RoadNicolaus AveNicolaus RoadThree D NorthThree D <strong>South</strong>Aitken PropertyJoin er Pkwy9th StLincolnCrossing")TVillage 71st StFerrari RaEast Avench RdSterlingPointeDel Webb BSun City BlvdlvdOphir Road")TAuburn Folsom Road2 (2,000 - 4,000)3 (4,000 - 6,000)4 (6,000 - 8,000)5 (8,000 - 12,000)Potential Station Location1/2 Mile BufferE. Catlett RoadLincoln 270Twelve Bridges D rRegionalUniversityCurryCreekPlacer VineyardsEl Rd")TPhillip RoadSunset Blvd WestCreekviewBaseline Road")TWest RosevilleSpecific PlanWatt AveSierraVistaRioloVineyardsPFE RoadElverta Rd·|}þ 65·|}þ 65PlacerRanchSunset")TIndustrial")T ")T")T ")T")TWallerga RoadBlue Oaks BlvdDel Web b BlvdPleasant Grove BlvdJunction BlvdAthens RoadWoodcre e k Oaks BlvdDry Creek -West PlacerAntelope NorthRoseville RdIndustrial Ave")TFoothills BlvdSunset BlvdW ashington BlvdAtkin son StMain StWVernon StRiverside Aveildcat BlvdLone Tree BlvdFairway Dr")TWhitneyRanchOaks BlvdWhit ney BlvdStan<strong>for</strong>d Ranch RoadGalleria BlvdAtlantic StSunrise Blvd")T")TCirby Way")TdPark DrC res t DrRoseville PkwySierra College BlvdKing Road·|}þ 193 §¨¦ 80Douglas BlvdBarton RoadAuburn Folsom RoadStationDevelopmentLevelAuburn Folsom RoadSacramentoAnalogue LowSacramentoAnalogue HighNNOT TO SCALEBay AreaAnalogue LowBay Area Analogue High(Adjusted Ridership)Level 1 N/A Marconi/Arcade San Martin OrindaRidership: 1,540 370 1,770Level 2 Marconi/Arcade Roseville Rd Atherton N. Concord/MartinezRidership: 1,540 2,130 490 2,450Level 3 Roseville Rd 65th St Morgan Hill Dublin/PleasantonRidership: 2,130 3,620 720 8,550Level 4 College Greens Watt/I-80 Millbrae El Cerrito Del NorteRidership: 1,540 4,400 1,610 9,950Level 5 Watt/I-80 N/A San Mateo Balboa ParkRidership: 4,400 2,220 11,000TOD ScenarioLevel 6N/A N/A Palo Alto BerkeleyRidership: 3,940 13,600N:\Projects\SA05\0050\GIS\Draft\Fig6_<strong>BRT</strong>_Station.mxdPOTENTIAL <strong>BRT</strong> STATION AREA EVALUATIONS -BASED ON PLACER COUNTY SUPERCUMULATIVE MODELFIGURE 6
<strong>Bus</strong> <strong>Rapid</strong> <strong>Transit</strong> (<strong>BRT</strong>) <strong>Implementation</strong> <strong>Study</strong> <strong>for</strong> south Placer CountySeptember 8, 20065.0 REVIEW OF POTENTIAL TRANSIT CORRIDORSThis section provides a review of nine potential transit corridors in south Placer County. Figure 7 shows thelocation of the corridors.5.1 WATT AVENUE CORRIDORCurrent ConditionsThe northern terminus of Watt Avenue is at Baseline Road in south Placer County. <strong>South</strong> of Baseline Road,Watt Avenue is two lanes wide until it reaches Elverta Road, where it becomes a four-lane to six-lane roadbetween Elverta Road and I-80.Facility PlansThe extension of Watt Avenue, north from Baseline Road to the Placer Parkway corridor, is planned to servethe proposed Regional University Specific Plan area and the future Curry Creek development. The PlacerCounty General Plan designates Watt Avenue as an arterial transit corridor. The transit corridor designationis intended to facilitate the development of land use and design standards that promote the viability of highcapacitytransit in those corridors where there is a significant amount of undeveloped land. The arterial transitcorridors would have transit access almost continuously along the corridor where development is present.The Sacramento County General Plan calls <strong>for</strong> Watt Avenue, north to the Sacramento/Placer county line, tobe a six-lane thoroughfare and feeder transit line network transportation corridor (i.e., designed to providehigher speed transit service that feed major transit lines such as light rail transit along the I-80 corridor).SACOG’s Metropolitan Transportation Plan <strong>for</strong> 2025 included a <strong>BRT</strong> project along Watt Avenue, with aproject cost of $20 million. The Sacramento Regional <strong>Transit</strong> District (RT) 20-year Vision includes <strong>BRT</strong> onWatt Avenue from Bond Road in Elk Grove north to Elverta Road.Opportunities & ConstraintsA number of opportunities make Watt Avenue a strong candidate <strong>for</strong> future <strong>BRT</strong> service. This includes theexisting Watt/I-80 light rail station, the emerging job center at McClellan <strong>Bus</strong>iness Park, and the identificationof Watt Avenue as a <strong>BRT</strong> corridor in the plans described above. The primary constraints include theprojected congestion levels on Watt Avenue and residential development that borders one or both sides of theroadway in Sacramento County. The Mobility Strategies <strong>for</strong> County Corridors, a report prepared <strong>for</strong>Sacramento County (September, 2004) identified a major transitway alternative that would provide an eightlanecouplet between Antelope Road and James Way. The couplet would provide three mixed flow lanes andan exclusive HOV/<strong>BRT</strong> lane in this segment.28
<strong>Bus</strong> <strong>Rapid</strong> <strong>Transit</strong> (<strong>BRT</strong>) <strong>Implementation</strong> <strong>Study</strong> <strong>for</strong> south Placer CountySeptember 8, 20065.2 PLEASANT GROVE BOULEVARD CORRIDORCurrent ConditionsPleasant Grove Boulevard links Fiddyment Road at its western terminus to SR 65. It ranges from a two-laneto four-lane section between its western terminus at Fiddyment Road and Foothills Boulevard, to six lanesbetween Foothills Boulevard and SR 65.Facility PlansConceptual plans being developed call <strong>for</strong> Pleasant Grove Boulevard to be six lanes from Foothills Boulevardwest to Woodcreek Oaks Boulevard, and four lanes from Woodcreek Oaks Boulevard west to the RegionalUniversity Specific Plan.Opportunities & ConstraintsMuch of Pleasant Grove Boulevard, east of Fiddyment Road, has been developed as relatively low densityhousing that would not support <strong>BRT</strong> service levels.5.3 BLUE OAKS BOULEVARD CORRIDORCurrent ConditionsBlue Oaks Boulevard links Fiddyment Road at its western terminus to SR 65. It ranges from a two-lanesection at its western terminus to four lanes at SR 65.Facility PlansRight-of-way is dedicated along Blue Oaks Boulevard <strong>for</strong> an eight-lane facility. Conceptual plans call <strong>for</strong> BlueOaks Boulevard to be six lanes from SR 65 west to Placer Parkway. The Placer County General Plandesignates Blue Oaks Boulevard as an arterial transit corridor. The transit corridor designation is intended tofacilitate the development of land use and design standards that promote the viability of high-capacity transitin those corridors where there is a significant amount of undeveloped land. The arterial transit corridorswould have transit access almost continuously along the corridor where development is present.Opportunities & ConstraintsA number of opportunities make Blue Oaks Boulevard a strong candidate <strong>for</strong> future <strong>BRT</strong> service. Thisincludes the eight-lane right-of-way that is being preserved, its designation as an arterial transit corridor, itscentral east-west location, and access to both the existing H-P campus area and the planned corporatecenter at SR 65 and Blue Oaks Boulevard. There are presently no significant constraints on the developmentof potential transit service along Blue Oaks Boulevard.29
<strong>Bus</strong> <strong>Rapid</strong> <strong>Transit</strong> (<strong>BRT</strong>) <strong>Implementation</strong> <strong>Study</strong> <strong>for</strong> south Placer CountySeptember 8, 20065.4 PLACER PARKWAY CORRIDORFacility PlansThe objective of the Placer Parkway Corridor Preservation project is to identify and preserve an approximate15-mile corridor, between SR 65 and SR 70/99, ranging in width from 500 to 1,000 feet. The corridor width willvary among three segments:• East – 500 ft. wide from SR 65 to Fiddyment Rd.• Central -- 1,000 ft. wide from Fiddyment Rd. to Pleasant Grove Rd.• West -- 500 ft. wide from Pleasant Grove Rd. to SR 70/99The future four-to six-lane roadway will have up to seven interchanges:• SR 65 @ Whitney Ranch Parkway• Foothills Boulevard• Fiddyment Rd.• Watt Ave./Blue Oaks Blvd.• Up to two in Sutter County’s future <strong>South</strong> Sutter Co. Specific Plan area• SR 70/99 (between Riego Rd. and Sankey Rd.)Opportunities & ConstraintsThe Placer Parkway would provide a continuous median with a minimum width of 100 feet. This mediancould be used <strong>for</strong> future transit service. The Placer Parkway project includes a “no-development buffer” thatwould prohibit development on either side of the facility through the implementation of conservationeasements. There is the potential to develop express bus service along the corridor with park-and-ride lots atthe interchanges. Future bus service along the corridor could link <strong>South</strong> Placer County with futuredevelopment at Metro Air Park and/or the <strong>South</strong> Sutter Specific Plan area. Since there would be nodevelopment within 500-1,000 feet of the corridor right-of-way boundary, access to any future stations at theinterchanges would likely be primarily by auto, local bus, or bicycle. There are presently no significantconstraints on the development of potential transit service along Placer Parkway.5.5 STATE ROUTE 65 CORRIDORCurrent ConditionsSR 65 is currently a four-lane freeway from I-80 north past Blue Oaks Boulevard.30
<strong>Bus</strong> <strong>Rapid</strong> <strong>Transit</strong> (<strong>BRT</strong>) <strong>Implementation</strong> <strong>Study</strong> <strong>for</strong> south Placer CountySeptember 8, 2006Facility PlansThe Transportation Concept Report (July, 2001) <strong>for</strong> SR 65 calls <strong>for</strong> the segment between I-80 and the BlueOaks Boulevard interchange to be a six-lane freeway <strong>for</strong> the twenty-year planning horizon and an eight-lanefreeway <strong>for</strong> ultimate planning purposes. The segment between the Blue Oaks Boulevard interchange andIndustrial Avenue is planned to be a four-lane freeway <strong>for</strong> the twenty-year planning horizon and a six-lanefreeway <strong>for</strong> ultimate planning purposes.Opportunities & ConstraintsThe existing right-of-way width of SR 65 may be a constraint <strong>for</strong> the development of potential transit servicealong SR 65, given the need <strong>for</strong> the facility to be six to eight lanes wide. There are opportunities to provideHOV lanes on SR 65 and a direct HOV connector with I-80. There is the potential to develop <strong>BRT</strong>, enhancedbus, and/or express bus service along the corridor with park-and-ride lots at the interchanges.5.6 INTERSTATE 80 CORRIDORCurrent ConditionsInterstate 80 is currently eight lanes from SR 65 to Eureka Road and six lanes west to Douglas Boulevard.Facility PlansThe Interstate 80 (I-80) project will widen the freeway from the Placer/Sacramento County line (approximatelyRiverside Ave/Auburn Blvd) all the way to SR 65. The existing carpool lanes in Sacramento County will beextended to SR 65 in both the eastbound and westbound directions, and auxiliary lanes will be addedbetween the interchanges. The Transportation Concept Report (January, 2001) <strong>for</strong> I-80 calls <strong>for</strong> the segmentbetween the Sacramento/Placer County Line and the Sierra College Boulevard interchange to be an eightlanefreeway with HOV lanes <strong>for</strong> the twenty-year planning horizon and a ten lane freeway with HOV lanes <strong>for</strong>ultimate planning purposes. Auxiliary lanes are also identified between Riverside and SR 65.Opportunities & ConstraintsThere are presently no significant constraints on the development of potential transit service along I-80.There are opportunities to provide HOV lanes on I-80 and a direct HOV connector with SR 65. There is thepotential to develop <strong>BRT</strong>, enhanced bus, and/or expanded express bus service along the corridor with parkand-ridelots at the interchanges.5.7 ROSEVILLE PARKWAY CORRIDORCurrent ConditionsRoseville Parkway is a six-lane roadway from Washington Boulevard to Douglas Boulevard.31
<strong>Bus</strong> <strong>Rapid</strong> <strong>Transit</strong> (<strong>BRT</strong>) <strong>Implementation</strong> <strong>Study</strong> <strong>for</strong> south Placer CountySeptember 8, 2006Facility PlansThe Roseville General Plan shows no plan to widen Roseville Parkway.Opportunities & ConstraintsRoseville Parkway is largely developed, both in terms of the roadway facility and adjacent property. Thereare limited opportunities to provide exclusive transit lanes and/or queue bypass lanes without significant rightof-wayacquisition and cost.5.8 DOUGLAS BOULEVARD CORRIDORCurrent ConditionsDouglas Boulevard ranges from a two-lane roadway at its western terminus at Vernon Street, to a six-laneroadway east of I-80. The I-80/Douglas Boulevard interchange was recently reconstructed.Facility PlansThe Roseville General Plan shows no plan to widen Douglas Boulevard between Vernon Street and EurekaRoad.Opportunities & ConstraintsDouglas Boulevard is largely developed, both in terms of the roadway facility and adjacent property. Thereare limited opportunities to provide exclusive transit lanes and/or queue bypass lanes without significant rightof-wayacquisition and cost.5.9 EUREKA ROAD CORRIDORCurrent ConditionsEureka Road is a six-lane roadway from I-80 to Douglas Boulevard.Facility PlansThe Roseville General Plan calls <strong>for</strong> Eureka Road to be seven lanes between Taylor Road and a point midwaybetween N. Sunrise Avenue and Rocky Ridge Drive and six lanes <strong>for</strong> the remaining segment to DouglasBoulevard.32
<strong>Bus</strong> <strong>Rapid</strong> <strong>Transit</strong> (<strong>BRT</strong>) <strong>Implementation</strong> <strong>Study</strong> <strong>for</strong> south Placer CountySeptember 8, 2006Opportunities & ConstraintsEureka Road is largely developed, both in terms of the roadway facility and adjacent property. There arelimited opportunities to provide exclusive transit lanes and/or queue bypass lanes without significant right-ofwayacquisition and cost.5.10 SUMMARY OF POTENTIAL <strong>BRT</strong> CORRIDOR REVIEWAn evaluation of the opportunities and constraints presented above, as well as projected roadway volumesand land use <strong>for</strong>ecasts presented in the previous section, yields the following conclusions:‣ Watt Avenue is an ideal corridor to provide <strong>BRT</strong> service <strong>for</strong> the following reasons:• Designation as a transit corridor in the Placer County General Plan• Designation as a feeder transit corridor in the Sacramento County General Plan• Ability to establish a right-of-way that can support transit• Plans to provide <strong>BRT</strong> service along Watt Avenue in the Sacramento County portionof the corridor‣ Blue Oaks Boulevard is an ideal corridor to provide <strong>BRT</strong> service <strong>for</strong> the following reasons:• Designation as a transit corridor in the Placer County General Plan• Eight-lane right-of-way allows <strong>for</strong> development of transit lanes• Central location of this east-west route in south Placer County‣ I-80 is a good corridor to provide <strong>BRT</strong> service to link the south Placer area to the I-80/Wattlight rail station or to downtown Sacramento, given the planned HOV lanes both in PlacerCounty and in Sacramento County.‣ SR 65 would be a good corridor to provide <strong>BRT</strong> service if HOV lanes are developed toprovide competitive travel times <strong>for</strong> transit between Lincoln and I-80.‣ Roseville Parkway is a good corridor to provide <strong>BRT</strong> service because it links several potential<strong>BRT</strong> station locations including the Galleria Mall area and the Taylor park-and-ride lot.33
Dowd AveNicolaus RoadNicolaus AveLEGENDH StPleasant Grove Road1st StBrewer RoadPotential <strong>Transit</strong> Corridors·|}þ 193Planned RoadwaysMoore RoadLincoln PkwyNNOT TO SCALEPark DrFiddyment RoadKing RoadSunset Blvd WestC rest DrPhillip RoadFoothills Blvd§¨¦ 80Pleasant Grove RoadLocust RoadSierra College BlvdPacific AveFiddyment DrPowerline RoadRoseville PkwyMain StBaseline RoadWatt AveRiverside AveCirby WayPFE RoadElverta RdPOTENTIAL TRANSIT CORRIDORSFIGURE 7Nicolaus AveLincolnHighlands·|}þ 65FoskettRanch9th StEast Avench RdSun City BlvdFerrari RaJoiner PkwyPacific AvelvdDel Webb BEl Centro BlvdTwelve Bridges D rE. Catlett RoadCatlett RoadWildcat BAthens RoadWhit ne y Blvd·|}þ 99 Three D <strong>South</strong>SterlingPointeAitken PropertyLincolnCrossingVillage 7Lincoln 270Whitney·|}þ 65 RanchPlacerRanchSunsetIndustrialCreekviewRegionalUniversity,West RosevilleSpecific Plan·|}þ 65,CurrySierraCreekVistaPlacer VineyardsDry Creek -West PlacerRioloVineyards·|}þ 99§¨¦ 80Three D North,,,lvdIndustrial AveHowsley RoadOaks BlvdSunset BlvdLone Tree BlvdFifield RoadStan<strong>for</strong>d Ranch RoadBlue Oaks BlvdFairway DrWashington BlvdWoodcre ek Oaks BlvdKeys RoadDel Webb BlvdSankey RoadGalleria BlvdPleasant Grove BlvdNatomas RoadAtlantic StJunction BlvdVernon StFoothills BlvdRiego RoadAtkinson StSunrise BlvdWallerga RoadLe vee Road,Roseville RdOld Auburn Rd,Antelope North RdElverta RdElverta RdAntelope RdN:\Projects\SA05\0050\GIS\Draft\Fig7_Potential_<strong>Transit</strong>.mxd
<strong>Bus</strong> <strong>Rapid</strong> <strong>Transit</strong> (<strong>BRT</strong>) <strong>Implementation</strong> <strong>Study</strong> <strong>for</strong> south Placer CountySeptember 8, 20066.0 <strong>BRT</strong> ROUTE PLANThis section identifies three potential <strong>BRT</strong> routes <strong>for</strong> south Placer County.6.1 BACKGROUNDThere are a limited number of developed areas within south Placer County that have population and/oremployment densities that can presently support <strong>BRT</strong> service. The potential <strong>BRT</strong> routes are thus designed toserve developing areas in south Placer County that are being planned <strong>for</strong> higher densities. The <strong>BRT</strong> routeswould provide connections from these new developing areas to existing major commercial centers in southPlacer County, to major transit routes (i.e., light rail lines) in Sacramento County, and/or to major park-andridelots.The Placer Ranch Specific Plan area shows the greatest potential as a major transit hub, based on the DraftSpecific Plan that plans <strong>for</strong> a Sacramento State-Placer Campus that would serve up to 25,000 students. Twoof the three candidate <strong>BRT</strong> routes identified below would have a transit center at the planned CSUS-PlacerCampus serving as the northern terminal. The Placer Vineyards and West Roseville Specific Plan areas haveplanned land uses that would support a transit center or station on one of the <strong>BRT</strong> routes. The Galleria, theH-P Campus, and the Taylor park-and-ride lots are existing developed areas that would support a <strong>BRT</strong> transitstation.<strong>Implementation</strong> of any of the three candidate <strong>BRT</strong> routes requires that the following actions be accomplished:• Specific Plans <strong>for</strong> new development are approved with population and employment densities thatwould support <strong>BRT</strong>.• Minimum residential density of 9 dwelling units per acres (within ½ mile of station)• Minimum non-residential FAR of 1.0 (within ½ mile of station)• Right-of-way <strong>for</strong> improvements along the <strong>BRT</strong> routes and at <strong>BRT</strong> stations is preserved and/oracquired both in new development areas and in areas that have existing development.• The land use programs in the Specific Plans, particularly those areas that have higher populationand employment densities that would be served by <strong>BRT</strong>, are developed as planned andapproved.• A funding mechanism is adopted <strong>for</strong> capital as well as operating & maintenance costs <strong>for</strong> the <strong>BRT</strong>routes.• Coordination ef<strong>for</strong>ts with multiple jurisdictions and transit agencies occur to establishmanagement, operational, and funding mechanisms and protocols <strong>for</strong> the routes.35
<strong>Bus</strong> <strong>Rapid</strong> <strong>Transit</strong> (<strong>BRT</strong>) <strong>Implementation</strong> <strong>Study</strong> <strong>for</strong> south Placer CountySeptember 8, 20066.2 CANDIDATE <strong>BRT</strong> ROUTESFigure 8 shows three candidate <strong>BRT</strong> routes <strong>for</strong> south Placer County. <strong>BRT</strong> Route 1 would link theSacramento State-Placer Campus (Placer Ranch Specific Plan), the H-P campus, the planned corporatecenter at Blue Oaks Boulevard and Washington Boulevard, the Galleria area, and the Watt/I-80 light railstation via SR 65 and the planned I-80 HOV lanes.<strong>BRT</strong> Route 2 would link the Sacramento State-Placer Campus (Placer Ranch Specific Plan), the WestRoseville Specific Plan town center, and the Placer Vineyards Specific Plan with the planned <strong>BRT</strong> extensionalong Fiddyment Road, local streets in the West Roseville and Sierra Vista developments, and Watt Avenueto Elverta Road.<strong>BRT</strong> Route 3 would link the Galleria area and the Taylor park-and-ride lot with the Hazel and Sunrise light railstations. The route would utilize Roseville Parkway, a short portion of Douglas Boulevard, Sierra CollegeBoulevard, Hazel Avenue, and Folsom Boulevard.Preliminary travel <strong>for</strong>ecasts prepared <strong>for</strong> the Placer County Long Range <strong>Transit</strong> Plan indicate thatimplementation of the three <strong>BRT</strong> routes would generate approximately 5,900 daily boardings at build-out,assuming 15 minute peak hour headways and 30 minute off-peak headways.All of the <strong>BRT</strong> routes could be phased in over time, with initial service provided either as enhanced bus and/orexpress bus type service. <strong>Implementation</strong> considerations that are specific to the three routes are summarizedbelow.• <strong>BRT</strong> Route 1 (CSUS-Placer Campus to Galleria to Watt/I-80 LRT Station via I-80)• Initial phases of the CSUS-Placer Campus would need to be in place.• Coordination with RT on bus plat<strong>for</strong>m use at the Watt/I-80 LRT station.• <strong>BRT</strong> Route 2 (CSUS-Placer Campus to Placer Vineyards to Watt/I-80 LRT Station via Watt Ave.)• Initial phases of the CSUS-Placer Campus would need to be in place.• The West Roseville Specific Plan town center would need to be in place.• The planned Watt Avenue <strong>BRT</strong> line in Sacramento County would have to be in place.• Coordination with RT on bus plat<strong>for</strong>m use at the Watt/I-80 LRT station.• <strong>BRT</strong> Route 3 (Galleria to Hazel & Sunrise LRT stations via Sierra College Blvd./Hazel Ave.)• Coordination with RT on bus drop-off area use at the Hazel and Sunrise LRT stations.It is anticipated that <strong>BRT</strong> Route 1 might be implemented first because it would serve several existing activitycenters and Placer County jurisdictions would control the implementation of needed route improvements.<strong>Implementation</strong> of <strong>BRT</strong> Route 2 would require that Regional <strong>Transit</strong> implement <strong>BRT</strong> service in SacramentoCounty between I-80 and Sacramento County/Placer County line first, as it would not be cost-effective <strong>for</strong>36
<strong>Bus</strong> <strong>Rapid</strong> <strong>Transit</strong> (<strong>BRT</strong>) <strong>Implementation</strong> <strong>Study</strong> <strong>for</strong> south Placer CountySeptember 8, 2006Placer County to fund the operating costs <strong>for</strong> both the Sacramento County and Placer County portions of a<strong>BRT</strong> route serving the Watt Avenue corridor. As noted above, express bus service could be provided in theWatt Avenue corridor as an interim service, prior to <strong>BRT</strong> service being implemented in Sacramento County byRT.6.3 RECOMMENDED CORRIDOR IMPROVEMENTSRecommended improvements <strong>for</strong> the three <strong>BRT</strong> routes are shown in Figures 9-11 and are described below.Section 7 provides recommendations <strong>for</strong> station locations.<strong>BRT</strong> Route 1• Provision of dedicated HOV lanes on SR 65 (or HOT lanes) with a direct HOV connector from SR 65to/from I-80• Provision of HOV drop ramps from Roseville Parkway to and from the west via I-80• Provision of a dedicated Arterial HOV/<strong>Transit</strong> lane on Blue Oaks Boulevard (i.e., six mixed flow lanesand two exclusive HOV/<strong>BRT</strong> lanes) from Fiddyment Road to Washington Boulevard• Provision of a dedicated Arterial HOV/<strong>Transit</strong> lane on Fiddyment Road (i.e., four mixed flow lanes andtwo exclusive HOV/<strong>BRT</strong> lanes) from Sunset Boulevard to Blue Oaks Boulevard• Provision of queue jump lanes at the intersections of Blue Oaks Boulevard/Washington Boulevard,Roseville Parkway/Washington Boulevard, and Roseville Parkway/Galleria Boulevard• Provision of transit signal priority from the Sacramento State – Placer Campus station to the SR65/Galleria Boulevard interchange<strong>BRT</strong> Route 2• Provision of a dedicated Arterial HOV/<strong>Transit</strong> lane on Fiddyment Road (i.e., four mixed flow lanes andtwo exclusive HOV/<strong>BRT</strong> lanes) from Sunset Boulevard to Del Webb Boulevard• Provision of a dedicated Arterial HOV/<strong>Transit</strong> lane on Watt Avenue (i.e., four mixed flow lanes andtwo exclusive HOV/<strong>BRT</strong> lanes) from Sacramento/Placer County line to Pleasant Grove Boulevard• Provision of transit signal priority along Fiddyment Road and Watt Avenue<strong>BRT</strong> Route 3• Provision of queue jump lanes at the intersections of Roseville Parkway/Galleria Boulevard andDouglas Boulevard/Sierra College Boulevard• Provision of transit signal priority along Roseville Parkway, Douglas Boulevard, and Sierra CollegeBoulevard37
<strong>Bus</strong> <strong>Rapid</strong> <strong>Transit</strong> (<strong>BRT</strong>) <strong>Implementation</strong> <strong>Study</strong> <strong>for</strong> south Placer CountySeptember 8, 2006Intelligent Transportation Systems (ITS) have played an important role to help transit agencies increasesafety, operational efficiency and quality of <strong>BRT</strong> service. ITS applications are also fundamental to greatlyenhancing <strong>BRT</strong> operations and achieving <strong>BRT</strong> system objectives including safety, reliability, efficiency, andpassenger in<strong>for</strong>mation availability. The main ITS elements <strong>for</strong> <strong>BRT</strong> include the following (TCRP Report 90):• Automatic Vehicle Location and Control (AVLC)• Passenger In<strong>for</strong>mation System• Traffic Signal Priorities• Automated Passenger Counting• Electronic Fare Collection• Vehicle Guidance and ControlAccording to TCRP Report 90, bus delays at traffic signal account <strong>for</strong> 10 to 20 percent of overall bus traveltimes and 50 percent or more of all delays. Traffic signal controls <strong>for</strong> <strong>BRT</strong> pre-emption as well as a range ofpriorities (i.e., passive, active, and real-time). Pre-emption is the highest level of control as it results inchanges to the normal signal phasing and sequencing; it has had limited use, though, given its impact onsignal coordination and pedestrians. The implementation of real-time signal priorities, which consider bothauto and bus arrivals when making adjustments to the traffic signal, have been somewhat limited given theneed <strong>for</strong> specialized equipment. The most frequently applied signal priorities are active or passive signalpriority, which improve <strong>BRT</strong> speeds by modifying existing signal operations.38
Dowd AveNicolaus Road9th StNicolaus AveH StPleasant Grove Road1st StBrewer RoadMoore RoadLincoln PkwyE. Catlett RoadAthens RoadFiddyment RoadSunset Blvd WestPhillip RoadFoothills BlvdPleasant Grove RoadLocust RoadPacific AveFiddyment DrPowerline RoadMain StBaseline RoadWatt AveRiverside AveCirby WayPFE RoadElverta RdLEGENDFoskett<strong>BRT</strong> Route 1<strong>BRT</strong> Route 2<strong>BRT</strong> Route 3·|}þ193Planned RoadwaysNNOT TO SCALE§¨¦ 80ToHazel and SunriseLight Rail Stations(via Sierra College Blvd.)<strong>BRT</strong> ROUTESLincolnHighlandsRanchThree D NorthThree D <strong>South</strong>SterlingPointeAitken PropertyLincolnCrossingVillage 7Lincoln 270PlacerRanchSunsetCreekviewIndustrialRegionalUniversityWest Roseville·|}þ 65 WhitneyRanchSpecific PlanCurrySierraCreekVistaPlacer VineyardsDry Creek -West Placer·|}þ 193Riolo·|}þ 65§¨¦ 80VineyardsTo Watt/I-80 LRT(via Watt Ave.) To Watt/I-80 LRT(via I-80 HOV)·|}þ 65 Nicolaus AveFerrari Ra nch RdSun City BlvdJoiner PkwyTwelve Bridges D rPark DrWhitney BlvdWildcat BlvdIndustrial AveKing RoadSunset BlvdCrest DrLone Tree BlvdStan<strong>for</strong>d Ranch RoadBlue Oaks BlvdFairway DrWashington BlvdWoodcre ek Oaks BlvdSierra College BlvdGalleria BlvdPacific AveEast AvelvdDel Webb BEl Centro BlvdCatlett RoadHowsley RoadOaks BlvdFifield RoadKeys RoadDel Web b BlvdSankey RoadPleasant Grove BlvdNatomas RoadRoseville PkwyAtlantic StJunction BlvdVernon StFoothills BlvdRiego RoadAtkinson StSunrise BlvdWallerga RoadLe vee Road,,Roseville RdOld Auburn RdAntelope North RdElverta RdElverta Rd,Antelope RdN:\Projects\SA05\0050\GIS\Draft\Fig8_rec_<strong>BRT</strong>_Routes.mxdFIGURE 8
Dowd AveNicolaus RoadNicolaus AveH StPleasant Grove Road1st StBrewer RoadMoore RoadLincoln PkwyE. Catlett RoadAthens RoadFiddyment RoadSunset Blvd WestPhillip RoadFoothills BlvdPleasant Grove RoadLocust RoadPacific AveFiddyment DrPowerline RoadMain StBaseline RoadWatt AveRiverside AveCirby WayPFE RoadElverta Rd·|}þ 65 LEGENDLincolnHighlands<strong>BRT</strong> Route 1Planned RoadwayshQueue Jump Lanes·|}þ 193SterlingPointeN·|}þ 65 WhitneyRanchNOT TO SCALESunsetIndustrialBlue Oaks Blvd.Dedicated Arterial HOV /<strong>Transit</strong> LanesState Route 65hHOV or HOT Lane withDirect Connector to I-80h·|}þ 65§¨¦ 80hRoseville ParkwayAlternate Route -HOV Drop Ramps to I-80To Watt/I-80 LRT(via I-80 HOV)CANDIDATE <strong>BRT</strong> ROUTE 1 IMPROVEMENTSNicolaus Ave9th StFerrari Ra nch RdSun City BlvdJoiner PkwyTwelve Bridges D rPark DrWhit ney BlvdWildcat BlvdIndustrial AveKing RoadSunset BlvdCrest DrLone Tree BlvdStan<strong>for</strong>d Ranch RoadBlue Oaks BlvdFairway DrWashington BlvdSierra College BlvdGalleria BlvdWoodcreek Oaks BlvdPacific AveEast AvelvdDel Webb BEl Centro BlvdCatlett RoadHowsley RoadOaks BlvdFifield RoadKeys RoadDel Web b BlvdSankey RoadPleasant Grove BlvdNatomas RoadRoseville PkwyAtlantic StJunction BlvdVernon StFoothills BlvdRiego RoadAtkinson StSunrise Blvd·|}þ 99 Three D <strong>South</strong>Aitken PropertyLincolnCrossingVillage 7Lincoln 270PlacerRanchFiddyment Rd.Dedicated Arterial HOV /<strong>Transit</strong> LanesCreekviewRegionalUniversityWest RosevilleSpecific PlanCurrySierraCreekVistaPlacer VineyardsDry Creek -West PlacerRiolo§¨¦ 80Wallerga RoadLe vee RoadVineyardsFoskettRanchThree D North,Roseville RdOld Auburn RdAntelope North RdElverta RdElverta RdAntelope RdN:\Projects\SA05\0050\GIS\Draft\Fig9_Route1_Imp.mxdFIGURE 9
Dowd AveNicolaus RoadNicolaus AveH StPleasant Grove Road1st StBrewer RoadMoore RoadLincoln PkwyE. Catlett RoadAthens RoadFiddyment RoadSunset Blvd WestPhillip RoadFoothills BlvdPleasant Grove RoadLocust RoadPacific AveFiddyment DrPowerline RoadMain StBaseline RoadWatt AveRiverside AveCirby WayPFE RoadElverta RdFoskett<strong>BRT</strong> Route 2Planned Roadways·|}þ·|}þ 193NNOT TO SCALE§¨¦ 80CANDIDATE <strong>BRT</strong> ROUTE 2 IMPROVEMENTSLincolnHighlandsRanchThree D NorthThree D <strong>South</strong>SterlingPointeAitken PropertyLincolnCrossingVillage 7Lincoln 270PlacerRanchSunsetIndustrialFiddyment Rd.Dedicated Arterial HOV/<strong>Transit</strong> LanesCreekviewRegionalUniversityWest Roseville·|}þ 65 WhitneyRanch·|}þ 65Specific PlanCurrySierraCreekVistaPlacer VineyardsDry Creek -West PlacerRioloWatt Ave.Vineyards§¨¦ 80Dedicated Arterial HOV/<strong>Transit</strong> Lanes·|}þ 65 LEGENDNicolaus Ave9th StFerrari Ra nch RdSun City BlvdJoiner PkwyTwelve Bridges D rPark DrWhit ney BlvdWildcat BlvdIndustrial AveKing RoadSunset BlvdC rest DrLone Tree BlvdStan<strong>for</strong>d Ranch RoadBlue Oaks BlvdFairway DrWashington BlvdWoodcre ek Oaks BlvdSierra College BlvdGalleria BlvdPacific AveEast AvelvdDel Webb BEl Centro BlvdCatlett RoadHowsley RoadOaks BlvdFifield RoadKeys RoadDel Webb BlvdSankey RoadPleasant Grove BlvdNatomas RoadRoseville PkwyAtlantic StJunction BlvdVernon StFoothills BlvdRiego RoadAtkinson StSunrise BlvdWallerga RoadLe vee Road,Roseville RdOld Auburn RdAntelope North RdElverta RdElverta RdAntelope RdN:\Projects\SA05\0050\GIS\Draft\Fig10_Route2_Imp.mxdFIGURE 10
Dowd AveNicolaus RoadNicolaus AveH StPleasant Grove Road1st StBrewer RoadMoore RoadLincoln PkwyE. Catlett RoadAthens RoadFiddyment RoadSunset Blvd WestPhillip RoadFoothills BlvdPleasant Grove RoadLocust RoadPacific AveFiddyment DrPowerline RoadMain StBaseline RoadWatt AveRiverside AveCirby WayPFE RoadElverta Rd·|}þ 65 LEGENDLincolnHighlands<strong>BRT</strong> Route 3Planned Roadways·|}þhQueue Jump Lanes193SterlingPointeN·|}þ 65 WhitneyRanchNOT TO SCALESunsetIndustrial·|}þ 65§¨¦ 80hhTo Hazel and SunriseLight Rail Stations(via Sierra College Blvd.)CANDIDATE <strong>BRT</strong> ROUTE 3 IMPROVEMENTSNicolaus Ave9th StFerrari Ra nch RdSun City BlvdJoiner PkwyTwelve Bridges D rPark DrWhit ney BlvdWildcat BlvdIndustrial AveKing RoadSunset BlvdC rest DrLone Tree BlvdStan<strong>for</strong>d Ranch RoadBlue Oaks BlvdFairway DrWashington BlvdWoodcre ek Oaks BlvdSierra College BlvdGalleria BlvdPacific AveEast AvelvdDel Webb BEl Centro BlvdCatlett RoadHowsley RoadOaks BlvdFifield RoadKeys RoadDel Webb BlvdSankey RoadPleasant Grove BlvdNatomas RoadRoseville PkwyAtlantic StJunction BlvdVernon StFoothills BlvdRiego RoadAtkinson StSunrise BlvdThree D <strong>South</strong>Aitken PropertyLincolnCrossingVillage 7Lincoln 270PlacerRanchCreekviewRegionalUniversityWest RosevilleSpecific PlanCurryCreekSierraVistaPlacer VineyardsDry Creek -West Placer·|}þ 99 Riolo§¨¦ 80Wallerga RoadLe vee RoadVineyardsFoskettRanchThree D NorthRoseville RdOld Auburn RdAntelope North RdElverta RdElverta Rd,Antelope RdN:\Projects\SA05\0050\GIS\Draft\Fig11_Route3_Imp.mxdFIGURE 11
<strong>Bus</strong> <strong>Rapid</strong> <strong>Transit</strong> (<strong>BRT</strong>) <strong>Implementation</strong> <strong>Study</strong> <strong>for</strong> <strong>South</strong> Placer County7.0 <strong>BRT</strong> STATION PLANThis section identifies candidate <strong>BRT</strong> station locations and types <strong>for</strong> south Placer County.7.1 <strong>BRT</strong> STATIONSAccording to the TCRP Report 90, <strong>BRT</strong> stations build the critical link between the <strong>BRT</strong> system, passengers,and other public transit services provided in the region. Different from a typical local bus station, <strong>BRT</strong> stationshave their special role to support a strong and consistent identity <strong>for</strong> <strong>BRT</strong> in the community while respectingand enhancing the surrounding urban context. Generally, <strong>BRT</strong> stations present the following key features(TCRP Report 90):• Provide high-quality design with passenger amenities (such as shelters, seating, and lighting) tosupport a positive public perception of <strong>BRT</strong> service.• Respect the unique character of neighborhoods and districts and provide the appropriate balancebetween system continuity and contextual design.• Integrate with the current and future land use to generate greater patronage and develop designconcepts cooperatively with the surrounding community.• Support an integrated system identity by keeping the transit service visible and recognizable to thecommunity.• Provide an opportunity to improve streetscapes by incorporating new amenities such as landscapingand recreational trails.<strong>BRT</strong> Station TypeAccording to the Characteristics of <strong>Bus</strong> <strong>Rapid</strong> <strong>Transit</strong> <strong>for</strong> Decision-Making (FTA, 2004), current <strong>BRT</strong> systemshave the following four station types with certain characteristics and range of costs.Simple Stops consist of a transit stop with simple shelter to protect waitingpassengers from the weather. In general, this type has the lowest capital costthat ranges from $15,000 to $20,000 per shelter (does not include cost ofplat<strong>for</strong>m or soft-costs).43
<strong>Bus</strong> <strong>Rapid</strong> <strong>Transit</strong> (<strong>BRT</strong>) <strong>Implementation</strong> <strong>Study</strong> <strong>for</strong> <strong>South</strong> Placer CountyEnhanced Stops provide additional <strong>BRT</strong> station features such as weatherprotection and lighting. It also incorporates additional design treatmentsincluding walls, high-quality material finishes, and passenger amenities such asbenches, pay phones, or trash cans. In general, the cost of an enhanced stopranges from $25,000 to $35,000 per shelter (does not include cost of plat<strong>for</strong>m orsoft-costs).Designated Stations provide more complex <strong>BRT</strong> station featuressuch as level passenger boarding and alighting, separate connectionbetween plat<strong>for</strong>ms or between plat<strong>for</strong>m and passenger amenities. Ingeneral, the cost of a designated station ranges from $150,000 to$2.5 million per station (does not include cost of parking facilities orsoft-costs).Intermodal Terminal or <strong>Transit</strong> Center It is the most complex andcostly type among the current <strong>BRT</strong> stations. It usually consists oflevel passenger boarding, a host of amenities, and transfer facilitiesbetween <strong>BRT</strong> service and other public transit modes (e.g., local busand rail transit). In general, the cost of this type ranges from $5 to$20 million (or higher) per facility (does not include soft-costs).Station Location and Spacing<strong>BRT</strong> station location and spacing are critical factors to affect patronage and operating speeds. TCRP Report90 defines the following principles to be considered to determine the <strong>BRT</strong> station location and spacing.• <strong>BRT</strong> station should be located at major passenger concentrations (e.g., high-density residentialareas, high-density employment areas, universities and high schools, and recreational centers).• <strong>BRT</strong> station should be located near major bus routes and major arterial roadways.• <strong>BRT</strong> station should be placed as far apart as possible and the recommended guidelines <strong>for</strong> <strong>BRT</strong>station spacing by arrival mode are show below.44
<strong>Bus</strong> <strong>Rapid</strong> <strong>Transit</strong> (<strong>BRT</strong>) <strong>Implementation</strong> <strong>Study</strong> <strong>for</strong> <strong>South</strong> Placer County• 0.25 – 0.33 miles <strong>for</strong> pedestrians• 0.5 – 1.0 miles <strong>for</strong> bus• 2.0 miles <strong>for</strong> automobilePark-and-Ride FacilitiesPark-and-ride facilities should be provided at <strong>BRT</strong> stations if a large number of potential riders are locatedbeyond the appropriate walking distance or connecting bus service area. Generally, park-and-ride facilitiesare located in suburban areas mainly serving commuters. According to TCRP Report 90, the planning anddesign of park-and-ride facilities need to consider the following issues:• Park-and-ride facilities should be located at a place with good road accessibility, potential expansionability, and minimized backtracking <strong>for</strong> patrons.• Park-and-ride facilities should be provided <strong>for</strong> every 1.2 to 5.0 boarding <strong>BRT</strong> passengers per parkingspace, depending on the number of feeder bus service. Ten to fifteen percent more spaces aredesirable to ensure space availability.• Park-and-ride facilities should have direct and convenient pedestrian access to <strong>BRT</strong> station.Separate access points <strong>for</strong> buses and automobiles are desirable when parking spaces exceed 500 orwhen parking fees are charged.7.2 RECOMMENDED <strong>BRT</strong> TRANSIT CENTERS<strong>BRT</strong> transit centers are recommended at the following locations based on the candidate <strong>BRT</strong> routes, a reviewof proposed development plans in south Placer County, and a review of super cumulative model data. Thetransit centers are anticipated to have higher ridership levels than the stations identified in the next section,given the type and density of adjacent land uses near the centers. <strong>Transit</strong> centers would provide more busbays to facilitate higher level of connecting service from other transit lines. Figure 9 shows the location of therecommended transit centers.<strong>BRT</strong> Route 1• Placer Ranch: CSUS – Placer Campus• Galleria Area<strong>BRT</strong> Route 2• Placer Ranch: CSUS – Placer Campus<strong>BRT</strong> Route 3• Galleria Area45
<strong>Bus</strong> <strong>Rapid</strong> <strong>Transit</strong> (<strong>BRT</strong>) <strong>Implementation</strong> <strong>Study</strong> <strong>for</strong> <strong>South</strong> Placer County• Hazel light rail station• Sunrise light rail stationTable 5 provides a summary of suggested elements <strong>for</strong> each of the transit centers.TABLE 5. SUGGESTED <strong>BRT</strong> TRANSIT CENTER ELEMENTS<strong>BRT</strong> <strong>Transit</strong> Center<strong>Bus</strong> Plat<strong>for</strong>mLayoutPark-and-rideSpacesStation Access<strong>BRT</strong> Route 1 – CSUS-Placer Campus Two vehicles 300 FIddyment Road<strong>BRT</strong> Route 1 – Galleria Single vehicle 100 Roseville Parkway<strong>BRT</strong> Route 2 – CSUS-Placer Campus Two vehicles 300 Fiddyment Road<strong>BRT</strong> Route 3 – Galleria Single vehicle 100 Roseville Parkway<strong>BRT</strong> Route 3 – Hazel LRT Station n/a n/a Folsom Boulevard<strong>BRT</strong> Route 3 – Sunrise LRT Station n/a n/a Sunrise BoulevardSource: Fehr & Peers, 2006.The CSUS-Placer Campus transit center would be a new facility that would be constructed with the PlacerRanch Specific Plan development. The Galleria transit center is envisioned as a significant upgrade of theexisting transit station that is currently accessed via Roseville Parkway, with ultimate costs in the $5 to $10million range, to provide <strong>for</strong> structured parking and improved access. Construction of the Galleria transitcenter would likely be phased, with interim access and park-and-ride improvements. The Hazel and Sunrisestations, along Folsom Boulevard, are existing light rail stations that will ultimately have a total of 919 parkand-ridespaces. The Sunrise station also serves as a bus terminal.7.3 RECOMMENDED <strong>BRT</strong> STATIONS<strong>BRT</strong> stations are recommended at the following locations based on the candidate <strong>BRT</strong> routes, a review ofproposed development plans in south Placer County, and a review of super cumulative model data. Figure12 shows the location of the recommended stations.46
<strong>Bus</strong> <strong>Rapid</strong> <strong>Transit</strong> (<strong>BRT</strong>) <strong>Implementation</strong> <strong>Study</strong> <strong>for</strong> <strong>South</strong> Placer County<strong>BRT</strong> Route 1• H-P Campus Area• SR 65/Blue Oaks Boulevard: Planned Corporate Center<strong>BRT</strong> Route 2• West Roseville Specific Plan town center• Placer Vineyards: East <strong>Transit</strong> Center Drive/16 th Avenue<strong>BRT</strong> Route 3• Taylor park-and-ride lotTable 6 provides a summary of suggested elements <strong>for</strong> each of the <strong>BRT</strong> stations.TABLE 6. SUGGESTED <strong>BRT</strong> STATION ELEMENTS<strong>BRT</strong> Station<strong>Bus</strong> Plat<strong>for</strong>mLayoutPark-and-rideSpacesStation Access<strong>BRT</strong> Route 1 – H-P Campus Single vehicle 100 Blue Oaks Boulevard<strong>BRT</strong> Route 1 – Planned Corporate Center Single vehicle 200 Washington Boulevard<strong>BRT</strong> Route 2 – West Roseville Town Center Single vehicle 50Pleasant GroveBoulevard<strong>BRT</strong> Route 2 – Placer Vineyards Center Single vehicle 200 Watt Avenue<strong>BRT</strong> Route 3 – Taylor park-and-ride lot n/a n/a Taylor RoadSource: Fehr & Peers, 2006.47
Dowd AveNicolaus RoadNicolaus AveH StPleasant Grove Road1st StBrewer RoadMoore RoadLincoln PkwyE. Catlett RoadAthens RoadFiddyment RoadSunset Blvd WestPhillip RoadFoothills BlvdPleasant Grove RoadLocust RoadPacific AveFiddyment DrPowerline RoadMain StBaseline RoadWatt AveRiverside AveCirby WayPFE RoadElverta RdNicolaus Ave9th StPark DrKing RoadSierra College BlvdRoseville Pkwy·|}þ 99 Three D <strong>South</strong>Ranch") T") S ") S ") TSterlingPointeAitken PropertyLincolnCrossingVillage 7Lincoln 270PlacerRanchSunsetIndustrialCreekviewRegionalUniversity·|}þ 65 WhitneyWest Roseville·|}þ 65Specific Plan") T") TCurrySierra") S West PlacerCreekVistaPlacer Vineyards§¨¦ 80RioloFerrari Ra nch RdSun City BlvdJoiner PkwyTwelve Bridges D rWhit ney BlvdWildcat BlvdIndustrial AveSunset BlvdCrest DrLone Tree BlvdStan<strong>for</strong>d Ranch RoadBlue Oaks BlvdFairway DrWashington BlvdGalleria BlvdWoodcreek Oaks BlvdPacific AveEast AvelvdDel Webb BEl Centro BlvdCatlett RoadHowsley RoadOaks BlvdFifield RoadKeys RoadDel Webb BlvdSankey RoadPleasant Grove BlvdNatomas RoadAtlantic StJunction BlvdVernon StFoothills BlvdRiego RoadAtkinson StSunrise BlvdWallerga RoadLe vee RoadVineyardsFoskettRanchThree D North·|}þ 65 LincolnHighlandsLEGEND<strong>BRT</strong> Route 1<strong>BRT</strong> Route 2·|}þ 193<strong>BRT</strong> Route 3Planned Roadways") T <strong>Transit</strong> Center") S StationNNOT TO SCALE§¨¦ 80<strong>BRT</strong> STATIONS,Roseville RdOld Auburn Rd,Antelope North RdElverta RdElverta Rd,Antelope RdN:\Projects\SA05\0050\GIS\Draft\Fig12_Recom<strong>BRT</strong>_Stations.mxdFIGURE 12
<strong>Bus</strong> <strong>Rapid</strong> <strong>Transit</strong> (<strong>BRT</strong>) <strong>Implementation</strong> <strong>Study</strong> <strong>for</strong> <strong>South</strong> Placer County8.0 SUGGESTED NEXT STEPSThis section provides a summary of the study conclusions and next steps.<strong>Study</strong> ConclusionsThe evaluation of the potential <strong>BRT</strong> market in south Placer County indicates that the type, mix and density ofland use planned <strong>for</strong> the following developments make them strong candidates <strong>for</strong> housing future <strong>BRT</strong>stations.• Placer Ranch Specific Plan area, particularly the planned CSUS – Placer Campus• Galleria Mall expansion project• West Roseville Specific Plan Town Center• Placer Vineyards Center at Watt Avenue• Planned Corporate Center at SR 65/Blue Oaks BouelvardThe H-P campus area and the Taylor park-and-ride center are existing activity centers that are goodcandidates <strong>for</strong> <strong>BRT</strong> stations.Three candidate <strong>BRT</strong> routes are identified that would serve these future <strong>BRT</strong> stations. For each of the threeroutes, specific improvements are identified ranging from dedicated HOV/transit lanes to intersection queuejump lanes to transit signal priority.As development proceeds, transit service can be phased in over time. Depending on the location, sequenceand level of development, interim transit service may include express bus service, “enhanced” bus service,fixed route service, and/or shuttle service.Next StepsThe following actions are recommended to facilitate the implementation of transit service in south PlacerCounty.• Designate <strong>BRT</strong> station locations in new Specific Plan areas and preserve sufficient right-ofway<strong>for</strong> access, bus pick-up/drop-off areas, and park-and-ride facilities.• Adopt Specific Plans that identify land use types and densities - within ½ mile of future <strong>BRT</strong>stations - that are supportive of future <strong>BRT</strong> service.49
<strong>Bus</strong> <strong>Rapid</strong> <strong>Transit</strong> (<strong>BRT</strong>) <strong>Implementation</strong> <strong>Study</strong> <strong>for</strong> <strong>South</strong> Placer County• Designate segments of Blue Oaks Boulevard, Fiddyment Road, Watt Avenue, and SunsetBoulevard as potential future <strong>BRT</strong> corridors and preserve sufficient right-of-way to providetwo dedicated arterial/HOV transit lanes in the future.• Designate key intersections as potential future <strong>BRT</strong> bypass locations and preserve sufficientright-of-way to provide queue bypass lanes.• Adopt a funding mechanism <strong>for</strong> new developments that provide <strong>for</strong> capital as well asoperating & maintenance costs <strong>for</strong> future transit service.• Initiate coordinate ef<strong>for</strong>ts with affected jurisdictions and transit agencies to establishmanagement, operational, phasing, and funding plans <strong>for</strong> future transit service.50
<strong>Bus</strong> <strong>Rapid</strong> <strong>Transit</strong> (<strong>BRT</strong>) <strong>Implementation</strong> <strong>Study</strong> <strong>for</strong> <strong>South</strong> Placer CountyAPPENDIX A – REGIONAL TRANSIT (RT) BUS SERVICE EVALUATION GUIDELINES51
<strong>Bus</strong> <strong>Rapid</strong> <strong>Transit</strong> (<strong>BRT</strong>) <strong>Implementation</strong> <strong>Study</strong> <strong>for</strong> <strong>South</strong> Placer County(INSERT 2 PAGES FROM PRIOR REPORT)52