Applied Rowing Ergometer Testing - Remo 2016
Applied Rowing Ergometer Testing - Remo 2016
Applied Rowing Ergometer Testing - Remo 2016

Create successful ePaper yourself
Turn your PDF publications into a flip-book with our unique Google optimized e-Paper software.
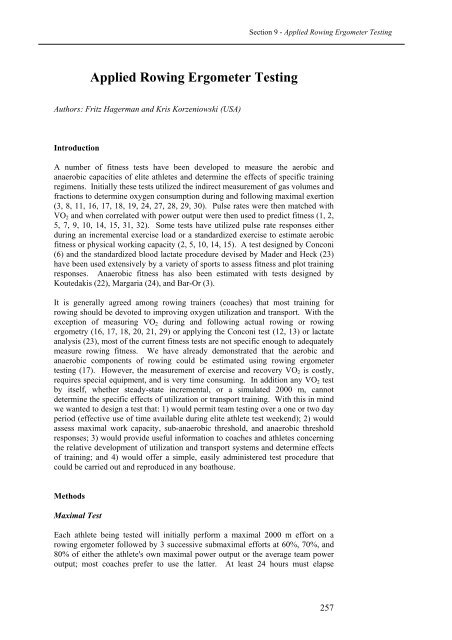
Section 9 - <strong>Applied</strong> <strong>Rowing</strong> <strong>Ergometer</strong> <strong>Testing</strong><strong>Applied</strong> <strong>Rowing</strong> <strong>Ergometer</strong> <strong>Testing</strong>Authors: Fritz Hagerman and Kris Korzeniowski (USA)IntroductionA number of fitness tests have been developed to measure the aerobic andanaerobic capacities of elite athletes and determine the effects of specific trainingregimens. Initially these tests utilized the indirect measurement of gas volumes andfractions to determine oxygen consumption during and following maximal exertion(3, 8, 11, 16, 17, 18, 19, 24, 27, 28, 29, 30). Pulse rates were then matched withVO 2 and when correlated with power output were then used to predict fitness (1, 2,5, 7, 9, 10, 14, 15, 31, 32). Some tests have utilized pulse rate responses eitherduring an incremental exercise load or a standardized exercise to estimate aerobicfitness or physical working capacity (2, 5, 10, 14, 15). A test designed by Conconi(6) and the standardized blood lactate procedure devised by Mader and Heck (23)have been used extensively by a variety of sports to assess fitness and plot trainingresponses. Anaerobic fitness has also been estimated with tests designed byKoutedakis (22), Margaria (24), and Bar-Or (3).It is generally agreed among rowing trainers (coaches) that most training forrowing should be devoted to improving oxygen utilization and transport. With theexception of measuring VO 2 during and following actual rowing or rowingergometry (16, 17, 18, 20, 21, 29) or applying the Conconi test (12, 13) or lactateanalysis (23), most of the current fitness tests are not specific enough to adequatelymeasure rowing fitness. We have already demonstrated that the aerobic andanaerobic components of rowing could be estimated using rowing ergometertesting (17). However, the measurement of exercise and recovery VO 2 is costly,requires special equipment, and is very time consuming. In addition any VO 2 testby itself, whether steady-state incremental, or a simulated 2000 m, cannotdetermine the specific effects of utilization or transport training. With this in mindwe wanted to design a test that: 1) would permit team testing over a one or two dayperiod (effective use of time available during elite athlete test weekend); 2) wouldassess maximal work capacity, sub-anaerobic threshold, and anaerobic thresholdresponses; 3) would provide useful information to coaches and athletes concerningthe relative development of utilization and transport systems and determine effectsof training; and 4) would offer a simple, easily administered test procedure thatcould be carried out and reproduced in any boathouse.MethodsMaximal TestEach athlete being tested will initially perform a maximal 2000 m effort on arowing ergometer followed by 3 successive submaximal efforts at 60%, 70%, and80% of either the athlete's own maximal power output or the average team poweroutput; most coaches prefer to use the latter. At least 24 hours must elapse257
FISA Coaching Development Programme Course - Level IIIbetween the end of maximal testing and the beginning of submaximal testing foreach subject to permit adequate physiological recovery.The exercise test procedure begins with a maximum ergometer effort for 2000 musing a Concept II rowing ergometer fitted with the special low resistance sealingring (speed ring) with the air vents completely closed and the chain engaged on thesmall sprocket of the flywheel. Immediately before this test the athlete is fittedwith a telemeter pulse monitor unit (Polar CIC, Inc., USA) consisting of atransmitter attached to an elastic band worn around the upper back and chest andadjusted so that the transmitter is positioned just left of center on the chest at midsternallevel. The pulse signal is transmitted to a pulse rate watch either worn onthe athlete's wrist or, as used more often, hand-held by someone recording pulserate data. Exercise pulse rate is recorded at each 500 m segment. In addition topulse rate data the recorder notes total accumulated time and stroke rating andobserves average time for each successive 500 m segment of the 2000 m exercise.The digital display on the Concept II ergometer can be set for continuousmonitoring of 500 m split times or average power output in watts; in most casesathletes prefer 500 m split times. A 5 minute recovery period follows exercise withthe rower in a seated position. At 5 minutes of recovery a microliter capillaryblood sample is taken using a finger or ear lobe prick and the sample is thenanalyzed on a YSI lactic acid analyzer (models 23L or Sport 1500; Yellow SpringsInstruments, Inc., USA). Pulse rate is recorded at the end of each minute ofrecovery in order to determine cardiovascular recuperative ability. Each athlete isencouraged to take a normal warm up before the maximal effort but warm down isnot permitted as it may affect recovery lactate values. We have selected a 5 minuterecovery period for sampling because lactate values seem to consistently peak atthis time following maximal rowing efforts and the athlete sits quietly because alow intensity warm down exercise tends to increase lactic acid clearance from themuscle and blood and its subsequent resynthesis.This 2000 m maximal effort should be performed no less than 24 hours before thesuccessive submaximal 60%, 70%, and 80% of max efforts.Submaximal TestsAt least a 24 hours period should separate the maximal test and the beginning ofthe submaximal testing. The submaximal testing requires the athlete to row at60%, 70% and 80% of their own previously recorded maximal power output, theaverage team maximal power output, or if the coach desires, a series ofpredetermined 60%, 70%, and 80% submaximal efforts. Each of the 3 successivesubmaximal efforts are 5 minutes in duration and pulse rate is recorded at the endof every minute for each of the efforts. A microliter blood sample is taken byfinger or ear lobe prick immediately following completion of the 60% and 70% ofmax efforts while a 5 minute recovery follows the 80% of max effort; pulse rate isrecorded at the end of each recovery minute and a microliter blood sample is takenat 5 minute recovery via a finger or ear lobe prick. A recorder is assigned to eachathlete being tested and will serve to assist the rower in maintaining the prescribedsteady-state power intensity and note exercise time, heart rate, and stroke rating.No warm up is necessary prior to the 3 submaximal exercise bouts since the firstexercise test (60% of max power) serves as an optimal warm up. The test subjectshave had no problems maintaining the prescribed power outputs as there is aconstant display of average watts or 250 m split times depending on the athlete'spreference for pacing assistance.258
Section 9 - <strong>Applied</strong> <strong>Rowing</strong> <strong>Ergometer</strong> <strong>Testing</strong>We have successfully utilized the following predetermined work intensities forU.S. National Team testing:Table 160% 70% 80%Group 500msplitStrokerate500msplitStrokerate500msplitStrokerateMale Heavy 1:47 18-20 1:42 20-22 1:37 22-24Female Heavy 2:03 18-20 1:58 20-22 1:53 22-24Male Light 1:55 18-20 1:50 20-22 1:45 22-24Female Light 2:11 18-20 2:06 20-22 2:01 22-24These times and stroke ratings can be adjusted according to the quality of athletesbeing tested. If the athlete's own maximal power output is used then thesubmaximal test protocol simply involves using 60%, 70%, and 80% of themaximal values and although 500 m split times can be used it is often better to usewatts as the power indicator; e.g., athlete's max power output is 350 watts,therefore 60% would equal 210 W, 70% would equal 245 W, and 80% would equal280 W. These same calculations can be applied to the team maximal power output.We prefer to use the team average maximal power output to calculate theappropriate submaximal work intensities and in doing so believe that astandardized exercise intensity for all team members provides more usefulcomparative data.Although submaximal testing can be conducted as many times as the coach desireswe recommend the following schedule for National and Olympic Teams: maximaltest conducted in late November or early December followed as closely as possibleby first series of submaximal tests and then followed by submaximal testing in lateFebruary or early March, late May or early June, and finally in late July or earlyAugust. This test schedule can be adjusted accordingly for the usually shortercollege and club seasons.This schedule also allows for frequent testing but not so much that it will bedisruptive to normal training. It will also permit adequate time to make thenecessary training adjustments if results demonstrate that expected training goalsare not being achieved. Because most club, college, and developing rowingprograms may not have access to blood lactic acid analysis but can continuouslymeasure pulse rates, it is possible to monitor and determine effects of trainingbased on pulse rate data only.ResultsMaximal TestMaximal power output, heart rate, and blood lactate data are used to determinemaximal aerobic and anaerobic capacity. These data are more appropriatelydefined as peak data because the testing procedure does not follow therecommended increasing intensity of traditional maximal tests. However webelieve a simulated 2000 m all-out ergometer effort provides more appliedinformation to the coach and athlete and can provide excellent selection data andhelp to reveal talent and determine fitness for exhaustive exercise. The following259
FISA Coaching Development Programme Course - Level IIIpeak power output, heart rate, and lactate values for National and Olympic Teamcandidates have recently been reported:Table 2: Range of Peak ValuesGroupPower Stroke(Watts)Heart Rate(beats/min)Lactate(mmol/L)Male Heavy 420-520 175-200 10-20Female Heavy 260-360 175-200 8-18Male Light 350-400 175-200 10-20Female Light 220-320 175-200 8-18Submaximal TestsThe major purpose of these tests is to determine the effects of specific trainingprograms, especially the balance between utilization and transport training.Because the emphasis is on utilization training during the out-of-competitionperiod and it also represents a major proportion of training during the competitiveperiod, test results are indicative of how closely the athletes have followed theprescribed training program.Based on submaximal data observed for recent National and Olympic Teams thesubmaximal tests should yield the following results:Table 3: Submax TestPercentage of maximum HR (beats/minute) LA (mmol)60% 120-140 1-270% 140-160 2-480% 160-180 4-6It is important to note that these values are ideal and athletes should expect toachieve them only when they have followed prescribed training and have reached ahigh level of physical fitness. There are, of course, exceptions and some athletes,because of heredity factors or other influences, may demonstrate different thanexpected results.DiscussionThere are several advantages to this testing program: it requires very little time toadminister and because the submaximal test results are based on the initial maximaltest there is no need of repeating the maximal 2000 m ergometer test again unlessadditional maximal or peak data are needed. However, if it is desired to charttraining effects accurately then all subsequent submaximal test results should becompared based on the initial maximal power output.The submaximal data have proven valuable in charting training effects and thushave allowed time to modify or change training programs if necessary, discoveredathletes who have not adhered to prescribed training, revealed overtrained andfatigued athletes, and have afforded important individual data for training diariesand schedules. This testing program has also provided a valuable learningexperience for everyone. The optimal heart rate and lactate values of the upper end260
Section 9 - <strong>Applied</strong> <strong>Rowing</strong> <strong>Ergometer</strong> <strong>Testing</strong>of the 70% of maximal power test and lower end of the 80% of maximal power testapproximate anaerobic threshold (AT), Lactate Takes Hold (LAT), or Onset ofBlood Lactate (OBLA) for elite rowers. Our previous data have shown that eliterowers achieve an AT of about 85% of maximal working capacity when they arehighly trained (26), and using Mader's standard AT value of 4 mmol/L seems toconfirm that in most cases our recommended heart rate and lactate values for the80% test are very near AT, LAT, or OBLA.Results of the submaximal testing can be displayed in tables or plotted graphically.It may be more useful for displaying individual data to graph subsequent HR andLA data. In this way the athlete may be provided a clearer picture of his/herprogress during training. A typical and expected graphic portrayal is presented andindicates significant training effects as both the submaximal heart rate and lactatecurves shift to the right following extensive prescribed training. (see Fig. 1)Figure 1: Typical submaximal heart rate and lactic acid responses during sequentialsubmaximal ergometer testing.There have been several examples recently where these series of periodicsubmaximal test data have been used to modify or change the training program. Inone instance two athletes who were training without close supervision were testedearly in their training program (March - Test 2) and were found to have excessivelyhigh submaximal pulse rates and lactates. It was discovered that both believed theprescribed utilization training was of too low an intensity and that there was notenough anaerobic work included. Therefore, they decided to perform their261
FISA Coaching Development Programme Course - Level IIIutilization training at a higher intensity and also add significant amounts ofanaerobic work to their training. It can be noted in their following data that heartrate and lactate data are not compatible with expected results for the second test butafter convinced to follow the prescribed training, data for the third series of testsdemonstrated each was back on proper physiological track. These submaximaltests are thus especially crucial in the early states of training.Table 4December March JuneRowerHR LA HR LA HR LA(b/min) (mmol/L (b/min) (mmol/L (b/min) (mmol/L)))A 60% 148 3.3 161 4.9 141 2.970% 165 5.2 171 6.6 153 4.280% l85 6.4 190 9.l 166 5.9B 60% 153 3.6 175 5.4 148 3.070% 171 5.9 180 8.1 167 6.080% 192 6.6 198 10.4 183 6.6In another instance several National Team athletes, 4 weeks prior to the WorldChampionships, complained of being over tired and fatigued and showed signs ofovertraining as shown in Table 5. A comparison of average submaximal heart rateand lactate data for the U.S. Men's and Women's National Team reveals that indeedthose values recorded at this juncture of training far exceeded those expected. As aresult, training intensity and volume were reduced and although time did not permitfurther submaximal testing, competitive efforts 4 weeks later reflected that allNational Team rowers were prepared to compete successfully.Table 5MenHR(b/min)LA(mmol/L)WomenHR(b/min)LA(mmol/L)Test 1 (Dec.) Test 2 (Mar.) Test 3 (June) Test 4 (Aug.)60 70 80 60 70 80 60 70 80 60 70 80155 166 186 145 160 180 138 147 169 150 161 1793.1 4.5 6.5 2.5 4.3 6.1 1.8 3.2 5.0 2.9 3.9 6.4159 169 189 150 161 182 141 150 174 156 166 1853.5 5.6 6.9 3.2 5.1 6.2 2.1 3.9 5.4 3.3 4.8 7.1Finally, in our last example of test application, the second of four submaximal testsessions of Olympic team candidates revealed that heart rate values wereexcessively high for each test in December and as a result additional transportationtraining was added to the prescribed training program; results of the next testingconducted in March showed how successful this decision was (see Table 6).Consult Table 3 for desirable or target values.Table 6: 1992 U.S. Olympic Candidates262
Section 9 - <strong>Applied</strong> <strong>Rowing</strong> <strong>Ergometer</strong> <strong>Testing</strong>DEC MAR JUNE% max % max % maxMEN 60 70 80 60 70 80 60 70 80HR (b/min) 160 173 182 146 156 170 135 152 165LA (mmol/L) 1.3 2.2 3.4 1.6 2.5 3.6 1.4 2.3 3.6In summary, we are pleased with this rather rapid and accurate method ofestimating rowing fitness. The use of periodic and successive submaximal testingfollowing the initial maximal and submaximal tests can provide excellentpredictive data of physiological potential and capacity and indicate training effects.References1. Astrand, P.O., and K. Rodahl. 1977. Textbook of Work Physiology, 2nd Edition.McGraw-Hill, New York.2. Astrand, P., and I. Ryhming. 1954. A nomogram for calculation of aerobic capacity(physical fitness) from pulse rate during submaximal work. J. Appl. Physiol., 1:218-221.3. Bar-Or, O., R. Dotan, and O. Inbar. 1977. A 30 sec. all-out ergometric test - its reliabilityand validity for anaerobic capacity. Israel J. of Med. Sci., 13:126.4. Carey, P., M. Stensland, and L. Hartley. 1974. Comparison of oxygen uptake duringmaximal work on the treadmill and the rowing ergometer. Med. and Sci. in Spts.,6:101-103.5. Cooper, K.H. 1968. A means of assessing maximal O 2 uptake. J. of Am. Med. Assoc.,203:201-204.6. Conconi, F., M. Ferrai, P.G. Ziglio, P. Droghetti, and L. Codeca. 1982. Determination ofthe anaerobic threshold by a noninvasive field test in runner. J. Appl. Phys.: Resp.Environ. Phys., 52(4):869-873.7. Costill, D.L. 1986. Inside Running: Basics of Sports Physiology. Benchmark Press,Indianapolis.8. Cunningham, D.A., P.B. Goode, and J.B. Critz. 1975. Cardiorespiratory response toexercise on a rowing and bicycle ergometer. Med. and Sci. in Spts., 7:37-43.9. deVries, H.A., and C.E. Klafs. 1965. Prediction of maximal O 2 intake from submaximaltest. J. Spts. Med. Fitness., 5:207-214.10. deVries, H.A. 1980. Physiology of Exercise for Physical Education and Athletics, 3rdEdition. Wm. C. Brown Co., Dubuque, IA.11. DiPrampero, P.E., G. Corili, F. Celentano, and P. Carretelli. Physiology aspects ofrowing. J. Appl. Phys., 31:853-857.12. Droghetti, P. 1986. Determination of the anaerobic threshold on a rowing ergometer bythe relationship between work output and heart rate. Scand. J. Spts. Sci., 8(2):59-62.13. Droghetti, P., C. Borsetto, I. Casoni, M. Cellini, M. Ferrari, A.R. Paolini, P.G. Ziglio,and F. Conconi. 1985. Noninvasive determination of the anaerobic threshold incanoeing, cross-country skiing, cycling, roller, and iceskating, rowing and walking.Euro. J. Appl. Phys., 53:299-303.14. Fox, E. 1973. A simple accurate technique for predicting maximal aerobic power. J.Appl. Phys., 35(6):914-916.15. Fox, E.L., R.W. Bowers, and M.L. Foss. 1988. The Physiological Bias of PhysicalEducation and Athletics, 4th Edition. Saunders College Publishing, Philadelphia.16. Hagerman, F.C., W.W. Addington, and E.A. Gaensler. 1972. A comparison of selectedphysiological variables among outstanding competitive oarsmen. J. Spts. Med andPhys. Fitness, 12:12-22.17. Hagerman, F.C., M.C. Connors, J.A. Gault, G.R. Hagerman, and W.J. Polinski. 1978.Energy expenditure during simulated rowing. J. Appl. Phys., 45:87-93.18. Hagerman, F.C., E.L. Fox, M.C. Connors, and J.A. Pompei. 1974. Metabolic responsesof women rowers during ergometric rowing. (Abst.) Med. Sci. in Spts., 6(1):87.263
FISA Coaching Development Programme Course - Level III19. Hermansen, L., and B. Saltin. Oxygen uptake during maximal treadmill and bicycleexercise. J. Appl. Phys., 26(1):31-37.20. Jackson, R.C., and N. Secher. 1973. The metabolic cost of rowing and physiologicalcharacteristics of world class oarsmen. (Abst.) Med. Sci. in Spts., 5:65.21. Jackson, R.C., and N.H. Secher. 1976. The aerobic demands of rowing in two Olympicrowers. Med. Sci. in Spts., 8:168-170.22. Koutedakis, Y., and N.C.C. Sharp. 1986. A modified Wingate test for measuringanaerobic work of the upper body in junior rowers. Brit. J. Spts. Med., 20:153-156.23. Mader, A., and H. Heck. 1986. A theory of the metabolic origin of "anaerobicthreshold." Int. J. Spts. Med., 7:45.24. Maglischo, E.W. 1982. Swimming Faster; A Comprehensive Guide to the Science ofSwimming. Mayfield Publishing Co., Palo Alto, CA.25. Margaria, R., P. Aghemo, and F.P. Limas. 1975. A simple relation betweenperformance in running and maximal aerobic power. J. Appl. Phys., 38:351-352.26. Mickelson, T.C., and F.C. Hagerman. 1982. Anaerobic threshold measurements of eliteoarsmen. Med. Sci. Spts. and Exerc., 14:440-444.27. Nowacki, P.E., R. Krause, and K. Adam. 1969. Maximal oxygen uptake by the rowingcrew winning the Olympic gold medal 1968. Pflugers Archives, 312:R66-R67.28. Saltin, B., and P.O. Astrand. 1967. Maximal oxygen uptake in athletes. J. Appl. Phys.,23:353-358.29. Secher, N.H. 1983. The physiology of rowing. J. Spts. Sci., 1:23-53.30. Stromme, S.B., F. Ingjer, and H.D. Meen. 1977. Assessment of maximal aerobic powerin specifically trained athletes. J. Appl. Phys., 42:833-837.31. Wilmore, J.H., F.B. Roby, P.R. Stanforth, M.J. Buono, S.H. Constable, Y. Tsao, andB.J. Lowdon. 1986. Rating of perceived exertion, heart rate, and power output inpredicting maximal oxygen uptake during submaximal cycle ergometry. Physicianand Sptsmed., 14:133-143.32. Wilmore, J.H. 1982. Learning for Sport and Activity; The Physiological Basis of theConditioning Process, 2nd Edition. Allyn and Bacon, Inc., Boston.264