January 2010 - MCB-Arif Habib Savings and Investments Limited
January 2010 - MCB-Arif Habib Savings and Investments Limited
January 2010 - MCB-Arif Habib Savings and Investments Limited
- No tags were found...
Create successful ePaper yourself
Turn your PDF publications into a flip-book with our unique Google optimized e-Paper software.
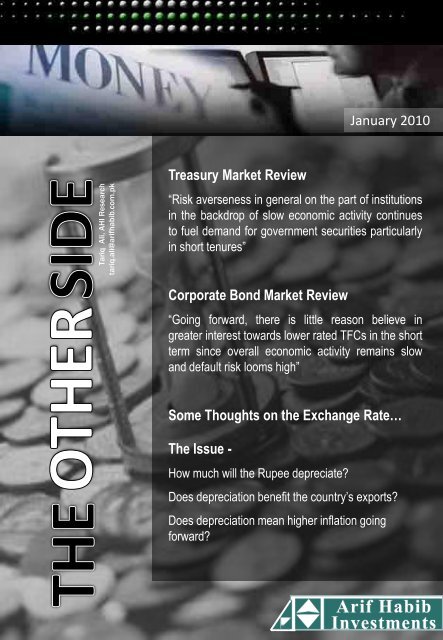
Tariq Ali, AHI Researchtariq.ali@arifhabib.com.pk<strong>January</strong> <strong>2010</strong>Treasury Market Review“Risk averseness in general on the part of institutionsin the backdrop of slow economic activity continuesto fuel dem<strong>and</strong> for government securities particularlyin short tenures”Corporate Bond Market Review“Going forward, there is little reason believe ingreater interest towards lower rated TFCs in the shortterm since overall economic activity remains slow<strong>and</strong> default risk looms high”Some Thoughts on the Exchange Rate…The Issue -How much will the Rupee depreciate?Does depreciation benefit the country’s exports?Does depreciation mean higher inflation goingforward?
Treasury Market ReviewA relatively stronger broad money (M2) growth of 5.4% (Jul-Jan 16, FY10) in<strong>January</strong> <strong>2010</strong> as against the previous month improved the liquidity situationresulting in a small decline the benchmark KIBOR <strong>and</strong> treasury yields of alltenures. The growth in M2 was due to the buildup of Net Foreign Assets (NFAs)of the banking system <strong>and</strong> higher private credit off-take following the seasonallending. In addition to this, the Central Bank also kept the market liquid byconducting Open Market Operations (OMOs) <strong>and</strong> injecting on a net basisRs.93.9bn, Rs.111.2bn, Rs.106.5bn <strong>and</strong> Rs.94.0bn in the first, second, third <strong>and</strong>fourth week of <strong>January</strong> respectively.The 6-month KIBOR declined steadily throughout the month by a total of 20bps<strong>and</strong> is now currently at 12.23%. The easing-off of treasury rates was moreprevalent in shorter tenures. In the two T-bill auction targets, conducted duringthe month, maximum participation was seen in the 6-month tenure where yieldsdeclined by a total of 22bps. The decline in other tenures was in the range of 15-21bps. Risk averseness in general on the part of institutions in the backdrop ofslow economic activity continues to fuel dem<strong>and</strong> for government securitiesparticularly in short tenures <strong>and</strong> is often seen supporting downward pressure onyields in the T-bill auctions. Interest in treasury bonds was also seen in theprevious month with the benchmark ten year PIB yields steadily declining by15bps through the month. Following the November Monetary policy statement,the 10-year bond started to edge upwards due to a revival of inflationaryexpectations. However along the backdrop of secular declining trend in inflation,market participants saw the 10-year PIB trading in the yield range of 12.70-12.80% (Dec, 09) as a good investment opportunity thus exerting downwardpressure on the yields.The maintenance of the discount rate at 12.50% by SBP was largely expected bythe market. As highlighted by the central bank, inflationary pressures are likely todominate the next couple of months ahead. There may however be room toreduce the discount rate by 50bps in the March provided inflation begins to easeby then, the Current Account Deficit continues to remain subdued <strong>and</strong> particularlyso if pledged funds at the FoDP forum arrive <strong>and</strong> boost domestic liquidity.Nonetheless, higher inflationary expectations in the immediate term may slightlysteepen the yield curve. It would thus not be unusual to see the 10-year PIBtrade again in the 12.70-12.80% yield range in February. On the other h<strong>and</strong>,short term rates may continue to remain subdued in the backdrop of ampledem<strong>and</strong> in the market.1
O/N-7 Ds08 -15 Ds16- 30 Ds31- 60 Ds61- 90 Ds91-120 Ds121-180 Ds181-270 Ds271-365 Ds2 Yrs3 Yrs4 Yrs5 Yrs6 Yrs7 Yrs8 Yrs9 Yrs10 Yrs15 Yrs20 Yrs30 YrsTreasury Yields 1-Jan-10 30-Jan-10 Avg.O/N-7 Ds 12.18 12.04 11.8608 -15 Ds 12.12 11.98 11.9216- 30 Ds 12.07 11.93 11.9531- 60 Ds 12.08 11.89 11.9661- 90 Ds 12.1 11.88 11.9791-120 Ds 12.11 11.89 11.99121-180 Ds 12.13 11.90 12.02181-270 Ds 12.12 11.94 12.04271-365 Ds 12.1 11.95 12.042 Yrs 12.34 12.23 12.283 Yrs 12.4 12.27 12.344 Yrs 12.47 12.34 12.405 Yrs 12.52 12.38 12.446 Yrs 12.58 12.42 12.487 Yrs 12.61 12.47 12.528 Yrs 12.61 12.49 12.529 Yrs 12.62 12.49 12.5310 Yrs 12.61 12.47 12.5115 Yrs 12.85 12.76 12.7820 Yrs 13.03 12.99 13.0030 Yrs 13.16 13.10 13.1213.313.112.912.712.512.312.111.911.711.5The Yield Curve in <strong>January</strong>2-Jan-1030-Jan-102
Corporate Bond Market ReviewRisk Aversion in general has also been seen in the TFC market with most of thetrading done in high rated issues mostly in the banking <strong>and</strong> fertilizer sectors. Atotal of Rs.2, 186mn worth of issues were traded in the corporate bond market(including both listed <strong>and</strong> unlisted issues) with Rs.1, 115mn in the banking sector<strong>and</strong> Rs.564mn in the Fertilizer sectors. The other major TFCs traded were in thereal estate, leasing <strong>and</strong> telecom industries.Buying interest in banking <strong>and</strong> fertilizer sector papers resulted appreciation inprices; decrease in credit spreads over benchmark (6-month) KIBOR was in therange between 2.00% to 2.75% (Banking), 2.25% to 3.65% (Fertilizer) <strong>and</strong> 2.45%to 6.15%(Telecommunications). Going forward, there is little reason believe ingreater interest towards lower rated TFCs in the short term since overalleconomic activity remains slow <strong>and</strong> default risk looms high. Banking sector <strong>and</strong>Fertilizer industries at this point present little chances of default <strong>and</strong> continuedinterest in their corporate debt is likely to be seen.KIBOR Rates 2-Jan-10 30-Jan-10 Avg.1-WeeK 12.36 12.41 12.202-Week 12.38 12.39 12.271-Month 12.42 12.39 12.353-Month 12.33 12.18 12.246-Month 12.41 12.23 12.319-Month 12.7 12.6 12.6412-Month 12.78 12.69 12.732 Years 12.93 12.85 12.883 Years 13.02 12.95 12.983
Some Thoughts on the Exchange Rate…The IssueThe Rupee has depreciated about 6% in the open market <strong>and</strong> about 4% in theinterbank market since the start of this financial year. Most of this rupeedepreciation including the spread between the interbank <strong>and</strong> the open marketrates has taken place over the last month <strong>and</strong> a half or so. As a result <strong>and</strong>certainly to no surprise, the „rupee at 100‟ talk has begun to emerge once again.The main explanations for this phase of rupee weakening are being attributed tothe pass-on of crude oil payments from SBP to the open market <strong>and</strong> thenarrowing of interest rate spreads with trading partners. While these factors maycontribute, a lot of other questions also remain. Firstly, how much will the Rupeedepreciate? Secondly, does depreciation benefit the country‟s exports <strong>and</strong>finally, does depreciation mean higher inflation going forward?The Exchange Rate RegimePerhaps we would not be able to get very far without exploring the concept of theexchange rate regime. Now we all know there are really three different kinds ofregimes; fixed, floating <strong>and</strong> managed float. The truth is that just like communism<strong>and</strong> capitalism the regimes do not really exist in their purest form but may varyfrom country to country. For example countries might follow a floating currencybut intervene with varying degrees in order to affect its value. Pakistan has tooexperienced all three different regimes. Before 1990, it was a fixedregime, between 1990 <strong>and</strong> 2000 a managed float <strong>and</strong> since 2000, a free float.However, the managed float in the 90‟s looked a lot like a peg <strong>and</strong> the free floatafter 2000 resembled more to a managed float. Through the 90‟s forexample, the currency was not allowed to fluctuate very much, almost like apeg, except off course the balance of payment crisis in 1998 where a massivedevaluation had become obligatory. On the same note, one would wonder thatthe Rupee seemed awfully stable through most of the 2000s. Well in fact therewas indeed some design behind it. In 2004 the SBP took on payments for oilupon itself in addition to regular currency interventions in order to smoothen outthe volatility. Recently, under the IMF program Pakistan agreed to h<strong>and</strong> over thecurrency completely to market forces. SBP has agreed not to intervene in thecurrency market <strong>and</strong> payments for oil have now been completely offloaded to themarket. What has come about as a result should not be at all surprising; if thedollar inflows are short in supply, the Rupee will depreciate <strong>and</strong> if abundant insupply it will appreciate like any other flexible currency pair like the US$-Euro. Orin other words, it will see a lot more volatility going forward.4
Box 1Floating Exchange Rate; the right choice?One may rightly ask; is the present exchange rate regime stable for us or what isa suitable regime for a country with an economic structure like Pakistan? Isn‟t itsimply better to have a pegged exchange rate <strong>and</strong> not worry about all the ups<strong>and</strong> downs?Asim Husain (2005) conducted a study aimed at exploring the factors identified todetermine the right suitable exchange rate for a country <strong>and</strong> applying these toPakistan 1 . The table below presents the factors <strong>and</strong> what they imply for Pakistan:FactorsEconomic IntegrationFinancial IntegrationEconomic DiversificationMonetary IndependenceCredibilityFear of Floating TypesPakistan‟s low trade orientation with the world imply tradegains from a peg are a fewPakistan is relatively highly integrated in global financialmarkets <strong>and</strong> is thus subjected to the volatility of privatecapital flows <strong>and</strong> raises the risks associated withoperating a pegThe country has relatively high dependence oncotton, implying a greater need for adjusting tocommodity price shocksReal shocks have a greater impact on the economy ascompared to nominal shocks supporting a floatingexchange ratePakistan has a neutral case as far as Central Bank‟scredibility in maintaining low inflation is concerned for afixed or floating currencyDollar borrowing by Pakistani corporates remains limitedthus “contractionary” devaluation is unlikely to be presentAs can be seen in the preceding table, the author after exploring each of therelevant factors related Pakistan‟s economic structure concludes that a floatingexchange rate would be economically beneficial for the country. This does makeintuitive sense. The country is a net importer of capital which implying thebalance of payments can be weak <strong>and</strong> precarious at times. A flexible exchangerate installs a natural mechanism whereby the macroeconomic imbalances canself adjust because the reality is that otherwise eventually we would have toadjust the currency ourselves except much more painfully. The currency crises of1998 <strong>and</strong> 2008, which probably all of us have bad memories off, were starkresults of an exchange rate being aloof to then suddenly coming to terms witheconomic reality.1.Asim Hussain. (2005). Choosing the Right Exchange Rate Regime for Pakistan. IMF WorkingPaper Series, pg 20-215
The Economics of it allThe exchange rate or the price of one currency in terms of the other isdetermined like the price of any other commodity, by the meeting point of itssupply <strong>and</strong> dem<strong>and</strong>. Thus the level of the exchange rate is determined by factorsthat would change the supply <strong>and</strong> dem<strong>and</strong>. So to put it quite simply, the price ofsomething is lower when there a lot more of it then is required. Some of thesefactors that show how much of foreign currency is likely to go around aregenerally interest rates inflation, net capital flows, business cycles <strong>and</strong> politicalrisk. In the proceeding table, we have listed the factors that typically affect theexchange rate in Pakistan along with the direction the effect is likely to cause theexchange rate to move (+ means the factor is causing appreciation, - meansdepreciation <strong>and</strong> N means neutral). Furthermore, we have assigned scores from1 to 5 (5 being the strongest) on how strong the effect is in causing the exchangerate movement. We have discussed each of these factors in some detail.Pakistani Rupee FundamentalsVariable Effect ScoreInterest Rate Spreads - 2Inflation Differential + 3Balance of Payments Position + 4Business cycle N 3Politics - 4Interest Rate SpreadInterest rate spread between different countries would determine how muchreturn one country‟s currency would be giving compared to the other. Increasinginterest rates should then in theory attract more capital. In Pakistan, unfortunatelythis effect is probably muted with country risk factors shooing away any capitalconsidering entry due to higher rates. One of the few plausible cases remainingto support this theory would be of a Pakistani expatriate worker sending some ofhis savings to a deposit account paying relatively higher rates in his Pakistanibank but because this would happen on a limited scale we would give theinterest rate spreads a score of 2 on their ability to cause changes in the Rupee.6
Inflation DifferentialInflation in one country would tend to make its goods expensive to othercountries. This is why the inflation differential between a country <strong>and</strong> the rest ofthe world would decrease the dem<strong>and</strong> for its good <strong>and</strong> depreciate its currency. InPakistan, to the extent that inflation represented price indexes is correlated withour export basket, we would conclude Pakistan has had it pretty rough withrespect to export competitiveness as most of our trading partners concentrated inthe U.S <strong>and</strong> E.U. Inflation recently in these regions has been pretty lowcompared to Pakistan at least. Looking ahead as inflation in Pakistan continuesto cool down, but starts rising in its trade partners, we would expect a positiveimpact on the currency. However, one more factor is at play here, Pakistan‟sexports are generally unresponsive to changes in their prices or “Inelastic”.Taking this into account, we give inflation differential a score of 3 in being able toexplain exchange rate changes in Pakistan.Balance of Payments PositionPerhaps the most reliable way to determine changes in the Rupee would be tolook at our balance of payment position which simply shows how much dollarswe have coming into the country <strong>and</strong> how many dollars we have going out. Themore dollars we had our thirst for them would more likely to be quenched <strong>and</strong>thus their price would not increase (i.e. the exchange rate). From a crisis likeposition our balance of payments has decently improved <strong>and</strong> has reflected in ourcurrency. Back in 2008, we saw our current account deficit balloon <strong>and</strong> ourfinancing <strong>and</strong> capital account surplus shrink leaving us high <strong>and</strong> dry of dollars. Asa result a near 30% percent depreciation of the Rupee was observed. Sincethen, thanks to the IMF, crashing domestic dem<strong>and</strong> <strong>and</strong> international oilprices, we are on much safer ground now. This seems generally positive for thecurrency, except for one small thing; the current account deficit although only afraction compared to the crisis days still needs financing <strong>and</strong> since foreigninvestment seems unlikely the country is largely dependent on loans <strong>and</strong> grantsa lot of which have been pledged but haven‟t yet arrived. Considering the amountthat is pledged, we can probably see the currency appreciate if they do arrive<strong>and</strong> depreciate if they don‟t. All in all, going through each account on the balanceof payments (yes it‟s cumbersome) <strong>and</strong> working out what is likely to happenthere <strong>and</strong> coming to a likely net position, is a pretty shore shot way of knowingwhat is going to happen to the currency. We thus assign a score of 4.7
Business CycleKnowing where we are on the business cycle can be another way of forecastingwhere our currency is likely to go. In Pakistan our currency depreciates when wego into a recession <strong>and</strong> at least now that we have a fully flexible exchangerate, appreciate in a recovery. If u were to look at the numbers representing thecountry‟s real economy (large scale manufacturing for example), you would likelyconclude that we are at the end of a slump but close to a recovery. However, inthe case of our country a recovery can be delayed as vulnerability is generallyhigher. Because our economy is in a slump we would conclude a neutral impacton a currency <strong>and</strong> give business cycles a score of 3 in their ability to explain theexchange rate.PoliticsTo no ones amazement, politics do play a very crucial role in determining howmuch dollar we will be have flowing through our balance of payments. Localdisturbances affect productivity as the movement of input to <strong>and</strong> output from ourindustry thus possible hampering exports. Moreover, private foreign investorsshy away from investing due to the often volatile nature of Pakistani politics. Thisis rue in Pakistan today which however coupled with the incumbent securitysituation makes the current business environment almost a no go area asforeigners would see it. Since the flow of dollars seems to be largely influencedwith politics we assign it having a negative effect on the currency <strong>and</strong> give it ascore of 4.The Final Score!Summing up all the positives <strong>and</strong> negatives gives a it of mixed picture for the fateof the Rupee. While, overall there seems to be a slight inclination towardsstrengthening, this can easily be derailed if the positive assigned to the balanceof payments in the absence of the expected foreign inflows to finance the currentaccount deficit. It is sometimes uncomforting to know just how much oureconomy is dependent upon external assistance!Depreciation = Inflation?It is often pointed out that depreciation by increasing the domestic price ofimports would increase the price of those goods <strong>and</strong> cause inflation. Intuitively itcertainly makes sense but as usual the devil is in the details. For inflation to begreatly affected by currency depreciation, the prices indexes constructed toreflect inflation have to either be similar to or be correlated with goods traded.8
Now again claiming no monopoly over wisdom, let‟s see what empirical researchhas been done on the subject. Zulfiqar Hyder <strong>and</strong> Sardar Shah 2 (2004) studiedthe subject <strong>and</strong> concluded firstly that exchange rate movements have amoderate effect on domestic price movements as a result of a higher share ofagricultural commodities <strong>and</strong> energy subjected to government regulation in theConsumer Price Index (CPI) <strong>and</strong> Wholesale Price Index (WPI). Secondly, thehigher share of tradable in the WPI as compared to the CPI implies a greaterimpact of exchange rate movements in the WPI. Thirdly, the effect spreads outover twelve months but is more pronounced in the first four months. Fourthly, theexchange pass-through to consumer prices has further weakened after the freefloat of the Rupee/Dollar after the year 2000. Fifthly, within the WPI commoditygroups, the pass-through of exchange rate movements is stronger in „Fuel &Lighting‟ <strong>and</strong> „Manufactures‟ groups while in the case of CPI, pass-through ismore pronounced in‟ Transport & Communication‟ <strong>and</strong> „Fuel & Lighting‟ group.Finally, the response of exchange rate movements in the food inflation is low inboth the CPI <strong>and</strong> the WPI.Some very important conclusions can be drawn from the study. First of all, thedepreciation does not have a proportionate impact on all prices. Local agricommodityprices are not really influenced by international prices, thanks togovernment intervention. What is really affected by depreciation is the price offuel, i.e. petrol, diesel etc. This is probably going to be more pronounced sincelocal prices have become fully aligned with international ones. So keeping in viewthe composition of the CPI, which has a much greater proportion in food thanenergy, currency depreciation is unlikely to be a major push factor behind CPIinflation.The REER StoryAnother commonly believed consequence of exchange rate depreciation iscompetitive gain Pakistani exports would enjoy in international markets. Thatwould be true if inflation did not increase substantially making those exports moreexpensive to foreigners <strong>and</strong> subsequently wiping the gain from the depreciation.Unfortunately in Pakistan, that‟s exactly what happened.A measure known as the Real Effective Exchange Rate (REER) is a tradeweighed <strong>and</strong> inflation adjusted measure of the price of country‟s currencycompared to those of its trading partners. Despite a severe depreciation of thenominal exchange rate, the REER has changed very little implying that as far asforeigners are concerned, Rupee denominated goods have not really becomecheaper. This was of course due to the high 20.7 percent inflation rate thecountry experienced in the financial year, 2009. An increase in domestic inflation2Zulfiqar Hyder <strong>and</strong> Sardar Shah. (2004). Exchange Rate Pass-Through to Domestic Prices inPakistan. SBP Working Paper Series.No.5,pg.14 9
appreciates the REER, while an increase in the inflation rate of a country‟strading partners depreciates it.Inflation in Pakistan, save for the short term blips, is on a declining trend as noreal recovery has taken place. With the rest of the world well into a recoveryaugmented with monetary <strong>and</strong> fiscal stimuli, there is likely going to be an upwardpressure on their inflation. This would then make Pakistan‟s exports morecompetitive by depreciating the REER.The Bottom Line!Coming back to the first question posed earlier i.e. which way the Rupee will go;based on fundamentals there is slight tendency for it to appreciate.However, since stability in the overall balance of payments position rests onfinancing flows with uncertain disbursement tenure, the pressure could be in theother direction if these flows do not materialize or are delayed. The key point tonote is that since the Rupee has been allowed to function as a fully flexibleexchange rate, an appreciation is actually possible (yes I dare to say it) <strong>and</strong>keeping everything in view, the arrival of the scheduled flows cause anappreciation. As far as the second question is concerned i.e. does depreciation inPakistan cause inflation? the answer is only to a limited extent due to thedissimilarities between the composition of the inflation indices <strong>and</strong> thecomposition of traded items. Finally, does Rupee depreciation cause exportcompetitiveness for Pakistan; this would be the case only if inflation do not wipeout the gains. In recent times the depreciation of the Rupee has been offset byhigh inflation causing the REER to remain relatively stable.10
Real sectorThe Economy in Numbersunits Jul Aug Sep Oct Nov Dec JanAHI FY10forecastLSM average FYTD % 0.40% 0.70% -0.40% 0.80% 0.70% -0.4PricesCPI (YoY) % 11.20% 10.70% 10.10% 8.90% 10.40% 10.40% 10.9WPI (YoY) % 8.70% 8.30% 7.80% 5.80% 9.60% 11.50%SPI (YoY) % 9.40% 7.80% 8.50% 6.70% 10.00% 11.90%MonetaryM2 stockOutst<strong>and</strong>ing Bn Rs. 5,042 5,047 5,176 5,184 5,330 5,477 5,702RM stockOutst<strong>and</strong>ing Bn Rs. 1,516 1,535 1,616 1,580 1,690 1,660 1,647Discount Rate % 14 13 13 13 12.5 12.5 12.5 126-Month T-bill avg. % 11.61 12.11 12.46 12.5 12.31 12.16 12.02 126-Month KIBOR avg. % 12.05 12.26 12.62 12.71 12.73 12.43 12.31 12.310-Year PIB avg. % 11.6 12.1 12.5 12.7 12.5 12.7 12.5 12.3ExternalCurrent Account Bal. mn US$ -627 28 67 -552 -283 -391 (5,000)Exports (F.O.B) mn US$ 1,554 1,467 1,599 1,640 1,417 1,629 20,202Imports (F.O.B) mn US$ 2,811 2,171 2,447 2,749 2,198 2,644 32,534Trade Balance mn US$ -1,257 -704 -848 -1,109 -781 -1,015 -12,332Remittances mn US$ 744.71 780.01 806.4 758.16 742.73 698.38 9,227Oil Prices US$/bbl 64.35 71.23 69.38 75.58 78.05 74.69 78.65 82.5Exchange Rate Rs./US$ 82.25 82.94 82.95 83.33 83.55 84.12 84.66 84FiscalFBR Tax Collection Bn Rs. 74.077 86.188 98.372 1,300Source: SBP, FBS, AHIL Estimates11
Source: SBP, FBS, AHIL Estimates<strong>Arif</strong> <strong>Habib</strong> Center, 23 M.T. Khan Road, Karachi-74000, PakistanTel: 111-468-378 (111-INVEST) Fax: +92 (21) 3247-0351www.arifhabib.com.pk<strong>Arif</strong> <strong>Habib</strong> <strong>Investments</strong> <strong>Limited</strong>Registered with the Securities & Exchange Commission of Pakistan (SECP)DisclaimerThis report has been prepared by <strong>Arif</strong> <strong>Habib</strong> Investment Management Ltd. <strong>and</strong> is provided forinformational purposes only. Under no circumstances, is this to be used or considered as an offerto sell or solicitation or any offer to buy. While reasonable care has been taken to ensure that theinformation contained in this report is not untrue or misleading at the time of its publication, <strong>Arif</strong><strong>Habib</strong> Investment Management Ltd., makes no representation as to its accuracy or completeness<strong>and</strong> it should not be relied upon as such. The company accepts no responsibility whatsoever forany direct or indirect consequential loss arising from any use of this report or its contents. Thisreport may not be reproduced, distributed, or published by any recipient for any purpose.


