Yarriambiack Shire Council Budget – 2010/2011
Yarriambiack Shire Council Budget – 2010/2011
Yarriambiack Shire Council Budget – 2010/2011

Create successful ePaper yourself
Turn your PDF publications into a flip-book with our unique Google optimized e-Paper software.
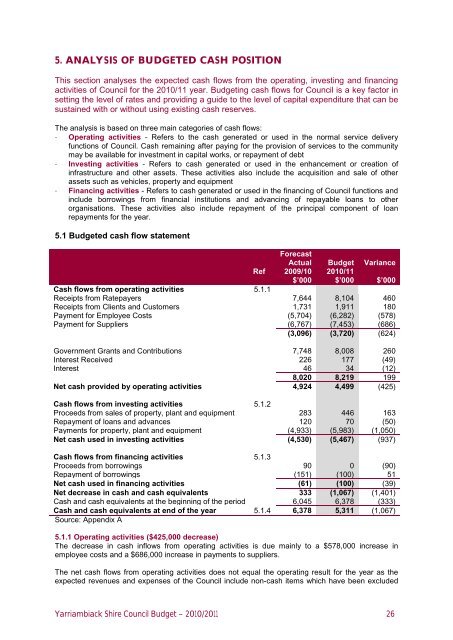
5. Analysis of <strong>Budget</strong>ed Cash PositionThis section analyses the expected cash flows from the operating, investing and financingactivities of <strong>Council</strong> for the <strong>2010</strong>/11 year. <strong>Budget</strong>ing cash flows for <strong>Council</strong> is a key factor insetting the level of rates and providing a guide to the level of capital expenditure that can besustained with or without using existing cash reserves.The analysis is based on three main categories of cash flows:• Operating activities - Refers to the cash generated or used in the normal service deliveryfunctions of <strong>Council</strong>. Cash remaining after paying for the provision of services to the communitymay be available for investment in capital works, or repayment of debt• Investing activities - Refers to cash generated or used in the enhancement or creation ofinfrastructure and other assets. These activities also include the acquisition and sale of otherassets such as vehicles, property and equipment• Financing activities - Refers to cash generated or used in the financing of <strong>Council</strong> functions andinclude borrowings from financial institutions and advancing of repayable loans to otherorganisations. These activities also include repayment of the principal component of loanrepayments for the year.5.1 <strong>Budget</strong>ed cash flow statementRefForecastActual2009/10$’000<strong>Budget</strong><strong>2010</strong>/11$’000Variance$’000Cash flows from operating activities 5.1.1Receipts from Ratepayers 7,644 8,104 460Receipts from Clients and Customers 1,731 1,911 180Payment for Employee Costs (5,704) (6,282) (578)Payment for Suppliers (6,767) (7,453) (686)(3,096) (3,720) (624)Government Grants and Contributions 7,748 8,008 260Interest Received 226 177 (49)Interest 46 34 (12)8,020 8,219 199Net cash provided by operating activities 4,924 4,499 (425)Cash flows from investing activities 5.1.2Proceeds from sales of property, plant and equipment 283 446 163Repayment of loans and advances 120 70 (50)Payments for property, plant and equipment (4,933) (5,983) (1,050)Net cash used in investing activities (4,530) (5,467) (937)Cash flows from financing activities 5.1.3Proceeds from borrowings 90 0 (90)Repayment of borrowings (151) (100) 51Net cash used in financing activities (61) (100) (39)Net decrease in cash and cash equivalents 333 (1,067) (1,401)Cash and cash equivalents at the beginning of the period 6,045 6,378 (333)Cash and cash equivalents at end of the year 5.1.4 6,378 5,311 (1,067)Source: Appendix A5.1.1 Operating activities ($425,000 decrease)The decrease in cash inflows from operating activities is due mainly to a $578,000 increase inemployee costs and a $686,000 increase in payments to suppliers.The net cash flows from operating activities does not equal the operating result for the year as theexpected revenues and expenses of the <strong>Council</strong> include non-cash items which have been excluded<strong>Yarriambiack</strong> <strong>Shire</strong> <strong>Council</strong> <strong>Budget</strong> <strong>–</strong> <strong>2010</strong>/<strong>2011</strong> 26