Yarriambiack Shire Council Budget – 2010/2011
Yarriambiack Shire Council Budget – 2010/2011
Yarriambiack Shire Council Budget – 2010/2011

You also want an ePaper? Increase the reach of your titles
YUMPU automatically turns print PDFs into web optimized ePapers that Google loves.
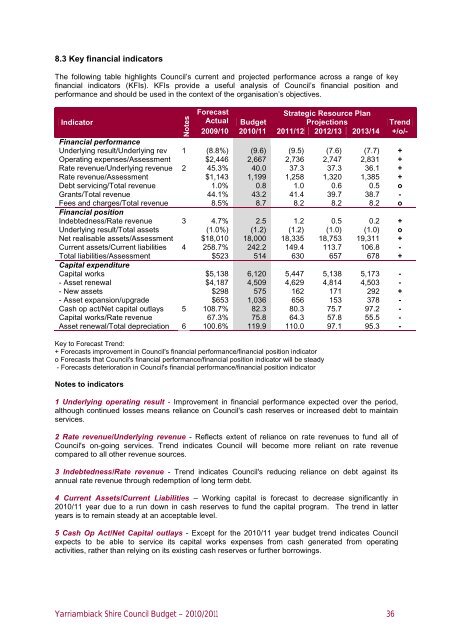
8.3 Key financial indicatorsThe following table highlights <strong>Council</strong>’s current and projected performance across a range of keyfinancial indicators (KFIs). KFIs provide a useful analysis of <strong>Council</strong>’s financial position andperformance and should be used in the context of the organisation’s objectives.ForecastStrategic Resource PlanIndicatorActual <strong>Budget</strong>ProjectionsTrend2009/10 <strong>2010</strong>/11 <strong>2011</strong>/12 2012/13 2013/14 +/o/-Financial performanceUnderlying result/Underlying rev 1 (8.8%) (9.6) (9.5) (7.6) (7.7) +Operating expenses/Assessment $2,446 2,667 2,736 2,747 2,831 +Rate revenue/Underlying revenue 2 45.3% 40.0 37.3 37.3 36.1 +Rate revenue/Assessment $1,143 1,199 1,258 1,320 1,385 +Debt servicing/Total revenue 1.0% 0.8 1.0 0.6 0.5 oGrants/Total revenue 44.1% 43.2 41.4 39.7 38.7 -Fees and charges/Total revenue 8.5% 8.7 8.2 8.2 8.2 oFinancial positionIndebtedness/Rate revenue 3 4.7% 2.5 1.2 0.5 0.2 +Underlying result/Total assets (1.0%) (1.2) (1.2) (1.0) (1.0) oNet realisable assets/Assessment $18,010 18,000 18,335 18,753 19,311 +Current assets/Current liabilities 4 258.7% 242.2 149.4 113.7 106.8 -Total liabilities/Assessment $523 514 630 657 678 +Capital expenditureCapital works $5,138 6,120 5,447 5,138 5,173 -- Asset renewal $4,187 4,509 4,629 4,814 4,503 -- New assets $298 575 162 171 292 +- Asset expansion/upgrade $653 1,036 656 153 378 -Cash op act/Net capital outlays 5 108.7% 82.3 80.3 75.7 97.2 -Capital works/Rate revenue 67.3% 75.8 64.3 57.8 55.5 -Asset renewal/Total depreciation 6 100.6% 119.9 110.0 97.1 95.3 -NotesKey to Forecast Trend:+ Forecasts improvement in <strong>Council</strong>'s financial performance/financial position indicatoro Forecasts that <strong>Council</strong>'s financial performance/financial position indicator will be steady- Forecasts deterioration in <strong>Council</strong>'s financial performance/financial position indicatorNotes to indicators1 Underlying operating result - Improvement in financial performance expected over the period,although continued losses means reliance on <strong>Council</strong>'s cash reserves or increased debt to maintainservices.2 Rate revenue/Underlying revenue - Reflects extent of reliance on rate revenues to fund all of<strong>Council</strong>'s on-going services. Trend indicates <strong>Council</strong> will become more reliant on rate revenuecompared to all other revenue sources.3 Indebtedness/Rate revenue - Trend indicates <strong>Council</strong>'s reducing reliance on debt against itsannual rate revenue through redemption of long term debt.4 Current Assets/Current Liabilities <strong>–</strong> Working capital is forecast to decrease significantly in<strong>2010</strong>/11 year due to a run down in cash reserves to fund the capital program. The trend in latteryears is to remain steady at an acceptable level.5 Cash Op Act/Net Capital outlays - Except for the <strong>2010</strong>/11 year budget trend indicates <strong>Council</strong>expects to be able to service its capital works expenses from cash generated from operatingactivities, rather than relying on its existing cash reserves or further borrowings.<strong>Yarriambiack</strong> <strong>Shire</strong> <strong>Council</strong> <strong>Budget</strong> <strong>–</strong> <strong>2010</strong>/<strong>2011</strong> 36