Biochemistry I Laboratory
Biochemistry I Laboratory
Biochemistry I Laboratory

You also want an ePaper? Increase the reach of your titles
YUMPU automatically turns print PDFs into web optimized ePapers that Google loves.
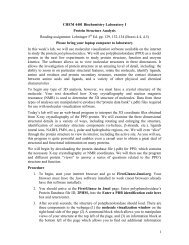
Results1) Prepare a sketch of your TLC plate (to scale) (figure1).a. Figure numbered with appropriate legend (1 pt)b. Samples identified at starting line (1 pt)c. Solvent front identified (1 pt)d. Spots identified (2 pt)2) Table (1) containing R f values for each of the known samples (use largest spot if more thanone is present).a. Table is numbered and contains an appropriate description (1 pt).b. R f values for known 5 samples (2.5 pt)c. Example calculation for one sample is shown below table (1 pt).3) Table (2) of R f values for each of spot from the unknown sample (vegetable oil).a. Table is numbered and contains an appropriate description (1 pt).b. R f values for each spot (2.5 pt)c. Table contains a column with tentative identification of spots, where possible (2 pt).Bonus (2 pt). The vegetable oil sample will likely contain some spots that are not readilyidentifiable. Do some some research on vegetable oil content, especially in terms of saturated andunsaturated fatty acid content. What are the identities of the major lipids contained in vegetableoils? What types of R f values might you expect these lipids to have (low?, medium?, high?) if theywere chromatographed in this solvent? Justify your reasoning.<strong>Laboratory</strong> performance (2 pt)4