A Study on Feature Analysis for Musical Instrument Classification Da ...
A Study on Feature Analysis for Musical Instrument Classification Da ...
A Study on Feature Analysis for Musical Instrument Classification Da ...

You also want an ePaper? Increase the reach of your titles
YUMPU automatically turns print PDFs into web optimized ePapers that Google loves.
A <str<strong>on</strong>g>Study</str<strong>on</strong>g> <strong>on</strong> <strong>Feature</strong> <strong>Analysis</strong> <strong>for</strong><strong>Musical</strong> <strong>Instrument</strong> Classificati<strong>on</strong><strong>Da</strong> DengChristian SimmermacherStephen CranefieldThe In<strong>for</strong>mati<strong>on</strong> ScienceDiscussi<strong>on</strong> Paper SeriesNumber 2007/04August 2007ISSN 1177-455X
University of OtagoDepartment of In<strong>for</strong>mati<strong>on</strong> ScienceThe Department of In<strong>for</strong>mati<strong>on</strong> Science is <strong>on</strong>e of seven departments that make up theSchool of Business at the University of Otago. The department offers courses of studyleading to a major in In<strong>for</strong>mati<strong>on</strong> Science within the BCom, BA and BSc degrees. Inadditi<strong>on</strong> to undergraduate teaching, the department is also str<strong>on</strong>gly involved in postgraduateresearch programmes leading to MCom, MA, MSc and PhD degrees. Researchprojects in spatial in<strong>for</strong>mati<strong>on</strong> processing, c<strong>on</strong>necti<strong>on</strong>ist-based in<strong>for</strong>mati<strong>on</strong> systems,software engineering and software development, in<strong>for</strong>mati<strong>on</strong> engineering anddatabase, software metrics, distributed in<strong>for</strong>mati<strong>on</strong> systems, multimedia in<strong>for</strong>mati<strong>on</strong>systems and in<strong>for</strong>mati<strong>on</strong> systems security are particularly well supported.The views expressed in this paper are not necessarily those of the department as awhole. The accuracy of the in<strong>for</strong>mati<strong>on</strong> presented in this paper is the sole resp<strong>on</strong>sibilityof the authors.CopyrightCopyright remains with the authors. Permissi<strong>on</strong> to copy <strong>for</strong> research or teaching purposesis granted <strong>on</strong> the c<strong>on</strong>diti<strong>on</strong> that the authors and the Series are given due acknowledgment.Reproducti<strong>on</strong> in any <strong>for</strong>m <strong>for</strong> purposes other than research or teachingis <strong>for</strong>bidden unless prior written permissi<strong>on</strong> has been obtained from the authors.Corresp<strong>on</strong>denceThis paper represents work to date and may not necessarily <strong>for</strong>m the basis <strong>for</strong> the authors’final c<strong>on</strong>clusi<strong>on</strong>s relating to this topic. It is likely, however, that the paper will appearin some <strong>for</strong>m in a journal or in c<strong>on</strong>ference proceedings in the near future. The authorswould be pleased to receive corresp<strong>on</strong>dence in c<strong>on</strong>necti<strong>on</strong> with any of the issuesraised in this paper, or <strong>for</strong> subsequent publicati<strong>on</strong> details. Please write directly to theauthors at the address provided below. (Details of final journal/c<strong>on</strong>ference publicati<strong>on</strong>venues <strong>for</strong> these papers are also provided <strong>on</strong> the Department’s publicati<strong>on</strong>s web pages:http://www.otago.ac.nz/in<strong>for</strong>mati<strong>on</strong>science/pubs/). Any other corresp<strong>on</strong>dence c<strong>on</strong>cerningthe Series should be sent to the DPS Coordinator.Department of In<strong>for</strong>mati<strong>on</strong> ScienceUniversity of OtagoP O Box 56DunedinNEW ZEALANDFax: +64 3 479 8311email: dps@infoscience.otago.ac.nzwww: http://www.otago.ac.nz/in<strong>for</strong>mati<strong>on</strong>science/
A <str<strong>on</strong>g>Study</str<strong>on</strong>g> <strong>on</strong> <strong>Feature</strong> <strong>Analysis</strong> <strong>for</strong> <strong>Musical</strong> <strong>Instrument</strong> Classificati<strong>on</strong><strong>Da</strong> Deng † , Christian Simmermacher, Stephen CranefieldDept. of In<strong>for</strong>mati<strong>on</strong> Science, University of OtagoP O Box 56, Dunedin, New Zealand† ddeng@infoscience.otago.ac.nzAbstractIn tackling data mining and pattern recogniti<strong>on</strong> tasks, finding a compact but effective set of featureshas often been found to be a crucial step in the overall problem-solving process. In this paper we presentan empirical study <strong>on</strong> feature analysis <strong>for</strong> classical instrument recogniti<strong>on</strong>, using machine learningtechniques to select and evaluate features extracted from a number of different feature schemes. It isrevealed that there is significant redundancy between and within feature schemes comm<strong>on</strong>ly used inpractice. Our results suggest that further feature analysis research is necessary in order to optimizefeature selecti<strong>on</strong> and achieve better results <strong>for</strong> the instrument recogniti<strong>on</strong> problem.1 Introducti<strong>on</strong>Music data analysis and retrieval has become a very popular research field in recent years. The advanceof signal processing and data mining techniques has led to intensive study <strong>on</strong> c<strong>on</strong>tent-based musicretrieval [1][2], music genre classificati<strong>on</strong> [3][4], duet analysis [2], and most frequently, <strong>on</strong> musicalinstrument detecti<strong>on</strong> and classificati<strong>on</strong> (e.g., [5][6][7][8]).<strong>Instrument</strong> detecti<strong>on</strong> techniques can have many potential applicati<strong>on</strong>s. For instance, detecting and analyzingsolo passages can lead to more knowledge about different musical styles and be further utilizedto provide a basis <strong>for</strong> lectures in musicology. Various applicati<strong>on</strong>s <strong>for</strong> audio editing, audio and video retrievalor transcripti<strong>on</strong> can be supported. An overview of audio in<strong>for</strong>mati<strong>on</strong> retrieval has been presentedby Foote [9] and extended by various authors [2][10]. Other applicati<strong>on</strong>s include playlist generati<strong>on</strong>[11], acoustic envir<strong>on</strong>ment classificati<strong>on</strong> [12, 13], and using audio feature extracti<strong>on</strong> to support videoscene analysis and annotati<strong>on</strong> [14].One of the most crucial aspects of instrument classificati<strong>on</strong>, is to find the right feature extracti<strong>on</strong>scheme. During the last few decades, research <strong>on</strong> audio signal processing has focused <strong>on</strong> speech recogniti<strong>on</strong>,but few features can be directly applied to solve the instrument classificati<strong>on</strong> problem. Newmethods are being investigated so as to achieve semantic interpretati<strong>on</strong> of low-level features extractedby audio signal processing methods. For example, a framework of low-level and high-level featuresgiven in the MPEG-7 multimedia descripti<strong>on</strong> standard [15] can be used to create applicati<strong>on</strong>-specific1
descripti<strong>on</strong> schemes. These can be used to annotate music with a minimum of human supervisi<strong>on</strong> <strong>for</strong>the purpose of music retrieval.In this paper, we present a study <strong>on</strong> feature extracti<strong>on</strong> and selecti<strong>on</strong> <strong>for</strong> instrument classificati<strong>on</strong> usingmachine learning techniques. <strong>Feature</strong>s were first selected by ranking and other schemes, data sets ofreduced features were generated, and their per<strong>for</strong>mance in instrument classificati<strong>on</strong> was further testedwith a few classifiers using cross validati<strong>on</strong>s. A number of feature schemes were c<strong>on</strong>sidered based<strong>on</strong> human percepti<strong>on</strong>, cepstral features, and the MPEG-7 audio descriptors. The per<strong>for</strong>mance of thefeature schemes was assessed first individually, and then in combinati<strong>on</strong> with each other. We also useddimensi<strong>on</strong> reducti<strong>on</strong> techniques so as to gain insight <strong>on</strong> the right dimensi<strong>on</strong>ality <strong>for</strong> feature selecti<strong>on</strong>.Our aim was to find differences and synergies between different feature schemes and test them withvarious classifiers, so that a robust classificati<strong>on</strong> system could be built. <strong>Feature</strong>s extracted from differentfeature schemes were ranked and selected, and a number of classificati<strong>on</strong> algorithms were employed andmanaged to achieve good accuracies in three groups of experiments: instrument family classificati<strong>on</strong>,individual instrument classificati<strong>on</strong>, and classificati<strong>on</strong> of solo passages.Following this introducti<strong>on</strong>, Secti<strong>on</strong> 2 reviews the recent relevant work <strong>on</strong> musical instrument recogniti<strong>on</strong>and audio feature analysis. Secti<strong>on</strong> 3 outlines the approach we adopted in tackling the problemof instrument classificati<strong>on</strong>, including feature extracti<strong>on</strong> schemes, feature selecti<strong>on</strong> methods, and classificati<strong>on</strong>algorithms used. Experiment settings and results based <strong>on</strong> the proposed approach are thenpresented in Secti<strong>on</strong> 4. We summarize the findings and c<strong>on</strong>clude the paper in Secti<strong>on</strong> 5.2 Related WorkVarious feature schemes have been proposed and adopted in the literature of instrument sound analysis.On top of the adopted feature schemes, different computati<strong>on</strong>al models or classificati<strong>on</strong> algorithmshave been employed <strong>for</strong> the purposes of instrument detecti<strong>on</strong> and classificati<strong>on</strong>.Mel-frequency cepstral coefficients (MFCC) features are comm<strong>on</strong>ly employed not <strong>on</strong>ly in speech processing,but also in music genre classificati<strong>on</strong> and instrument classificati<strong>on</strong>. Marques and Moreno [5]built a classifier that can distinguish between eight instruments with 70% accuracy using Support VectorMachines (SVM). Er<strong>on</strong>en [6] assessed the per<strong>for</strong>mance of MFCC features and spectral and temporalfeatures such as amplitude envelope and spectral centroids <strong>for</strong> instrument classificati<strong>on</strong>. The Karhunen-Loeve trans<strong>for</strong>m was c<strong>on</strong>ducted to decorrelate the features, and k-nearest neighbors (k-NN) classifierswere used with their per<strong>for</strong>mance assessed through cross validati<strong>on</strong>. The results favoured MFCC features,and violin and guitar were am<strong>on</strong>g the most poorly recognized instruments.The MPEG-7 audio framework targets standardizati<strong>on</strong> of the extracti<strong>on</strong> and descripti<strong>on</strong> of audio features[15][16]. The sound descripti<strong>on</strong> of MPEG-7 audio features was assessed by Peeters et al. [17]based <strong>on</strong> their perceived timbral similarity. It was c<strong>on</strong>cluded that combinati<strong>on</strong>s of the MPEG-7 descriptorscan be reliably applied in assessing the similarity of musical sounds. Xi<strong>on</strong>g et al. [12] comparedMFCC and MPEG-7 audio features <strong>for</strong> the purpose of sports audio classificati<strong>on</strong>, adopting hiddenMarkov models (HMM) and a number of classifiers such as k-NN, Gaussian mixture models, AdaBoost,and SVM. Kim et al. [10] examined the use of HMM-based classifiers trained <strong>on</strong> MPEG-7 based audiodescriptors to solve audio classificati<strong>on</strong> problems such as speaker recogniti<strong>on</strong> and sound classificati<strong>on</strong>.Brown et al. [18] c<strong>on</strong>ducted a study <strong>on</strong> identifying four instruments of the woodwind family. <strong>Feature</strong>sused were cepstral coefficients, c<strong>on</strong>stant Q trans<strong>for</strong>m, spectral centroid, autocorrelati<strong>on</strong> coefficients. Forclassificati<strong>on</strong>, a scheme using Bayes decisi<strong>on</strong> rules was adopted. The recogniti<strong>on</strong> rates based <strong>on</strong> the22
feature sets varied from 79%-84%.Agostini et al. [7] extracted spectral features <strong>for</strong> timbre classificati<strong>on</strong>, and the per<strong>for</strong>mance was assessedover SVM, k-NN, can<strong>on</strong>ical discriminant analysis, and quadratic discriminant analysis, with thefirst and last being the best. Compared with the average 55.7% correct t<strong>on</strong>e classificati<strong>on</strong> rate achievedby some c<strong>on</strong>servatory students, it was argued that computer-based timbre recogniti<strong>on</strong> can exceed humanper<strong>for</strong>mance at least <strong>for</strong> isolated t<strong>on</strong>es.Essid et al. [8] processed and analyzed solo musical phrases from ten instruments. Each instrumentwas represented by fifteen minutes of audio material from various CD recordings. Spectral features,audio spectrum flatness, MFCC, and derivatives of MFCC were used as features. SVM yielded anaverage result of 76% <strong>for</strong> 35 features.Livshin and Rodet [19] evaluated the use of m<strong>on</strong>oph<strong>on</strong>ic phrases <strong>for</strong> detecti<strong>on</strong> of instruments inc<strong>on</strong>tinuous recordings of solo and duet per<strong>for</strong>mances. The study made use of a database with 108different solos from seven instruments. A set of 62 features (temporal, energy, spectral, harm<strong>on</strong>ic, andperceptual) was proposed and subsequently reduced by feature selecti<strong>on</strong>. The best 20 features were used<strong>for</strong> realtime per<strong>for</strong>mance. A leave-<strong>on</strong>e-out cross validati<strong>on</strong> using a k-NN classifier gave an accuracyof 85% <strong>for</strong> 20 features and 88% <strong>for</strong> 62 features. Benetos et al. [20] adopted branch-and-bound searchto extract a 6-feature subset from a set of MFCC, MPEG-7, and other audio spectral features. A n<strong>on</strong>negativematrix factorizati<strong>on</strong> algorithm was used to develop the classifiers, gaining an accuracy of 95.2%<strong>for</strong> six instruments.Kostek [2] studied the classificati<strong>on</strong> of twelve instruments played under different articulati<strong>on</strong>s. Sheused multilayer neural networks trained <strong>on</strong> wavelet and MPEG-7 features. It was found that a combinati<strong>on</strong>of these two feature schemes can significantly improve the classificati<strong>on</strong> accuracy to a range of55% - 98%, with an average of about 70%. Misclassificati<strong>on</strong>s occurred mainly within each instrumentfamily (woodwinds, brass, and strings). A more recent study by Kaminskyj et al. [21] dealt with isolatedm<strong>on</strong>oph<strong>on</strong>ic instrument sound recogniti<strong>on</strong> using k-NN classifiers. <strong>Feature</strong>s used include MFCC,c<strong>on</strong>stant Q trans<strong>for</strong>m spectrum frequency, Root mean square (RMS) amplitude envelop, spectral centroid,and multidimensi<strong>on</strong> scaling analysis trajectories. These features underwent principal comp<strong>on</strong>entanalysis (PCA) to be reduced to a total dimensi<strong>on</strong>ality of 710. k-NN classifiers were then trained underdifferent hierarchical schemes. A leave-<strong>on</strong>e-out strategy was used, yielding an accuracy of 93% ininstrument recogniti<strong>on</strong>, and 97% in instrument family recogniti<strong>on</strong>.Some progress has been made in musical instrument identificati<strong>on</strong> <strong>for</strong> polyph<strong>on</strong>ic recordings. Egginkand Brown [22] presented a study <strong>on</strong> the recogniti<strong>on</strong> of five instruments (flute, oboe, violin and cello)in accompanied s<strong>on</strong>atas and c<strong>on</strong>certos. Gaussian-mixture-model classifiers were employed <strong>on</strong> featuresreduced by PCA. The classificati<strong>on</strong> per<strong>for</strong>mance <strong>on</strong> a variety of data resources ranged from 75% to 94%,while misclassificati<strong>on</strong> occurred mostly <strong>for</strong> flute and oboe (both classified as violin).With the emergence of many audio feature schemes, feature analysis and selecti<strong>on</strong> has been gainingmore research attenti<strong>on</strong> recently. A good introducti<strong>on</strong> <strong>on</strong> feature selecti<strong>on</strong> was given in Guy<strong>on</strong> and Elisseef[23], outlining the methods of correlati<strong>on</strong> modelling, selecti<strong>on</strong> criteria, and the general approachesof using filters and wrappers. Yu and Liu [24] discussed some generic methods such as in<strong>for</strong>mati<strong>on</strong> gain(IG) and symmetric uncertainty (SU), where an approximati<strong>on</strong> method <strong>for</strong> correlati<strong>on</strong> and redundancyanalysis was proposed based <strong>on</strong> using SU as the correlati<strong>on</strong> measure. Grimaldi et al. [25] evaluatedselecti<strong>on</strong> strategies such as IG and gain ratio (GR) <strong>for</strong> music genre classificati<strong>on</strong>. Livshin and Rodet[19] used linear discriminant analysis to repeatedly find and remove the least significant feature, until asubset of 20 features was obtained from the original 62 feature types. The reduced feature set gave an33
average classificati<strong>on</strong> rate of 85.2%, very close to that of the complete set.Benchmarking is still an open issue that remains unresolved. There are very limited resources available<strong>for</strong> benchmarking, so direct comparis<strong>on</strong> of these various approaches is not possible. Most studieshave used recordings digitized from pers<strong>on</strong>al or instituti<strong>on</strong>al CD collecti<strong>on</strong>s. McGill University MasterSamples (http://www.music.mcgill.ca/resources/mums/html/mums.html) have been used in some studies[7][22][21], while the music samples from the MIS <strong>Da</strong>tabase from UIOWA (http//:theremin.music.uiowa.edu/)were also widely used [18][6][22][20].3 <strong>Feature</strong> <strong>Analysis</strong> and Validati<strong>on</strong>3.1 <strong>Instrument</strong> categoriesTraditi<strong>on</strong>ally, musical instruments are classified into four main categories or families: string, brass,woodwind, and percussi<strong>on</strong>. For example, violin is a typical string instrument, oboe and clarinet bel<strong>on</strong>gto the woodwind category, horn and trumpet are brass instruments. Piano is usually classified asa percussi<strong>on</strong> instrument. Sounds produced by these instruments bear different acoustic attributes. Afew characteristics can be obtained from these sound envelopes, including attack (the time from silenceto amplitude peak), sustain (the time length in maintaining level amplitude), decay (the time the soundfades from sustain to silence), and release (the time of the decay from the moment the instrument stopsplaying). To achieve accurate classificati<strong>on</strong> of instruments, more complicated features need to be extracted.3.2 <strong>Feature</strong> Extracti<strong>on</strong> <strong>for</strong> instrument classificati<strong>on</strong>Because of the complexity of modelling instrument timbre, various feature schemes have been proposedthrough acoustic study and pattern recogniti<strong>on</strong> research. One of our main intenti<strong>on</strong>s is to investigatethe per<strong>for</strong>mance of different feature schemes as well as find a good feature combinati<strong>on</strong> <strong>for</strong> arobust instrument classifier. Here, we use three different extracti<strong>on</strong> methods, namely, percepti<strong>on</strong>-basedfeatures, MPEG-7 based features, and MFCC. The first two feature sets c<strong>on</strong>sist of temporal and spectralfeatures, while the last is based <strong>on</strong> spectral analysis. These features, 44 in total, are listed in Table 1.Am<strong>on</strong>g them the first sixteen are percepti<strong>on</strong>-based features, the next seven are MPEG-7 descriptors, andthe last 26 are MFCC features.3.2.1 Percepti<strong>on</strong>-based featuresTo extract percepti<strong>on</strong>-based features, music sound samples are segmented into 40ms frames with 10msoverlap. Each frame signal was analysed by 40 band-pass filters centered at Bark scale frequencies. Thefollowing are some important perceptual features that are used in this study:• zero-crossing rate (ZCR), an indicator <strong>for</strong> the noisiness of the signal, often used in speech processingapplicati<strong>on</strong>s:N∑|sign(F n ) − sign(F n−1 )|n=1ZCR =(1)2Nwhere N is the number of samples in the frame, and F n the value of the n-th sample of a frame.44
Table 1. <strong>Feature</strong> Abbreviati<strong>on</strong>s and Descripti<strong>on</strong>s# Abbr. Descripti<strong>on</strong> Scheme1 ZC Zero Crossings2-3 ZCRM, ZCRD Mean and standard deviati<strong>on</strong> of ZC Ratios4-5 RMSM, RMSD Mean and standard deviati<strong>on</strong> of RMS Percepti<strong>on</strong>-6-7 CentroidM, CentroidD Mean and standard deviati<strong>on</strong> of Centroid based8-9 BandwidthM, BandwidthD Mean and standard deviati<strong>on</strong> of Bandwidth10-11 FluxM, FluxD Mean and standard deviati<strong>on</strong> of Flux12 HC Harm<strong>on</strong>ic Centroid Descriptor13 HD Harm<strong>on</strong>ic Deviati<strong>on</strong> Descriptor14 HS Harm<strong>on</strong>ic Spread Descriptor15 HV Harm<strong>on</strong>ic Variati<strong>on</strong> Descriptor MPEG-716 SC Spectral Centroid Descriptor17 TC Temporal Centroid Descriptor18 LAT Log-Attack-Time Descriptor19-44MFCCkM, MFCCkDMean and standard deviati<strong>on</strong>of the first 13 linear MFCCsMFCC• the Root-mean-square (RMS), which summarizes the energy distributi<strong>on</strong> in each frame and channelover time:N∑Fn2 √ n=1RMS =(2)N• Spectral centroid, which measures the average frequency weighted by sum of spectrum amplitudewithin <strong>on</strong>e frame:K∑P (f k )f kk=1Centroid =(3)K∑P (f k )where f k is the frequency in the k-th channel, the number of channels is K=40, and P (f k ) thespectrum amplitude <strong>on</strong> the k-th channel.• Bandwidth, also referred to as centroid width, shows the frequency range of a signal weighted byits spectrum:K∑|Centroid − f k )|P (f k )Bandwidth =k=1k=1K∑P (f k )k=1• Flux, which represents the amount of local spectral change, calculated as the squared differencebetween the normalized magnitudes of c<strong>on</strong>secutive spectral distributi<strong>on</strong>s:K∑Flux = |P (f k ) − P (f k−1 )| 2 (5)k=2(4)55
These features were extracted from multiple segments of a sample signal and it is the mean value andthe standard deviati<strong>on</strong> that are used as the feature values <strong>for</strong> each music sample.3.2.2 MPEG-7 timbral features<strong>Instrument</strong>s have unique properties which can be described by their harm<strong>on</strong>ic spectrums and their temporaland spectral envelopes. The MPEG-7 audio framework [15] endeavours to provide a completefeature set <strong>for</strong> the descripti<strong>on</strong> of harm<strong>on</strong>ic instrument sounds. We c<strong>on</strong>sider in this work <strong>on</strong>ly two classesof timbral descriptors in the MPEG-7 framework: Timbral Spectral and Timbral Temporal. These includeseven feature descriptors: Harm<strong>on</strong>ic Centroid (HC), Harm<strong>on</strong>ic Deviati<strong>on</strong> (HD), Harm<strong>on</strong>ic Spread(HS), Harm<strong>on</strong>ic Variati<strong>on</strong> (HV), Spectral Centroid (SC), Log-Attack-Time (LAT), and Temporal Centroid(TC). The first five bel<strong>on</strong>g to the Timbral Spectral feature scheme, while the last two bel<strong>on</strong>g to theTimbral Temporal scheme. Note that the SC feature value is obtained from the spectral analysis of theentire sample signal, so it is similar but different from the CentroidM of the percepti<strong>on</strong>-based features.CentoidM is aggregated from the centroid feature analysed from short segments within a sample.3.2.3 MFCC featuresTo obtain MFCC features, a signal needs to be trans<strong>for</strong>med from frequency (Hertz) scale to mel scale:(mel(f) = 2595 log 10 1 + f )700The mel scale has 40 filter channels. The first extracted filterbank output is a measure of power of thesignal, and the following 12 linear spaced outputs represent the spectral envelope. The other 27 logspacedchannels account <strong>for</strong> the harm<strong>on</strong>ics of the signal. Finally a discrete cosine trans<strong>for</strong>m c<strong>on</strong>vertsthe filter outputs to give the MFCCs. Here, the mean and standard deviati<strong>on</strong> of the first thirteen linearvalues are extracted <strong>for</strong> classificati<strong>on</strong>.3.3 <strong>Feature</strong> Selecti<strong>on</strong><strong>Feature</strong> selecti<strong>on</strong> techniques are often necessary to optimize the feature set used <strong>for</strong> classificati<strong>on</strong>.This way, redundant features are removed from the classificati<strong>on</strong> process and the dimensi<strong>on</strong>ality ofthe feature set is reduced, so as to save computati<strong>on</strong>al cost and defy the “curse of dimensi<strong>on</strong>ality” thatimpedes the c<strong>on</strong>structi<strong>on</strong> of good classifiers [23]. To assess the quality of a feature used <strong>for</strong> classificati<strong>on</strong>,a correlati<strong>on</strong>-based approach is often adopted. In general, a feature is good if it is relevant to the classc<strong>on</strong>cept but is not redundant given the inclusi<strong>on</strong> of other relevant features. The core issue is modellingthe correlati<strong>on</strong> between two variables or features. Based <strong>on</strong> in<strong>for</strong>mati<strong>on</strong> theory, a number of indicatorscan be developed to rank the features by their correlati<strong>on</strong> to the class. Relevant features will yield ahigher correlati<strong>on</strong>.Given a pre-discretized feature set, the ‘noisiness’ of the feature X can be measured as the entropy,defined as:H(X) = − ∑ P (x i )log 2 P (x i ), (7)i(6)66
where P (x i ) is the prior probability <strong>for</strong> the i-th discretized value of X. The entropy of X after observinganother variable Y is then defined asH(X|Y ) = − ∑ jP (y j ) ∑ i(P (x i |y j )log 2 P (x i |y j )), (8)The In<strong>for</strong>mati<strong>on</strong> Gain (IG) [26], indicating the amount of additi<strong>on</strong>al in<strong>for</strong>mati<strong>on</strong> about X provided byY , is given asIG(X|Y ) = H(X) − H(X|Y ) (9)IG itself is symmetrical, i.e., IG(X|Y ) =IG(Y |X), but in practice it favours features with more values[24].The gain rati<strong>on</strong> method (GR) normalizes IG by an entropy term:GR(X|Y ) = IG(X|Y )H(Y )A better measure is defined as the symmetrical uncertainty [27]:IG(X|Y )SU = 2H(X) + H(Y )SU compensates <strong>for</strong> IG’s bias toward features with more values and restricts the value range within [0, 1].Despite a number of ef<strong>for</strong>ts previously made using the above criteria [25][24], there is no golden rule<strong>for</strong> the selecti<strong>on</strong> of features. In practice, it is found that the per<strong>for</strong>mance of the selected feature subsetsis also related to the choice of classifiers <strong>for</strong> pattern recogniti<strong>on</strong> tasks. The wrapper-based approach [28]was there<strong>for</strong>e proposed, using a classifier combined with some guided search mechanism to choose anoptimal selecti<strong>on</strong> from a given feature set.3.4 <strong>Feature</strong> analysis by dimensi<strong>on</strong> reducti<strong>on</strong>To get a reference level <strong>for</strong> deciding how many features are sufficient <strong>for</strong> problem solving, <strong>on</strong>e can usestandard dimensi<strong>on</strong> reducti<strong>on</strong> or multidimensi<strong>on</strong> scaling (MDS) techniques such as PCA and Isomap[29] to assess an embedding dimensi<strong>on</strong> of the high-dimensi<strong>on</strong>al feature space. PCA projects highdimensi<strong>on</strong>aldata into low-dimensi<strong>on</strong> space while preserving the maximum variance. Naturally it isoptimal <strong>for</strong> data compressi<strong>on</strong> but has also been found rather effective in pattern recogniti<strong>on</strong> tasks suchas face recogniti<strong>on</strong> and handwriting recogniti<strong>on</strong>. The Isomap algorithm calculates the geodesic distancesbetween points in a high-dimensi<strong>on</strong>al observati<strong>on</strong> space, and then c<strong>on</strong>ducts eigenanalysis of the distancematrix. As the output, new coordinates of the data points in a low-dimensi<strong>on</strong>al embedding are obtainedthat best preserve their intrinsic geodesic distances. In this study, we used PCA and Isomap to explorethe sparseness of the feature space and examine the residuals of the chosen dimensi<strong>on</strong>ality so as toestimate at least how many features should be included in a subset. The per<strong>for</strong>mance of the selectedsubsets was then compared with that of the reduced and trans<strong>for</strong>med feature space using MDS.3.5 <strong>Feature</strong> validati<strong>on</strong> via classificati<strong>on</strong><strong>Feature</strong> combinati<strong>on</strong> schemes generated from the selecti<strong>on</strong> rankings were then further assessed usingclassifiers and cross-validated. The following classificati<strong>on</strong> algorithms were used in this study: k-NN,(10)(11)77
an instance-based classifier weighted by the reciprocal of distances [30]; Naive Bayes classifier employsBayesian models in the feature space; and SVM, which is a statistical learning algorithm and has beenwidely used in many classificati<strong>on</strong> tasks.4 Experiment4.1 Experiment settingsWe tackled the music instrument classificati<strong>on</strong> problem in two stages: 1) instrument type classificati<strong>on</strong>using samples of individual instruments, and 2) direct classificati<strong>on</strong> of individual instruments.A number of utilities were used <strong>for</strong> feature extracti<strong>on</strong> and classificati<strong>on</strong> experiments. The percepti<strong>on</strong>basedfeatures were extracted using the IPEM Toolbox [31]. The Auditory Toolbox [32] was used toextract MFCC features. The MPEG-7 audio descriptor features were obtained using an implementati<strong>on</strong>by Casey [33]. Various algorithms implemented in Weka (Waikato Envir<strong>on</strong>ment <strong>for</strong> Knowledge<strong>Analysis</strong>) [34] were used <strong>for</strong> feature selecti<strong>on</strong> and classificati<strong>on</strong> experiments.Samples used in the first experiment were taken from the previously menti<strong>on</strong>ed UIOWA MIS collecti<strong>on</strong>.The collecti<strong>on</strong> c<strong>on</strong>sists of 761 single instrument files from 20 instruments which cover the dynamicrange from pianissimo to <strong>for</strong>tissimo and are played bowed or plucked, with or without vibrato, depending<strong>on</strong> the instrument. All samples were recorded in the same acoustic envir<strong>on</strong>ment (anechoic chamber)under the same c<strong>on</strong>diti<strong>on</strong>s. We realize that this is a str<strong>on</strong>g c<strong>on</strong>straint and our result may not generalizeto a complicated setting such as live recordings of an orchestra. To explore the potential of variousfeature schemes <strong>for</strong> instrument classificati<strong>on</strong> in live solo per<strong>for</strong>mance, solo passage music samples werecollected from music CD recordings from private collecti<strong>on</strong>s and the University of Otago library.In general, the purposes of these experiments is to test the per<strong>for</strong>mance of the feature schemes, evaluatethe features using feature selecti<strong>on</strong>, and also test the per<strong>for</strong>mance of different classifiers.4.2 <strong>Instrument</strong> family classificati<strong>on</strong>4.2.1 <strong>Feature</strong> ranking and selecti<strong>on</strong>We first simplified the instrument classificati<strong>on</strong> problem by grouping the instruments into four families:piano, brass, string and woodwind. For this four-class problem, the best 20 features of the three selecti<strong>on</strong>methods are shown in Table 2. All of them indicate that Log-Attack-Time (LAT) and Harm<strong>on</strong>icDeviati<strong>on</strong> (HD) are the most relevant features. The following features have nearly equal relevance. Itis important to note that the standard deviati<strong>on</strong>s of the MFCCs are predominantly present in all threeselecti<strong>on</strong>s. Also the measures of the centroid and bandwidth, as well as the deviati<strong>on</strong> of flux, zero crossingsand mean of RMS can be found in each of them. These selecti<strong>on</strong>s are different from the best 20features selected by Livshin and Rodet [19], where MPEG-7 descriptors were not c<strong>on</strong>sidered. However,they also included bandwidth (spectral spread), MFCC, and Spectral Centroid.Classifiers were then used to assess the quality of feature selecti<strong>on</strong>. A number of algorithms, includingNaive Bayes, k-NN, multilayer perceptr<strong>on</strong>s (MLP), radial basis functi<strong>on</strong> (RBF), and SVM, werecompared <strong>on</strong> classificati<strong>on</strong> per<strong>for</strong>mance based <strong>on</strong> 10-fold cross validati<strong>on</strong>. Am<strong>on</strong>g these, the NaiveBayes classifiers employed kernel estimati<strong>on</strong> during training. A plain k-NN classifier was used herewith k = 1. SVM classifiers were built using sequential mimimal optimisati<strong>on</strong>, with RBF kernels and acomplexity value of 100, with all attributes standardized. Pairwise binary SVM classifiers were trained88
Table 2. <strong>Feature</strong> ranking <strong>for</strong> single t<strong>on</strong>es.RankIG GR SU SVM<strong>Feature</strong> Value <strong>Feature</strong> Value <strong>Feature</strong> Value <strong>Feature</strong>1 LAT 0.8154 LAT 0.5310 LAT 0.4613 HD2 HD 0.6153 HD 0.5270 HD 0.3884 FluxD3 FluxD 0.4190 MFCC2M 0.3230 BandwidthM 0.2267 LAT4 BandwidthM 0.3945 MFCC12D 0.2970 FluxD 0.2190 MFCC3D5 MFCC1D 0.3903 MFCC4D 0.2700 RMSM 0.2153 MFCC4M6 MFCC3D 0.381 BandwidthM 0.2660 MFCC1D 0.2084 ZCRD7 RMSM 0.3637 RMSM 0.2640 MFCC4M 0.1924 MFCC1M8 BandwidthD 0.3503 MFCC13D 0.2580 MFCC11D 0.1893 HC9 MFCC4M 0.3420 MFCC2D 0.2450 MFCC3D 0.1864 MFCC9D10 MFCC11D 0.3125 MFCC11D 0.2400 BandwidthD 0.1799 ZC11 ZCRD 0.3109 MFCC7D 0.2350 MFCC2M 0.1784 RMSM12 CentroidD 0.2744 FluxD 0.2290 MFCC4D 0.1756 CentroidD13 MFCC8D 0.2734 MFCC1D 0.2240 MFCC7D 0.1710 MFCC9M14 MFCC6D 0.2702 MFCC4M 0.2200 MFCC12D 0.1699 BandwidthM15 MFCC7D 0.2688 CentroidM 0.2150 ZCRD 0.1697 MFCC5D16 ZC 0.2675 SC 0.2110 CentroidD 0.1653 SC17 MFCC4D 0.2604 MFCC5M 0.2090 CentroidM 0.1610 MFCC12D18 CentroidM 0.2578 CentroidD 0.2080 MFCC13D 0.1567 MFCC7M19 MFCC10M 0.2568 HC 0.1950 SC 0.1563 MFCC2M20 MFCC10D 0.2519 MFCC1M 0.1910 MFCC8D 0.1532 MFCC6M99
Table 3. Classifier per<strong>for</strong>mance of the instrument families.<strong>Feature</strong> Scheme k-NN Naive Bayes SVM MLP RBFAll 44 95.75% 86.5% 97.0% 95.25% 95.0%Best 20 94.25% 86.25% 95.5% 93.25% 95.5%Best 10 90.25% 86.25% 94.25% 91.0% 87.0%Best 5 89.5% 81.0% 91.75% 86.75% 84.5%Table 4. Per<strong>for</strong>mance of classifiers trained <strong>on</strong> the “Selected 17” feature set.Classifier 1NN Naive Bayes SVM MLP RBFPer<strong>for</strong>mance 96.5% 88.25% 92.75% 94% 94%<strong>for</strong> this multi-class problem, with between 10 and 80 support vectors created <strong>for</strong> each SVM. The structureof MLP is automatically defined in the Weka implementati<strong>on</strong>, and each MLP is trained over 500epochs with a learning rate of 0.3 and a momentum of 0.2.To investigate the redundancy of the feature set, we used the In<strong>for</strong>mati<strong>on</strong> Gain filter to generatereduced feature sets of the best 20, best 10, and best 5 features respectively. Other choices instead of IGwere found to produce similar per<strong>for</strong>mance and hence were not c<strong>on</strong>sidered further. The per<strong>for</strong>mance ofthese reduced sets was compared with the original full set with all 44 features. The results are given inTable 3.These can be c<strong>on</strong>trasted with results presented in Table 4, where 17 features were selected using a ranksearch based <strong>on</strong> SVM attribute evaluati<strong>on</strong> and the correlati<strong>on</strong>-based CfsSubset scheme implemented inWeka. This feature set, denoted as “Selected 17”, includes CentroidD, BandwidthM, FluxD, ZCRD,MFCC[2-6]M, MFCC10M, MFCC3/4/6/8D, HD, LAT, and TC. It is noted that TC c<strong>on</strong>tributes positivelyto the classificati<strong>on</strong> task, even though it is not am<strong>on</strong>g the top 20 ranked features. Here the classificati<strong>on</strong>algorithms take similar settings as those used to generate the results shown in Table 3. The per<strong>for</strong>manceof the “Selected 17” feature set is very close to that of the full feature set. Actually the k-NN classifierper<strong>for</strong>ms even slightly better with the reduced feature set.4.2.2 Evaluati<strong>on</strong> of feature extracti<strong>on</strong> schemesSince the k-NN classifier produced similar per<strong>for</strong>mance in much less computing time compared withSVM, we further used 1-NN classifiers to assess the c<strong>on</strong>tributi<strong>on</strong> from each individual feature schemeand improvements achieved through scheme combinati<strong>on</strong>s. Apart from combining the schemes twoby two, another opti<strong>on</strong> was also c<strong>on</strong>sidered, picking the top 50% ranked attributes from each featurescheme, resulting in a 21-dimensi<strong>on</strong> composite set, called ‘Top 50% mix’. The results are presented inTable 5. Besides overall per<strong>for</strong>mance, classificati<strong>on</strong> accuracy <strong>on</strong> each instrument type is also reported.From these results, it can be seen that am<strong>on</strong>g the individual feature subsets, MFCC outper<strong>for</strong>ms bothIPEM and MPEG-7. This is different from the finding of Xi<strong>on</strong>g et al. [12] that MPEG-7 features givebetter results than MFCC <strong>for</strong> the classificati<strong>on</strong> of sports audio scenes such as applause, cheering, andmusic etc. The difference is however marginal (94.73% vs 94.60%). Given that the scope of our studyis much narrower, this should not be taken as a c<strong>on</strong>tradicti<strong>on</strong>. Indeed, some researchers also found morefavourable results using MFCC instead of MPEG-7 <strong>for</strong> instrument classificati<strong>on</strong> [10][8].In terms of average per<strong>for</strong>mance of combinati<strong>on</strong> schemes listed in Table 5, the MFCC+MPEG-71010
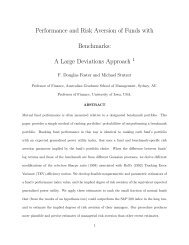
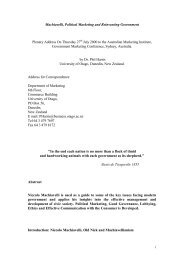
Table 5. Per<strong>for</strong>mance (%) in classifying the 4 classes (10 CV)<strong>Feature</strong> Sets Brass Woodwind String Piano OverallMFCC (26) 99 90 89 95 93.25MPEG-7 (7) 90 62 76 99 81.75IPEM (11) 93 63 81 100 84.25MFCC+MPEG-7 (33) 98 92 91 100 95.25MFCC+IPEM (37) 98 89 94 98 94.75IPEM+MPEG-7(18) 93 76 85 100 88.5Top 50% mix (21) 95 89 88 100 93Best 20 97 88 92 100 94.25Selected 17 97 94 95 100 96.5set shows the best results, while the MPEG-7+IPEM set with 18 features has the poorest result. It isobserved that the inclusi<strong>on</strong> of MFCC is most beneficial <strong>for</strong> woodwind and string families, while theinclusi<strong>on</strong> of the MPEG-7 seems to boost the per<strong>for</strong>mance <strong>on</strong> piano and woodwind. Generally, the morefeatures that are included, the better the per<strong>for</strong>mance. However, between 33, 37 and 44 features thedifference is almost negligible. It is interesting to note that the ‘Selected 17’ feature set produces verygood per<strong>for</strong>mance. The top 50% mix set produces a per<strong>for</strong>mance as high as 93%, which is slightly worsethan that of ‘best 20’ probably due to the fact that the selecti<strong>on</strong> is not d<strong>on</strong>e globally am<strong>on</strong>g all features.All these results, however, clearly indicate that there is str<strong>on</strong>g redundancy within the feature schemes.In terms of accuracy <strong>on</strong> each instrument type, the piano can be classified by most feature sets ratheraccurately. The MPEG-7 and IPEM sets have problems in identifying woodwind instruments, withwhich MFCC can cope very well. Combining MFCC with other feature sets can boost the per<strong>for</strong>mance<strong>on</strong> ‘woodwind’ significantly. The MPEG-7 set does not per<strong>for</strong>m well <strong>on</strong> string instruments either, however,a combinati<strong>on</strong> with either MFCC or IPEM can effectively enhance the per<strong>for</strong>mance. These resultssuggest that these individual feature sets are quite complementary to each other. On the other hand, thegood per<strong>for</strong>mance of the selected feature set clearly indicates that there is high redundancy am<strong>on</strong>g thethree basic feature schemes.4.2.3 Dimensi<strong>on</strong> reducti<strong>on</strong>Overall, when the total number of included features is reduced, the classificati<strong>on</strong> accuracy decreasesm<strong>on</strong>ot<strong>on</strong>ically. However, it is interesting to see from Table 3 that even with five features <strong>on</strong>ly, theclassifiers achieved a classificati<strong>on</strong> rate around 90%. In order to interpret this finding, we used PCA andIsomap to reduce the dimensi<strong>on</strong>ality of the full feature set. The two methods report similar results. Thenormalized residuals of the extracted first 10 comp<strong>on</strong>ents using these methods are shown in Figure 1.The 3-D projecti<strong>on</strong> of the Isomap algorithm, generated by selecting the first three coordinates from theresulting embedding, is shown in Figure 2. For both methods the residual falls under 0.5% after the 4thcomp<strong>on</strong>ent, although the dropping reported by Isomap is more significant. This suggests that the datamanifold of the 44-dimensi<strong>on</strong>al feature space may have an embedded dimensi<strong>on</strong> of 4 or 5 <strong>on</strong>ly.As a test, the first five principal comp<strong>on</strong>ents (PC) of the complete feature set were extracted, resultingin weighted combinati<strong>on</strong>s of MFCC, IPEM and MPEG-7 features. A 1-NN classifier trained with thefive PCs reports an average accuracy of 88.0% in a 10-fold cross validati<strong>on</strong>, very close to that of the1111
8070PCAIsomap60Residual (%)504030201001 2 3 4 5 6 7 8 9 10Comp<strong>on</strong>entFigure 1. Dicree diagram of the reduced comp<strong>on</strong>ents. The x axis gives the comp<strong>on</strong>ent number, andthe y axis gives the relevant normalized residual (in %). Only ten comp<strong>on</strong>ents are shown.3000200010000−1000−2000−30000.50x 10 4−0.5−1−1.5−2−2.5−3200010000−1000−2000−3000−4000Figure 2. 3-D embedding of the feature space. There are 400 instrument samples, each with itscategory labelled: × - ‘piano’, ◦ - ‘string’, + - ‘brass’, ∗ - ‘woodwind’. The three axes corresp<strong>on</strong>d tothe trans<strong>for</strong>med first 3 dimensi<strong>on</strong>s generated by Isomap.1212
“Best 5” selecti<strong>on</strong> given in Table 3. This further c<strong>on</strong>firms that there is str<strong>on</strong>g redundancy within andbetween the three feature schemes.4.3 <strong>Instrument</strong> Classificati<strong>on</strong>4.3.1 Individual instrument sound recogniti<strong>on</strong>Table 6. C<strong>on</strong>fusi<strong>on</strong> matrix <strong>for</strong> all 20 instruments with 10-fold CV.<strong>Instrument</strong>Classified Asa b c d e f g h i j k l m n o p q r s ta=piano 19 0 0 0 0 0 0 0 0 0 0 0 1 0 0 0 0 0 0 0b=tuba 0 20 0 0 0 0 0 0 0 0 0 0 0 0 0 0 0 0 0 0c=trumpet 0 0 19 0 1 0 0 0 0 0 0 0 0 0 0 0 0 0 0 0d=horn 0 0 0 19 0 0 0 0 0 0 0 0 0 1 0 0 0 0 0 0e=ttromb<strong>on</strong>e 0 0 0 0 18 0 0 1 0 0 0 0 0 0 0 1 0 0 0 0f=btromb<strong>on</strong>e 0 0 0 0 1 19 0 0 0 0 0 0 0 0 0 0 0 0 0 0g=violin 0 0 0 0 0 0 25 0 0 0 0 0 0 0 0 0 0 0 0 0h=viola 0 0 0 0 1 2 1 18 0 0 0 0 0 0 0 1 0 1 0 1i=bass 0 0 0 0 0 0 0 0 23 0 0 0 0 0 0 1 0 1 0 0j=cello 0 0 0 0 0 0 0 0 0 25 0 0 0 0 0 0 0 0 0 0k=sax 0 0 0 0 0 0 0 0 0 0 8 1 0 0 0 0 0 0 0 1l=altosax 0 0 0 0 0 0 0 0 0 0 0 8 0 0 0 0 2 0 0 0m=oboe 0 1 0 0 0 1 0 1 0 1 0 0 6 0 0 0 0 0 0 0n=basso<strong>on</strong> 0 0 0 0 0 0 0 0 0 0 0 0 0 10 0 0 0 0 0 0o=flute 0 0 0 0 0 0 0 0 1 0 0 0 0 0 7 1 0 0 1 0p=altoflute 0 0 0 0 0 0 0 0 0 0 0 0 0 0 1 7 2 0 0 0q=bflute 0 0 0 0 0 0 0 0 0 0 0 0 0 0 0 2 8 0 0 0r=bclarinet 0 0 0 0 0 1 0 0 1 1 0 0 0 0 1 0 0 6 0 0s=bbclarinet 0 0 0 0 0 0 0 0 1 0 0 0 0 0 1 0 0 0 8 0t=ebclarinet 0 0 0 0 0 0 0 0 0 0 1 1 0 0 1 2 0 0 0 5Next, all 20 instruments were directly distinguished from each other. Here we chose to use 1-NNclassifiers as they work very fast and give almost the same accuracies as compared to SVM. A featureselecti<strong>on</strong> process was c<strong>on</strong>ducted, using correlati<strong>on</strong>-based subset selecti<strong>on</strong> <strong>on</strong> attributes searched by SVMevaluati<strong>on</strong>. This resulted in a subset of 21 features, including LAT, FluxM, ZCRD, HD, CentroidD, TC,HC, RMSD, FluxD, and 12 MFCC values. The c<strong>on</strong>fusi<strong>on</strong> matrix <strong>for</strong> individual instrument classificati<strong>on</strong>is given in Table 6. <strong>Instrument</strong> a is piano, and instruments b-f bel<strong>on</strong>g to the brass type, g-j the stringtype, and k-t the woodwind type.The overall average classificati<strong>on</strong> accuracy is 86.9%. The per<strong>for</strong>mance in general is quite satisfactory,especially <strong>for</strong> piano and string instruments. Only <strong>on</strong>e out 20 piano samples was wr<strong>on</strong>gly classified(as oboe). Am<strong>on</strong>g string instruments, the most significant errors occurred <strong>for</strong> viola samples, with anaccuracy of 18/25=72%. Classificati<strong>on</strong> errors in the woodwind category mainly occurred within itself,having <strong>on</strong>ly sporadic cases of wr<strong>on</strong>g classificati<strong>on</strong> as instruments of other families. The woodwindinstruments have the lowest classificati<strong>on</strong> accuracy compared with other instruments, but this may relate1313
to the limited number of woodwind data samples in the current data set. The worst classified instrumentis E b clarinet. There is also a notable c<strong>on</strong>fusi<strong>on</strong> between alto flute and bass flute.4.3.2 Classificati<strong>on</strong> of solo phrasesFinally, a preliminary experiment <strong>on</strong> solo phrases was c<strong>on</strong>ducted. For this experiment <strong>on</strong>e representativeinstrument of each instrument type was chosen. These were: trumpet, flute, violin, and piano. Todetect the right instrument in solo passages, a classifier was trained <strong>on</strong> short m<strong>on</strong>oph<strong>on</strong>ic phrases. Tensec<strong>on</strong>d l<strong>on</strong>g solo excerpts from CD recordings were tested <strong>on</strong> this classifier. The problem here is thatthe test samples were recorded with accompaniment, thus are often polyph<strong>on</strong>ic in nature. Selectingfewer and clearly distinguishable instruments <strong>for</strong> the trained classifier helps to make the problem moreaddressable. It is assumed that an instrument is playing dominantly in the solo passages. Thus, itsspectral characteristics will probably be the most dominant and the features derived from the harm<strong>on</strong>icspectrum are assumed to work. Horiz<strong>on</strong>tal masking effects will probably the most crucial problem totackle. Overlapping t<strong>on</strong>es could mask the attack and decay time.The samples <strong>for</strong> the four instruments were taken from live CD recordings. Passages of around tensec<strong>on</strong>ds’ length were segmented into two sec<strong>on</strong>d phrases with 50% overlap. The amount of music sampleswas basically balanced across the four instrument types, as seen in Table 7. A change to shorter <strong>on</strong>esec<strong>on</strong>d segments <strong>for</strong> training and testing showed similar results but with a tendency to lower recogniti<strong>on</strong>rates. The trumpet passages sometimes have multiple brass instruments playing. The flutes are accom-Table 7. <strong>Da</strong>ta sources <strong>for</strong> the solo phrase experiment.Trumpet 9 min / 270 samplesPiano 10.6 min / 320 samplesViolin 10 min / 300 samplesFlute 9 min / 270 samplesTotal 38.6 min / 1160 samplespanied by multiple flutes, a harp or a double bass, and the violin passages are sometimes flute and stringaccompanied.The same SVM-based feature selecti<strong>on</strong> scheme used be<strong>for</strong>e searched out 19 features <strong>for</strong> this task.These included: 8 MFCC values (mainly means), 5 MPEG-7 features (HD, HS, HV, SC), and 4 percepti<strong>on</strong>basedfeatures (CentroidM, FluxM, ZCRD, and RMSM. An average accuracy of 98.4% was achievedover four instruments using 3-NN classifiers with distance weighting. The Kappa statistics is reported as0.98 <strong>for</strong> 10-fold cross validati<strong>on</strong>, which suggests that the classifier stability is very str<strong>on</strong>g. The c<strong>on</strong>fusi<strong>on</strong>matrix is shown in Table 8. Numbers shown are percentage. The largest classificati<strong>on</strong> errors occurredwith flute being classified as piano.Here again, MFCC was shown to be dominant in classificati<strong>on</strong>. To achieve a good per<strong>for</strong>mance, it isnoted that the other two feature schemes also c<strong>on</strong>tributed favourably.4.4 Discussi<strong>on</strong>The scopes of some current studies and per<strong>for</strong>mance achieved are listed in Table 9, where the numberof instruments, classificati<strong>on</strong> accuracies (in %) of instrument family classificati<strong>on</strong> and individual instrumentclassificati<strong>on</strong> are listed. It can be seen that our results are better or comparable with those obtained1414
Table 8. C<strong>on</strong>fusi<strong>on</strong> matrix <strong>for</strong> intrument recogniti<strong>on</strong> in solo passages (per<strong>for</strong>mance in %).<strong>Instrument</strong>Classified Aspiano trumpet violin flutepiano 100 0 0 0trumpet 0.4 99.6 0 0violin 0.3 0.3 98.7 0.7flute 3.7 0 1.5 94.8by other researchers. However, it is noted that the number of instruments included is different, and thedata sources are different despite the fact that most of these included the UIOWA sample set. The exactvalidati<strong>on</strong> process used may be different as well. For instance, we used 10-fold cross validati<strong>on</strong>, whileKaminskj and Czaszejko [21] and others used leave-<strong>on</strong>e-out.Paired with a good per<strong>for</strong>mance level, the feature dimensi<strong>on</strong>ality of our approach is relatively lowwith the selected feature sets having less than or around 20 dimensi<strong>on</strong>s. On the other hand, Eggink andBrown [22] used the same UIOWA sample collecti<strong>on</strong> but a different feature scheme with 90 dimensi<strong>on</strong>s,reporting an average recogniti<strong>on</strong> rate of <strong>on</strong>ly 59% <strong>on</strong> five instruments (flute, clarinet, oboe, violin andcello). Livshin and Rodet [19] used 62 features and selected the best 20 <strong>for</strong> real-time solo detecti<strong>on</strong>.Kaminskj and Czaszejko [21] used 710 dimensi<strong>on</strong>s after PCA. In our study, a 5-dimensi<strong>on</strong> set after PCAcan also achieve a good classificati<strong>on</strong> accuracy. A notable work is by Benetos et al. [20], where <strong>on</strong>ly 6features are selected. However, there are <strong>on</strong>ly six instruments included in their study and the scalabilityof the feature selecti<strong>on</strong> needs to be further assessed.Table 9. Per<strong>for</strong>mance of instrument classificati<strong>on</strong> compared with that of ours.Work no. of instruments Family classificati<strong>on</strong> Individual classificati<strong>on</strong>Er<strong>on</strong>en [6] 29 77 35Martin and Kim [35] 14 90 70Agostini et al. [7] 27 81 70Kostek [2] 12 - 70Kaminskyj and Czaszejko [21] 19 97 93Benetos et al. [20] 6 - 95.2This work 20 96.5 86.9As <strong>for</strong> classificati<strong>on</strong> of solo passages, it is hard to make direct comparis<strong>on</strong> as no comm<strong>on</strong> benchmarkshave been accepted and researchers used various sources including per<strong>for</strong>mance CDs [8, 19]. With morebenchmark data becoming available in the future, it is our intenti<strong>on</strong> to further assess the feature schemesand feature selecti<strong>on</strong> methods employed in this study.5 C<strong>on</strong>clusi<strong>on</strong>In this paper, we presented a study <strong>on</strong> feature extracti<strong>on</strong> and evaluati<strong>on</strong> <strong>for</strong> the problem of instrumentclassificati<strong>on</strong>. The main c<strong>on</strong>tributi<strong>on</strong> is that we investigated three major feature extracti<strong>on</strong> schemes, analyzedthem using feature selecti<strong>on</strong> measures based <strong>on</strong> in<strong>for</strong>mati<strong>on</strong> theory, and assessed their per<strong>for</strong>manceusing classifiers undergoing cross validati<strong>on</strong>.1515
For experiments <strong>on</strong> m<strong>on</strong>ot<strong>on</strong>e music samples, a publicly available data set was used so as to allow<strong>for</strong> the purpose of benchmarking. <strong>Feature</strong> ranking measures were employed and these produced similarfeature selecti<strong>on</strong> outputs, which basically aligns with the per<strong>for</strong>mance obtained through classifiers. TheMPEG-7 audio descriptor scheme c<strong>on</strong>tributed the first two most significant features (LAT and HD)<strong>for</strong> instrument classificati<strong>on</strong>, however, as indicated by feature analysis, MFCC and percepti<strong>on</strong>-basedfeatures dominated in the ranked selecti<strong>on</strong>s as well as SVM-based selecti<strong>on</strong>s. It was also dem<strong>on</strong>stratedthat am<strong>on</strong>g the individual feature schemes it is the MFCC feature scheme that gave the best classificati<strong>on</strong>per<strong>for</strong>mance.It is interesting to see that the feature schemes adopted in current research works are all highly redundantas assessed by the dimensi<strong>on</strong> reducti<strong>on</strong> techniques. This may imply that an optimal and compactfeature scheme remains to be found, allowing classifiers to be built fast and accurately. The finding ofan embedding dimensi<strong>on</strong> as low as 4 or 5, however, may relate to the specific sound source files we usedin this study and its scalability needs further verificati<strong>on</strong>.On the other hand, in the classificati<strong>on</strong> of individual instruments, even the full feature set would nothelp much especially in distinguishing woodwind instruments. In fact, it is found in our experiments <strong>on</strong>solo passage classificati<strong>on</strong> that some MPEG-7 features are not reliable <strong>for</strong> giving robust classificati<strong>on</strong>results with the current fixed segmentati<strong>on</strong> of solo passages. For instance, attack time is not selectedin the feature scheme, but it can become a very effective attribute with the help of <strong>on</strong>set detecti<strong>on</strong>. Allthese indicate more research work in feature extracti<strong>on</strong> and analysis is still necessary.Apart from the timbral feature schemes we examined, there are other audio descriptors in the MPEG-7 framework that may c<strong>on</strong>tribute to better instrument classificati<strong>on</strong>, e.g. those obtained from globalspectral analysis such as spectral envelop and spectral flatness [15]. Despite some possible redundancywith the introducti<strong>on</strong> of new features, it would be interesting to investigate the possible gains that can beobtained through more study <strong>on</strong> feature analysis and selecti<strong>on</strong>, and how the proposed approach scaleswith increased feature numbers and increased amount of music samples.In the future, we intend to investigate the feature extracti<strong>on</strong> issue with the use of real world liverecorded music data, develop new feature schemes, as well as experiment <strong>on</strong> finding better mechanismsto combine the feature schemes and improve the classificati<strong>on</strong> per<strong>for</strong>mance <strong>for</strong> more solo instruments.References[1] Y.-H. Tseng, “C<strong>on</strong>tent-based retrieval <strong>for</strong> music collecti<strong>on</strong>s,” in Proc. of the 22nd ACM SIGIRInternati<strong>on</strong>al C<strong>on</strong>ference <strong>on</strong> Research and Development in In<strong>for</strong>mati<strong>on</strong> Retrieval, 1999, pp. 176–182.[2] B. Kostek, “<strong>Musical</strong> instrument classificati<strong>on</strong> and duet analysis employing music in<strong>for</strong>mati<strong>on</strong> retrievaltechniques,” Proceedings of IEEE, vol. 92, no. 4, pp. 712–729, 2004.[3] G. Tzanetakis and P. Cook, “<strong>Musical</strong> genre classificati<strong>on</strong> of audio signals,” IEEE Transacti<strong>on</strong>s <strong>on</strong>speech and audio processing, vol. 10, pp. 293–302, 2002.[4] T. Lidy and A. Rauber, “Evaluati<strong>on</strong> of feature extractors and psycho-acoustic trans<strong>for</strong>mati<strong>on</strong>s <strong>for</strong>music genre classificati<strong>on</strong>,” in Proceedings of the 6th Inter. C<strong>on</strong>f. <strong>on</strong> Music In<strong>for</strong>mati<strong>on</strong> Retrieval,2005, pp. 34–41.1616
[5] J. Marques and P. Moreno, “A study of musical instrument classificati<strong>on</strong> using gaussian mixturemodels and support vector machines,” Compaq Computer Corporati<strong>on</strong>, Tech. Rep. CRL 99/4,1999.[6] A. Er<strong>on</strong>en, “Comparis<strong>on</strong> of features <strong>for</strong> music instrument recogniti<strong>on</strong>,” in Proc. of the IEEE Workshop<strong>on</strong> Applicati<strong>on</strong>s of Signal Processing to Audio and Acoustics, 2001, pp. 19–22.[7] G. Agostini, M. L<strong>on</strong>gari, and E. Poolastri, “<strong>Musical</strong> instrument timbres classificati<strong>on</strong> with spectralfeatures,” EURASIP Journal <strong>on</strong> Applied Signal Processing, vol. 2003, no. 1, 2003.[8] S. Essid, G. Richard, and B. <strong>Da</strong>vid, “Efficient musical instrument recogniti<strong>on</strong> <strong>on</strong> solo per<strong>for</strong>mancemusic using basic features,” in Proceedings of the Audio Engineering Society 25th Internati<strong>on</strong>alC<strong>on</strong>ference, no. 2-5. Audio Engineering Society, 2004, accessed 22.11.2005. [Online]. Available:http://www.tsi.enst.fr/%7Eessid/pub/aes25.pdf[9] J. Foote, “An overview of audio in<strong>for</strong>mati<strong>on</strong> retrieval,” Multimedia Systems, vol. 7, pp. 2–10, 1999.[10] H. G. Kim, N. Moreau, and T. Sikora, “Audio classificati<strong>on</strong> based <strong>on</strong> MPEG-7 spectral basis representati<strong>on</strong>,”IEEE Transacti<strong>on</strong>s <strong>on</strong> Circuits and Systems <strong>for</strong> Video Technology, vol. 14, no. 5, pp.716–725, 2004.[11] J. Aucouturier and F. Pachet, “Scaling up music playlist generati<strong>on</strong>,” in Proc. IEEE Internati<strong>on</strong>alC<strong>on</strong>ference <strong>on</strong> Multimedia and Expo, vol. 1, 2002, pp. 105 – 108.[12] Z. Xi<strong>on</strong>g, R. Radhakrishnan, A. Divakaran, and T. Huang, “Comparing MFCC and MPEG-7 audiofeatures <strong>for</strong> feature extracti<strong>on</strong>, maximum likelihood HMM and entropic prior HMM <strong>for</strong> sportsaudio classificati<strong>on</strong>,” in Proc. of IEEE Internati<strong>on</strong>al C<strong>on</strong>ference <strong>on</strong> Multimedia and Expo, vol. 3,2003, pp. 397–400.[13] L. Ma, B. Milner, and D. Smith, “Accoustic envir<strong>on</strong>ment classificati<strong>on</strong>,” ACM Transacti<strong>on</strong>s <strong>on</strong>Speech and Language Processing, vol. 3, no. 2, pp. 1–22, 2006.[14] A. Divakaran, R. Regunathan, Z. Xi<strong>on</strong>g, and M. Casey, “Procedure <strong>for</strong> audio-assisted browsingof news video using generalized sound recogniti<strong>on</strong>,” in Proceedings of SPIE, vol. 5021, 2003, pp.160–166.[15] ISO/IEC Working Group, “MPEG-7 overview,” URL http://www.chiarigli<strong>on</strong>e.org/mpeg/standards/mpeg-7/mpeg-7.htm, 2004, accessed 8.2.2007.[16] A. T. Lindsay and J. Herre, “MPEG-7 audio - an overview,” J. Audio Eng. Soc., vol. 49, no. 7/8,pp. 589–594, 2001.[17] G. Peeters, S. McAdams, and P. Herrera, “<strong>Instrument</strong> sound descripti<strong>on</strong> in the c<strong>on</strong>text of MPEG-7,”in Proc. of Internati<strong>on</strong>al Computer Music C<strong>on</strong>ference, 2000, pp. 166–169.[18] J. C. Brown, O. Houix, and S. McAdams, “<strong>Feature</strong> dependence in the automatic identificati<strong>on</strong> ofmusical woodwind instruments,” Journal of the Acoustical Society of America, vol. 109, no. 3, pp.1064–1072, 2001.1717
[19] A. A. Livshin and X. Rodet, “<strong>Musical</strong> instrument identificati<strong>on</strong> in c<strong>on</strong>tinuous recordings,” in Proceedingsof the 7th Internati<strong>on</strong>al C<strong>on</strong>ference <strong>on</strong> Digital Audio Effects, 2004, pp. 222–226.[20] E. Benetos, M. Kotti, and C. Kotropoulos, “<strong>Musical</strong> instrument classificati<strong>on</strong> using n<strong>on</strong>-negativematrix factorizati<strong>on</strong> algorithms and subset feature selecti<strong>on</strong>,” in Proceedings of ICASSP 2006,vol. V, 2006, pp. 221–224.[21] I. Kaminskyj and T. Czaszejko, “Automatic recogniti<strong>on</strong> of isolated m<strong>on</strong>oph<strong>on</strong>ic musical instrumentsounds using knnc,” Journal of Intelligent In<strong>for</strong>mati<strong>on</strong> Systems, vol. 24, no. 2/3, pp. 199–221, 2005.[22] J. Eggink and G. J. Brown, “<strong>Instrument</strong> recogniti<strong>on</strong> in accompanied s<strong>on</strong>atas and c<strong>on</strong>certos,” inProc. of IEEE Internati<strong>on</strong>al C<strong>on</strong>ference <strong>on</strong> Acoustics, Speech, and Signal Processing, vol. IV,2004, pp. 217–220.[23] I. Guy<strong>on</strong> and A. Elisseeff, “An introducti<strong>on</strong> to variable and feature selecti<strong>on</strong>,” Journal of MachineLearning Research, vol. 3, pp. 1157–1182, 2003.[24] L. Yu and H. Liu, “Efficient feature selecti<strong>on</strong> via analysis of relevance and redundancy,” Journal ofMachine Learning Research, vol. 5, pp. 1205–1224, 2004.[25] M. Grimaldi, P. Cunningham, and A. Kokaram, “An evaluati<strong>on</strong> of alternative feature selecti<strong>on</strong>strategies and ensemble techniques of classifying music,” School of Computer Science and In<strong>for</strong>matics,Trinity College Dublin, Tech. Rep. TCD-CS-2003-21, 2003.[26] J. Qinlan, C4.5: Programs <strong>for</strong> machine learning. Morgan Kaufmann, 1993.[27] W. H. Press, B. P. Flannery, S. A. Teukolsky, and W. T. Vetterling, Numerical recipes in C. CambridgeUniversity Press, 1988.[28] R. Kohavi and G. H. John, “Wrappers <strong>for</strong> feature subset selecti<strong>on</strong>,” Artificial Intelligence, vol. 97,no. 1-2, pp. 273–324, 1997.[29] J. Tenenbaum, V. de Silva, and J. Lang<strong>for</strong>d, “A global geometric framework <strong>for</strong> n<strong>on</strong>linear dimensi<strong>on</strong>alityreducti<strong>on</strong>,” Science, vol. 290, pp. 2319–2323, 2000.[30] C. Atkes<strong>on</strong>, A. Moore, and S. Schaal, “Locally weighted learning,” Artificial Intelligence Review,vol. 11, pp. 11–73, 1997.[31] IPEM, “IPEM-toolbox,” URL http://www.ipem.ugent.be/Toolbox, accessed 10/9/2005.[32] M. Slaney, “Auditory-toolbox,” 1998, accessed 22.2.2007. [Online]. Available:http://rvl4.ecn.purdue.edu/ malcolm/interval/1998-010[33] M. Casey, “MPEG-7 sound-recogniti<strong>on</strong> tools,” IEEE Trans. <strong>on</strong> Circuits and Systems <strong>for</strong> VideoTechnology, vol. 11, no. 6, pp. 737–747, 2001.[34] I. H. Witten and E. Frank, <strong>Da</strong>ta Mining: Practical machine learning tools and techniques, 2nd ed.Morgan Kaufmann, San Francisco, 2005.[35] K. D. Martin and Y. E. Kim, “<strong>Musical</strong> instrument identificati<strong>on</strong>: a pattern-recogniti<strong>on</strong> approach,”Journal of the Acoustical Society of America, vol. 103, no. 3 pt 2, p. 1768, 1998.1818