Scenario maps on agriculture, environment and recreation - Plurel
Scenario maps on agriculture, environment and recreation - Plurel
Scenario maps on agriculture, environment and recreation - Plurel
- No tags were found...

Create successful ePaper yourself
Turn your PDF publications into a flip-book with our unique Google optimized e-Paper software.
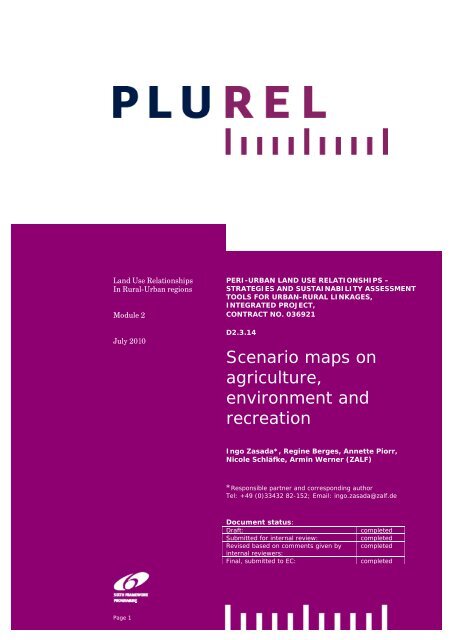
L<strong>and</strong> Use Relati<strong>on</strong>shipsIn Rural-Urban regi<strong>on</strong>sModule 2July 2010PERI-URBAN LAND USE RELATIONSHIPS –STRATEGIES AND SUSTAINABILITY ASSESSMENTTOOLS FOR URBAN-RURAL LINKAGES,INTEGRATED PROJECT,CONTRACT NO. 036921D2.3.14<str<strong>on</strong>g>Scenario</str<strong>on</strong>g> <str<strong>on</strong>g>maps</str<strong>on</strong>g> <strong>on</strong><strong>agriculture</strong>,envir<strong>on</strong>ment <strong>and</strong>recreati<strong>on</strong>Ingo Zasada*, Regine Berges, Annette Piorr,Nicole Schläfke, Armin Werner (ZALF)*Resp<strong>on</strong>sible partner <strong>and</strong> corresp<strong>on</strong>ding authorTel: +49 (0)33432 82-152; Email: ingo.zasada@zalf.deDocument status:Draft:Submitted for internal review:Revised based <strong>on</strong> comments given byinternal reviewers:Final, submitted to EC:completedcompletedcompletedcompletedPage 1 • PLUREL D2311 • August 2010Page 1
C<strong>on</strong>tentsCONTENTS .......................................................................................... 2ABSTRACT........................................................................................... 3INTRODUCTION .................................................................................. 5MAPS .................................................................................................. 6INDICATOR DESCRIPTION .......................................................................... 6AGRICULTURAL AREA 2000 AND SCENARIO CHANGES ......................................... 8FARM PRODUCTIVITY 2000 AND SCENARIO CHANGES ........................................17NO. OF PART-TIME FARMERS 2000 AND SCENARIO CHANGES...............................26UNSEALED SOIL 2000 AND SCENARIO CHANGES ..............................................35UNFRAGMENTED LANDSCAPE 2000 AND SCENARIO CHANGES ...............................44LANDSCAPE PATCHINESS 2000 AND SCENARIO CHANGES....................................53LANDSCAPE INTERSPERSION 2000 AND SCENARIO CHANGES................................62DENSITY OF NATURAL HABITATS 2000 AND SCENARIO CHANGES...........................71DENSITY OF ENDANGERED BIRD SPECIES 2000 AND SCENARIO CHANGES ................80HEAVY METAL EMISSIONS 2000 AND SCENARIO CHANGES ..................................89Page 2 • PLUREL report D2.3.14_15 • July 2010
AbstractThe Deliverable Report at h<strong>and</strong> presents values for the year 2000 of thedifferent indicators used to describe the envir<strong>on</strong>mental, agricultural as well asrecreati<strong>on</strong>al status of the European NUTSX regi<strong>on</strong>s. Moreover it shows theresults of the implementati<strong>on</strong> of the generic resp<strong>on</strong>se functi<strong>on</strong>s for theseindicators with the results for artificial surface for the PLUREL scenarios(2015, 2025) provided by the RUG model. The resulting changes of theindicator values per scenario for the time steps 2000-2015 <strong>and</strong> 2000 – 2025are displayed in the <str<strong>on</strong>g>maps</str<strong>on</strong>g>.Page 3 • PLUREL report D2.3.14_15 • July 2010
Classificati<strong>on</strong> of results/outputs:For the purpose of integrating the results of this deliverable into the PLURELExplorer disseminati<strong>on</strong> platform as fact sheets <strong>and</strong> associated documentati<strong>on</strong>please classify the results in relati<strong>on</strong> to spatial scale; DPSIR framework; l<strong>and</strong>use issues; output indicators <strong>and</strong> knowledge type.Spatial scale for results:Regi<strong>on</strong>al, nati<strong>on</strong>al, EuropeanEuropeanDPSIR framework:Driver, Pressure, State, Impact,Resp<strong>on</strong>seImpactL<strong>and</strong> use issues covered:Housing, Traffic, Agriculture, Naturalarea, Water, Tourism/recreati<strong>on</strong>Agriculture, Natural area, Water,Tourism/recreati<strong>on</strong><str<strong>on</strong>g>Scenario</str<strong>on</strong>g> sensitivity:Are the products/outputs sensitive toModule 1 scenarios?YesOutput indicators:Socio-ec<strong>on</strong>omic & envir<strong>on</strong>mentalexternal c<strong>on</strong>straints; L<strong>and</strong> Usestructure; RUR Metabolism; ECOsystemintegrity; EcosystemServices; Socio-ec<strong>on</strong>omic assessmentCriteria; Decisi<strong>on</strong>sKnowledge type:Narrative storylines; Resp<strong>on</strong>sefuncti<strong>on</strong>s; GIS-based <str<strong>on</strong>g>maps</str<strong>on</strong>g>; Tables orcharts; H<strong>and</strong>booksECO-system integrity; EcosystemServices; Socio-ec<strong>on</strong>omic assessmentCriteria;GIS-based <str<strong>on</strong>g>maps</str<strong>on</strong>g>How many fact sheets will be derivedfrom this deliverable:0Page 4 • PLUREL report D2.3.14_15 • July 2010
Introducti<strong>on</strong>The study is produced in PLURELs WP2.3. The WP aims at development <strong>and</strong>applicati<strong>on</strong> of resp<strong>on</strong>se functi<strong>on</strong>s <strong>and</strong> D2.3.14-2.3.15 aims to show the applicati<strong>on</strong>results for certain issues. Thus the values for 2000 <strong>and</strong> the modelled changes, based<strong>on</strong> the resp<strong>on</strong>se functi<strong>on</strong>s for agricultural producti<strong>on</strong>, habitats <strong>and</strong> ecologicalregulati<strong>on</strong> as well as for recreati<strong>on</strong> are presented. The results of WP2.1 (the RUR Subdelineati<strong>on</strong>,D2.1.4) are included in the resp<strong>on</strong>se functi<strong>on</strong>s. Further <strong>on</strong> the results ofWP 1.4 (RUG model results for artificial surface changes for the four PLUREL scenarios,D1.4.3) are implemented with the regressi<strong>on</strong> models <strong>and</strong> thus deliver values for theindicators <strong>on</strong> <strong>agriculture</strong>, ecology <strong>and</strong> recreati<strong>on</strong> for the four scenarios for theavailable time steps (2015, 2025). The resulting assessment is fed into the iIAT fromWP5.3 (D5.3.1), <strong>on</strong>e of the end-products of PLUREL. In this c<strong>on</strong>text, also the results ofWP2.2 (typology <strong>on</strong> governance <strong>and</strong> spatial planning, D2.2.1) can be used as a filterfor the results of the resp<strong>on</strong>se functi<strong>on</strong>s.The resp<strong>on</strong>se functi<strong>on</strong>s not <strong>on</strong>ly c<strong>on</strong>tribute to end-products iIAT, but also to the PolicyBrochure, where certain development trends of <strong>agriculture</strong>, etc. are analysed.The report is structured as follows:The Abstract <strong>and</strong> Introducti<strong>on</strong> secti<strong>on</strong> is followed by the <str<strong>on</strong>g>maps</str<strong>on</strong>g> for each indicator forthe year 2000 as well as its changes between 2000-2015 <strong>and</strong> 2000-2025 in percentfor each PLUREL scenario.Page 5 • PLUREL report D2.3.14_15 • July 2010
Indicators <strong>and</strong> MapsIndicator Descripti<strong>on</strong>●●●●●●●●Agricultural AreaThe share of agricultural area within a regi<strong>on</strong> gives informati<strong>on</strong> <strong>on</strong> the potentiallyutilizable area for agricultural purposes. It is calculated <strong>on</strong> the bases of CorineL<strong>and</strong> Cover classes 211-244.Farm Productivity (Average St<strong>and</strong>ard Gross Margin, SGM)The SGM provides a measure of a holding's business size, irrespective of its area<strong>and</strong> intensity of producti<strong>on</strong>. It is thus a measure for agricultural incomegenerati<strong>on</strong>.No. of Part-Time FarmersThis indicator is based <strong>on</strong> the number of farm holder's being natural pers<strong>on</strong> with awork time below 25%. It indicates a shift of farming intensities towards a morediverse income generati<strong>on</strong>, which is supposed to be more likely closer to the urbanfringe.Unsealed SoilThe unsealed soil is the opposite to the share of artificial surface. It highlightsareas where ecological processes, like groundwater recharge or soil developmentcan still take place in an undisturbed manner.Unfragmented L<strong>and</strong>scape (Effective Mesh Size Index, MESH)The MESH index is based <strong>on</strong> the probability that two individuals can meet in acertain area without barriers. It indicates the size of effective meshes, integratingthe extent <strong>and</strong> structure of fragmentati<strong>on</strong> by transportati<strong>on</strong> infrastructure <strong>and</strong>settlements.L<strong>and</strong>scape Patchiness (L<strong>and</strong>scape shape index, LSI)The L<strong>and</strong>scape shape index provides informati<strong>on</strong> <strong>on</strong> class aggregati<strong>on</strong>/disaggregati<strong>on</strong> or clumpiness resp. patchiness of a l<strong>and</strong>scape. It calculates theperimeter-to-area ratio of a l<strong>and</strong>scape. When LSI increases, the patches becomeincreasingly disaggregated – providing more niches for different species <strong>and</strong>therefore enhancing biodiversity (in a certain directi<strong>on</strong>).L<strong>and</strong>scape Interspersi<strong>on</strong> (Interspersi<strong>on</strong> <strong>and</strong> juxtapositi<strong>on</strong> index, IJI)The IJI takes the spatial c<strong>on</strong>figurati<strong>on</strong> <strong>and</strong> neighbourhood of the patch types intoc<strong>on</strong>siderati<strong>on</strong>. The more patch types of an area are equally adjacent to each other<strong>and</strong> are so directly neighbouring, the higher the IJI. It can be interpreted as theaccessibility of habitats of a certain kind.Density of Natural Habitats (Green Background Index)The Green Background Index is an indicator for naturality of a regi<strong>on</strong>; representingthe regi<strong>on</strong>al richness regarding natural l<strong>and</strong>-cover types, provided by the EuropeanEnvir<strong>on</strong>mental Agency. It is based <strong>on</strong> an aggregati<strong>on</strong> of CORILIS comp<strong>on</strong>ents for“green” classes (Pastures & mixed farml<strong>and</strong>, Forests <strong>and</strong> transiti<strong>on</strong>al woodl<strong>and</strong>shrub, Natural grassl<strong>and</strong>, Heathl<strong>and</strong>, Sclerophylous vegetati<strong>on</strong>, Open space withlittle or no vegetati<strong>on</strong> <strong>and</strong> Water bodies).Page 6 • PLUREL report D2.3.14_15 • July 2010
●●Density of Endangered Bird SpeciesThe number of endangered bird species per 100km² is a measure of ecologicalintegrity of a regi<strong>on</strong>; It shows the importance for the preservati<strong>on</strong> of endangeredspecies <strong>and</strong> is based <strong>on</strong> data from BirdLife Internati<strong>on</strong>al.Heavy Metal Emissi<strong>on</strong>sFor the Heavy Metall Emissi<strong>on</strong>s an index was created, by cumulating <strong>and</strong> hazardpotential-weighing(thresholds) heavy metal emissi<strong>on</strong>s; It shows the degree ofpolluti<strong>on</strong> of air, water <strong>and</strong> soil from Heavy Metals. The database is the EPERdataset 2008 with the reporting year of 2001.Page 7 • PLUREL report D2.3.14_15 • July 2010
Agricultural Area 2000 <strong>and</strong> scenario changesPage 8 • PLUREL report D2.3.14_15 • July 2010
Page 9 • PLUREL report D2.3.14_15 • July 2010
Page 10 • PLUREL report D2.3.14_15 • July 2010
Page 11 • PLUREL report D2.3.14_15 • July 2010
Page 12 • PLUREL report D2.3.14_15 • July 2010
Page 13 • PLUREL report D2.3.14_15 • July 2010
Page 14 • PLUREL report D2.3.14_15 • July 2010
Page 15 • PLUREL report D2.3.14_15 • July 2010
Page 16 • PLUREL report D2.3.14_15 • July 2010
Farm Productivity 2000 <strong>and</strong> scenario changesPage 17 • PLUREL report D2.3.14_15 • July 2010
Page 18 • PLUREL report D2.3.14_15 • July 2010
Page 19 • PLUREL report D2.3.14_15 • July 2010
Page 20 • PLUREL report D2.3.14_15 • July 2010
Page 21 • PLUREL report D2.3.14_15 • July 2010
Page 22 • PLUREL report D2.3.14_15 • July 2010
Page 23 • PLUREL report D2.3.14_15 • July 2010
Page 24 • PLUREL report D2.3.14_15 • July 2010
Page 25 • PLUREL report D2.3.14_15 • July 2010
No. of Part-Time Farmers 2000 <strong>and</strong> scenario changesPage 26 • PLUREL report D2.3.14_15 • July 2010
Page 27 • PLUREL report D2.3.14_15 • July 2010
Page 28 • PLUREL report D2.3.14_15 • July 2010
Page 29 • PLUREL report D2.3.14_15 • July 2010
Page 30 • PLUREL report D2.3.14_15 • July 2010
Page 31 • PLUREL report D2.3.14_15 • July 2010
Page 32 • PLUREL report D2.3.14_15 • July 2010
Page 33 • PLUREL report D2.3.14_15 • July 2010
Page 34 • PLUREL report D2.3.14_15 • July 2010
Unsealed Soil 2000 <strong>and</strong> scenario changesPage 35 • PLUREL report D2.3.14_15 • July 2010
Page 36 • PLUREL report D2.3.14_15 • July 2010
Page 37 • PLUREL report D2.3.14_15 • July 2010
Page 38 • PLUREL report D2.3.14_15 • July 2010
Page 39 • PLUREL report D2.3.14_15 • July 2010
Page 40 • PLUREL report D2.3.14_15 • July 2010
Page 41 • PLUREL report D2.3.14_15 • July 2010
Page 42 • PLUREL report D2.3.14_15 • July 2010
Page 43 • PLUREL report D2.3.14_15 • July 2010
Unfragmented L<strong>and</strong>scape 2000 <strong>and</strong> scenario changesPage 44 • PLUREL report D2.3.14_15 • July 2010
Page 45 • PLUREL report D2.3.14_15 • July 2010
Page 46 • PLUREL report D2.3.14_15 • July 2010
Page 47 • PLUREL report D2.3.14_15 • July 2010
Page 48 • PLUREL report D2.3.14_15 • July 2010
Page 49 • PLUREL report D2.3.14_15 • July 2010
Page 50 • PLUREL report D2.3.14_15 • July 2010
Page 51 • PLUREL report D2.3.14_15 • July 2010
Page 52 • PLUREL report D2.3.14_15 • July 2010
L<strong>and</strong>scape Patchiness 2000 <strong>and</strong> scenario changesPage 53 • PLUREL report D2.3.14_15 • July 2010
Page 54 • PLUREL report D2.3.14_15 • July 2010
Page 55 • PLUREL report D2.3.14_15 • July 2010
Page 56 • PLUREL report D2.3.14_15 • July 2010
Page 57 • PLUREL report D2.3.14_15 • July 2010
Page 58 • PLUREL report D2.3.14_15 • July 2010
Page 59 • PLUREL report D2.3.14_15 • July 2010
Page 60 • PLUREL report D2.3.14_15 • July 2010
Page 61 • PLUREL report D2.3.14_15 • July 2010
L<strong>and</strong>scape Interspersi<strong>on</strong> 2000 <strong>and</strong> scenario changesPage 62 • PLUREL report D2.3.14_15 • July 2010
Page 63 • PLUREL report D2.3.14_15 • July 2010
Page 64 • PLUREL report D2.3.14_15 • July 2010
Page 65 • PLUREL report D2.3.14_15 • July 2010
Page 66 • PLUREL report D2.3.14_15 • July 2010
Page 67 • PLUREL report D2.3.14_15 • July 2010
Page 68 • PLUREL report D2.3.14_15 • July 2010
Page 69 • PLUREL report D2.3.14_15 • July 2010
Page 70 • PLUREL report D2.3.14_15 • July 2010
Density of Natural Habitats 2000 <strong>and</strong> scenario changesPage 71 • PLUREL report D2.3.14_15 • July 2010
Page 72 • PLUREL report D2.3.14_15 • July 2010
Page 73 • PLUREL report D2.3.14_15 • July 2010
Page 74 • PLUREL report D2.3.14_15 • July 2010
Page 75 • PLUREL report D2.3.14_15 • July 2010
Page 76 • PLUREL report D2.3.14_15 • July 2010
Page 77 • PLUREL report D2.3.14_15 • July 2010
Page 78 • PLUREL report D2.3.14_15 • July 2010
Page 79 • PLUREL report D2.3.14_15 • July 2010
Density of Endangered Bird Species 2000 <strong>and</strong> scenario changesPage 80 • PLUREL report D2.3.14_15 • July 2010
Page 81 • PLUREL report D2.3.14_15 • July 2010
Page 82 • PLUREL report D2.3.14_15 • July 2010
Page 83 • PLUREL report D2.3.14_15 • July 2010
Page 84 • PLUREL report D2.3.14_15 • July 2010
Page 85 • PLUREL report D2.3.14_15 • July 2010
Page 86 • PLUREL report D2.3.14_15 • July 2010
Page 87 • PLUREL report D2.3.14_15 • July 2010
Page 88 • PLUREL report D2.3.14_15 • July 2010
Heavy Metal Emissi<strong>on</strong>s 2000 <strong>and</strong> scenario changesPage 89 • PLUREL report D2.3.14_15 • July 2010
Page 90 • PLUREL report D2.3.14_15 • July 2010
Page 91 • PLUREL report D2.3.14_15 • July 2010
Page 92 • PLUREL report D2.3.14_15 • July 2010
Page 93 • PLUREL report D2.3.14_15 • July 2010
Page 94 • PLUREL report D2.3.14_15 • July 2010
Page 95 • PLUREL report D2.3.14_15 • July 2010
Page 96 • PLUREL report D2.3.14_15 • July 2010
Page 97 • PLUREL report D2.3.14_15 • July 2010