Sugarcane in the Future of the Energy Matrix
Sugarcane in the Future of the Energy Matrix
Sugarcane in the Future of the Energy Matrix

You also want an ePaper? Increase the reach of your titles
YUMPU automatically turns print PDFs into web optimized ePapers that Google loves.
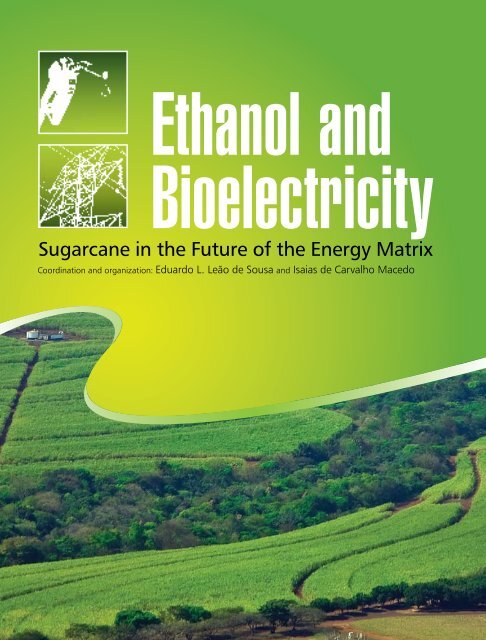
Ethanol andBioelectricity<strong>Sugarcane</strong> <strong>in</strong> <strong>the</strong> <strong>Future</strong> <strong>of</strong> <strong>the</strong> <strong>Energy</strong> <strong>Matrix</strong>Coord<strong>in</strong>ation and organization: Eduardo L. Leão de Sousa and Isaias de Carvalho Macedo
Biomass was man’s pr<strong>in</strong>cipal source <strong>of</strong> energy from<strong>the</strong> dawn <strong>of</strong> civilization until <strong>the</strong> middle <strong>of</strong> <strong>the</strong> 19thcentury. As <strong>of</strong> 1850, around 85% <strong>of</strong> all energyused by man came from firewood, coal and o<strong>the</strong>rproducts <strong>of</strong> vegetable orig<strong>in</strong>. Even today, despite <strong>the</strong>enormous <strong>in</strong>crease <strong>in</strong> our consumption <strong>of</strong> energy fromo<strong>the</strong>r sources, <strong>in</strong> particular petroleum, biomass stillrepresents around 10% <strong>of</strong> world energy consumption.Unfortunately, much <strong>of</strong> this energy is used withprimitive technologies <strong>in</strong> <strong>the</strong> less developed regions<strong>of</strong> Africa, Asia and Lat<strong>in</strong> America, basically fordomestic purposes such as cook<strong>in</strong>g and heat<strong>in</strong>g. Theconsequences <strong>of</strong> such activity <strong>in</strong>clude deforestation andsoil erosion, which aggravate poverty <strong>in</strong> <strong>the</strong>se regions.This situation has given biomass a bad name as anenergy source, mak<strong>in</strong>g it someth<strong>in</strong>g that is frequentlyassociated with underdevelopment and misery.<strong>Sugarcane</strong> bagasse is also becom<strong>in</strong>g an importantprimary energy source for generat<strong>in</strong>g renewableelectricity, and by 2020 could reach a productionlevel comparable with <strong>the</strong> output <strong>of</strong> <strong>the</strong> Itaipuhydropower dam.This book br<strong>in</strong>gs you n<strong>in</strong>e new studies that exam<strong>in</strong>eall aspects <strong>of</strong> <strong>the</strong> efforts Brazil is mak<strong>in</strong>g to modernize<strong>the</strong> use <strong>of</strong> biomass, from <strong>the</strong> sugar-energy sectorsupply cha<strong>in</strong> to <strong>the</strong> role <strong>of</strong> bagasse <strong>in</strong> powergeneration, tak<strong>in</strong>g <strong>in</strong> <strong>the</strong> use <strong>of</strong> flex-fuel motorsand <strong>the</strong> environmental and social aspects <strong>of</strong> <strong>the</strong>question. This collection provides an excellent andcomprehensive panorama <strong>of</strong> <strong>the</strong> country’s success, and<strong>of</strong> <strong>the</strong> prospects for fur<strong>the</strong>r achievements to fur<strong>the</strong>rconsolidate an energy matrix that today reflects <strong>the</strong>real progress Brazil has already achieved.The basic fact is, however, that biomass is essentiallya form <strong>of</strong> solar energy. As such it is renewable,unlike <strong>the</strong> fossil fuels that are <strong>the</strong> ma<strong>in</strong> causes <strong>of</strong> <strong>the</strong>environmental problems we face today.José GoldembergThe solution is to “modernize” <strong>the</strong> use <strong>of</strong> biomass, andno o<strong>the</strong>r technology has so far enjoyed such successas Brazilian production <strong>of</strong> ethanol from sugarcane.Ethanol is an excellent substitute for gasol<strong>in</strong>e and<strong>the</strong> pioneer work undertaken <strong>in</strong> this country s<strong>in</strong>ce<strong>the</strong> start <strong>of</strong> <strong>the</strong> 20th century – and <strong>in</strong> particular s<strong>in</strong>ce1975 – <strong>of</strong>fers compell<strong>in</strong>g pro<strong>of</strong> <strong>of</strong> <strong>the</strong> excellence <strong>of</strong> thistechnological option.Ethanol today substitutes a little over half <strong>of</strong> all <strong>the</strong>gasol<strong>in</strong>e that would o<strong>the</strong>rwise be consumed <strong>in</strong> Brazil if<strong>the</strong> sugarcane-based fuel were not widely used.Ph.D. <strong>in</strong> Physics and member <strong>of</strong> <strong>the</strong> Brazilian Academy <strong>of</strong>Science, José Goldemberg was rector <strong>of</strong> São Paulo University(1986-91), M<strong>in</strong>ister <strong>of</strong> Education (1991-92), president <strong>of</strong> <strong>the</strong>Brazilian Society for <strong>the</strong> Progress <strong>of</strong> Science, special presidentialadvisor for science, technology and <strong>the</strong> environment, andEnvironment Secretary <strong>of</strong> São Paulo State. He is <strong>the</strong> author<strong>of</strong> hundreds <strong>of</strong> books and articles on physics, energy and<strong>the</strong> environment, and <strong>in</strong> 2008 received <strong>the</strong> Blue Planet Prizeawarded by <strong>the</strong> Asahi Glass Foundation.
Ethanol andBioelectricity<strong>Sugarcane</strong> <strong>in</strong> <strong>the</strong> <strong>Future</strong> <strong>of</strong> <strong>the</strong> <strong>Energy</strong> <strong>Matrix</strong>
2010 © UNICA – Brazilian <strong>Sugarcane</strong> Industry Association – All Rights ReservedAv. Brigadeiro Faria Lima, 2179 – 9º andar – Jardim Paulistano – 01452-000 – São Paulo, SP – BrazilPhone: +55(11) 3093-4949 – Fax: +55(11) 3812-1416 – unica@unica.com.brwww.unica.com.brDados Internacionais de Catalogação na Publicação (CIP)(Câmara Brasileira do Livro, SP, Brasil)Ethanol and bioelectricity : sugarcane <strong>in</strong> <strong>the</strong> future <strong>of</strong> <strong>the</strong> energy matrix / [coord<strong>in</strong>ationand supervision Eduardo L. Leão de Sousa e Isaias de Carvalho Macedo ; Englishtranslation Brian Nicholson] . -- São Paulo : Unica, 2011.Etanol e bioeletricidade : a cana-de-açúcar no futuro da matriz energética.Vários autores.Patroc<strong>in</strong>adores: Unica - União da Indústria de Cana-de-açúcar, Projeto AGORA1. Agricultura sustentável 2. Agronegócios - Brasil 3. Biocombustíveis4. Bioeletricidade 5. Bioenergia 6. Biomassa - Energia 7. Biotecnologia agrícola8. Cana-de-açúcar - Indústria - Brasil 9. Etanol 10. Fontes energéticas renováveis11. Meio ambiente 12. Política energética 13. Recursos energéticos 14. Recursos naturaisI. Sousa, Eduardo L. Leão de. II. Macedo, Isaias de Carvalho.11-04924 CDD-639.981Índices para catálogo sistemático :1. Brasil : Etanol e bioeletricidade : Cana-de-açúcar no futuro da matriz energética :Agroenergia : Biotecnologia agrícola 639.981ISBN XXX-XX-XXXXX-XX-XDesign and Graphic ProductionLuc Projetos de Comunicação Ltda.Rua Bem-Te-Vi, 333 – cj13 – Indianópolis – 04524-030 – São Paulo – SPPhone (11) 5044 6099 – luc@lucc.com.brwww.lucc.com.brPr<strong>in</strong>t<strong>in</strong>gGráficos Burti1st edition <strong>in</strong> Portuguese: June 2010
5Ethanol andBioelectricity<strong>Sugarcane</strong> <strong>in</strong> <strong>the</strong> <strong>Future</strong> <strong>of</strong> <strong>the</strong> <strong>Energy</strong> <strong>Matrix</strong>Editorial Coord<strong>in</strong>ation and SupervisionEduardo L. Leão de SousaUNICA Executive DirectorIsaias de Carvalho MacedoUnicamp ResearcherText Edit<strong>in</strong>gOscar Pilagallo1st edition <strong>in</strong> Portuguese: June 2010
6 Ethanol and Bioelectricity <strong>Sugarcane</strong> <strong>in</strong> <strong>the</strong> <strong>Future</strong> <strong>of</strong> <strong>the</strong> <strong>Energy</strong> <strong>Matrix</strong>The role that Brazil should playThis book is essential read<strong>in</strong>g for all those blessed with a strategic outlook and who are <strong>in</strong>terested <strong>in</strong> <strong>the</strong>formulation <strong>of</strong> structured, long-term policies that lead to a clear and def<strong>in</strong>itive energy matrix for Brazil.While this book <strong>of</strong>fers scholars a guide to <strong>the</strong> future, it also shows how government action for <strong>the</strong> sectorhas been erratic <strong>in</strong> <strong>the</strong> past. One cannot even say that <strong>the</strong>re was a strategy for <strong>the</strong> energy matrix; ra<strong>the</strong>rthat th<strong>in</strong>gs happened more or less at <strong>the</strong> whim <strong>of</strong> <strong>the</strong> dreams and projects <strong>of</strong> successive governments. Howmuch time was lost because <strong>of</strong> this, and how many opportunities were missed? One day history will tell.Now <strong>the</strong>re is no time to lose. The country has reached a degree <strong>of</strong> maturity and a level <strong>of</strong> <strong>in</strong>ternationalexposure such that – no matter how good Brazilian leaders may be at seiz<strong>in</strong>g opportunities – it can nolonger just drift along, tak<strong>in</strong>g advantages <strong>of</strong> favorable moments as <strong>the</strong>y arise.Brazil must have a consistent energy program if it is to advance <strong>in</strong> <strong>the</strong> global arena, and <strong>the</strong>re is a relevantrole for agri-energy, <strong>in</strong>clud<strong>in</strong>g bi<strong>of</strong>uels, bioelectricity, ethanol-chemistry, and everyth<strong>in</strong>g else that isagriculture-based.The book presents comprehensive texts prepared by lead<strong>in</strong>g specialists <strong>in</strong> each area to addresses keyquestions, <strong>in</strong> particular with regard to <strong>the</strong> environment, society, and economics – <strong>the</strong> three pillars <strong>of</strong>susta<strong>in</strong>ability. Each subject is exam<strong>in</strong>ed thoroughly and precisely.In this small space available to me, I would <strong>the</strong>refore like to <strong>in</strong>troduce one additional issue: <strong>the</strong> question <strong>of</strong>politics, <strong>in</strong> a global sense.The arguments are simple. Food and fiber agriculture can be conducted anywhere <strong>in</strong> <strong>the</strong> world. Any countrycan produce food, even if with heavy subsidies. But this is not true for agri-energy, because it depends onthree major factors: <strong>the</strong> availability <strong>of</strong> land, with all that it conta<strong>in</strong>s, <strong>in</strong>clud<strong>in</strong>g water and m<strong>in</strong>eral nutrients;plants that are adequate for <strong>the</strong> soil and climatic conditions; and sunlight.
Introduction7Now, <strong>the</strong> sun is available <strong>in</strong> <strong>the</strong> region between <strong>the</strong> tropics <strong>of</strong> Cancer and Capricorn, where <strong>the</strong> world’sleast-developed countries are located <strong>in</strong> Asia, Lat<strong>in</strong> America and Sub-Saharan Africa.This means that <strong>the</strong>se countries will be responsible for produc<strong>in</strong>g agri-energy and promot<strong>in</strong>g change <strong>in</strong> <strong>the</strong>global energy matrix, with all <strong>the</strong> above-mentioned requirements regard<strong>in</strong>g susta<strong>in</strong>ability. What’s more,agri-energy will generate wealth, <strong>in</strong>come and food production <strong>in</strong> <strong>the</strong>se countries. This means that agrienergyproduction will not only allow tropical countries to supply <strong>the</strong> world with energy – a factor that isabsolutely essential for any society to advance – but will also generate <strong>the</strong> th<strong>in</strong>gs <strong>the</strong>y need for <strong>the</strong>ir owndevelopment.These conditions will make possible <strong>the</strong> most extraord<strong>in</strong>ary revolution <strong>in</strong> <strong>the</strong> 21st century – a change <strong>in</strong>global geopolitics – by decreas<strong>in</strong>g <strong>the</strong> exist<strong>in</strong>g enormous distances between rich and poor, by help<strong>in</strong>g toelim<strong>in</strong>ate hunger <strong>in</strong> <strong>the</strong> world, and above all by reduc<strong>in</strong>g global warm<strong>in</strong>g.Brazil can and should lead this process, occupy<strong>in</strong>g an important place <strong>in</strong> global history. To this end, Brazilmust take care <strong>of</strong> its own domestic strategy with respect to an energy matrix that <strong>the</strong> whole world admiresand respects. Only <strong>in</strong> this way will we be able to spread to o<strong>the</strong>r regions <strong>of</strong> <strong>the</strong> planet <strong>the</strong> processes that wehave already mastered.Roberto RodriguesRoberto Rodrigues is an agronomist and farmer, pr<strong>of</strong>essor <strong>of</strong> rural economics at Unesp/Jaboticabal, coord<strong>in</strong>ator <strong>of</strong> <strong>the</strong>Agribus<strong>in</strong>ess Center at FGV and president <strong>of</strong> <strong>the</strong> FIESP Board <strong>of</strong> Agribus<strong>in</strong>ess. He was president <strong>of</strong> <strong>the</strong> Organization <strong>of</strong> BrazilianCooperatives, <strong>of</strong> <strong>the</strong> Brazilian Rural Society, <strong>of</strong> <strong>the</strong> Brazilian Agribus<strong>in</strong>ess Association and <strong>the</strong> World Cooperative Alliance.Rodrigues was São Paulo State Secretary <strong>of</strong> Agriculture (1993/94) and M<strong>in</strong>ister <strong>of</strong> Agriculture, Livestock and Supply (2003/2006).
8 Ethanol and Bioelectricity <strong>Sugarcane</strong> <strong>in</strong> <strong>the</strong> future energy matrixAuthores <strong>of</strong> <strong>the</strong> studiesThe Sugar-<strong>Energy</strong> Map <strong>of</strong> BrazilMarcos Fava NevesV<strong>in</strong>icius Gustavo Tromb<strong>in</strong>Ma<strong>the</strong>us ConsoliSocial Externalities <strong>of</strong> FuelsMárcia Azanha Ferraz Dias de MoraesC<strong>in</strong>thia Cabral da CostaJoaquim José Mart<strong>in</strong>s GuilhotoLuiz Gustavo Antonio de SouzaFabíola Crist<strong>in</strong>a Ribeiro de OliveiraContribution <strong>of</strong> Ethanol to Climate ChangeLuiz Gylvan Meira FilhoIsaias C. MacedoEthanol and HealthPaulo Hilário Nascimento SaldivaMaria de Fátima AndradeSimone Georges El Khouri MiragliaPaulo Afonso de AndréSugar-Ethanol Bioelectricity <strong>in</strong> <strong>the</strong> Electricity <strong>Matrix</strong>Nivalde José de CastroRoberto BrandãoGuilherme de A. DantasEthanol as a FuelFrancisco NigroAlfred SzwarcInternational Bi<strong>of</strong>uels PoliciesAdriano PiresRafael SchechtmanEthanol Market and CompetitionElizabeth Far<strong>in</strong>aClaudia ViegasPaula PeredaCarol<strong>in</strong>a GarciaEthanol <strong>in</strong> <strong>the</strong> Brazilian <strong>Energy</strong> <strong>Matrix</strong>Sergio Valdir BajayLuiz Augusto Horta NogueiraFrancisco José Rocha de Sousa
91014447698136154190226260312presentation Marcos Sawaya JankA FUELS MATRIX FOR BRAZILchapter 01THE SUGAR AND ETHANOL MAP OF BRAZILchapter 02SOCIAL EXTERNALITIES OF FUELSchapter 03CONTRIBUTION OF ETHANOL TO CLIMATE CHANGEchapter 04ETHANOL AND HEALTHchapter 05SUGAR-ETHANOL BIOELECTRICITY IN THE ELECTRICITY MATRIXchapter 06ETHANOL AS A FUELchapter 07INTERNATIONAL BIOFUELS POLICIESchapter 08ETHANOL MARKET AND COMPETITIONchapter 09ETHANOL IN THE BRAZILIAN ENERGY MATRIXAUTHORS AND ORGANIZERSNOTE: In this English edition, unless o<strong>the</strong>rwise specified, <strong>the</strong> term “mill” is usedgenerically to refer to a sugar mill, an ethanol distillery or a comb<strong>in</strong>ed mill/distillery.Ethanol andBioelectricity<strong>Sugarcane</strong> <strong>in</strong> <strong>the</strong> <strong>Future</strong> <strong>of</strong> <strong>the</strong> <strong>Energy</strong> <strong>Matrix</strong>
10 Ethanol and Bioelectricity <strong>Sugarcane</strong> <strong>in</strong> <strong>the</strong> <strong>Future</strong> <strong>of</strong> <strong>the</strong> <strong>Energy</strong> <strong>Matrix</strong>A Fuels <strong>Matrix</strong> for BrazilMarcos Sawaya JankThe Brazilian energy matrix, notable for its high degree <strong>of</strong> renewable sources, has undergone a series <strong>of</strong>changes that placed it amongst <strong>the</strong> cleanest <strong>in</strong> <strong>the</strong> world. In this decade, <strong>the</strong> participation <strong>of</strong> oil and its derivatives<strong>in</strong> <strong>the</strong> energy matrix decreased by about eight percentage po<strong>in</strong>ts: from 45.5% <strong>in</strong> 2000 to 37.9% <strong>in</strong>2009. At <strong>the</strong> end <strong>of</strong> this period, around 18% <strong>of</strong> <strong>the</strong> energy consumed <strong>in</strong> <strong>the</strong> country came from sugarcanederivatives, so overtak<strong>in</strong>g hydroelectricity to rank second <strong>in</strong> <strong>the</strong> energy matrix.However, it is important to note that if we look at <strong>the</strong> longer period, this progress was achieved <strong>in</strong> spite<strong>of</strong> public policies, ra<strong>the</strong>r than because <strong>of</strong> <strong>the</strong>m. Over <strong>the</strong> past three decades, <strong>the</strong> absence <strong>of</strong> a long termfuel policy created great <strong>in</strong>stability <strong>in</strong> <strong>the</strong> production and consumption <strong>of</strong> alternative energy. The oil criseswere not enough to stimulate governmental policies focus<strong>in</strong>g on <strong>the</strong> susta<strong>in</strong>ability <strong>of</strong> renewable fuels. On<strong>the</strong> contrary, <strong>the</strong> policies adopted led to cycles <strong>of</strong> fuel substitution that had negative effects for all parties<strong>in</strong>volved, <strong>in</strong>clud<strong>in</strong>g <strong>the</strong> consumer. This was especially true after <strong>the</strong> first oil crisis.S<strong>in</strong>ce <strong>the</strong> 1970s, short-term fuel policies exhibited at least five dist<strong>in</strong>ct phases. This sent imprecise signalsto <strong>the</strong> market, so impair<strong>in</strong>g <strong>the</strong> flow <strong>of</strong> <strong>in</strong>vestments.Phase 1: The “dieselization” <strong>of</strong> <strong>the</strong> matrix <strong>in</strong> <strong>the</strong> 1970s. The first process <strong>of</strong> substitution was diesel for gasol<strong>in</strong>e,via policies <strong>of</strong> artificial pric<strong>in</strong>g. This led to an <strong>in</strong>crease <strong>in</strong> <strong>the</strong> diesel vehicle fleet and to imports <strong>of</strong> this fuel.Phase 2: Expansion <strong>of</strong> <strong>the</strong> “Proálcool” national ethanol program <strong>in</strong> <strong>the</strong> 1980s. Launched <strong>in</strong> mid-1970s, Proálcool<strong>in</strong>itially <strong>in</strong>creased <strong>the</strong> use <strong>of</strong> anhydrous ethanol blended <strong>in</strong>to gasol<strong>in</strong>e. This blend had been used s<strong>in</strong>ce1938 with <strong>the</strong> aim <strong>of</strong> absorb<strong>in</strong>g excess ethanol production and substitut<strong>in</strong>g tetraethyl lead (TEL), which ishighly pollut<strong>in</strong>g, as a gasol<strong>in</strong>e additive. The second oil shock came <strong>in</strong> 1979, with prices reach<strong>in</strong>g a new historichigh. This made it feasible to br<strong>in</strong>g to market vehicles powered by hydrous ethanol, so launch<strong>in</strong>g a new phase<strong>in</strong> Proálcool. The success <strong>of</strong> this phase was so great that <strong>in</strong> 1985, 95% <strong>of</strong> light vehicles produced <strong>in</strong> Brazil weremade to run on hydrous ethanol.Phase 3: There was a new “gasol<strong>in</strong>ization” <strong>of</strong> <strong>the</strong> matrix <strong>in</strong> <strong>the</strong> 1990s. The fall <strong>in</strong> <strong>in</strong>ternational oil prices meantthat ethanol began los<strong>in</strong>g competitiveness compared to gasol<strong>in</strong>e, despite good results achieved <strong>in</strong> <strong>in</strong>creas<strong>in</strong>gproductivity <strong>in</strong> <strong>the</strong> sugar and ethanol <strong>in</strong>dustry. The government reduced <strong>in</strong>centives and it was impossible toremunerate <strong>the</strong> high volume <strong>of</strong> production needed to supply <strong>the</strong> fleet, culm<strong>in</strong>at<strong>in</strong>g <strong>in</strong> a crisis <strong>of</strong> ethanol shortage<strong>in</strong> 1989/1990. Gasol<strong>in</strong>e quickly recovered <strong>the</strong> ground it had lost.Phase 4: The late 1990s brought <strong>in</strong>centives for Vehicular Natural Gas (VNG). This period saw <strong>the</strong> start <strong>of</strong> substantialconversion <strong>of</strong> vehicles to gas, substitut<strong>in</strong>g hydrous ethanol and gasol<strong>in</strong>e. This <strong>in</strong>centive, which had as itsma<strong>in</strong> stimulus a temporary surplus <strong>of</strong> natural gas, led to <strong>the</strong> migration <strong>of</strong> significant portion <strong>of</strong> <strong>the</strong> automobilefleet <strong>in</strong> state capitals to use <strong>of</strong> this fuel, whose supply is now becom<strong>in</strong>g <strong>in</strong>creas<strong>in</strong>gly scarce and expensive.Phase 5: The flex-fuel revolution. A new phase for hydrous ethanol started <strong>in</strong> 2003 with <strong>the</strong> <strong>in</strong>troduction <strong>of</strong> bifuelvehicles. With <strong>the</strong> new technology, <strong>the</strong> consumer can choose his fuel every time he fills up, and not when
Presentation11he buys <strong>the</strong> vehicle. Between 2003 and <strong>the</strong> beg<strong>in</strong>n<strong>in</strong>g <strong>of</strong> 2010, over 10 million flex vehicles were sold. Today,<strong>the</strong>y account for over 90% <strong>of</strong> vehicles sold <strong>in</strong> Brazil.The growth <strong>of</strong> <strong>the</strong> flex-fuel fleet andma<strong>in</strong>ta<strong>in</strong><strong>in</strong>g <strong>the</strong> ethanol price competitive<strong>in</strong> relation to gasol<strong>in</strong>e have led tohydrous ethanol sales <strong>in</strong>creas<strong>in</strong>g fivefold<strong>in</strong> five years. Monthly ethanol sales(<strong>in</strong>clud<strong>in</strong>g hydrous and anhydrous) haveexceed those <strong>of</strong> pure gasol<strong>in</strong>e s<strong>in</strong>ce April2008 - an unprecedented milestone andone that is admired worldwide. Thanksto this achievement, we can now saythat gasol<strong>in</strong>e has become Brazil’s “alternativefuel”.Monthly domestic consumption <strong>of</strong> ethanol and gasol<strong>in</strong>e(<strong>in</strong> million <strong>of</strong> liters/month)2,0001,5001,000500Gasol<strong>in</strong>eEthanol0Jan 2000 Jul 2009Note: Gasol<strong>in</strong>e data refers to Type A gasol<strong>in</strong>e; ethanol data <strong>in</strong>cludes <strong>the</strong> consumption<strong>of</strong> anhydrous and hydrous ethanol. Source: ANP. Preparation: UNICA.Today, <strong>the</strong> market is bett<strong>in</strong>g on ethanol.In addition to <strong>the</strong> significant expansion <strong>of</strong> traditional mills, over 100 new units began to operate between2005 and 2009, represent<strong>in</strong>g total <strong>in</strong>vestments <strong>of</strong> US$20 billion.Despite this strong <strong>in</strong>flow <strong>in</strong> <strong>in</strong>vestments, uncerta<strong>in</strong>ties rema<strong>in</strong> regard<strong>in</strong>g <strong>the</strong> participation <strong>of</strong> ethanol <strong>in</strong> <strong>the</strong>future fuel matrix. This is understandable <strong>in</strong> <strong>the</strong> light <strong>of</strong> policy changes over <strong>the</strong> past 40 years, and current<strong>in</strong>dicators do not all po<strong>in</strong>t <strong>in</strong> <strong>the</strong> same direction. On <strong>the</strong> one hand, <strong>the</strong> stimulus for natural gas consumptioncont<strong>in</strong>ues, despite <strong>the</strong> recent scarcity. On <strong>the</strong> o<strong>the</strong>r hand, gasol<strong>in</strong>e pric<strong>in</strong>g rema<strong>in</strong>s artificial, with crosssubsidies between petroleum derivatives. In addition to caus<strong>in</strong>g problems for <strong>the</strong> <strong>in</strong>dustrial sector, this alsodistorts <strong>the</strong> market where hydrous ethanol competes directly with gasol<strong>in</strong>e. At <strong>the</strong> same time, from time toThe dance <strong>of</strong> <strong>the</strong> fuels (<strong>in</strong> million TPE*)35301º Oil Shock2520SubstitutionGasol<strong>in</strong>e Diesel Gasol<strong>in</strong>e Ethanol15Ethanol Gasol<strong>in</strong>e10VNG501970 72 74 76 78 80 82 84 86 88 90 92 94 96 98 00 02 04 06 2008 2009Natural Gas Diesel OilGasol<strong>in</strong>e Ethanol* Tonnes <strong>of</strong> petroleum equivalentSource: MME.2º Oil ShockOil Counter-shockPetroleum Law9.478/97Flex-fuelVehicles
12 Ethanol and Bioelectricity <strong>Sugarcane</strong> <strong>in</strong> <strong>the</strong> <strong>Future</strong> <strong>of</strong> <strong>the</strong> <strong>Energy</strong> <strong>Matrix</strong>time <strong>the</strong>re is debate about <strong>in</strong>troduc<strong>in</strong>g diesel-powered automobiles, despite <strong>the</strong> clear evidence <strong>of</strong> <strong>the</strong> negativeeconomic and environmental consequences <strong>of</strong> such a measure. F<strong>in</strong>ally, we cannot ignore <strong>the</strong> prospectsfor development <strong>of</strong> <strong>the</strong> <strong>of</strong>fshore sub-salt petroleum fields, which with<strong>in</strong> some years will require significant<strong>in</strong>vestments to extract and ref<strong>in</strong>e oil, substantially <strong>in</strong>creas<strong>in</strong>g <strong>the</strong> production <strong>of</strong> oil and derivatives.Summ<strong>in</strong>g up – what we have seen <strong>in</strong> <strong>the</strong> past decades, and still see today, is a cyclical situation <strong>in</strong> <strong>the</strong> fuelmarket. This provokes consumer <strong>in</strong>security and <strong>in</strong>vestor uncerta<strong>in</strong>ty. This makes long term plann<strong>in</strong>g essentialto guide public policies that are compatible with a market economy, creat<strong>in</strong>g a stable environment for<strong>in</strong>vestments and giv<strong>in</strong>g consumers last<strong>in</strong>g guarantees. Such guidel<strong>in</strong>e must <strong>in</strong>clude <strong>the</strong> adoption <strong>of</strong> fiscalmechanisms that can <strong>in</strong>corporate <strong>in</strong>to <strong>the</strong> price system <strong>the</strong> positive externalities <strong>of</strong> renewable fuels, whichan <strong>in</strong>dependent market does not capture.It is both vital and urgent to def<strong>in</strong>e a consistent and durable energy matrix, based on criteria <strong>of</strong> susta<strong>in</strong>abilityfor fuel production and use. The global economic scenario <strong>of</strong>fers Brazil a unique opportunity to becomea world leader <strong>in</strong> fuel policies, be <strong>the</strong>y for bi<strong>of</strong>uels or fossil fuel, through <strong>the</strong> establishment <strong>of</strong> goals andfuture supply and demand scenarios for each component <strong>of</strong> <strong>the</strong> fuel matrix.To this end, <strong>the</strong> fuels matrix should meet <strong>the</strong> expectations <strong>of</strong> <strong>the</strong> various players: bi<strong>of</strong>uels producers, oil producersand ref<strong>in</strong>ers, fuel distributors, <strong>the</strong> auto <strong>in</strong>dustry, consumers, <strong>the</strong> government and society as a whole.Bi<strong>of</strong>uels have ga<strong>in</strong>ed pride <strong>of</strong> place with<strong>in</strong> Brazil’s <strong>in</strong>stitutional framework, and this has brought several realbenefits. These can be classified as social – creation <strong>of</strong> jobs and wealth <strong>in</strong> rural areas, plus better <strong>in</strong>comedistribution; environmental – mitigat<strong>in</strong>g <strong>the</strong> negative consequences <strong>of</strong> climate change; and economic – <strong>in</strong>comeand tax generation.All <strong>the</strong>se items are characteristics <strong>of</strong> susta<strong>in</strong>ability and clean development, with social justice. This will constitutean important contribution <strong>of</strong> Brazil, and <strong>the</strong> Brazilian society, for worldwide susta<strong>in</strong>able growth.*This publication br<strong>in</strong>gs toge<strong>the</strong>r new and illustrative <strong>in</strong>formation that will certa<strong>in</strong>ly help def<strong>in</strong>e an energymatrix that is aligned with <strong>the</strong> <strong>in</strong>terests <strong>of</strong> society. Studies presented here<strong>in</strong> identify and quantify <strong>the</strong> benefitsto society <strong>of</strong> us<strong>in</strong>g ethanol and bioelectricity.The first such contribution, <strong>in</strong> Chapter 1, <strong>of</strong>fers a detailed quantitative description and mapp<strong>in</strong>g <strong>of</strong> <strong>the</strong> sector,someth<strong>in</strong>g that has never been done before with such technical rigor. The picture that emerges fromthis exhaustive survey shows that Brazil’s sugar and ethanol <strong>in</strong>dustry generates annual <strong>in</strong>come exceed<strong>in</strong>gUS$28 billion, <strong>in</strong>clud<strong>in</strong>g taxes <strong>of</strong> approximately US$7 billion.The next study, <strong>in</strong> Chapter 2, reveals how <strong>the</strong> sector spreads wealth <strong>in</strong>to rural communities. In São Paulo,for example, sugarcane activities are present <strong>in</strong> more than 60% <strong>of</strong> <strong>the</strong> 645 municipalities <strong>in</strong> <strong>the</strong> state, so
Presentation13<strong>in</strong>dicat<strong>in</strong>g that <strong>the</strong> stimulus for economic development and job creation is spread very widely. The samestudy <strong>of</strong>fers an illustrative simulation <strong>of</strong> ethanol’s potential to create jobs: if 15% <strong>of</strong> <strong>the</strong> gasol<strong>in</strong>e currentlyconsumed <strong>in</strong> Brazil were to be substituted by fuel ethanol, this would create 117,000 jobs, generat<strong>in</strong>g additional<strong>in</strong>come <strong>of</strong> almost R$250 million per year.It is well known that greater ethanol use br<strong>in</strong>gs environment benefits, and Chapter 3 seeks to quantifythis ga<strong>in</strong>. Technical measurements <strong>in</strong>dicate that sugarcane ethanol can reduce greenhouse gas emissionsby more than 90% when compared to gasol<strong>in</strong>e. This advantage can be expressed <strong>in</strong> ano<strong>the</strong>r way: everyliter <strong>of</strong> ethanol represents US$0.20 that will not need to be spent on measures to mitigate <strong>the</strong> emission <strong>of</strong>pollut<strong>in</strong>g gases, so reduc<strong>in</strong>g <strong>the</strong> <strong>in</strong>vestments that <strong>the</strong> country would o<strong>the</strong>rwise make <strong>in</strong> <strong>the</strong> development<strong>of</strong> o<strong>the</strong>r technologies to play its part <strong>in</strong> <strong>the</strong> global effort to control global warm<strong>in</strong>g.However, <strong>the</strong> most important issues cannot simply be expressed <strong>in</strong> terms <strong>of</strong> dollars. The study on <strong>the</strong> publichealth impacts <strong>of</strong> <strong>the</strong> progressive replacement <strong>of</strong> petroleum derivatives by ethanol, <strong>the</strong> <strong>the</strong>me <strong>of</strong> Chapter4, reveals a surpris<strong>in</strong>g projection: if <strong>the</strong> public bus fleet <strong>in</strong> <strong>the</strong> São Paulo metropolitan region switched fromdiesel to ethanol, <strong>the</strong>re would be an annual reduction <strong>of</strong> 1,200 hospitalizations, sav<strong>in</strong>g 250 lives. That ishalf <strong>the</strong> number <strong>of</strong> deaths caused by tuberculosis <strong>in</strong> <strong>the</strong> metropolitan region <strong>in</strong> 2007. Based on <strong>the</strong> numberspresented <strong>in</strong> <strong>the</strong> study, <strong>the</strong> estimated sav<strong>in</strong>gs <strong>in</strong> public health, hospitalizations and deaths result<strong>in</strong>gfrom substitut<strong>in</strong>g ethanol for gasol<strong>in</strong>e would be one U.S. cent per liter <strong>of</strong> ethanol used, while substitut<strong>in</strong>gethanol for diesel would save three U.S. cents per liter <strong>of</strong> ethanol used.Also, when consider<strong>in</strong>g energy <strong>in</strong> a broader sense, sugarcane is not just ethanol. It is also bioelectricity,<strong>the</strong> electricity obta<strong>in</strong>ed from biomass – sugarcane bagasse and straw. This <strong>of</strong>fers an ideal complement tohydropower generation, because <strong>the</strong> sugarcane harvest season is concentrated dur<strong>in</strong>g <strong>the</strong> dry season <strong>in</strong> <strong>the</strong>South-Central region. This is ano<strong>the</strong>r aspect, dealt with <strong>in</strong> Chapter 5, which cannot de ignored by thoseresponsible for plann<strong>in</strong>g <strong>the</strong> Brazilian energy matrix.Chapters 6 and 7 <strong>of</strong>fer a series <strong>of</strong> proposals, <strong>in</strong>clud<strong>in</strong>g policies to encourage technological improvement<strong>of</strong> flex-fuel vehicles and to expand ethanol markets.Chapter 8 describes and analyzes ethanol production <strong>in</strong> Brazil and suggested policies that could improve<strong>the</strong> commercial and market<strong>in</strong>g structures <strong>in</strong> <strong>the</strong> sector.The set <strong>of</strong> studies concludes, <strong>in</strong> Chapter 9, with an analysis <strong>of</strong> Brazil’s ma<strong>in</strong> sources <strong>of</strong> energy. The textpresents important considerations about mechanisms to ensure that renewable and clean sources enjoy agrow<strong>in</strong>g participation <strong>in</strong> <strong>the</strong> country’s energy matrix.In br<strong>in</strong>g<strong>in</strong>g toge<strong>the</strong>r <strong>the</strong>se studies, UNICA is confident that it is contribut<strong>in</strong>g to <strong>the</strong> national debate thatseeks to def<strong>in</strong>e this matrix.
14 Ethanol and Bioelectricity <strong>Sugarcane</strong> <strong>in</strong> <strong>the</strong> <strong>Future</strong> <strong>of</strong> <strong>the</strong> <strong>Energy</strong> <strong>Matrix</strong>01
Ethanol and Bioelectricity <strong>Sugarcane</strong> <strong>in</strong> <strong>the</strong> <strong>Future</strong> <strong>of</strong> <strong>the</strong> <strong>Energy</strong> <strong>Matrix</strong>15The Sugar-<strong>Energy</strong>Map <strong>of</strong> BrazilMarcos Fava NevesV<strong>in</strong>icius Gustavo Tromb<strong>in</strong>Ma<strong>the</strong>us Consoli
16 Ethanol and Bioelectricity <strong>Sugarcane</strong> <strong>in</strong> <strong>the</strong> <strong>Future</strong> <strong>of</strong> <strong>the</strong> <strong>Energy</strong> <strong>Matrix</strong><strong>Sugarcane</strong> dates from Brazil’s earliest colonization. Despite its historical significance, however,<strong>the</strong> sector has never been comprehensively described <strong>in</strong> its entirety. Now, for <strong>the</strong> firsttime, this mapp<strong>in</strong>g <strong>of</strong> <strong>the</strong> sugar and energy sector <strong>of</strong>fers a detailed description <strong>of</strong> <strong>the</strong> completesupply cha<strong>in</strong>.This work was made possible only by us<strong>in</strong>g <strong>the</strong> methodology called Strategic Plann<strong>in</strong>g andManagement <strong>of</strong> Agri-<strong>in</strong>dustrial Systems (Gestão Estratégica de Sistemas Agro<strong>in</strong>dustriais, betterknown as Gesis, or Cha<strong>in</strong>Plan <strong>in</strong> English), developed by Marcos Fava Neves, coord<strong>in</strong>ator <strong>of</strong>Markestrat (<strong>the</strong> Center for Research and Projects <strong>in</strong> Market<strong>in</strong>g and Strategy, USP).Application <strong>of</strong> this methodology <strong>in</strong>dicated that, <strong>in</strong> 2008, <strong>the</strong> sector generated wealth total<strong>in</strong>gUS$28.15 billion, equivalent to almost 2% <strong>of</strong> Brazilian Gross Domestic Product. When tak<strong>in</strong>g<strong>in</strong>to account total sales <strong>of</strong> <strong>the</strong> various l<strong>in</strong>ks compris<strong>in</strong>g <strong>the</strong> sugarcane agri-<strong>in</strong>dustrial productionsystem, <strong>the</strong> value reaches US$86.8 billion.
The Sugar-<strong>Energy</strong> Map <strong>of</strong> Brazil17The <strong>in</strong>dustry provides 1.28 million jobs <strong>in</strong> <strong>the</strong> formal economy, accord<strong>in</strong>g to 2008 data from<strong>the</strong> M<strong>in</strong>istry <strong>of</strong> Labor and Employment’s Annual Report <strong>of</strong> Social Information (Rais). The totalmonthly wage bill is estimated at US$738 million.The tendency is for sectorial GDP to cont<strong>in</strong>ue to grow. Ethanol and sugar are still <strong>the</strong> mostsignificant <strong>in</strong> terms <strong>of</strong> revenues, account<strong>in</strong>g respectively for US$12.5 billion and $9.8 billion,but new products add<strong>in</strong>g to sector revenue will grow <strong>in</strong> importance. Bioelectricity alreadygenerates annual revenues <strong>of</strong> nearly US$400 million and is expected to grow exponentially <strong>in</strong>com<strong>in</strong>g years, while yeasts already represent annual revenues exceed<strong>in</strong>g US$60 million. Productssuch as bioplastics entered large scale production <strong>in</strong> 2010. <strong>Sugarcane</strong> diesel, biobutanoland cellulosic ethanol represent important new technological frontiers and <strong>of</strong>fer real promisefor <strong>the</strong> years ahead. As for carbon credits, <strong>the</strong>y will also ga<strong>in</strong> <strong>in</strong> importance, <strong>in</strong> proportion to<strong>the</strong> grow<strong>in</strong>g concern about low carbon economies.
18 Ethanol and Bioelectricity <strong>Sugarcane</strong> <strong>in</strong> <strong>the</strong> <strong>Future</strong> <strong>of</strong> <strong>the</strong> <strong>Energy</strong> <strong>Matrix</strong>1. IntroductionThe sugarcane <strong>in</strong>dustry has for a long time been one <strong>of</strong> <strong>the</strong> pillars <strong>of</strong> <strong>the</strong> Brazilian economy. For over twocenturies follow<strong>in</strong>g <strong>the</strong> <strong>in</strong>troduction <strong>of</strong> <strong>the</strong> first cane cutt<strong>in</strong>gs <strong>in</strong>to <strong>the</strong> country <strong>in</strong> 1532, sugar was Brazil’sma<strong>in</strong> product.Around 40 years ago, <strong>the</strong> sector started to undergo a transformation. In addition to sugar, mills started t<strong>of</strong>ocus on ethanol production. More recently, attention has turned to bioelectricity, ethanol-based chemicalsand carbon credit trad<strong>in</strong>g. All this embodies <strong>the</strong> possibility <strong>of</strong> employ<strong>in</strong>g advanced technologies that enhanceproductivity and reduce costs. It adds up to a new bus<strong>in</strong>ess paradigm, where competitiveness is <strong>the</strong>watchword.However, advances <strong>in</strong> <strong>the</strong> sugar-energy sector have not been limited just to technology. Brazil’s new productionplants are also <strong>in</strong>volved <strong>in</strong> social and environmental questions. The sugar-energy sector, one Brazil’slargest employers, now has a work<strong>in</strong>g agenda that <strong>in</strong>cludes improv<strong>in</strong>g <strong>the</strong> quality <strong>of</strong> life <strong>of</strong> its workers, <strong>the</strong>rational use <strong>of</strong> land and water, mitigat<strong>in</strong>g <strong>the</strong> effects <strong>of</strong> mechanized harvest<strong>in</strong>g and <strong>the</strong> preservation <strong>of</strong>ecosystems. While significant progress has been made, much rema<strong>in</strong>s to be done if <strong>the</strong> sector is to groweven more.Internationally, it is essential to conv<strong>in</strong>ce critics that <strong>the</strong> <strong>in</strong>crease <strong>in</strong> Brazilian sugarcane production is not occurr<strong>in</strong>g<strong>in</strong> forested areas, and that production takes places under susta<strong>in</strong>able conditions, while persuad<strong>in</strong>g<strong>the</strong>m with respect to <strong>the</strong> regularity <strong>of</strong> ethanol supply. Domestically, it is necessary to show Brazilian society thatchoos<strong>in</strong>g to use ethanol as a vehicle fuel br<strong>in</strong>gs a number <strong>of</strong> o<strong>the</strong>r benefits, besides <strong>the</strong> economic sav<strong>in</strong>g.One way <strong>of</strong> do<strong>in</strong>g, <strong>in</strong>deed <strong>the</strong> goal <strong>of</strong> this report, this is to evaluate <strong>the</strong> economic and social impact <strong>of</strong> sector.This study compiles and analyzes data collected over a four-month period by a team <strong>of</strong> 10 researchers,seek<strong>in</strong>g to measure <strong>the</strong> total f<strong>in</strong>ancial weight, jobs and GDP <strong>of</strong> <strong>the</strong> sugar-energy sector.Figure 1Proposed method for strategic plann<strong>in</strong>g and management <strong>of</strong> agri-<strong>in</strong>dustrial systemsStage 1Initiativesfrom leaders,government,research <strong>in</strong>stitutesand universities<strong>in</strong> plann<strong>in</strong>g <strong>the</strong>future <strong>of</strong> anagribus<strong>in</strong>esssystemStage 2Description,mapp<strong>in</strong>g andquantification <strong>of</strong>an agribus<strong>in</strong>esssystemStage 3Creation <strong>of</strong>a verticalorganization <strong>in</strong><strong>the</strong> agribus<strong>in</strong>esssystemStage 4Establishstrategicplan for <strong>the</strong>agribus<strong>in</strong>esssystemStage 5Adm<strong>in</strong>istration<strong>of</strong> prioritizedprojects andcontractdraft<strong>in</strong>gSource: Neves (2008).
The Sugar-<strong>Energy</strong> Map <strong>of</strong> Brazil192. ObjectivesThe goal <strong>of</strong> this study is to map out, del<strong>in</strong>eate and quantify <strong>the</strong> agri-<strong>in</strong>dustrial sugarcane sector <strong>in</strong> Brazil.The ma<strong>in</strong> product <strong>of</strong> <strong>the</strong> study is an estimate <strong>of</strong> how much <strong>the</strong> companies that operate at <strong>the</strong> differentlevels <strong>of</strong> <strong>the</strong> supply cha<strong>in</strong> billed <strong>in</strong> <strong>the</strong> sugar-energy sector <strong>in</strong> 2008, toge<strong>the</strong>r with an estimate <strong>of</strong> sector GDP.In addition to total bill<strong>in</strong>gs, ano<strong>the</strong>r focus <strong>of</strong> research is to quantify jobs and taxes generated <strong>in</strong> <strong>the</strong> sector.This research is part <strong>of</strong> an effort by UNICA to <strong>in</strong>crease available knowledge <strong>of</strong> <strong>the</strong> sugar-energy sector andprovide public op<strong>in</strong>ion with <strong>in</strong>formation about <strong>the</strong> benefits <strong>of</strong> produc<strong>in</strong>g and us<strong>in</strong>g clean, renewable andsusta<strong>in</strong>able energy <strong>of</strong> agricultural orig<strong>in</strong>.3. MethodologyTo achieve <strong>the</strong> objective <strong>of</strong> this study, <strong>the</strong> methodology known as Gesis (Strategic Plann<strong>in</strong>g and Management<strong>of</strong> Agri-<strong>in</strong>dustrial Systems) was used. This methodology, developed by Pr<strong>of</strong>essor Marcos Fava Neves<strong>in</strong> 2004, has been applied to similar studies <strong>in</strong> Brazil, Argent<strong>in</strong>a, Uruguay, and South Africa. The oranges(2004), wheat (2005) and milk (2007) supply cha<strong>in</strong>s were assessed, del<strong>in</strong>eated and quantified under Neves’coord<strong>in</strong>ation. The Gesis methodology has been presented and published <strong>in</strong> several <strong>in</strong>ternational bus<strong>in</strong>essconferences and, as such, is familiar to researchers around <strong>the</strong> world. In 2007, it was used <strong>in</strong> Uruguay andArgent<strong>in</strong>a for <strong>the</strong> wheat and milk supply cha<strong>in</strong>s, respectively.Methodology for description, mapp<strong>in</strong>g, del<strong>in</strong>eation and quantificationTable 1aPhases <strong>of</strong> Stage 2Phase 1Description <strong>of</strong> <strong>the</strong> agri-<strong>in</strong>dustrial supplycha<strong>in</strong> under studyPhase 2Presentation <strong>of</strong> <strong>the</strong> description toexecutives and o<strong>the</strong>r experts to adjust <strong>the</strong>structurePhase 3Research <strong>of</strong> sales data <strong>in</strong> associations,<strong>in</strong>stitutions and publicationsPhase 4Interviews with experts and companyexecutivesPhase 5QuantificationPhase 6Validation workshopProceduresDesign <strong>of</strong> <strong>the</strong> agri-<strong>in</strong>dustrial system us<strong>in</strong>g boxes, reflect<strong>in</strong>g <strong>the</strong> flow <strong>of</strong>products, rang<strong>in</strong>g from <strong>in</strong>puts through to <strong>the</strong> f<strong>in</strong>al consumer (system design).With this first version <strong>of</strong> <strong>the</strong> description, <strong>in</strong>-depth <strong>in</strong>terviews are conductedwith executives <strong>of</strong> companies operat<strong>in</strong>g <strong>in</strong> <strong>the</strong> sector and o<strong>the</strong>r specialists(researchers, sector leaders, o<strong>the</strong>rs) to adjust <strong>the</strong> proposed design.Some private associations make available <strong>the</strong>ir members’ sales <strong>in</strong>formation,sometimes even on <strong>the</strong> <strong>in</strong>ternet. A careful bibliographic review is alsoconducted for recent dissertations and <strong>the</strong>ses, <strong>in</strong> addition to articles <strong>in</strong>academic magaz<strong>in</strong>es and papers, or o<strong>the</strong>r general publications.This is <strong>the</strong> central po<strong>in</strong>t <strong>of</strong> <strong>the</strong> methodology. Interviews are conducted withmanagers, with <strong>the</strong> <strong>in</strong>tention <strong>of</strong> f<strong>in</strong>d<strong>in</strong>g <strong>the</strong> total amount sold by companies<strong>in</strong> <strong>the</strong> sector under study. Interviews are also conducted with procurementdirectors, seek<strong>in</strong>g to estimate <strong>the</strong> market from <strong>the</strong> opposite side <strong>of</strong> supplycha<strong>in</strong> l<strong>in</strong>ks.At this po<strong>in</strong>t, all data obta<strong>in</strong>ed <strong>in</strong> <strong>the</strong> above steps is processed and <strong>in</strong>serted<strong>in</strong> <strong>the</strong> description below <strong>the</strong> name <strong>of</strong> <strong>the</strong> company. The data is <strong>the</strong>n sent toparticipat<strong>in</strong>g companies to exam<strong>in</strong>e <strong>the</strong> values. Companies are asked to sendback <strong>the</strong> data with comments and contributions.In <strong>the</strong> f<strong>in</strong>al phase, a workshop is organized for presentation <strong>of</strong> <strong>the</strong> results anddiscussion <strong>of</strong> <strong>the</strong> numbers.Source: Neves (2008).
20 Ethanol and Bioelectricity <strong>Sugarcane</strong> <strong>in</strong> <strong>the</strong> <strong>Future</strong> <strong>of</strong> <strong>the</strong> <strong>Energy</strong> <strong>Matrix</strong>As presented <strong>in</strong> Figure 1, <strong>the</strong> description, mapp<strong>in</strong>g, del<strong>in</strong>eation and quantification <strong>of</strong> an agribus<strong>in</strong>ess systemis one <strong>of</strong> <strong>the</strong> steps that make up <strong>the</strong> Gesis Methodology. Given <strong>the</strong> scope <strong>of</strong> <strong>the</strong> current project for <strong>the</strong>sugar and ethanol <strong>in</strong>dustry, only this stage <strong>of</strong> <strong>the</strong> method will be performed at this time. However, it shouldbe noted that, because it is <strong>the</strong> <strong>in</strong>itial step <strong>of</strong> <strong>the</strong> method, it lays <strong>the</strong> groundwork for <strong>the</strong> o<strong>the</strong>r steps to beundertaken <strong>in</strong> <strong>the</strong> future, <strong>the</strong>reby extend<strong>in</strong>g <strong>the</strong> focus <strong>of</strong> <strong>the</strong> study to <strong>in</strong>clude <strong>the</strong> development <strong>of</strong> collectivegoals and strategies.Stage 2 <strong>of</strong> <strong>the</strong> Gesis Methodology, which constitutes <strong>the</strong> focus <strong>of</strong> <strong>the</strong> current study, consists <strong>in</strong> implement<strong>in</strong>g<strong>the</strong> six phases described <strong>in</strong> Table 1a above.4. ResultsThe GDP <strong>of</strong> <strong>the</strong> sugar-energy sector was US$28.2 billion, equivalent to almost 2% <strong>of</strong> domestic GDP oralmost <strong>the</strong> entire wealth generated <strong>in</strong> one year by a country like Uruguay (US$32 billion). Sector GDP wasestimated by calculat<strong>in</strong>g <strong>the</strong> aggregate sales <strong>of</strong> f<strong>in</strong>al goods by <strong>the</strong> sugarcane agri-<strong>in</strong>dustrial system, and apply<strong>in</strong>g<strong>the</strong> 2008 average exchange rate <strong>of</strong> US$1.00 = R$1.84. Table 1b presents <strong>the</strong> bill<strong>in</strong>gs <strong>of</strong> <strong>the</strong> sector’sma<strong>in</strong> products <strong>in</strong> <strong>the</strong> domestic and foreign markets.Figure 2 represents <strong>the</strong> sugarcane agri-<strong>in</strong>dustrial system. The values below each l<strong>in</strong>k <strong>in</strong>dicate <strong>the</strong> grossbill<strong>in</strong>g for this segment with <strong>the</strong> sugar-energy sector <strong>in</strong> 2008. The sugar-energy sector’s gross revenue <strong>in</strong>that year was US$86.8 billion. This value represents <strong>the</strong> sum <strong>of</strong> estimated sales <strong>of</strong> <strong>the</strong> various l<strong>in</strong>ks <strong>in</strong> <strong>the</strong>agri-<strong>in</strong>dustrial cha<strong>in</strong> and <strong>the</strong> f<strong>in</strong>ancial operations <strong>of</strong> facilitat<strong>in</strong>g agents. The gross revenue <strong>of</strong> <strong>the</strong> sector isnot comparable to <strong>the</strong> domestic GDP, because <strong>of</strong> double count<strong>in</strong>g. Follow<strong>in</strong>g Figure 2, <strong>the</strong> gross revenue<strong>of</strong> each l<strong>in</strong>k <strong>in</strong> <strong>the</strong> supply cha<strong>in</strong> is presented <strong>in</strong> detail.Table 1bProductEstimates <strong>of</strong> <strong>the</strong> sugar-energy sector GDP based on f<strong>in</strong>al products <strong>in</strong> US$ millionsDomestic Market (DM) External Market (EM) Total (DM + EM)With taxes Tax-exempt With taxesHydrous ethanol 11,114.50 (a) 23.78 11,138.28Anhydrous ethanol 2,972.89 (b) 2,366.33 5,339.22Non-fuel ethanol 438.78 (c) n/a 438.78Sugar 5,297.14 (d) 5,482.96 10,780.10Bioelectricity 389.63 (e) n/a 389.63Yeast and additive 21.41 42.20 63.61Carbon credit n/a 3.48 3.48Total 20,234.35 7,918.75 28,153.10a bSales by fill<strong>in</strong>g stations, count<strong>in</strong>g both <strong>the</strong> formal and <strong>in</strong>formal markets. Sales by distilleries to fuel distributors, count<strong>in</strong>g both <strong>the</strong> formalc dand <strong>in</strong>formal markets. Sales by distilleries to beverage and cosmetics sectors. Sum <strong>of</strong> sugar sales by mills to <strong>in</strong>dustry and retail sales.eSales at energy auctions.Source: Nevis, Tromb<strong>in</strong> and Consoli, with data generated by Markestrat (2009).
The Sugar-<strong>Energy</strong> Map <strong>of</strong> Brazil21The agricultural <strong>in</strong>puts <strong>in</strong>dustry Prior to <strong>the</strong> plantationThe agricultural <strong>in</strong>puts <strong>in</strong>dustry billed US$9.3 million <strong>in</strong> sales to <strong>the</strong> sugar-energy sector <strong>in</strong> 2008 (<strong>in</strong>clud<strong>in</strong>grevenues <strong>of</strong> US$477.5 million from herbicides and pesticides sold by agricultural cooperatives and dealers).Graph 1 summarizes all revenues <strong>of</strong> this l<strong>in</strong>k, which are detailed <strong>in</strong> <strong>the</strong> follow<strong>in</strong>g text.<strong>Sugarcane</strong> accounted for 14% <strong>of</strong> agricultural fertilizers sales <strong>in</strong> Brazil <strong>in</strong> 2008, total<strong>in</strong>g US$2.3 million (3.14million tonnes). This is an <strong>in</strong>put essential for sugarcane plantations, and <strong>the</strong> <strong>in</strong>crease <strong>in</strong> sugarcane plantedarea <strong>in</strong> <strong>the</strong> past few years has caused an <strong>in</strong>crease fertilizer demand despite <strong>the</strong> unfavorable terms <strong>of</strong> trade.While <strong>in</strong> 2007, 19.8 tonnes <strong>of</strong> sugarcane were needed to purchase one tonne <strong>of</strong> fertilizer, <strong>in</strong> 2008 <strong>the</strong> vol-Bill<strong>in</strong>gs <strong>of</strong> agricultural <strong>in</strong>puts Prior to <strong>the</strong> plantation – US$ millionsGraph 1Autoparts and servicesFertilizers2,259.092,851.19Diesel oil and lubricants1,054.01Herbicides and pesticides768.44HarvestersImplementsTrucksTractorsTruck bodies, trailers and semi-trailersProtective cloth<strong>in</strong>gSoil nutrients426.52425.67331.39320.87233.3653.8050.560 500 1,000 1,500 2,000 2,500 3,000Agricultural <strong>in</strong>puts Gross value Sales tax 1 Net valueAutoparts and services 2,851.19 810.00 2,041.19Fertilizers 2,259.09 271.09 1,988.00Diesel oil and lubricants 1,054.01 258.44 798.57Herbicides and pesticides 768.44 92.21 676.23Harvesters 426.52 121.17 305.35Implements 425.67 120.93 304.74Trucks 331.39 94.14 237.25Tractors 320.87 91.16 229.71Truck bodies, trailers and semi-trailers 233.36 66.30 167.06Protective cloth<strong>in</strong>g 53.80 15.28 38.52Soil nutrients 50.56 6.07 44.491IPI, PIS and COFINSSource: Neves, Tromb<strong>in</strong> and Consoli, with data generated by Markestrat (2009).
22 Ethanol and Bioelectricity <strong>Sugarcane</strong> <strong>in</strong> <strong>the</strong> <strong>Future</strong> <strong>of</strong> <strong>the</strong> <strong>Energy</strong> <strong>Matrix</strong>Figure 2SUGAR-ENERGY SUPPLY CHAINPrior to <strong>the</strong> plantationIn <strong>the</strong> plantation9,252.42 11,509.75Fertilizers2,259.09Herbicides and pesticides768.44Soil nutrients50.56Autoparts and ma<strong>in</strong>tenanceservices2,851.19<strong>Sugarcane</strong> ProductionOwn:6,387.91Suppliers:5,121.84Dealers and cooperatives477.54 with herbicides andpesticidesEquipments3,400.99steam generator.........667.13Reception/extraction..568.13Distillery......................469.13Sugar process<strong>in</strong>g....... 354.38power generator...........274.5O<strong>the</strong>r assemblies........ 411.75For ma<strong>in</strong>tenance........ 655.98Automation + Instrumentation269.76Harvesters426.52Electric <strong>in</strong>stallations366.00Tractors320.87Construction <strong>in</strong>dustry594.75Implements425.66Trucks331.36Truck bodies, trailersand semi-trailers233.36Diesel oil and lubricants1,054.01Protective equipment53.80Assembly and ma<strong>in</strong>tenanceservices1,110.35Chemical products463.82Fuel oil andlubricants94.19Sacks45.42Big Bags14.67Laboratory material15.46Protective equipment38.96Facilitat<strong>in</strong>g agentsBNDES: 3,530.79Port costs (Santos): 213.52Payroll: 738.33Outsourced CCT 1 : 916.32R&D: 79.15Health <strong>in</strong>surance 3 : Health 4 : 125.511CCT = Cutt<strong>in</strong>g, Load<strong>in</strong>g and Transportation, <strong>in</strong> <strong>the</strong> Center South.2Volumes exported through Santos and Paranagua Ports.3e 4 Just for São Paulo State.
The Sugar-<strong>Energy</strong> Map <strong>of</strong> Brazil23<strong>in</strong> millions dollars, 2008GDP <strong>of</strong> <strong>the</strong> sector US$28.2 billionsAfter <strong>the</strong> plantation52,795.27MILLSTotal22,639.17Ethanol12,417.36Domestic marketHydrous: 6,615.58Anhydrous: 2,972.89Distributor8,624.05Fuel fill<strong>in</strong>g station11,114.50Non-enegy: 438.78External MarketHydrous: 1,179.91Beverage andcosmetics <strong>in</strong>dustriesAnhydrous: 1,210.20Sugar9,765.08Domestic marketIndustry: 2,037.88Wholesale: 580.57Retail: 1,663.66External marketRaw Sugar: 3,699.55White Sugar: 1,833.41Wholesaler743.89Retail3,259.26Food <strong>in</strong>dustry and o<strong>the</strong>rsFree consumersF<strong>in</strong>al ConsumerBioelectricity389.63DistributorsSpecial consumersYeasts and addictivesDomestic marketAnimal feed: 21.41External marketAnimal feed: 42.20Animal feed <strong>in</strong>dustryCarbon credits3.48Bioplastics(non-commercial scale)(service providers): 13,275.58Highway freight for export 2 : 539.03Events: 5.32Food 4 : 188.26Tolls for export (Santos): 79,96Inspection: 3,99Taxes on <strong>the</strong> agricultural sector: 6.855,41Source: Prepared by Neves, Tromb<strong>in</strong>, Consoli, 2009.
24 Ethanol and Bioelectricity <strong>Sugarcane</strong> <strong>in</strong> <strong>the</strong> <strong>Future</strong> <strong>of</strong> <strong>the</strong> <strong>Energy</strong> <strong>Matrix</strong>ume soared to 36.3 tonnes. This happened because <strong>of</strong> <strong>in</strong>creased fertilizer prices and lower levels <strong>of</strong> TotalRecoverable Sugars (TRS). Sale <strong>of</strong> soil nutrients for sugarcane plantations were estimated at US$50.6 million<strong>in</strong> 2008, with consumption <strong>of</strong> 2,999,000 tonnes.In 2008, <strong>the</strong> Brazilian agricultural pesticides and herbicides sector billed US$768.4 million for sales to sugarcaneplanters. Cooperatives were responsible for 61% <strong>of</strong> sales <strong>of</strong> pesticides and herbicides for sugarcane,with agricultural dealerships responsible for 2%. Toge<strong>the</strong>r <strong>the</strong>se billed more than US$477.5 million. Salesmade directly to mills accounted for 37%. Of <strong>the</strong> total disbursed by sugarcane farmers for pesticides andherbicides, 73.5% was spent on herbicides, 22.8% on <strong>in</strong>secticides and 3.7% on fungicides.Approximately 3,970 tractors were sold to <strong>the</strong> sugar-energy <strong>in</strong>dustry <strong>in</strong> 2008, for a total <strong>of</strong> US$320.9 million.Sales to <strong>the</strong> sugar-energy sector represented 9% <strong>of</strong> total tractor sales <strong>in</strong> Brazil, and <strong>the</strong> sector bought47% <strong>of</strong> tractors rated at over 200 hp. Revenue from sale <strong>of</strong> implements was approximately US$425.7 million.This segment <strong>in</strong>cludes plows, tipper trailers, disk harrows, sprays, cultivators, self-propelled sprays andirrigation equipment, among o<strong>the</strong>rs. The autoparts sector and ma<strong>in</strong>tenance services for mach<strong>in</strong>ery andequipments billed about US$2.9 billion <strong>in</strong> 2008. These amounts <strong>in</strong>clude parts and labor for about 144,000mach<strong>in</strong>es <strong>in</strong> operation <strong>in</strong> <strong>the</strong> sector, which consume roughly US$20,000 <strong>in</strong> ma<strong>in</strong>tenance costs per unit perannum.The sugar-energy sector acquired 22% <strong>of</strong> all harvesters sold <strong>in</strong> 2008, represent<strong>in</strong>g US$426.5 million <strong>in</strong> revenues.The sector purchased 981 units, represent<strong>in</strong>g 52% growth over 2007. The fleet <strong>of</strong> cane harvestersnearly doubled <strong>in</strong> size <strong>in</strong> <strong>the</strong> year, ma<strong>in</strong>ly due to <strong>the</strong> requirement to end pre-harvest straw burn<strong>in</strong>g. In 2007<strong>the</strong>re were approximately 1,280 sugarcane harvesters <strong>in</strong> Brazilian plantations.Sales <strong>of</strong> heavy trucks – those with gross weight <strong>of</strong> 40 tonnes or more – were also driven by <strong>the</strong> growth<strong>of</strong> <strong>the</strong> sugar-energy sector. In addition to transport<strong>in</strong>g ethanol, <strong>the</strong>se trucks carry 80% <strong>of</strong> sugarcane afterharvest<strong>in</strong>g. It is estimated that <strong>in</strong> 2008, <strong>the</strong> sector purchased 1,962 heavy trucks, equivalent to 5% <strong>of</strong> totaltruck sales <strong>in</strong> this category <strong>in</strong> Brazil. This generated bill<strong>in</strong>gs <strong>in</strong> <strong>the</strong> order <strong>of</strong> US$331.4 million.Sales <strong>of</strong> truck bodies, trailers and semi-trailers <strong>in</strong> 2008 were estimated at US$233.4 million. In additionto <strong>the</strong> 488 truck bodies sold, 4,856 sugarcane trailers and semi-trailers were registered. This representedabout 9% <strong>of</strong> total heavy truck body and trailer sales <strong>in</strong> Brazil, and was an <strong>in</strong>crease <strong>of</strong> 11% over 2007.Mechanized operations <strong>in</strong> sugarcane agricultural production and transportation from <strong>the</strong> field to <strong>the</strong> millconsumed almost one billion liters <strong>of</strong> diesel oil and lubricants <strong>in</strong> 2008, at a cost <strong>of</strong> US$1.0 million. Follow<strong>in</strong>g<strong>the</strong> publication <strong>of</strong> Regulatory Norm No. 31 <strong>in</strong> 2005, mills <strong>in</strong>creased <strong>the</strong>ir <strong>in</strong>vestments <strong>in</strong> <strong>the</strong> employeehealth and safety. This was reflected <strong>in</strong> 2008 sales <strong>of</strong> agricultural personal protective equipment (PPE),which totaled US$53.8 million.
The Sugar-<strong>Energy</strong> Map <strong>of</strong> Brazil25<strong>Sugarcane</strong> production In <strong>the</strong> plantationThe 2008/09 sugarcane harvest reached a record production <strong>of</strong> 568.9 million tonnes with a planted area <strong>of</strong>approximately 8.5 million hectares (<strong>in</strong>clud<strong>in</strong>g areas <strong>in</strong> production, <strong>in</strong> formation, produc<strong>in</strong>g seedl<strong>in</strong>gs, andripe sugarcane). The State <strong>of</strong> São Paulo was responsible for 68.6% <strong>of</strong> sugarcane crush<strong>in</strong>g <strong>in</strong> <strong>the</strong> Center-Southregion <strong>of</strong> <strong>the</strong> country. In this region, <strong>the</strong> State <strong>of</strong> M<strong>in</strong>as Gerais saw <strong>the</strong> greatest <strong>in</strong>crease <strong>in</strong> production dur<strong>in</strong>g<strong>the</strong> last five years, with 1.8% growth, followed by <strong>the</strong> State <strong>of</strong> Goiás with 1.6% growth. The 568.9 milliontonnes <strong>of</strong> crushed sugarcane <strong>in</strong> <strong>the</strong> 2008/09 harvest generated US$11.5 billion <strong>in</strong> revenues for <strong>the</strong> sugarenergysector. The yield <strong>of</strong> raw material was 143.25 kg <strong>of</strong> Total Recoverable Sugars (TRS) per tonne <strong>of</strong> cane,down 2% compared with <strong>the</strong> previous harvest. The average TRS value <strong>in</strong> <strong>the</strong> 2008/09 harvest was US$0.14 .The average value per tonne <strong>of</strong> sugarcane <strong>in</strong> <strong>the</strong> 2008/09 harvest was US$20.23 (R$39.85). In <strong>the</strong> 2008/09harvest, as shown <strong>in</strong> Graph 2, <strong>in</strong>dependent sugarcane suppliers accounted for approximately 44.5% <strong>of</strong> <strong>the</strong><strong>in</strong>dustry’s total supply (US$5.1 billion), with 55.5% com<strong>in</strong>g from sugar and ethanol producers’ own plantations(US$6.4 billion).Equipment, services and <strong>in</strong>dustrial <strong>in</strong>puts After <strong>the</strong> plantationThe <strong>in</strong>dustrial <strong>in</strong>puts sector billed US$6.4 billion for sales to <strong>the</strong> sugar-energy <strong>in</strong>dustry <strong>in</strong> 2008. This valueis presented <strong>in</strong> detail below.In order to quantify <strong>the</strong> bill<strong>in</strong>gs <strong>of</strong> <strong>in</strong>dustrial equipment suppliers and companies that provide assemblyservices, we considered <strong>the</strong> <strong>in</strong>vestments <strong>of</strong> <strong>the</strong> 29 <strong>in</strong>dustrial units that came on stream <strong>in</strong> 2008. Given that<strong>the</strong>se <strong>in</strong>vestments would have started <strong>in</strong> 2006, <strong>the</strong>y do not represent <strong>the</strong>se companies’ revenues <strong>in</strong> justthat year. Ra<strong>the</strong>r, <strong>the</strong>y <strong>of</strong>fer an estimate <strong>of</strong> <strong>the</strong> cost <strong>of</strong> build<strong>in</strong>g <strong>the</strong>se new units that began produc<strong>in</strong>g <strong>in</strong>2008. Of <strong>the</strong> 29 <strong>in</strong>dustrial units, <strong>the</strong> follow<strong>in</strong>g assumption was adopted: four were sugar mills that produceboth sugar and ethanol and 25 were distilleries, for <strong>the</strong> production just <strong>of</strong> ethanol. Of <strong>the</strong> former, threehad crush<strong>in</strong>g capacity <strong>of</strong> 1.5 million tonnes <strong>of</strong> sugarcane, and one a capacity <strong>of</strong> three million tonnes. Of <strong>the</strong>distilleries, 15 had crush<strong>in</strong>g capacity <strong>of</strong> 1.5 million tonnes and 10 had a capacity <strong>of</strong> three million tonnes.<strong>Sugarcane</strong> revenuesUS$ millionsGraph 2<strong>Sugarcane</strong> In <strong>the</strong> plantationsMill plantations6,387.91Independent plantations5,121.840 1,000 2,000 3,000 4,000 5,000 6,000 7,000Source: Neves, Tromb<strong>in</strong> and Consoli, with data generated by Markestrat (2009).
26 Ethanol and Bioelectricity <strong>Sugarcane</strong> <strong>in</strong> <strong>the</strong> <strong>Future</strong> <strong>of</strong> <strong>the</strong> <strong>Energy</strong> <strong>Matrix</strong>The average <strong>in</strong>vestment for sett<strong>in</strong>g up an <strong>in</strong>dustrial plant was estimated at US$85 per tonne <strong>of</strong> sugarcanefor mill<strong>in</strong>g capacity, and US$75 per tonne <strong>of</strong> sugarcane for distilleries. Table 2 shows <strong>the</strong> proportionalbreakdown <strong>of</strong> required <strong>in</strong>vestment, and Table 3 details <strong>the</strong> <strong>in</strong>vestment <strong>in</strong> equipment.In addition to <strong>in</strong>vestments related to construction <strong>of</strong> new units, <strong>the</strong> study also considered sales <strong>of</strong> equipmentand services for <strong>the</strong> ma<strong>in</strong>tenance <strong>of</strong> <strong>in</strong>dustrial units, which takes place between harvests. Under thishead<strong>in</strong>g, <strong>the</strong> study used an estimated ma<strong>in</strong>tenance cost <strong>in</strong> South-Central Brazil <strong>of</strong> US$1.68/tonne <strong>of</strong> crushedsugarcane. Of this 62.50% was spent on equipment and 37.50% on services. In <strong>the</strong> North-Nor<strong>the</strong>ast regionthis cost was US$2.08, with 86.70% spent on equipment and 13.30% on services. The study also <strong>in</strong>cludedprojects for automation and <strong>in</strong>strumentation sold to <strong>the</strong> sugar-energy sector <strong>in</strong> 2008 – <strong>the</strong>re were about41 such projects, <strong>in</strong> addition to those that were sold to <strong>the</strong> 29 new units already mentioned.Table 2ItemDistribution <strong>of</strong> <strong>in</strong>vestment by type <strong>of</strong> spend<strong>in</strong>g% <strong>of</strong> total <strong>in</strong>vestmentEquipment 60Electromechanical assembly 7Civil construction 13Electrical <strong>in</strong>stallation 8Instrumentation and automation 2Eng<strong>in</strong>eer<strong>in</strong>g services, <strong>the</strong>rmal <strong>in</strong>sulation and pa<strong>in</strong>t<strong>in</strong>g 10Total 100Source: Prepared by Markestrat from data provided by Procknor Eng<strong>in</strong>eer<strong>in</strong>g.Table 3Type <strong>of</strong> equipmentDistribution <strong>of</strong> <strong>in</strong>vestment by type <strong>of</strong> equipment% <strong>of</strong> <strong>in</strong>vestment <strong>in</strong> equipmentMillDistillerySteam generators 25 20Reception/extraction system 20 25Distillery 15 30Sugar process<strong>in</strong>g 15 0Turb<strong>in</strong>es/electricity generators 10 10O<strong>the</strong>rs 15 15Total 100 100Source: Prepared by Markestrat from data provided by Procknor Eng<strong>in</strong>eer<strong>in</strong>g.
The Sugar-<strong>Energy</strong> Map <strong>of</strong> Brazil27Based on <strong>the</strong>se assumptions, <strong>the</strong> aggregate bill<strong>in</strong>g <strong>of</strong> <strong>in</strong>dustrial equipment suppliers was estimated at approximatelyUS$3.4 billion. Automation and <strong>in</strong>strumentation sales were US$269.7 million, while assemblyand ma<strong>in</strong>tenance service providers received approximately US$1.1 billion. The civil construction <strong>in</strong>dustrybilled approximately US$594.8 million, and <strong>the</strong> electrical <strong>in</strong>stallations sector billed a fur<strong>the</strong>r US$366.0 millionfor new <strong>in</strong>dustrial units.The sugar-energy sector purchased chemical and specialty products worth US$463.8 million used <strong>in</strong> <strong>the</strong>production <strong>of</strong> ethanol and sugar, <strong>in</strong>clud<strong>in</strong>g quicklime and slaked lime, chemical commodities, polymers,process<strong>in</strong>g aids for sugar and ethanol production, yeast, water treatment products and ion exchange res<strong>in</strong>s,among o<strong>the</strong>rs.Fuel and lubricat<strong>in</strong>g oil consumed <strong>in</strong> <strong>in</strong>dustrial operations totaled 70 million liters, generat<strong>in</strong>g US$94.2million <strong>in</strong> purchases. The sector purchased laboratory materials worth US$15.5 million, while US$45.4million was spent on 50 kg sacks and US$14.7 million on 1,200 kg big bags. Industrial protective cloth<strong>in</strong>gpurchases came to US$38.9 million.Graph 3 summarizes <strong>the</strong> bill<strong>in</strong>g <strong>of</strong> this stage <strong>of</strong> <strong>the</strong> supply cha<strong>in</strong>.Bill<strong>in</strong>g MillsMills billed a total <strong>of</strong> US$22.6 billion on all marketed products, divided as follows: ethanol US$12.4 billion(55%); sugar US$9.8 billion (43%); bioelectricity US$389.6 million (1.7%); and yeasts, additives and carboncredit US$67.1 million (0.3%). The products and <strong>the</strong>ir distribution channels are presented below.Ethanol MillsMills earned US$12.4 billion <strong>in</strong> ethanol sales <strong>in</strong> 2008, count<strong>in</strong>g domestic and export markets. Exports wereworth US$2.4 billion (US$1.2 billion each for hydrous and anhydrous ethanol). However, anhydrous ethanolexports were atypical <strong>in</strong> 2008. One <strong>of</strong> <strong>the</strong> reasons for this growth was <strong>the</strong> higher demand from <strong>the</strong> UnitedStates, due to a reduction <strong>in</strong> <strong>the</strong> corn harvest caused by floods <strong>in</strong> <strong>the</strong> country’s ma<strong>in</strong> produc<strong>in</strong>g region, <strong>in</strong> additionto <strong>the</strong> significant <strong>in</strong>crease <strong>in</strong> <strong>the</strong> price <strong>of</strong> oil, which exceeded US$100 per barrel for part <strong>of</strong> <strong>the</strong> year.Brazilian ethanol exports totaled 5.12 billion liters. The ma<strong>in</strong> buyers were <strong>the</strong> United States (34%), Ne<strong>the</strong>rlands(26%), Jamaica (8%) and El Salvador (7%). Despite <strong>the</strong> small volume <strong>of</strong> exports compared to total production,this shows <strong>the</strong> great potential for growth – s<strong>in</strong>ce 2001 <strong>the</strong> volume exported has grown 14-fold, andexport revenues 24-fold). The most significant <strong>in</strong>crease came <strong>in</strong> 2004, when exports rose 220% by volume toapproximately 2.4 billion liters. This <strong>in</strong>cludes ethanol dest<strong>in</strong>ed for <strong>the</strong> chemical and beverage <strong>in</strong>dustries.
28 Ethanol and Bioelectricity <strong>Sugarcane</strong> <strong>in</strong> <strong>the</strong> <strong>Future</strong> <strong>of</strong> <strong>the</strong> <strong>Energy</strong> <strong>Matrix</strong>The domestic market <strong>in</strong> 2008 consumed 14.1 billion liters <strong>of</strong> hydrous ethanol, count<strong>in</strong>g <strong>the</strong> formal and<strong>in</strong>formal markets, generat<strong>in</strong>g US$6.6 billion <strong>in</strong> revenues for mills. Sales volumes <strong>of</strong> this product have grownconsiderably <strong>in</strong> recent years, with an <strong>in</strong>crease <strong>of</strong> 87% over 2006. The ma<strong>in</strong> reason for this expansion was<strong>the</strong> <strong>in</strong>troduction <strong>of</strong> flex-fuel vehicles, which <strong>in</strong> 2008 accounted for 90% <strong>of</strong> light commercial vehicle production<strong>in</strong> Brazil.Mills sold 6.5 billion liters <strong>of</strong> anhydrous ethanol worth US$3 billion <strong>in</strong> <strong>the</strong> domestic market <strong>in</strong> 2008, count<strong>in</strong>g<strong>the</strong> formal and <strong>in</strong>formal markets. The ma<strong>in</strong> use <strong>of</strong> this product <strong>in</strong> Brazil is for blend<strong>in</strong>g with gasol<strong>in</strong>e, currentlyat a proportion <strong>of</strong> 25%. Given <strong>the</strong> <strong>in</strong>crease <strong>in</strong> consumption <strong>of</strong> ethanol compared to gasol<strong>in</strong>e, because<strong>of</strong> <strong>the</strong> <strong>in</strong>crease <strong>in</strong> flex-fuel vehicles, <strong>the</strong> consumption <strong>of</strong> anhydrous ethanol has decl<strong>in</strong>ed <strong>in</strong> recent years.Graph 3 Bill<strong>in</strong>gs <strong>of</strong> <strong>in</strong>dustrial <strong>in</strong>puts segments After <strong>the</strong> plantation – US$ millionsIndustrial equipmentInstallation and ma<strong>in</strong>tenanceservicesCivil constructionChemical productsElectrical <strong>in</strong>stallationsAutomation/<strong>in</strong>strumentationFuel oil and lubricantsSack<strong>in</strong>gPersonal protective equipmentLaboratory materialBig bags594.75463.82366.00269.7694.1945.4238.9615.4614.671,110.353,400.980 500 1,000 1,500 2,000 2,500 3,000 3,500Agricultural <strong>in</strong>puts Gross value Sales tax 1 Net valueIndustrial equipment 3,400.98 680.20 2,720.78Installation and ma<strong>in</strong>tenance services 1,110.35 102.71 1,007.64Civil construction 594.75 55.01 539.74Chemical products 463.82 69.57 394.25Electrical <strong>in</strong>stallations 366.00 64.05 301.95Automation/<strong>in</strong>strumentation 269.76 47.20 222.55Fuel oil and lubricants 94.19 23.09 71.09Sack<strong>in</strong>g 45.42 9.08 36.34Personal protective equipment 38.96 7.79 31.17Laboratory material 15.46 4.39 11.07Big bags 14.67 2.93 11.741IPI, ICMS, PIS and COFINSSource: Neves, Tromb<strong>in</strong> and Consoli, with data generated by Markestrat (2009).
The Sugar-<strong>Energy</strong> Map <strong>of</strong> Brazil29<strong>Sugarcane</strong> ethanol is also used <strong>in</strong> Brazil for non-energy purposes, ma<strong>in</strong>ly <strong>in</strong> <strong>the</strong> production <strong>of</strong> beverages,cosmetics, pharmaceuticals and chemicals. Accord<strong>in</strong>g to data from <strong>the</strong> National <strong>Energy</strong> Balance, this consumptionwas 720 million liters <strong>in</strong> 2008, represent<strong>in</strong>g revenues <strong>of</strong> US$438.8 million for <strong>the</strong> mills.Ethanol Distributors and service stationsDistributors billed US$8.6 billion; fill<strong>in</strong>g stations US$11.1 billion.Sugar MillsMills earned US$9.8 billion from sugar sales <strong>in</strong> 2008, <strong>in</strong>clud<strong>in</strong>g domestic and export markets. Exports producedrevenues <strong>of</strong> US$5.5 billion (67% from raw sugar; 33% from white sugar). Of <strong>the</strong> 19.5 million tonnesshipped, 83% was produced <strong>in</strong> <strong>the</strong> Center-South <strong>of</strong> Brazil and 17% <strong>in</strong> <strong>the</strong> North-Nor<strong>the</strong>astern region.About 50% <strong>of</strong> exports went to five countries, with <strong>the</strong> rema<strong>in</strong>der distributed among more than 100 o<strong>the</strong>rcountries. Between 2000 and 2008, on average, 25% <strong>of</strong> sugar exported by Brazil went to Russia, <strong>the</strong> lead<strong>in</strong>g<strong>in</strong>ternational market, followed by Nigeria, Egypt and Saudi Arabia. Exports take <strong>the</strong> majority <strong>of</strong> sugarproduced <strong>in</strong> Brazil, and Brazilian production has grown much faster than domestic consumption, which hasma<strong>in</strong>ta<strong>in</strong>ed steady growth averag<strong>in</strong>g 3% a year over <strong>the</strong> past six years.Mills billed US$4.3 billion for sugar sales <strong>in</strong> <strong>the</strong> domestic market. Of this, sales to <strong>the</strong> food <strong>in</strong>dustry wereworth around US$2.0 billion (US$1.6 billion retail and US$580.6 million wholesale). Part <strong>of</strong> <strong>the</strong> sugar volumego<strong>in</strong>g to <strong>in</strong>dustrial consumers is sold <strong>in</strong>directly via specialized wholesalers to small factories. Thesewholesalers also repack sugar <strong>in</strong>to smaller packages for retail sale. This specific case was not considered <strong>in</strong>our mapp<strong>in</strong>g, given <strong>the</strong> difficulty <strong>of</strong> estimat<strong>in</strong>g <strong>the</strong> volume <strong>of</strong> sales and prices for this type <strong>of</strong> wholesaler –no source <strong>of</strong> relevant secondary data was found.The ma<strong>in</strong> <strong>in</strong>dustrial consumers <strong>of</strong> sugar are producers <strong>of</strong> s<strong>of</strong>t dr<strong>in</strong>ks (20%), candies and chocolates (10%),chemicals (10%) and dairy products (7%), with o<strong>the</strong>r <strong>in</strong>dustries compris<strong>in</strong>g 53%. The ma<strong>in</strong> type <strong>of</strong> sugarsold is granulated (61%), followed by ref<strong>in</strong>ed granulated (36%), and o<strong>the</strong>r types (4%).In terms <strong>of</strong> volume, <strong>the</strong> Center-South region sold 10.5 million tonnes and <strong>the</strong> North-Nor<strong>the</strong>ast 1.02 milliontonnes. Center-South production was sold 60% to <strong>in</strong>dustry, 28% direct to retail and 12% via wholesale.North-Nor<strong>the</strong>ast production broke down as follows: 53% retail; 25% <strong>in</strong>dustry; 22% wholesale. Total sugarsales to <strong>in</strong>dustry were 6.6 million tonnes (direct sales for retail were 3.5 million tonnes, and for wholesale,1.5 million tonnes).
30 Ethanol and Bioelectricity <strong>Sugarcane</strong> <strong>in</strong> <strong>the</strong> <strong>Future</strong> <strong>of</strong> <strong>the</strong> <strong>Energy</strong> <strong>Matrix</strong>Sugar Wholesale and RetailWholesalers billed US$743.9 million with sugar <strong>in</strong> 2008; retailers US$3,259.3 million.Bioelectricity MillsBioelectricity generated from sugarcane bagasse is becom<strong>in</strong>g an <strong>in</strong>creas<strong>in</strong>gly important byproduct for mills.In 2008, approximately 30 mills negotiated 544 MW average for annual sale over a 15-year period, provid<strong>in</strong>gannual bill<strong>in</strong>gs <strong>of</strong> US$389.6 million.Yeast MillsAbout 10% <strong>of</strong> yeasts used <strong>in</strong> ethanol production (for fermentation <strong>of</strong> sugarcane juice) is subsequentlyrecovered and dest<strong>in</strong>ed for mix<strong>in</strong>g <strong>in</strong>to livestock feed. Exports <strong>of</strong> sugarcane ethanol yeasts <strong>in</strong> 2008 totaled32,000 tonnes, worth US$16.8 million. That was an atypical year, however, because ano<strong>the</strong>r 15,000 tonnescould have been exported but for a problem <strong>of</strong> contam<strong>in</strong>ation, now resolved. Revenues <strong>in</strong> <strong>the</strong> domesticmarket were US$11.1 million from <strong>the</strong> sale <strong>of</strong> 24,000 tonnes <strong>of</strong> dry yeast. The price per tonne <strong>in</strong> <strong>the</strong> domesticmarket was higher because <strong>of</strong> logistical costs and taxes.Mills also sell additives based on sugarcane yeast (such as <strong>the</strong> cell wall). Exports <strong>of</strong> this byproduct <strong>in</strong> 2008totaled 13,400 tonnes, generat<strong>in</strong>g revenues <strong>of</strong> US$25.4 million. A fur<strong>the</strong>r 5,000 tonnes <strong>of</strong> additives weresold <strong>in</strong> <strong>the</strong> domestic market, generat<strong>in</strong>g US$10.3 million <strong>in</strong> revenues. This means that revenues from yeastand <strong>the</strong>ir additives <strong>in</strong> 2008 totaled US$63.6 million, <strong>of</strong> which US$21.4 million <strong>in</strong> <strong>the</strong> domestic market andUS$42.2 million <strong>in</strong> <strong>the</strong> foreign market.Carbon Credit MillsBrazil ranks third <strong>in</strong> <strong>the</strong> world amongst seller countries, <strong>in</strong> terms <strong>of</strong> traded volume, but had only 3% <strong>of</strong> <strong>the</strong>global market <strong>in</strong> 2008. Ch<strong>in</strong>a and India were <strong>in</strong> first place with 84% and 4%, respectively. However, Brazil hada share <strong>of</strong> nearly 8% <strong>in</strong> primary Certified Emission Reductions (CERs) between 2002 and 2008. The worldwidetraded amount <strong>in</strong> 2008 was 389 million tonnes <strong>of</strong> CO2 valued at US$6,52 billion, 14% down on 2007.Brazil participates <strong>in</strong> <strong>the</strong> carbon credits market via <strong>the</strong> Clean Development Mechanism (CDM), because it is <strong>the</strong>only Kyoto Protocol mechanism that allows voluntary participation <strong>of</strong> develop<strong>in</strong>g countries. The 68 Brazilianprojects registered by <strong>the</strong> United Nations Framework Convention on Climate Change (UNFCCC) <strong>in</strong> <strong>the</strong> carboncredit market generated an estimated reduction <strong>of</strong> 3.45 million tonnes <strong>of</strong> CO2 <strong>in</strong> 2008, with revenues <strong>of</strong> aboutUS$25.4 million – <strong>the</strong> average price <strong>in</strong> <strong>the</strong> voluntary market was US$7.3 <strong>in</strong> 2008. Of <strong>the</strong> 68 projects, 24 werefrom <strong>the</strong> sugar-energy sector, generat<strong>in</strong>g an estimated reduction <strong>of</strong> 473,900 tonnes <strong>of</strong> CO 2(US$3.5 million).
The Sugar-<strong>Energy</strong> Map <strong>of</strong> Brazil31Bioplastics MillsBioplastics represent an <strong>in</strong>novative way <strong>of</strong> us<strong>in</strong>g sugarcane bagasse. If <strong>in</strong>vestments are made as planned, <strong>the</strong>n<strong>in</strong> a short time bioplastics will represent a significant revenue source for mills. It is called “bio” because it comesfrom natural sources, and is biodegradable. Studies <strong>in</strong>dicate that <strong>in</strong> up to 180 days all traces are elim<strong>in</strong>atedfrom <strong>the</strong> environment. Thanks to <strong>the</strong>se characteristics, bioplastics are prized <strong>in</strong> <strong>the</strong> organic market. The estimatedannual worldwide demand for this new product already stands at 600,000 tonnes, at a price estimated tobe 15% to 30% higher than <strong>the</strong> conventional product. Accord<strong>in</strong>g to <strong>the</strong> European Bioplastics Institute, almost331,000 tonnes <strong>of</strong> bioplastics is produced, represent<strong>in</strong>g less than 1% <strong>of</strong> syn<strong>the</strong>tic plastics produced annually.Brazilian bioplastics production is still at too small a scale for <strong>the</strong> product to be commercially marketed.PHB Industrial, a company controlled by Pedra Agro<strong>in</strong>dustrial and Grupo Balbo, has with<strong>in</strong> its <strong>in</strong>dustrial complexone <strong>of</strong> Brazil’s first pilot projects, a laboratory-scale operation capable <strong>of</strong> produc<strong>in</strong>g about 60 tonnes/year <strong>of</strong> bioplastics that is currently exported to Japan, <strong>the</strong> United States and Europe at an average price <strong>of</strong>US$5/kilo for pure res<strong>in</strong>. Very little <strong>of</strong> this material has been sold. Most <strong>of</strong> <strong>the</strong> material exported has gone to<strong>in</strong>ternational companies for application development. PHB Industrial is design<strong>in</strong>g a commercial plant to startoperat<strong>in</strong>g <strong>in</strong> two to three years, an <strong>in</strong>vestment that will allow <strong>the</strong> company to sell bioplastics on a commercialscale to both <strong>the</strong> domestic and export markets. Press reports <strong>in</strong>dicate that <strong>the</strong> unit will produce 10,000tonnes/year and beg<strong>in</strong> operat<strong>in</strong>g <strong>in</strong> 2010.Braskem, a company from Rio Grande do Sul state, currently has production capacity <strong>of</strong> approximately 12 tonnes/year <strong>in</strong> its pilot plant, and has announced <strong>in</strong>vestments to beg<strong>in</strong> produc<strong>in</strong>g 200,000 tonnes/year by 2011. DowChemical announced it was creat<strong>in</strong>g <strong>the</strong> first ethanol chemical complex with production projected at 350,000tonnes/year as <strong>of</strong> 2011. And Coopersucar, work<strong>in</strong>g <strong>in</strong> partnership with <strong>the</strong> Solvay group <strong>of</strong> Belgium, is set to produce120,000 tonnes <strong>in</strong> 2010 accord<strong>in</strong>g to <strong>the</strong> Brazilian Industrial Development Agency. If <strong>in</strong>vestments plannedthrough 2010 do <strong>in</strong> fact materialize, <strong>the</strong> ethanol chemical <strong>in</strong>dustry will require 650 million liters <strong>of</strong> ethanol.Facilitat<strong>in</strong>g agentsBNDES – The bank made available US$3,530.79 million for companies <strong>in</strong> <strong>the</strong> sugar-energy sector, so stimulat<strong>in</strong>g<strong>the</strong> development and ma<strong>in</strong>tenance <strong>of</strong> <strong>the</strong> sector.Outsourced – The sector has been go<strong>in</strong>g through a process <strong>of</strong> consolidation. New bus<strong>in</strong>ess groups havecome <strong>in</strong>to <strong>the</strong> sugarcane bus<strong>in</strong>ess, br<strong>in</strong>g<strong>in</strong>g pr<strong>of</strong>essionalized management that focuses on operational efficiencyand better f<strong>in</strong>ancial allocation <strong>of</strong> capital. This has created a demand for outsourced services, so favor<strong>in</strong>g<strong>the</strong> entry <strong>of</strong> companies specialized <strong>in</strong> services for operat<strong>in</strong>g logistics for <strong>the</strong> sugarcane sector. In 2008,<strong>the</strong> Center for Science and Technology (CCT) was responsible for US$916.3 million <strong>of</strong> outsourced services.Road freight for export <strong>of</strong> sugar and ethanol – Road freight for sugar and ethanol exports was worthUS$539.03 million. Road freight for sugar export <strong>in</strong> <strong>the</strong> Center-South <strong>of</strong> Brazil accounted for US$383.6 mil-
32 Ethanol and Bioelectricity <strong>Sugarcane</strong> <strong>in</strong> <strong>the</strong> <strong>Future</strong> <strong>of</strong> <strong>the</strong> <strong>Energy</strong> <strong>Matrix</strong>lion, and <strong>of</strong> that amount, freight for ethanol exports came to US$155.42 million. Freight for sugar exportson Brazilian railroads cost approximately US$34.16/tonne; ethanol US$34.76/m 3 . The ports <strong>of</strong> Santos andParanaguá were <strong>the</strong> sector’s ma<strong>in</strong> export routes <strong>in</strong> 2008.Highway tolls for sugar and ethanol exports (Port <strong>of</strong> Santos) – Total spend<strong>in</strong>g on highway tolls forethanol and sugar export freight <strong>in</strong> São Paulo state came to US$79.9 million <strong>in</strong> 2008.Port costs (Santos) – The Port <strong>of</strong> Santos had estimated 2008 revenues <strong>of</strong> US$213.5 million relat<strong>in</strong>g to clearance,load<strong>in</strong>g and supervision <strong>of</strong> sugar and ethanol shipments. It is worth not<strong>in</strong>g that almost 70% (by volume)<strong>of</strong> Brazil’s total ethanol and sugar exports passed through Santos.Research & Development (R&D) – In 2008, US$79.2 million was allocated to sugar and ethanol <strong>in</strong>dustry researchby bodies such as FINEP, FAPESP, Canavialis and Allelyx, CTC and IAC. It was used <strong>in</strong>ternally or distributedto public and private organizations <strong>in</strong>clud<strong>in</strong>g USP, UNICAMP, UNESP, EMBRAPA, Ridesa, and o<strong>the</strong>rs.Events – Five important sugar-energy <strong>in</strong>dustry events were identified <strong>in</strong> 2008. Toge<strong>the</strong>r <strong>the</strong>se cost US$5.3million.Specialized magaz<strong>in</strong>es – The major magaz<strong>in</strong>es cover<strong>in</strong>g <strong>the</strong> sector (Cana Journal, IDEA News, EnergiaMundo, Cana Mix, Canavieros and Stab) billed US$3.99 million with a total <strong>of</strong> 61,000 copies <strong>in</strong> circulation.Health plans and meals – Accord<strong>in</strong>g to <strong>the</strong> Union <strong>of</strong> Workers <strong>in</strong> Sugar, Food and Allied Sectors, workers<strong>in</strong> <strong>the</strong> State <strong>of</strong> São Paulo receive health plans and meals paid for completely or <strong>in</strong> part by <strong>the</strong> mills. Theaverage monthly cost paid by mills for health plans is US$33.00 per person. It can thus be <strong>in</strong>ferred that <strong>the</strong>health plan <strong>in</strong>dustry earned about US$125.5 million <strong>in</strong> 2008 from <strong>the</strong> sugar-energy sector. It is worth mention<strong>in</strong>g<strong>the</strong> great importance <strong>of</strong> <strong>the</strong>se health plans for <strong>the</strong> communities where mills are located, because<strong>the</strong>y reduce <strong>the</strong> burden on public hospitals. With respect to meal plans, mills <strong>in</strong> São Paulo disbursed anestimated US$188.3 million <strong>in</strong> 2008 – an average monthly cost <strong>of</strong> US$49.00 per person.Wages / JobsAccord<strong>in</strong>g to <strong>the</strong> Annual Report <strong>of</strong> Social Information (RAIS) prepared by <strong>the</strong> M<strong>in</strong>istry <strong>of</strong> Labor and Employment,1,283,258 formal jobs were registered <strong>in</strong> <strong>the</strong> sector 2008. The breakdown was 481,662 jobs<strong>in</strong> sugarcane plantations, 561,292 <strong>in</strong> raw sugar factories, 13,791 <strong>in</strong> sugarcane crush<strong>in</strong>g and ref<strong>in</strong><strong>in</strong>g, and226,513 <strong>in</strong> ethanol production).The sugarcane <strong>in</strong>dustry has seen a grow<strong>in</strong>g <strong>in</strong>cidence <strong>of</strong> formal employment. Accord<strong>in</strong>g to data from <strong>the</strong>IBGE, formal employment <strong>in</strong> <strong>the</strong> sector reached 80.9% <strong>in</strong> Brazil <strong>in</strong> 2007 (66.5% <strong>in</strong> <strong>the</strong> North-Nor<strong>the</strong>astregion; 90.3% <strong>in</strong> <strong>the</strong> Center-South; 95.1% <strong>in</strong> São Paulo). In all, <strong>the</strong>re are 1.43 million jobs <strong>in</strong> <strong>the</strong> sector.Consider<strong>in</strong>g that every direct job creates two <strong>in</strong>direct ones, <strong>the</strong> figure <strong>in</strong>creases to 4.29 million people em-
The Sugar-<strong>Energy</strong> Map <strong>of</strong> Brazil33ployed <strong>in</strong> jobs related to sugarcane. São Paulo employs 40% <strong>of</strong> <strong>the</strong> total, <strong>the</strong> highest participation <strong>of</strong> anystate, with 54% <strong>in</strong> sugarcane cultivation.Illiterate and poorly-educated workers (with at most 5th grade complete) represented over 55% <strong>of</strong> <strong>the</strong> totallabor force employed <strong>in</strong> sugarcane cultivation <strong>in</strong> 2008, but <strong>in</strong> <strong>the</strong> Center-South <strong>of</strong> Brazil this group did notexceed 5%. The proportion <strong>of</strong> illiterate and poorly-educated workers <strong>in</strong> sugar and ethanol manufacture isslightly lower than <strong>in</strong> cultivation. However, <strong>in</strong>creased mechanization is creat<strong>in</strong>g a grow<strong>in</strong>g demand for morequalified pr<strong>of</strong>essionals. A mechanical harvester replaces <strong>the</strong> work <strong>of</strong> 100 people with low qualification. On<strong>the</strong> o<strong>the</strong>r hand, it requires 10 employees tra<strong>in</strong>ed <strong>in</strong> automation and mechanization. Agencies <strong>in</strong>clud<strong>in</strong>gSENAR, SENAI, and CTC are help<strong>in</strong>g to tra<strong>in</strong> this new type <strong>of</strong> labor that <strong>the</strong> <strong>in</strong>dustry demands, but <strong>the</strong>re isstill room for o<strong>the</strong>r organizations to work to improve labor qualification <strong>in</strong> <strong>the</strong> sector.Ano<strong>the</strong>r issue exam<strong>in</strong>ed was <strong>the</strong> wage level <strong>of</strong> workers <strong>in</strong> <strong>the</strong> sector, concentrated ma<strong>in</strong>ly between one andthree times <strong>the</strong> m<strong>in</strong>imum monthly salary. Moreover, even with <strong>the</strong> seasonal characteristic <strong>of</strong> <strong>the</strong> sector muchreduced <strong>in</strong> recent years by <strong>the</strong> application <strong>of</strong> new technologies <strong>in</strong> sugarcane cultivation and harvest<strong>in</strong>g, <strong>the</strong>total <strong>of</strong> formal jobs was 2.9% higher than <strong>the</strong> previous year (up from 572,194 <strong>in</strong> 2007 to 588,826 <strong>in</strong> 2008).The Center-South region presents an average monthly <strong>in</strong>come <strong>of</strong> R$1,062.55 per worker, while <strong>in</strong> <strong>the</strong>North-Nor<strong>the</strong>ast region <strong>the</strong> average is R$666.20. The national average is R$942.02. Total wages <strong>in</strong> <strong>the</strong>Center-South region are R$786.3 million, with R$422.6 million <strong>in</strong> <strong>the</strong> North-Nor<strong>the</strong>ast and a national total<strong>of</strong> R$1.21 billion.TaxesTotal taxes were calculated by add<strong>in</strong>g up <strong>the</strong> taxes generated at each stage <strong>of</strong> <strong>the</strong> agro-<strong>in</strong>dustrial system(SAG), from <strong>the</strong> sale <strong>of</strong> agricultural and <strong>in</strong>dustrial <strong>in</strong>puts through to <strong>the</strong> sale <strong>of</strong> f<strong>in</strong>al products. To elim<strong>in</strong>atedouble count<strong>in</strong>g and arrive at a net figure for taxes <strong>in</strong> <strong>the</strong> SAG, <strong>the</strong> taxes on agricultural and <strong>in</strong>dustrial <strong>in</strong>putsgenerated <strong>in</strong> <strong>the</strong> first stage <strong>of</strong> <strong>the</strong> supply cha<strong>in</strong>, which can be deducted from <strong>the</strong>ir own tax liability byprocess<strong>in</strong>g companies <strong>in</strong> <strong>the</strong> next stage, were subtracted.This calculation resulted <strong>in</strong> an estimate that taxes paid by <strong>the</strong> SAG <strong>in</strong> 2008 totaled US$9,868.2 million, butUS$3,012.8 million <strong>of</strong> this amount was generated through <strong>the</strong> sale <strong>of</strong> agricultural and <strong>in</strong>dustrial <strong>in</strong>puts. Netaggregate taxes paid by <strong>the</strong> SAG were thus estimated at US$6,855.4 million.Taxes were calculated us<strong>in</strong>g a weighted average rate, estimated from <strong>the</strong> rate that applies to <strong>the</strong> merchandise<strong>in</strong> <strong>the</strong> ma<strong>in</strong> produc<strong>in</strong>g states, tak<strong>in</strong>g <strong>in</strong>to account tax <strong>in</strong>centives and <strong>the</strong> volumes produced. Only taxeson bill<strong>in</strong>gs were considered <strong>in</strong> this calculation – IPI, ICMS, PIS and COFINS. In <strong>the</strong> case <strong>of</strong> <strong>the</strong> ICMS, weused <strong>the</strong> <strong>in</strong>terstate rate for Center-South states ra<strong>the</strong>r than <strong>the</strong> weighted average. In <strong>the</strong> case <strong>of</strong> PIS andCOFINS, we used <strong>the</strong> standard rates <strong>of</strong> 1.65% and 7.60%, except for ethanol which is taxed at a fixed value<strong>in</strong> R$ per liter. Also, <strong>in</strong> <strong>the</strong> case <strong>of</strong> IPI we gave priority to <strong>the</strong> rates apply<strong>in</strong>g to <strong>the</strong> most relevant products
34 Ethanol and Bioelectricity <strong>Sugarcane</strong> <strong>in</strong> <strong>the</strong> <strong>Future</strong> <strong>of</strong> <strong>the</strong> <strong>Energy</strong> <strong>Matrix</strong>at each stage <strong>of</strong> <strong>the</strong> cha<strong>in</strong>. For estimat<strong>in</strong>g aggregate taxes <strong>in</strong> <strong>the</strong> agri-<strong>in</strong>dustrial system, we assumed thatall companies opted to be taxed on actual ra<strong>the</strong>r than estimated pr<strong>of</strong>its.5. F<strong>in</strong>al remarksThis study set out to provide a complete picture <strong>of</strong> <strong>the</strong> sugar and ethanol agro-<strong>in</strong>dustrial system. After fivemonths <strong>of</strong> research it became evident that <strong>the</strong> complete supply cha<strong>in</strong> is generat<strong>in</strong>g some impressive numbers,with total annual economic impact exceed<strong>in</strong>g US$80 billion. This study – probably <strong>the</strong> most recentand complete picture <strong>of</strong> this supply cha<strong>in</strong> <strong>in</strong> Brazil – can be a basis for public and private decision-mak<strong>in</strong>g.The sugar and ethanol supply cha<strong>in</strong> has already shown its potential to supply products <strong>in</strong> a susta<strong>in</strong>ablemanner, help<strong>in</strong>g Brazil develop one <strong>of</strong> <strong>the</strong> world’s cleanest energy matrixes. It is estimated, that by 2015,80% <strong>of</strong> <strong>the</strong> fuel used <strong>in</strong> Brazil will be ethanol. Bioelectricity has <strong>the</strong> potential to supply approximately 15%<strong>of</strong> total national demand for electricity by <strong>the</strong> end <strong>of</strong> <strong>the</strong> decade. The country is on course to dom<strong>in</strong>ateglobal sugar exports, with almost 50% <strong>of</strong> <strong>the</strong> world market <strong>in</strong> 2009 and <strong>the</strong> expectation <strong>of</strong> pass<strong>in</strong>g 60%<strong>in</strong> five years. F<strong>in</strong>ally, it should be emphasized that new byproducts like cellulosic or second-generationethanol, sugarcane-based diesel and biobutanol represent important new technologies that are alreadyoperat<strong>in</strong>g <strong>in</strong> pilot projects or on a demonstration scale. These will be important revenue sources <strong>in</strong> <strong>the</strong>com<strong>in</strong>g years.This study also shows that <strong>the</strong> sugar and ethanol supply cha<strong>in</strong>, which is <strong>of</strong> fundamental importance to <strong>the</strong>Brazilian economy, has enormous capacity to spread development <strong>in</strong>to <strong>the</strong> country’s <strong>in</strong>land rural regions.
The Sugar-<strong>Energy</strong> Map <strong>of</strong> Brazil35Details <strong>of</strong> methodology and quantification calculationsAnnex 1Stage <strong>of</strong> <strong>the</strong>supply cha<strong>in</strong>Quantification criteriaSourcesFertilizersHerbicidesand pesticidesSoil nutrientsAutoparts(<strong>in</strong>cludesma<strong>in</strong>tenance)TractorsHarvestersImplementsTrucksTruck bodiesand trailersPrior to <strong>the</strong> plantationVolume and revenues <strong>of</strong> <strong>the</strong> segment, adjusted by <strong>the</strong>percentage dest<strong>in</strong>ed for sugarcane production. Secondary data.Volume and revenues <strong>of</strong> <strong>the</strong> segment, consider<strong>in</strong>g <strong>the</strong> marketshare <strong>of</strong> sugarcane. Secondary data.Estimates based on national consumption (just lime; chalk wasnot considered):Utilization basis – area (ha) restoration and expansion (A)Dosage: 2 doses <strong>of</strong> 1.5 tonnes <strong>of</strong> lime/ha (B)Average FOB price <strong>of</strong> lime <strong>in</strong> <strong>the</strong> lead<strong>in</strong>g states (C)Estimated bill<strong>in</strong>g = A x B x CEstimates based on <strong>the</strong> amount <strong>of</strong> equipment per mill andspend<strong>in</strong>g with parts and ma<strong>in</strong>tenance.Number <strong>of</strong> mills (A)Average quantity <strong>of</strong> equipment per mill (B)Average value with equipment ma<strong>in</strong>tenance (parts & service) (C)Estimated bill<strong>in</strong>g = A x B x CAverage price <strong>of</strong> tractors by power (A)Number <strong>of</strong> tractors sold to <strong>the</strong> sugar-energy sector - by power (B)i = power ranges for tractorsEstimate = Σ Ai x BiAverage price <strong>of</strong> harvesters (A)Quantity <strong>of</strong> harvesters sold (B)Estimate = A x BEstimated amount <strong>of</strong> implements sold annually:Implements = 150% <strong>of</strong> <strong>the</strong> number <strong>of</strong> units <strong>of</strong> motorizedequipment (A).Number <strong>of</strong> units <strong>of</strong> motorized equipment = 17.07 units per1,000 ha (B).Implement lifespan = 10 years (C).<strong>Sugarcane</strong> area <strong>in</strong> thousand ha (D).Average price <strong>of</strong> implements (E)Estimated bill<strong>in</strong>g on irrigation equipment (all systems) for sugarenergysector (F)Estimated bill<strong>in</strong>g = [(A x B x D / C) x E] + FEstimate <strong>of</strong> new vehicles, based on <strong>the</strong> fleet and fleet renewalrate.Heavy trucks for carry<strong>in</strong>g cane = 2.27/1,000ha harvested (A)Fleet renewal rate = 8.11 years (B)Cane production area, <strong>in</strong> 1,000ha (C).Average price for heavy trucks (D)Estimated bill<strong>in</strong>g = (A x C / B) x DEstimate based on number <strong>of</strong> units sold and average price.Number <strong>of</strong> units sold (A)Average price (B)i = product type (body, semi-trailer, 2 axle trailer, 4 axle trailer).Estimated bill<strong>in</strong>g = Σ Ai x BiABIQUIMANDASINDAGMapa (A)FNP (B)Abracal (C)Mapa (A)RPA Consultoria (B, C)Interviews with companies <strong>in</strong> <strong>the</strong> segment- Valtra and Case IH dealers (A, B)Interviews with companies <strong>in</strong> <strong>the</strong> segment- Santal and Case IH dealers (A, B)RPA Consultoria/IDEA (A, B, C)MAPA (D)Average <strong>of</strong> companies <strong>in</strong> <strong>the</strong> segment(Sermag, Civemasa, Tracan, DMB, Santal)(E)ABIMAQ (F)Idea (A, B)MAPA (B)Interview with dealers <strong>in</strong> segment -average values (D)ANFIR (A)Interviews with companies <strong>in</strong> <strong>the</strong>segment - average values (B)
36 Ethanol and Bioelectricity <strong>Sugarcane</strong> <strong>in</strong> <strong>the</strong> <strong>Future</strong> <strong>of</strong> <strong>the</strong> <strong>Energy</strong> <strong>Matrix</strong>Annex 1Details <strong>of</strong> methodology and quantification calculationsStage <strong>of</strong> <strong>the</strong>supply cha<strong>in</strong>Diesel oil andlubricantsResellers andcooperatives(just forherbicides andpesticides)Agriculturalprotectivecloth<strong>in</strong>g<strong>Sugarcane</strong>productionQuantification criteriaDiesel consumption by activity <strong>in</strong> cane production (A)<strong>Sugarcane</strong> area (ha) (B)Average price <strong>of</strong> diesel (C)i = activities (cane plant<strong>in</strong>g, ratoon, harvest<strong>in</strong>g,transport<strong>in</strong>g cane to <strong>the</strong> mill, transport<strong>in</strong>g <strong>in</strong>puts)Estimate for diesel = (Σ Ai x Bi) x CAverage lubricant consumption liters / ha (D)Average lubricant cost (E)Estimate for lubricants = D x B x EEstimated % <strong>of</strong> herbicides/pesticides sold <strong>in</strong>directly viaresellers and cooperatives (A)Estimated marg<strong>in</strong> <strong>of</strong> distribution channels (B)Revenue for cane herbicides/pesticides segment (C)Estimated bill<strong>in</strong>g = A x B x CAverage spend<strong>in</strong>g/tc (A)<strong>Sugarcane</strong> production <strong>in</strong> tonnes (B)Estimated bill<strong>in</strong>g = A x BIn <strong>the</strong> plantation<strong>Sugarcane</strong> production <strong>in</strong> tonnes (A)Estimated % <strong>of</strong> privately-owned cane and suppliers (B)Average total recoverable sugars (kg/tc) (C)TRS value R$/ kg (D)Estimated bill<strong>in</strong>g = A x B x C x DSourcesAgroanalysis (A)MAPA (B)Markestrat survey and Pecege (C, E)Idea (D)Interviews with herbicides/pesticides<strong>in</strong>dustries and cooperatives (A, B)SINDAG (C)Research with mills (A)CONAB (B)CONAB (A)MAPA (B)CONSECANA (C, D)After <strong>the</strong> plantation (<strong>in</strong>dustrial <strong>in</strong>puts)IndustrialequipmentInstallation andma<strong>in</strong>tenanceservicesChemicalsFuel oil andlubricantsNew mills and <strong>in</strong>stalled sugarcane crush<strong>in</strong>g capacity (A)Estimated value <strong>of</strong> <strong>in</strong>dustrial <strong>in</strong>vestments per tonne <strong>of</strong><strong>in</strong>stalled sugarcane crush<strong>in</strong>g capacity, <strong>in</strong>clud<strong>in</strong>g equipment,<strong>in</strong>strumentation/automation, and electric <strong>in</strong>stallations <strong>in</strong> newprojects (B)Costs <strong>of</strong> ma<strong>in</strong>ta<strong>in</strong><strong>in</strong>g <strong>the</strong> mill between harvests, per tonne <strong>of</strong>crushed cane <strong>in</strong> <strong>the</strong> Center-South and Nor<strong>the</strong>ast (C)Estimate (<strong>in</strong> %) <strong>of</strong> cost <strong>of</strong> ma<strong>in</strong>tenance spent on equipment<strong>in</strong> <strong>the</strong> Center-South and Nor<strong>the</strong>ast (D)Volume <strong>of</strong> sugarcane crushed <strong>in</strong> <strong>the</strong> Center-South andNor<strong>the</strong>ast (E)Estimate <strong>of</strong> automation and <strong>in</strong>strumentation projects sold <strong>in</strong>2008 for mills sold <strong>in</strong> previous years (F)Average price <strong>of</strong> each automation project (G)Estimated bill<strong>in</strong>g = (A x B) + (C x D x E) + (F x G)New mills and <strong>in</strong>stalled sugarcane crush<strong>in</strong>g capacity (A)Estimated value <strong>of</strong> <strong>in</strong>dustrial assembly service per tonne <strong>of</strong><strong>in</strong>stalled sugarcane crush<strong>in</strong>g capacity (B)Estimate (<strong>in</strong> %) <strong>of</strong> ma<strong>in</strong>tenance cost that is spent on services<strong>in</strong> <strong>the</strong> Center-South and Nor<strong>the</strong>ast (D)<strong>Sugarcane</strong> volume <strong>in</strong> <strong>the</strong> Center-South and Nor<strong>the</strong>ast (E)Estimated bill<strong>in</strong>g (A x B) + (C x D x E)Average expenditure per tonne <strong>of</strong> sugarcane (A)<strong>Sugarcane</strong> production <strong>in</strong> tonnes (B)Estimated bill<strong>in</strong>g = A x BAverage consumption per tonne <strong>of</strong> sugarcane (A)<strong>Sugarcane</strong> production <strong>in</strong> tonnes (B)Average price (C)Estimated bill<strong>in</strong>g = A x B x CInterviews with capital goods <strong>in</strong>dustry (A)Procknor Engenharia (B)Research with mills and Pecege data (C)Pecege (D)MAPA (I)Interviews with automation and<strong>in</strong>strumentation company (F, G)Interviews with capital goods <strong>in</strong>dustry (A)Procknor Engenharia (B) Research withmills and Pevege data (C)Pecege (D)MAPA (E)Research with mills (A) CONAB (B)Research with mills and Pecege data (A, C)CONAB (B)
The Sugar-<strong>Energy</strong> Map <strong>of</strong> Brazil37Details <strong>of</strong> methodology and quantification calculationsAnnex 1Stage <strong>of</strong> <strong>the</strong>supply cha<strong>in</strong>Sack<strong>in</strong>gBig bagsLaboratorymaterialIndustrialprotectivecloth<strong>in</strong>gQuantification criteriaNumber <strong>of</strong> 50 kg sacks sold (A)Average price (B)Estimated bill<strong>in</strong>g = A x BNumber <strong>of</strong> 1,200 kg bags sold (A)Average price (B)Estimated bill<strong>in</strong>g = A x BAverage expenditure per tonne <strong>of</strong> sugarcane (A)<strong>Sugarcane</strong> production <strong>in</strong> tonnes (B)Estimated bill<strong>in</strong>g = A x BAverage expenditure per tonne <strong>of</strong> sugarcane (A)<strong>Sugarcane</strong> production <strong>in</strong> tonnes (B)Estimated bill<strong>in</strong>g = A x BAfter <strong>the</strong> plantation (mill revenues)SourcesAFIPOL (A)Interviews with mills and manufacturers<strong>of</strong> sacks (B)AFIPOL (A)Interviews with mills and manufacturers<strong>of</strong> bags (B)Research with mills (A)CONAB (B)Research with mills (A)CONAB (B)EthanolSugarElectricalenergyYeasts andadditivesCarbon creditsVolume <strong>of</strong> anhydrous ethanol sold domestically (A)Average price <strong>of</strong> anhydrous ethanol (B)Volume <strong>of</strong> hydrous ethanol sold domestically (C)Average price <strong>of</strong> hydrous ethanol (D)Volume <strong>of</strong> ethanol for non-energy uses (E)Average price <strong>of</strong> non-energy (F)Volume <strong>of</strong> anhydrous ethanol sold via <strong>the</strong> <strong>in</strong>formal market (G)Volume <strong>of</strong> hydrous ethanol sold via <strong>the</strong> <strong>in</strong>formal market (H)Revenue <strong>of</strong> ethanol exports (I)Estimated bill<strong>in</strong>g = (A x B) + (C x D) + (E x B) + (E x F) + (Gx B) + (H x D) + ISugar production <strong>in</strong> tonnes (A)Sugar exports <strong>in</strong> tonnes (B)Sugar exports – revenues (C)Volume <strong>of</strong> sugar sold by mills to <strong>in</strong>dustry, apportioned Center-South = 60%; Nor<strong>the</strong>ast = 25% (D)Volume <strong>of</strong> sugar sold by mills to wholesale, apportionedCenter-South = 12%, Nor<strong>the</strong>ast = 22% (E)Volume <strong>of</strong> sugar sold by mills to retail, apportioned Center-South = 28%, Nor<strong>the</strong>ast = 53% (F)Average price that mills sold to <strong>in</strong>dustry (G)Average price that mills sold to wholesale (H)Average price that mills sold to retail (I)Estimated bill<strong>in</strong>g = C + (D x G) + (E x H) + (F x I) weight<strong>in</strong>gvalues and volumes for Center-South and Nor<strong>the</strong>ast regionsMW sold (A)Average price <strong>of</strong> MWh <strong>in</strong> auctions (B)MW conversion <strong>in</strong> MWh (C)Estimated bill<strong>in</strong>g = A x B x CYeast revenues <strong>in</strong> domestic market (A)Yeast revenues <strong>in</strong> external market (B)Additive revenues <strong>in</strong> domestic market (C)Additive revenues <strong>in</strong> external market (D)Conversion <strong>of</strong> R$ <strong>in</strong>to US$ (E)Estimated bill<strong>in</strong>g = (A+C)/E)+B+DQuantity <strong>of</strong> tonnes <strong>of</strong> CO 2equivalent (A)Average price (B)Estimated bill<strong>in</strong>g = A x BANP from 1999 to 2007, EPE <strong>in</strong> 2008 (A)CEPEA-ESALQ and MAPA (B)MAPA (C)CEPEA-ESALQ and MAPA (D)EPE (E)Weighted average price us<strong>in</strong>g <strong>the</strong>proportions <strong>of</strong> anhydrous and hydratedvolumes for non-energy recorded <strong>in</strong> 2007 (F)Estimates from ANP, S<strong>in</strong>dicom andFecombustiveis (G, H)MDIC-SECEX, plus <strong>the</strong> proportions betweenanhydrous and hydrated ethanol, fromUNICA (I)UNICA, 2008/09 Harvest (A)MDIC-SECEX (B, C)A – B weighted by <strong>the</strong> % obta<strong>in</strong>ed <strong>in</strong><strong>in</strong>terviews with mills and Copersucar (D,E, F)CEPEA-ESALQ, MAPA (G)Interviews with wholesalers (H)CEPEA-ESALQ, MAPA, price <strong>of</strong> 50kg +R$15/sack (I)EPE and Valor Econômico (A)COGEN (B, C)ICC (A, B, C and D)United Nations Framework Conventionand ABDI (A)World Bank (B)
38 Ethanol and Bioelectricity <strong>Sugarcane</strong> <strong>in</strong> <strong>the</strong> <strong>Future</strong> <strong>of</strong> <strong>the</strong> <strong>Energy</strong> <strong>Matrix</strong>Annex 1Details <strong>of</strong> methodology and quantification calculationsStage <strong>of</strong> <strong>the</strong>supply cha<strong>in</strong>Quantification criteriaSourcesAfter <strong>the</strong> plantation (bill<strong>in</strong>gs <strong>in</strong> <strong>the</strong> distribution channels)EthanoldistributorsEthanol fill<strong>in</strong>gstationsSugar –wholesaleSugar – retailVolume <strong>of</strong> hydrous ethanol sold <strong>in</strong> domestic market (A)Weighted average price (B)Estimated bill<strong>in</strong>g = A x BVolume <strong>of</strong> hydrous ethanol sold <strong>in</strong> domestic market (A)Average price (B)Estimated bill<strong>in</strong>g = A x BVolume sold (A)Average price (B)Estimated bill<strong>in</strong>g = A x BVolume sold – wholesale and retail (A)Average price (B)Estimated bill<strong>in</strong>g = A x BFacilitatorsANP (A, B)ANP (A, B)Interviews with mills (A)Interviews with wholesalersInterviews with mills (A)DIEESE (B)OutsourcedCCT (cutt<strong>in</strong>g,load<strong>in</strong>g andtransportation)Freight<strong>Sugarcane</strong> production <strong>in</strong> tonnes (A)% <strong>of</strong> outsourced mechanized harvest (B)% <strong>of</strong> outsourced load<strong>in</strong>g (C)Percentage <strong>of</strong> outsourced haulage (D)Price <strong>of</strong> harvest service (E)Price <strong>of</strong> load<strong>in</strong>g service (F)Price <strong>of</strong> transportation service (G)Calculation <strong>of</strong> bill<strong>in</strong>g: A x B = W; A x C= Y; A x D=Z; W xE = V; C x F= L; Z x G= HTherefore: V + L + HValue <strong>of</strong> shipp<strong>in</strong>g R$ per tonne/Km (A)Volume exported (tonne) (B)Distance traveled (C)Estimated bill<strong>in</strong>g = A x B x CHighway tolls Ethanol logistics data R$/m (A)Volume <strong>of</strong> exported ethanol (B)Ethanol toll cost: A x B = YAverage amount spent on tolls, seven-axle trucks (C)Truck capacity (D)Exported volume (E)Calculation: E / D = Number <strong>of</strong> trips (Z)Estimated toll cost for sugar: Z x C = WEstimated toll cost: Y + WPort costsSugar:Amount spent on load<strong>in</strong>g: US$/tonne (A)Amount spent on shipp<strong>in</strong>g supervision: US$/tonne (B)Clearance cost: US$/shipment (C)Shipment value (Y) C / Y = (D)Volume exported via Santos (E)Estimated cost for sugar = (A + B + D) x ECONAB (A)Interviews with mills, Pecege (B, C, D)Logtrac, mills and IDEA (E, F, and G)Sifreca (A)MDIC/Secex (B)Markestrat research with freightcompanies (C)Copersucar and Sifreca (A)MDIC / Secex (B)Mills (C)Copersucar (A, B and C)MIDC / Secex (E and F)IETHA (S, G, H)Ethanol:Amount spent on load<strong>in</strong>g: US$/M 3 (S)Amount spent on shipp<strong>in</strong>g supervision: US$/M3 (G)Clearance cost: US$/order (H)Shipment value (Z)H / Z = (W)Volume exported via Santos: (F)Estimated cost for ethanol = (S + G + W) x F
The Sugar-<strong>Energy</strong> Map <strong>of</strong> Brazil39Details <strong>of</strong> methodology and quantification calculationsAnnex 1Stage <strong>of</strong> <strong>the</strong>supply cha<strong>in</strong>Health plansMealsBNDES(f<strong>in</strong>anc<strong>in</strong>g)EventsMagaz<strong>in</strong>esWage billTaxesQuantification criteriaMonthly number <strong>of</strong> workers <strong>in</strong> mills (A)Average health plan cost (B)Estimated bill<strong>in</strong>g = A x BMonthly number <strong>of</strong> workers <strong>in</strong> mills (A)Average spent on meals per month (B)Number <strong>of</strong> months/year (C)Estimated bill<strong>in</strong>g: A x B x CConsolidated f<strong>in</strong>anc<strong>in</strong>g data for <strong>the</strong> sugar-energy sector<strong>in</strong> 2008Costs for develop<strong>in</strong>g and organiz<strong>in</strong>g events <strong>in</strong> <strong>the</strong> sugarand ethanol <strong>in</strong>dustry:Fenasucro and Agrocana (A)Ethanol Summit (B)Fersucro Simpo and (C)Simtec (D)Canasul (E)Agrishow (F)Estimated bill<strong>in</strong>g = A + B + C + D + E + FInterviews with publishers and quantification <strong>of</strong> revenue.Jornal da Cana (A)IDEA News (B)Energia Mundo (C)Canavieiras (D)Canamix (E)Estimated bill<strong>in</strong>g = A + B + C + D + ENumber <strong>of</strong> workers <strong>in</strong> <strong>the</strong> sugar-energy agriculture sector (A)Number <strong>of</strong> workers <strong>in</strong> <strong>the</strong> sugar-energy sector - <strong>in</strong>dustry (B)Average wage <strong>in</strong> <strong>the</strong> agricultural sector (C)Average wage <strong>in</strong> <strong>the</strong> <strong>in</strong>dustrial sector (D)Estimated cost: (A x C) + (B x D)Gross revenue (A)IPI Value (B)ICMS (C)PIS (D)C<strong>of</strong><strong>in</strong>s (E)Agricultural <strong>in</strong>puts (F)Industrial equipment and <strong>in</strong>stallation (G)Sales tax Σ (A x B) + (A x C) + (A x D) + (A x E) = (I)Estimated total tax: T – F – GSourcesMTE (A)Unimed, São Francisco Clínicas and Sermed(B)MTE (A)Interviews with mills (B)BNDESFenasucro and Agrocana (A)Ethanol Summit (B)Fersucro and Simpo (C)Simtec (D)Canasul (E)Agrishow (F)Jornal da Cana (A)IDEA News (B)Energia Mundo (C)Canavieiras (D)Canamix (E)MTE (A, B, C and D)Reis Advogados Associados (C, D and E)M<strong>in</strong>istry <strong>of</strong> F<strong>in</strong>ance / Receita Federal (B)
4 0 Ethanol and Bioelectricity <strong>Sugarcane</strong> <strong>in</strong> <strong>the</strong> <strong>Future</strong> <strong>of</strong> <strong>the</strong> <strong>Energy</strong> <strong>Matrix</strong>6. Bibliography• ABDI – Agência Brasileira de Desenvolvimento Industrial. Estatísticas – Créditos de Carbono.Available at: • Abimaq – Associação Brasileira de Indústria de Máqu<strong>in</strong>as e Equipamentos . 2009.• Abiquim – Associação Brasileira da Indústria Química. Anuário da Indústria Química Brasileira – 2008. São Paulo,Abiquim.• Abiquim – Associação Brasileira da Indústria Química. Statistics. A Indústria Química Brasileira em 2008. Available at. Accessed June 2009.• Abracal – Associação Brasileira dos Produtores de Calcário Agrícola. Available at .• Aenda – Associação Brasileira dos Defensivos Genéricos. Syngenta está de olho na Dow.Available at . Accessed August 2009.• Afipol – Associação Brasileira dos Produtores de Fibras Poliolefínicas. . 2009.• Agrishow 2008 – Feira Internacional de Tecnologia Agrícola. Accessed 10 June 2009.• Agroanalysis – A Revista de Agronegócio da FGV. Consumo de Diesel por atividade de produção de cana, 2009.Consulted at: • Agri-Tillage do Brasil – Indústria e Comércio de Máqu<strong>in</strong>as e Implementos Agrícolas Ltda. 2009 Accessed 15 July 2009.• Alvarenga, R. P.; Queiroz, T. R. Caracterização dos Aspectos e Impactos Econômico, Sociais a Ambientais do SetorSucroalcooleiro Paulista. Unesp – Universidade Estadual Paulista, experimental campus at Tupã/Cepeagro. Oralpresentation, Tupã, SP.• Anda – Associação Nacional para Difusão de Adubos. Estatísticas. Pr<strong>in</strong>cipais Indicadores do Setor de Fertilizantes.Available at . Accessed June 2009.• Anfavea – Associação Nacional dos Fabricantes de Veículos Automotores. 2009.• Anfavea – Associação Nacional dos Fabricantes de Veículos Automotores. Anuário da Indústria AutomobilísticaBrasileira 2009 – Available at: . Accessed: 15/06/2009,16/06/2009 and 17/06/2009.• Anfavea – Associação Nacional dos Fabricantes de Veículos Automotores. Anuário da Indústria AutomobilísticaBrasileira 2009. Available at ; .Accessed Agosto 2009.• Anfir – Associação Nacional dos Fabricantes de Implementos Rodoviários. Unidades Comercializadas de ImplementosRodoviários, 2008. Accessed at: • ANP – Agência Nacional do Petróleo, Gás Natural e Biocombustíveis. Distribuição de Etanol no Brasil. Accessed at:• ASSOBRAV – Associação Brasileira de Distribuidores Volkswagen. Produção de cam<strong>in</strong>hões despenca. 25/05/2009.Available at . Accessed September 2009.• BNDES – Banco Nacional de Desenvolvimento Econômico e Social. , consulted 22 July 2009.• BNDES – Banco Nacional do Desenvolvimento Econômico e Social. BNDES Setorial. Fertilizantes: uma visão globals<strong>in</strong>tética. Available at . Accessed June 2009.• BNDES – Banco Nacional do Desenvolvimento Econômico e Social. Bioetanol de cana-de-açúcar: energia para odesenvolvimento sustentável / coord<strong>in</strong>ation BNDES and CGEE. 320 p. Rio de Janeiro, 2008.
The Sugar-<strong>Energy</strong> Map <strong>of</strong> Brazil41• Bouças, C. Exportação de máqu<strong>in</strong>as agrícolas perde fôlego e preocupa <strong>in</strong>dústria. Valor Economic newspaper,07/06/2005.• Bradesco Sector – Sugar & Etanol & <strong>Energy</strong>. Update. Equity Research – Brazil, July, 2009.• Caixeta Filho, J. V. Fretes de exportação para açúcar e etanol – Anuário Esalq-Log 2008. Piracicaba-SP, 77p.• Caixeta Filho, J. V. – Anuário do Sifreca – Sistema de Informação de Fretes. Available at http://sifreca.esalq.usp.br.Accessed 25 August 2009.• Canal Rural – Organização Internacional do Açúcar prevê produção menor do que o consumo, Agência Safras – CanalRural. Available at < http://www.clicrbs.com.br/canalrural/jsp/default.jsp?uf=2&local=18&action=noticias&id=2500505§ion=Capa>. Accessed September 2009.• Castro, L. T. Incentivos em canais de distribuição: Um estudo comparativo entre o Brasil e os EUA no setor dedefensivos agrícolas. 2008, São Paulo.• CCIBC – Câmara de Comércio e Indústria Brasil-Ch<strong>in</strong>a. Available at . Accessed August2009.• Ceise-BR – Centro Nacional das Indústrias do Setor Sucroalcooleiro e Energético. . 2009.• Cepea-Esalq – Centro de Estudos Avançados em Economia Aplicada. Preços Médios Etanol Hidratado e Anidro.Accessed at: • Christ<strong>of</strong>idis, D. – Água: Gênesis, Gênero e Sustentabilidade Alimentar no Brasil. 2006.• Cogen – Associação da Indústria de Cogeração de Energia. Average price <strong>of</strong> MW/h at auctions.Accessed at: • Conab – Companhia Nacional de Abastecimento. Os Fundamentos da Crise no Setor Sucroalcooleiro no Brasil (specialedition to advertise <strong>the</strong> Feira Internacional da Indústria Sucroalcooleira – Fenasucro), September 2009.• Consecana – Conselho dos Produtores de Cana-de-açúcar, Açúcar e Álcool do Estado de São Paulo. ATR Médio em2008 e Valor do ATR Médio. Accessed at: • Copersucar – Available at http://www.copersucar.com.br/hotsite/50anos/50anos.htm. Accessed June 2008.• CTC – Centro de Tecnologia Canavieira. 2009. Accessed 15 August 2009.• Daher E. – Uma Crise de Demanda, DBO Agrotecnologia – April/May 2008. Available at .Accessed June 2009.• Datrago – Boletim Informativo: Produção de Cana, Açúcar e Álcool – Brasil. Available: site Datrago, , consulted 9 July 2009.• Ded<strong>in</strong>i S/A – Indústria de Base. 2009.• Dieese – Departamento Inters<strong>in</strong>dical de Estatística e Estudos Socioeconômicos. Cesta Básica. Available at http://www.dieese.org.br/rel/rac/cesta.xml. Accessed July 2009.• DMB Máqu<strong>in</strong>as e Implementos Agrícolas Ltda. 2009. Access 15 July 2009.• EPE – Empresa de Pesquisa Energética. Megawatts sold <strong>in</strong> 2008 by Sugar and Ethanol plants. Accessed at: • Exame. São Paulo., consulted June 2007.• Fapesp – Fundação de Amparo à Pesquisa do Estado de São Paulo. 2009. Accessed August 2009.• Ferreira, C. R.; Vegro, C. L. R.; Oliveira, M. D. M. – Máqu<strong>in</strong>as agrícolas automotrizes: represamento dos negócios já fazparte do passado. Instituto de Economia Agrícola, 26/04/2007. Available at: Accessed 12 June 2009.• GEO Brasil. Recursos hídricos: resumo executivo. / M<strong>in</strong>istério do Meio Ambiente; Agência Nacional de Águas; UN
42 Ethanol and Bioelectricity <strong>Sugarcane</strong> <strong>in</strong> <strong>the</strong> <strong>Future</strong> <strong>of</strong> <strong>the</strong> <strong>Energy</strong> <strong>Matrix</strong>Environmental Program. Brasília: MMA; ANA, 2007.• Grupo Idea – Instituto de Desenvolvimento Agro<strong>in</strong>dustrial LTDA – Indicadores agrícolas para cultura da cana-de-açúcar,capítulo 3: Mecanização. Available at: Accessed 14 June and 1 July 2009.• Grupo Idea – Instituto de Desenvolvimento Agro<strong>in</strong>dustrial LTDA. Indicadores Agrícolas do Setor Sucroalcooleiro – Safra2005/2006.• Hansenclever. L. A. Uma Agenda de Competitividade para a Indústria Paulista – Indústria de Defensivos. São Paulo,February 2008. IPT – Instituto de Pesquisas Tecnológicas, São Paulo State.• Her<strong>in</strong>ger Fertilizantes. Mercado Brasileiro de Fertilizantes. Available at . AccessedJune 2009.• IBGE – Instituto Brasileiro de Geografia e Estatística. Pesquisa Industrial Anual (PIA) – Empresa – 2007.• ICC – Leveduras – Mercado de Leveduras no Brasil, 2009. Accessed at: .• IEA – Instituto de Economia Agrícola. Mercado de Máqu<strong>in</strong>as Agrícolas Automotrizes: Alta dos suprimentosestratégicos. Available at: Accessed 5 June 2009.• IEA – Instituto de Economia Agrícola. Mercado de Máqu<strong>in</strong>as Agrícolas Automotrizes: balanço de 2007 e expectativaspara 2008. Available at: . Accessed: 07/06/2009.• Ietha – International Ethanol Trade Association. Logística de Etanol no Brasil. Accessed at: • IFA – International Fertilizer Industry Association. Statistics. Fertilizer supply statistics. Available at . Accessed June 2009.• IFA – International Fertilizer Industry Association. World Agriculture and Fertilizer Demand, Global Fertilizer Supply andTrade 2008-2009. Sumary Executive. Available at . Accessed June 2009.• Informe Sifreca – Sistema de Informações de Fretes. Piracicaba – São Paulo, special edition <strong>in</strong> May 2008.• Instituto FNP – Agrianual 2009 – Anuário da Agricultura Brasileira; São Paulo - SP, pages 254 to 257. Accessed at• Mapa – M<strong>in</strong>istério da Agricultura, Pecuária e Abastecimento. Preços – Setor Sucroalcooleiro. Available at < http://www.agricultura.gov.br/portal/page?_pageid=33,971667&_dad=portal&_schema=PORTAL>• Mapa – M<strong>in</strong>istério da Agricultura, Pecuária e Abastecimento. 2009. Accessed 12 June 2009.• Mapa – M<strong>in</strong>istério da Agricultura, Pecuária e Abastecimento. Anuário Estatístico da Agroenergia, Brasília; Mapa/ACS,2009. 160 p. Available at Accessed 12 June 2009.• Marques, P. V. (Coord<strong>in</strong>ator.) Custo de Produção Agrícola e Industrial de açúcar e álcool no Brasil na safra 2007/2008.Piracicaba: Universidade de São Paulo, Escola Superior de Agricultura “Luiz de Queiroz”, Programa de EducaçãoCont<strong>in</strong>uada em Economia e Gestão de Empresas/ Departamento de Economia, Adm<strong>in</strong>istração e Sociologia. 2009, 194p. Report presented to <strong>the</strong> Confederação da Agricultura e Pecuária do Brasil – CNA.• MCT – M<strong>in</strong>istério da Ciência e Tecnologia. . 2009.• M<strong>in</strong>istério da Fazenda – Receita Federal. Tabela Tipi.• Moraes, M. A. F. D. – O mercado de trabalho da agro<strong>in</strong>dústria canavieira: desafios e oportunidades. Economiaaplicada, vol. 11, n. 4, Ribeirão Preto, SP – October/December 2007. Available at: . Accessed 26 August 2009.• MPOG – M<strong>in</strong>istério do Planejamento, Orçamento e Gestão. Lenha nova para velha fornalha: a febre dosagrocombustíveis, by Sergio Schles<strong>in</strong>ger – Rio de Janeiro: Fase, 2008. 108p.• MTE – M<strong>in</strong>istério do Trabalho e Emprego. Relação Anual de Informações Sociais,1999 a 2008. Available at:
The Sugar-<strong>Energy</strong> Map <strong>of</strong> Brazil43www.mte.gov.br/geral/estatisticas.asp?viewarea=rais> Accessed 27 August 2009.• Neves et al. Defensivos Agrícolas no Brasil: demanda e perspectivas nas pr<strong>in</strong>cipais culturas. Revista Agroanalysis.• Oica – Organisation Internationale des Constructeurs d’automobiles. Production Statistics: World Motor VehicleProduction by Country and Type 2007-2008. Available at .Accessed August 2009.• Procknor – Engenharia S/C Ltda. . 2009• Reis Advogados Associados – Tributos no Setor Sucroenergético, 2009. Bebedouro – SP.• RPA Consultoria – Dimensionamento de Frota de Implementos Agrícolas no setor Canavieiro. Ribeirão Preto – SP.Accessed at: • Santal – Mach<strong>in</strong>ery and equipment for <strong>the</strong> sugarcane sector. 2009.• Secex – Secretária de Comércio Exterior. MDIC – M<strong>in</strong>istério do Desenvolvimento, Indústria e Comércio. Available at.• Sermatec – Indústria e Montagens Ltda. .2009.• Sermag – Serrana Máqu<strong>in</strong>as e Equipamentos Ltda. 2009. Accessed 16 July 2009.• S<strong>in</strong>dag – S<strong>in</strong>dicato Nacional da Indústria de Produtos para Defesa Agrícola. Volume, Faturamento e Market<strong>in</strong>g Share.Available at: .• S<strong>in</strong>dipeças – S<strong>in</strong>dicato Nacional da Indústria de Componentes para Veículos Automotores. Desempenho do Setor deAutopeças / Brazilian Autoparts Industry Performance 2009. Available at: . Accessed 16 July 2009.• Smar – Equipamentos Indústriais Ltda..• Soares, L. H. B.; Alves, B. J. R.; Urquiaga, S.; Boddey, R. M. – Mitigação das Emissões de Gases de Efeito Estufa: Uso deEtanol da Cana-de-Açúcar produzido no Brasil. Especial Embrapa. São Paulo: Agroanalysis, April 2009.• The World Bank – International Prices <strong>of</strong> Carbon Credit. Accessed at: • Transporte Moderno. Anuário Maiores e Melhores do Setor de Logística. Year 21, November 2008. Available at . Accessed July 2009.• UNICA – União da Indústria de Cana-de-açúcar. Dados e Cotações. Available at .• US$A Report. Available at www.US$a.org.• Valor Econômico – Valor Onl<strong>in</strong>e. Curtas. Syngenta de olho. 03/03/2009. Available at . Accessed August 2009.• Valor Econômico – Valor Onl<strong>in</strong>e. Insumos. Venda de defensivos pode cair até 15%, diz Andef. Available at . Accessed June 2009.• Vieira, D. B.; Telles, D. D. – Panorama da Irrigação no Brasil: Evolução, Tendências, Novas legislações. Ingeniería delágua, vol. 8, nº 2, June 2001.• Yara International - Yara Fertilizer Industry Handbook, November 2008. Available at .Accessed June 2009.Explanatory noteiIn this case only, we used <strong>the</strong> average exchange rate for <strong>the</strong> US dollar between April 2008 and March 2009, equivalent to <strong>the</strong> 2008/09 harvestseason. The value used was US$1.00 = R$1.97.
4 4 Ethanol and Bioelectricity <strong>Sugarcane</strong> <strong>in</strong> <strong>the</strong> <strong>Future</strong> <strong>of</strong> <strong>the</strong> <strong>Energy</strong> <strong>Matrix</strong>02
Ethanol and Bioelectricity <strong>Sugarcane</strong> <strong>in</strong> <strong>the</strong> <strong>Future</strong> <strong>of</strong> <strong>the</strong> <strong>Energy</strong> <strong>Matrix</strong>45Social Externalities<strong>of</strong> FuelsMárcia Azanha Ferraz Dias de MoraesC<strong>in</strong>thia Cabral da CostaJoaquim José Mart<strong>in</strong>s GuilhotoLuiz Gustavo Antonio de SouzaFabíola Crist<strong>in</strong>a Ribeiro de Oliveira
46 Ethanol and Bioelectricity <strong>Sugarcane</strong> <strong>in</strong> <strong>the</strong> <strong>Future</strong> <strong>of</strong> <strong>the</strong> <strong>Energy</strong> <strong>Matrix</strong>This study pr<strong>of</strong>iles workers <strong>in</strong> <strong>the</strong> ethanol production cycle, look<strong>in</strong>g at <strong>the</strong>ir levels <strong>of</strong> educationand <strong>in</strong>come. It also evaluates <strong>the</strong> extent to which ethanol production impacts employment andwages throughout <strong>the</strong> countryside.We know that sugarcane plantation employees are <strong>in</strong> general not very well educated. Accord<strong>in</strong>gto 2007 data, <strong>the</strong>y have an average <strong>of</strong> 4.2 years <strong>of</strong> school<strong>in</strong>g. In <strong>the</strong> ethanol productionsector <strong>the</strong> average is higher: 7.7 years, and wages are commensurate with years <strong>of</strong> study. Onaverage, an employee <strong>in</strong> <strong>the</strong> ethanol <strong>in</strong>dustry earns 25.3% more than an employee <strong>in</strong> <strong>the</strong> sugarcane<strong>in</strong>dustry.These figures <strong>in</strong>dicate <strong>the</strong> need for a public and private effort to <strong>in</strong>crease <strong>the</strong> educational level <strong>of</strong>workers <strong>in</strong> <strong>the</strong> ethanol production cycle. However, <strong>the</strong>y also show that <strong>the</strong> sector is responsiblefor br<strong>in</strong>g<strong>in</strong>g a significant number <strong>of</strong> people <strong>in</strong>to <strong>the</strong> labor market – people who would o<strong>the</strong>rwisehave difficulty f<strong>in</strong>d<strong>in</strong>g employment <strong>in</strong> o<strong>the</strong>r sectors <strong>of</strong> <strong>the</strong> economy.The most effective way to evaluate <strong>the</strong> wages <strong>of</strong> sugarcane plantation workers is to compare<strong>the</strong>m to workers <strong>in</strong>volved <strong>in</strong> <strong>the</strong> production <strong>of</strong> o<strong>the</strong>r agricultural commodities. In this sense,wages for sugarcane workers only rank below wages for soybean production, which is highlymechanized and <strong>the</strong>refore demands a more qualified workforce. All o<strong>the</strong>r agricultural activitiespay less than sugarcane.
Social Externalities <strong>of</strong> Fuels47In addition to <strong>the</strong> <strong>in</strong>come level, sugarcane is socially important for its contribution to <strong>in</strong>come distribution,because <strong>the</strong> sector is spread around Brazil. This is ano<strong>the</strong>r factor that should be measured.No less than 1,042 municipalities produce sugarcane and/or ethanol; six times as many as<strong>the</strong> 176 municipalities where petroleum is produced and/or its derivatives are processed.There is also a huge difference <strong>in</strong> <strong>the</strong> number <strong>of</strong> employees. Accord<strong>in</strong>g to 2007 data from<strong>the</strong> Brazilian M<strong>in</strong>istry <strong>of</strong> Labor’s Annual Report <strong>of</strong> Social Information (RAIS), <strong>the</strong> sugarcane andethanol production sector employs 465,236 workers (exclud<strong>in</strong>g those <strong>in</strong>volved <strong>in</strong> sugar production).This is more than six times greater than <strong>the</strong> number <strong>of</strong> people <strong>in</strong>volved <strong>in</strong> <strong>the</strong> petroleumproduction sector.This study also <strong>of</strong>fers a projection that shows how <strong>in</strong>creased demand for ethanol (by substitut<strong>in</strong>g15% <strong>of</strong> gasol<strong>in</strong>e) would potentially generate 117,701 new jobs pay<strong>in</strong>g R$236 million a year.
4 8 Ethanol and Bioelectricity <strong>Sugarcane</strong> <strong>in</strong> <strong>the</strong> <strong>Future</strong> <strong>of</strong> <strong>the</strong> <strong>Energy</strong> <strong>Matrix</strong>1. IntroductionA country’s energy matrix is def<strong>in</strong>ed by <strong>the</strong> relationship between <strong>the</strong> economic pr<strong>of</strong>ile and <strong>the</strong> availability<strong>of</strong> energy resources. However, it is also important to analyze environmental and social aspects.The search for clean and renewable energy sources is a response to <strong>the</strong> emission <strong>of</strong> greenhouse gasescaused by <strong>the</strong> use <strong>of</strong> fossil fuels, which have a negative impact on <strong>the</strong> environment. One <strong>of</strong> <strong>the</strong> most importantsources <strong>of</strong> renewable energy is ethanol. Positive environmental externalities <strong>of</strong> <strong>the</strong> production and use<strong>of</strong> ethanol justify <strong>the</strong> adoption <strong>of</strong> public policy <strong>in</strong>centives. One fact that deserves special attention is thatethanol pollutes less than gasol<strong>in</strong>e <strong>in</strong> terms <strong>of</strong> carbon emissions – this implies an important contribution to<strong>the</strong> reduction <strong>of</strong> <strong>the</strong> greenhouse effect.Consider<strong>in</strong>g <strong>the</strong> <strong>the</strong>oretical aspects <strong>in</strong>volved, Moraes (2000) says that <strong>the</strong> positive externalities <strong>of</strong> ethanolproduction and consumption represent market flaws that justify government action via social regulation.He argues that prices established <strong>in</strong> a free market environment, without account<strong>in</strong>g for <strong>the</strong>se externalities,could be <strong>in</strong>sufficient to generate adequate returns on <strong>in</strong>vestment, so lead<strong>in</strong>g to a sub-optimal level <strong>of</strong>production.However, <strong>in</strong> addition to <strong>the</strong> environmental aspects, o<strong>the</strong>r benefits <strong>of</strong> ethanol production and use shouldbe analyzed. Among <strong>the</strong>se are: “<strong>the</strong> direct and <strong>in</strong>direct jobs created; <strong>the</strong> possibility <strong>of</strong> count<strong>in</strong>g on a fuelsupply that is an alternative to oil derivatives; (and) <strong>the</strong> positive contribution to <strong>the</strong> balance <strong>of</strong> trade due to<strong>the</strong> avoidance <strong>of</strong> petroleum and derivative imports,” accord<strong>in</strong>g to <strong>the</strong> study by Serodio et al. (1998, p.11).As for <strong>the</strong> social aspects, it is important to highlight job creation <strong>in</strong> <strong>the</strong> sugar and ethanol sector, not only <strong>in</strong><strong>the</strong> <strong>in</strong>dustrial sector (production <strong>of</strong> sugar and ethanol), but also <strong>in</strong> <strong>the</strong> agricultural sector. Us<strong>in</strong>g data from<strong>the</strong> National Household Sample Study (PNAD), Oliveira (2009) po<strong>in</strong>ts out that <strong>the</strong>re were 527,401 peopleemployed <strong>in</strong> sugarcane production <strong>in</strong> 2007, correspond<strong>in</strong>g to 19.9% <strong>of</strong> all jobs created <strong>in</strong> <strong>the</strong> Brazilianagricultural sector that year. H<strong>of</strong>fman and Oliveira (2008) found approximately 608,300 employees <strong>in</strong> sugarcaneproduction <strong>in</strong> 2006. Moraes (2008), us<strong>in</strong>g data from <strong>the</strong> Brazilian M<strong>in</strong>istry <strong>of</strong> Labor’s Annual Report<strong>of</strong> Social Information (RAIS), found that 1,283,258 formally employed workers were registered <strong>in</strong> 2008 <strong>in</strong><strong>the</strong> sugarcane, sugar and ethanol sectors, respectively 37.5%, 44.8%, and 17.7% <strong>of</strong> <strong>the</strong> total.Fur<strong>the</strong>rmore, because ethanol production is spread widely throughout several states and regions <strong>of</strong> Brazil,it creates important impacts on regional development. Unlike fossil fuels, which are produced <strong>in</strong> only a fewstates, sugar and ethanol production is present <strong>in</strong> a large number <strong>of</strong> Brazilian states and promotes development<strong>in</strong> rural towns.In addition to production, it is important to exam<strong>in</strong>e <strong>the</strong> multiplier effects <strong>of</strong> <strong>the</strong> various activities and <strong>the</strong>irsupply cha<strong>in</strong> <strong>in</strong> <strong>the</strong> economy. The direct and <strong>in</strong>direct multiplier effects extend throughout <strong>the</strong> economy,creat<strong>in</strong>g jobs and <strong>in</strong>come.
Social Externalities <strong>of</strong> Fuels49This study aims to analyze socio-economic <strong>in</strong>dicators for <strong>the</strong> sugarcane, ethanol, oil drill<strong>in</strong>g and oil derivativessectors with respect to job and <strong>in</strong>come creation, as well as regional development. Various <strong>in</strong>dicatorsare developed to analysis <strong>the</strong> social benefits <strong>of</strong> <strong>the</strong> different k<strong>in</strong>ds <strong>of</strong> fuels. Taken toge<strong>the</strong>r, <strong>the</strong>se can guidea comparison between sugarcane ethanol and fossil fuel production <strong>in</strong> <strong>the</strong> follow<strong>in</strong>g aspects:i Job creation: present<strong>in</strong>g <strong>the</strong> evolution <strong>of</strong> <strong>in</strong>dicators for <strong>the</strong> labor market, such as <strong>the</strong> number <strong>of</strong> workers,educational level, and age;ii Location <strong>of</strong> production: identify<strong>in</strong>g <strong>the</strong> ma<strong>in</strong> produc<strong>in</strong>g regions and correspond<strong>in</strong>g municipal districts <strong>in</strong>order to compare <strong>the</strong> capacity for creat<strong>in</strong>g jobs, <strong>in</strong>come and regional development;iii Estimat<strong>in</strong>g <strong>the</strong> importance <strong>of</strong> sugarcane and ethanol production <strong>in</strong> <strong>the</strong> produc<strong>in</strong>g regions, by calculat<strong>in</strong>g<strong>the</strong> location quotient;iv Measur<strong>in</strong>g and compar<strong>in</strong>g <strong>the</strong> impact <strong>of</strong> <strong>in</strong>creased demand for hydrous ethanol, substitut<strong>in</strong>g demandfor Type C gasol<strong>in</strong>e, on <strong>the</strong> level <strong>of</strong> jobs and total <strong>in</strong>come <strong>in</strong> <strong>the</strong> Brazilian economy.2. Methodology2.1 Information about <strong>the</strong> databasesData from <strong>the</strong> Brazilian M<strong>in</strong>istry <strong>of</strong> Labor’s Annual Report <strong>of</strong> Social Information (RAIS) and <strong>the</strong> NationalHousehold Sample Study (PNAD) conducted by <strong>the</strong> Brazilian Institute <strong>of</strong> Geography and Statistics (IBGE)were used to analyze <strong>the</strong> evolution <strong>of</strong> wages, qualification and number <strong>of</strong> people employed <strong>in</strong> sugarcaneplantations, ethanol production, and <strong>the</strong> extraction and production <strong>of</strong> fossil fuel.Accord<strong>in</strong>g to <strong>the</strong> National Classification <strong>of</strong> Economic Activities (CNAE) codes, <strong>the</strong> sectors analyzed <strong>in</strong> thisstudy are designated as “sugarcane”, “ethanol”, “petroleum extraction” and “petroleum derivatives”. Themaximum subdivision <strong>of</strong> activities <strong>in</strong> <strong>the</strong> databases does not permit separat<strong>in</strong>g out specific <strong>in</strong>formationfor ethanol made from sugarcane, nor for petroleum that is dest<strong>in</strong>ed solely for <strong>the</strong> production <strong>of</strong> gasol<strong>in</strong>e,nor even for <strong>the</strong> specific production <strong>of</strong> gasol<strong>in</strong>e. The data for ethanol also conta<strong>in</strong>s <strong>in</strong>formation about <strong>the</strong>production <strong>of</strong> ethanol from cereals, wood and o<strong>the</strong>r vegetable sources, <strong>of</strong> ethylic ethanol from manioc andethanol dest<strong>in</strong>ed for domestic use. Data for petroleum production <strong>in</strong>cludes natural gas and bitum<strong>in</strong>ousm<strong>in</strong>erals, among o<strong>the</strong>rs, while data for production <strong>of</strong> oil derivatives <strong>in</strong>cludes several products such as butane,naphtha gas, paraff<strong>in</strong> and kerosene, and also <strong>in</strong>cludes support activities for petroleum and naturalgas production i .The RAIS database ii is a census <strong>of</strong> <strong>the</strong> formal labor market based on <strong>in</strong>formation provided by companies,while <strong>in</strong>formation <strong>in</strong> <strong>the</strong> PNAD database iii is obta<strong>in</strong>ed through questionnaires adm<strong>in</strong>istered to a samplenumber <strong>of</strong> households. Although <strong>the</strong>se surveys are not comparable due to <strong>the</strong> diverg<strong>in</strong>g methods <strong>of</strong> datacollection used, each one <strong>of</strong>fers its own analytical advantages: <strong>the</strong> PNAD captures <strong>the</strong> <strong>in</strong>formal job market,while <strong>the</strong> RAIS detects <strong>the</strong> level <strong>of</strong> geographic dissociation <strong>of</strong> <strong>the</strong> <strong>in</strong>formation, because it allows for analysisby municipality. Therefore, <strong>in</strong> order to analyze <strong>the</strong> social benefits l<strong>in</strong>ked to <strong>the</strong> use <strong>of</strong> different types <strong>of</strong>
50 Ethanol and Bioelectricity <strong>Sugarcane</strong> <strong>in</strong> <strong>the</strong> <strong>Future</strong> <strong>of</strong> <strong>the</strong> <strong>Energy</strong> <strong>Matrix</strong>fuels, ei<strong>the</strong>r dur<strong>in</strong>g <strong>the</strong> production <strong>of</strong> raw materials, or dur<strong>in</strong>g <strong>in</strong>dustrial processes, we use both data fromPNAD (state level) and RAIS (municipal level).The state and regional analysis based on <strong>the</strong> PNAD, especially regard<strong>in</strong>g agricultural activities, demonstratescerta<strong>in</strong> characteristics that should be taken <strong>in</strong>to consideration when <strong>in</strong>terpret<strong>in</strong>g <strong>the</strong> results, for example:i The IBGE (2006) considers to be a resident a person who may be temporarily absent from his/her place<strong>of</strong> dwell<strong>in</strong>g on <strong>the</strong> date <strong>of</strong> <strong>the</strong> <strong>in</strong>terview, for a period not greater than 12 months, by virtue <strong>of</strong> <strong>the</strong> nature<strong>of</strong> his work or <strong>in</strong> order to be closer to his workplace. This means that <strong>the</strong> member <strong>of</strong> a family liv<strong>in</strong>g <strong>in</strong> anystate <strong>in</strong> <strong>the</strong> Nor<strong>the</strong>ast region who is temporarily work<strong>in</strong>g <strong>in</strong> ano<strong>the</strong>r state, <strong>in</strong> agricultural activities that usethis type <strong>of</strong> migratory labor, will be counted <strong>in</strong> <strong>the</strong> Nor<strong>the</strong>ast state.ii Data for <strong>the</strong> North region <strong>in</strong>cludes <strong>the</strong> agricultural economically active population (EAP) from Tocant<strong>in</strong>sstate, but only urban residents <strong>in</strong> <strong>the</strong> states <strong>of</strong> Rondônia, Acre, Amazonas, Roraima, Pará and Amapá (<strong>the</strong>former North region).The data for <strong>the</strong> number <strong>of</strong> jobs <strong>of</strong>fered by <strong>the</strong> Input-Output <strong>Matrix</strong> (IOM) differs from o<strong>the</strong>r bases, suchas <strong>the</strong> PNAD and <strong>the</strong> RAIS, given that <strong>the</strong> data <strong>in</strong> <strong>the</strong> IOM is grouped by sector. This creates <strong>the</strong> need toestimate <strong>the</strong> jobs <strong>in</strong> <strong>the</strong> miss<strong>in</strong>g sectors. The great advantage <strong>of</strong> this database for <strong>the</strong> current analysis is thatit shows <strong>the</strong> impact <strong>of</strong> a demand shock on a specific sector; not only on <strong>the</strong> number <strong>of</strong> jobs and level <strong>of</strong><strong>in</strong>come <strong>in</strong> <strong>the</strong> sector, but also on <strong>the</strong> o<strong>the</strong>r sectors l<strong>in</strong>ked to it. This l<strong>in</strong>kage occurs both <strong>in</strong> sectors connectedto <strong>the</strong> supply cha<strong>in</strong> and <strong>in</strong> sectors where <strong>the</strong> demand comes from agents <strong>of</strong> <strong>the</strong> supply cha<strong>in</strong>. This gives usan important analytical tool for analyz<strong>in</strong>g <strong>the</strong> impacts on jobs and <strong>in</strong>come <strong>in</strong> <strong>the</strong> Brazilian economy.2.2 Earn<strong>in</strong>gs equationWe used <strong>in</strong>formation from <strong>the</strong> PNAD for 2002 through 2007 to analyze <strong>the</strong> evolution <strong>of</strong> wages, workerqualification and <strong>the</strong> number <strong>of</strong> people employed <strong>in</strong> <strong>the</strong> sugarcane, ethanol, petroleum production and petroleumderivatives production sectors. To allow for a comparison between <strong>in</strong>come <strong>in</strong> different years, <strong>the</strong>sewill all be expressed <strong>in</strong> Reais <strong>of</strong> March 2009, adjusted us<strong>in</strong>g <strong>the</strong> National Consumer Price Index (INCP) iv .The formula for earn<strong>in</strong>gs, with <strong>the</strong> expansion factor associated with each <strong>in</strong>dividual <strong>in</strong> <strong>the</strong> sample, is adjustedby <strong>the</strong> method <strong>of</strong> weighted least squares.In this analysis, we adopt as <strong>the</strong> dependent variable (Y) <strong>the</strong> natural logarithm <strong>of</strong> <strong>the</strong> pr<strong>in</strong>cipal <strong>in</strong>come <strong>of</strong>those employed. Under <strong>the</strong>se conditions, <strong>the</strong> general regression model used is:Y j= α + Σ β iX ij+ u jwhere α and β iare parameters and u jis a heteroscedastic random error represent<strong>in</strong>g <strong>the</strong> effect <strong>of</strong> all <strong>the</strong>variables that were not considered <strong>in</strong> <strong>the</strong> model, obey<strong>in</strong>g <strong>the</strong> usual statistic properties. The model will beestimated us<strong>in</strong>g data from PNAD 2007.
Social externalities <strong>of</strong> fuels51The follow<strong>in</strong>g explanatory variables are considered:a A b<strong>in</strong>ary variable for gender (S), that assumes <strong>the</strong> value <strong>of</strong> 1 for females and 0 for males.b The person’s age (I) measured <strong>in</strong> decades.c The squared variable age chart (I2), consider<strong>in</strong>g <strong>the</strong> fact that <strong>in</strong>come does not vary l<strong>in</strong>early with age.If <strong>the</strong> parameters for age and age squared are <strong>in</strong>dicated by θ1 and θ2, respectively, we should haveθ 1> 0 and θ 2< 0 and <strong>the</strong> expected value for Y (and <strong>of</strong> <strong>in</strong>come) will be greatest when <strong>the</strong> <strong>in</strong>dividual’s agecorresponds to – θ 1/(2 θ 2)d The educational level (E) <strong>of</strong> <strong>the</strong> <strong>in</strong>dividual, consider<strong>in</strong>g <strong>the</strong> relation between school<strong>in</strong>g and wages asa polygon function, to capture <strong>the</strong> <strong>in</strong>crease <strong>in</strong> rate <strong>of</strong> return <strong>of</strong> education above a certa<strong>in</strong> level. Hence, <strong>in</strong>models were <strong>the</strong> existence <strong>of</strong> a threshold effect is considered, <strong>in</strong> addition to <strong>the</strong> E, variable, <strong>the</strong> variableE=Z j(E j–δ) is <strong>in</strong>cluded, <strong>in</strong> which δ is <strong>the</strong> vertex abscissa, <strong>in</strong> o<strong>the</strong>r words, it is <strong>the</strong> education level <strong>in</strong> which<strong>the</strong> return rate becomes greater, and Z jis a b<strong>in</strong>ary variable such thatZ j=0 para E j≤ δ e Z =1 para E > δj je The logarithm for <strong>the</strong> number <strong>of</strong> hours worked per week. The coefficient <strong>of</strong> this variable will be <strong>the</strong> elasticity<strong>of</strong> <strong>in</strong>come <strong>in</strong> relation to <strong>the</strong> weekly work time.f A variable will be used to dist<strong>in</strong>guish formally registered employees (<strong>the</strong> base) and undocumented employees.g Two b<strong>in</strong>aries to dist<strong>in</strong>guish <strong>the</strong> person’s color (C): white (<strong>the</strong> base), black or mulatto, and yellow.h One b<strong>in</strong>ary to dist<strong>in</strong>guish <strong>the</strong> role <strong>of</strong> <strong>the</strong> <strong>in</strong>dividual <strong>in</strong> <strong>the</strong> family (F): reference person versus a base categorythat <strong>in</strong>cludes all <strong>the</strong> rema<strong>in</strong><strong>in</strong>g conditions (spouse, child, o<strong>the</strong>r relative, un<strong>of</strong>ficial member, pensioner,domestic employee, relative <strong>of</strong> domestic employee).i Five b<strong>in</strong>aries to dist<strong>in</strong>guish <strong>the</strong> regions (R): North, Nor<strong>the</strong>ast (base), South, Sou<strong>the</strong>ast not <strong>in</strong>clud<strong>in</strong>g SãoPaulo, Midwest and <strong>the</strong> state <strong>of</strong> São Paulo.j One b<strong>in</strong>ary variable to dist<strong>in</strong>guish household situation (D): urban (base) and rural.k B<strong>in</strong>aries will be <strong>in</strong>troduced to dist<strong>in</strong>guish <strong>the</strong> different sectors <strong>of</strong> activity (SA): sugarcane (base), ethanolproduction, oil production and petroleum derivatives production.2.3 Formula for <strong>the</strong> location quotient (QL)To analyze <strong>the</strong> relative importance <strong>of</strong> <strong>the</strong> sugar-ethanol and petrochemical sectors <strong>in</strong> <strong>the</strong> various produc<strong>in</strong>gregions, we propose us<strong>in</strong>g <strong>the</strong> location quotient (QL). This identifies <strong>the</strong> existence <strong>of</strong> specialization/agglomeration<strong>in</strong> <strong>the</strong> productive activity <strong>of</strong> <strong>the</strong> state or region. To this end we use 2000 and 2008 employmentdata from <strong>the</strong> RAIS referr<strong>in</strong>g to <strong>the</strong> number <strong>of</strong> jobs created and <strong>the</strong> number <strong>of</strong> establishments. The dataon jobs created is used to calculate <strong>the</strong> location quotients (QL). Information <strong>in</strong> <strong>the</strong> RAIS can be viewed bymunicipality, which permits an analysis <strong>of</strong> how <strong>the</strong> various activities are spread throughout <strong>the</strong> economy.
52 Ethanol and Bioelectricity <strong>Sugarcane</strong> <strong>in</strong> <strong>the</strong> <strong>Future</strong> <strong>of</strong> <strong>the</strong> <strong>Energy</strong> <strong>Matrix</strong>The formula proposed by <strong>the</strong> IEDI (2002) to calculate <strong>the</strong> location quotient is:E ijE j●QL ij=E● jE●●where: <strong>the</strong> location quotient <strong>of</strong> sector i <strong>in</strong> region jE ij= jobs <strong>in</strong> sector i <strong>in</strong> region jE j● = ΣE = jobs <strong>in</strong> sector i <strong>in</strong> all regionsijjE● j= ΣE ij= jobs <strong>in</strong> all sectors <strong>in</strong> region jiE●● = ΣΣE = jobs <strong>in</strong> all sectors <strong>in</strong> all regionsiji jUs<strong>in</strong>g <strong>the</strong> RAIS database it is possible to verify <strong>the</strong> level <strong>of</strong> specialization <strong>of</strong> <strong>the</strong> sectors disaggregated to <strong>the</strong>five-digit level <strong>in</strong> <strong>the</strong> municipalities analyzed. Accord<strong>in</strong>g to IEDI (2002), a QL ≥ 1 is <strong>in</strong>terpreted as specialization<strong>in</strong> <strong>the</strong> activity <strong>in</strong> <strong>the</strong> region <strong>in</strong> question. In this section, <strong>the</strong> Brazilian state to which <strong>the</strong> municipalitybelongs is considered as a region.The follow<strong>in</strong>g steps are taken to calculate <strong>the</strong> QL. First, we identify <strong>the</strong> states with <strong>the</strong> greatest levels <strong>of</strong> employment<strong>in</strong> <strong>the</strong> production <strong>of</strong> sugarcane, ethanol, petroleum and petroleum derivatives. For <strong>the</strong>se states,we identify <strong>the</strong> municipalities <strong>in</strong> which <strong>the</strong> relevant activities were present <strong>in</strong> 2008, and <strong>the</strong>n calculate <strong>the</strong>QL <strong>of</strong> each municipality to verify <strong>the</strong> existence <strong>of</strong> activity specialization. Next, <strong>the</strong> QLs are distributed <strong>in</strong>tobands to identify <strong>the</strong> existence <strong>of</strong> specialization.The location quotient has a lower limit equal to zero when <strong>the</strong>re is no activity <strong>in</strong> <strong>the</strong> analyzed region. When <strong>the</strong>activity is present but <strong>the</strong>re is no specialization <strong>the</strong> QL value lies between zero and one; if <strong>the</strong>re is any specialization<strong>the</strong> number is greater than one. However, when a QL is greater than one, <strong>the</strong>n <strong>the</strong> larger <strong>the</strong> absolute number,<strong>the</strong> greater <strong>the</strong> degree <strong>of</strong> specialization. This study <strong>the</strong>refore adopted directly comparable value ranges, sothat <strong>the</strong> <strong>in</strong>cluded municipalities have similar specialization levels. Values between one and five were consideredas low specialization; greater than five and less than 10, moderate specialization; with greater than 10 <strong>in</strong>dicat<strong>in</strong>ghigh levels <strong>of</strong> specialization. For <strong>the</strong> 15 municipalities <strong>in</strong> each state that generate most jobs <strong>in</strong> <strong>the</strong> sectorsunder study we show <strong>in</strong>dicators for <strong>the</strong> number <strong>of</strong> employees, QL and <strong>the</strong> average age <strong>of</strong> <strong>the</strong> workers.2.4 Impact on <strong>the</strong> Brazilian economy: analysis <strong>of</strong> <strong>the</strong> <strong>in</strong>put-output matrixThe <strong>in</strong>ter-relation between <strong>the</strong> sectors produc<strong>in</strong>g ethanol and Type C gasol<strong>in</strong>e and <strong>the</strong> rest <strong>of</strong> <strong>the</strong> Brazilianeconomy generates impacts on <strong>the</strong> labor market. The <strong>in</strong>put-output matrix analysis <strong>of</strong> <strong>the</strong> Brazilian economycan <strong>in</strong>dicate <strong>the</strong>se impacts through <strong>the</strong> multiplier effects <strong>of</strong> <strong>the</strong> activities.
Social Externalities <strong>of</strong> Fuels53This study required a greater level <strong>of</strong> detail <strong>of</strong> Brazilian economic sectors, highlight<strong>in</strong>g ethanol and gasol<strong>in</strong>e.Ethanol is one <strong>of</strong> <strong>the</strong> sectors used by <strong>the</strong> IBGE (“Ethanol” sector), but gasol<strong>in</strong>e is <strong>in</strong>cluded <strong>in</strong> <strong>the</strong> “Oil andcoke ref<strong>in</strong><strong>in</strong>g” sector. Given <strong>the</strong> heterogeneity <strong>of</strong> <strong>the</strong> products <strong>in</strong> this sector (<strong>in</strong> addition to gasol<strong>in</strong>e, <strong>the</strong>y<strong>in</strong>clude m<strong>in</strong>eral coal, non-metallic m<strong>in</strong>erals, liquefied petroleum gas, fuel oil, diesel oil and o<strong>the</strong>r products),it was necessary to s<strong>in</strong>gle out gasol<strong>in</strong>e for analysis.Also, <strong>in</strong> order to more precisely identify <strong>the</strong> impacts on <strong>the</strong> economy, Brazil was divided <strong>in</strong>to <strong>the</strong> State <strong>of</strong>São Paulo and <strong>the</strong> rema<strong>in</strong><strong>in</strong>g regions . The State <strong>of</strong> São Paulo was analyzed separately because it accountsfor approximately half <strong>of</strong> <strong>the</strong> country’s production <strong>of</strong> ethanol and is <strong>the</strong>refore <strong>the</strong> place where <strong>the</strong> greatestimpacts result<strong>in</strong>g from <strong>the</strong> substitution <strong>of</strong> fuel use are to be expected. An <strong>in</strong>ter-regional grid for 2004constructed by Guilhoto (2009) was used to analyze <strong>the</strong> data.The <strong>in</strong>itial simulation was conducted for <strong>the</strong> “Ethanol” sector, based on a scenario where gasol<strong>in</strong>e is substitutedby hydrous ethanol. The <strong>in</strong>crease <strong>in</strong> demand was calculated equivalent to <strong>in</strong>creases <strong>of</strong> 5%, 10% and15% <strong>in</strong> <strong>the</strong> volume <strong>of</strong> hydrous ethanol consumed <strong>in</strong> each Brazilian state. Us<strong>in</strong>g <strong>the</strong> ratio that establishes <strong>the</strong>efficiency (<strong>in</strong> km driven) between <strong>the</strong> consumption <strong>of</strong> hydrous ethanol and Type C gasol<strong>in</strong>e equal to 0.70(UNICA, 2009), we identified <strong>the</strong> equivalent volume <strong>of</strong> gasol<strong>in</strong>e saved (not consumed) due to <strong>the</strong> <strong>in</strong>crease<strong>in</strong> ethanol volume dur<strong>in</strong>g <strong>the</strong> first impact. In o<strong>the</strong>r words, multiply<strong>in</strong>g <strong>the</strong> ethanol volume <strong>in</strong> each state by<strong>the</strong> ethanol consumption coefficient <strong>in</strong> each state.When <strong>the</strong> impact is analyzed <strong>in</strong> terms <strong>of</strong> value ra<strong>the</strong>r than volume, <strong>the</strong> volume <strong>of</strong> both products was multipliedby <strong>the</strong>ir respective prices vii . Because <strong>the</strong> values be<strong>in</strong>g used are from 2004, when <strong>the</strong>se fuel priceswere subject to different taxes <strong>in</strong> each Brazilian state, <strong>the</strong> prices used were <strong>the</strong> ones for each product <strong>in</strong>each state, for 2004 viii .An alternative simulation was carried out to show <strong>the</strong> impact on jobs and <strong>in</strong>come <strong>of</strong> substitut<strong>in</strong>g gasol<strong>in</strong>efor ethanol – <strong>in</strong> o<strong>the</strong>r words, <strong>the</strong> impact <strong>of</strong> an <strong>in</strong>crease <strong>in</strong> demand for Type C gasol<strong>in</strong>e <strong>in</strong> detriment to hydrousethanol. This simulation looked at substitut<strong>in</strong>g 1% <strong>of</strong> ethanol with Type C gasol<strong>in</strong>e, which would be<strong>the</strong> highest substitution possible, given <strong>the</strong> demand for ethanol <strong>in</strong> <strong>the</strong> states.Us<strong>in</strong>g <strong>the</strong> <strong>in</strong>ter-regional <strong>in</strong>put-output matrix described above, we calculated <strong>the</strong> multipliers that evaluate<strong>the</strong> impact <strong>of</strong> a variation <strong>in</strong> f<strong>in</strong>al demand on <strong>the</strong> economic variables <strong>of</strong> <strong>in</strong>terest: <strong>the</strong> number <strong>of</strong> jobs createdand <strong>the</strong> value <strong>of</strong> <strong>in</strong>come. To obta<strong>in</strong> <strong>the</strong>se results, one must <strong>in</strong>itially calculate <strong>the</strong> multipliers for <strong>the</strong>production that is direct, <strong>in</strong>direct, or <strong>in</strong>duced by family consumption. The multipliers for direct and <strong>in</strong>directproduction determ<strong>in</strong>e how much <strong>the</strong> sectors be<strong>in</strong>g analyzed as well as <strong>the</strong> sectors <strong>in</strong>directly affected byit will have to produce <strong>in</strong> order to satisfy an additional unit <strong>of</strong> f<strong>in</strong>al demand. This multiplier considers familyconsumption to be exogenous. On <strong>the</strong> o<strong>the</strong>r hand <strong>the</strong> multiplier that recognizes <strong>the</strong> effect <strong>in</strong>duced byfamily consumption, also known as <strong>in</strong>come effect, takes <strong>in</strong>to consideration <strong>the</strong> <strong>in</strong>crease <strong>of</strong> consumption<strong>in</strong> <strong>the</strong> economy, due to <strong>the</strong> growth <strong>in</strong> family <strong>in</strong>comes caused by <strong>the</strong> direct and <strong>in</strong>direct effect mentionedearlier. Methodologically, this impact is identified by mak<strong>in</strong>g household consumption endogenous to <strong>the</strong><strong>in</strong>put-output matrix.
54 Ethanol and Bioelectricity <strong>Sugarcane</strong> <strong>in</strong> <strong>the</strong> <strong>Future</strong> <strong>of</strong> <strong>the</strong> <strong>Energy</strong> <strong>Matrix</strong>Us<strong>in</strong>g <strong>the</strong> described multipliers and <strong>the</strong> employment and <strong>in</strong>come coefficients <strong>in</strong> <strong>the</strong> economic sectors, onecan calculate <strong>the</strong> direct, <strong>in</strong>direct, and <strong>in</strong>duced (<strong>in</strong>come effect) impacts on employment and <strong>in</strong>come levels<strong>in</strong> <strong>the</strong> country result<strong>in</strong>g from <strong>the</strong> <strong>in</strong>crease <strong>in</strong> hydrous ethanol demand <strong>in</strong> place <strong>of</strong> Type C gasol<strong>in</strong>e. If <strong>the</strong> netresult is positive for <strong>the</strong> economy, <strong>the</strong>n <strong>the</strong> substitution <strong>of</strong> ethanol for gasol<strong>in</strong>e generates more jobs and agreater <strong>in</strong>crease <strong>in</strong> total <strong>in</strong>come than would occur without it.The next section describes <strong>the</strong> results, grouped accord<strong>in</strong>g to <strong>the</strong> database and methodologies used: analysis<strong>of</strong> <strong>the</strong> evolution <strong>of</strong> socio-economic <strong>in</strong>dicators and <strong>of</strong> <strong>the</strong> estimated earn<strong>in</strong>gs equation, us<strong>in</strong>g <strong>the</strong> PNAD;calculation <strong>of</strong> <strong>the</strong> location quotients and an analysis <strong>of</strong> how widespread jobs are distributed, us<strong>in</strong>g <strong>the</strong>RAIS; and f<strong>in</strong>ally, estimates <strong>of</strong> jobs and <strong>in</strong>come created consider<strong>in</strong>g <strong>the</strong> three scenarios analyzed for growth<strong>in</strong> ethanol demand substitut<strong>in</strong>g Type C gasol<strong>in</strong>e.3. Results3.1 Evolution <strong>of</strong> formal and <strong>in</strong>formal employment: PNAD dataTable 1 shows <strong>the</strong> growth <strong>in</strong> <strong>the</strong> number <strong>of</strong> people employed <strong>in</strong> <strong>the</strong> sugar-ethanol and petrochemicalsectors from 2002 to 2007, accord<strong>in</strong>g to PNAD data. It is noticeable that between <strong>the</strong> first and last years<strong>the</strong>re was significant expansion <strong>of</strong> employment <strong>in</strong> <strong>the</strong> ethanol <strong>in</strong>dustry (79.4%), followed by <strong>the</strong> petroleumderivatives <strong>in</strong>dustry (61.7%). Despite lower growth, <strong>the</strong> absolute level <strong>of</strong> employment <strong>in</strong> sugarcane plantationsrema<strong>in</strong>s very relevant: <strong>in</strong> 2007 this activity was responsible for almost 530,000 jobs.It should be noted, however, that to identify <strong>the</strong> effect <strong>of</strong> ethanol production on employment <strong>in</strong> <strong>the</strong> agriculturalsector it is necessary to consider what portion <strong>of</strong> sugarcane production is used to make sugar andwhat portion goes to make fuel ethanol. Us<strong>in</strong>g <strong>in</strong>formation from <strong>the</strong> Brazilian <strong>Sugarcane</strong> Industry Associa-Table 1Employees <strong>in</strong> <strong>the</strong> sugar, ethanol, and petrochemical sectorsSugar-ethanol sectorPetrochemical sectorYEARSUGARCANEPLANTATIONSPLANTATIONS→ ETHANOLETHANOL OIL PRODUCTION DERIVATIVESPRODUCTION2002 454,741 218,730 65,514 36,199 42,1322003 452,695 224,537 67,804 48,616 37,0052004 492,766 240,963 86,668 57,712 32,4002005 519,715 261,936 79,995 44,977 33,4832006 532,263 262,938 71,083 71,111 35,7292007 527,401 287,434 11,.513 58,535 60,548Change2002/0716.0% 31.4% 79.4% 61.7% 43.7%Source: Prepared by <strong>the</strong> authors from IBGE data (2002 – 2007).
Social Externalities <strong>of</strong> Fuels55tion (UNICA) on <strong>the</strong> sugar/ethanol production mix, column 2 <strong>of</strong> Table 1 shows <strong>the</strong> estimated agriculturallabor <strong>in</strong>directly employed <strong>in</strong> ethanol production. It is thus estimated that <strong>in</strong> 2007 almost 290,000 agriculturalsector jobs can be attributed to <strong>the</strong> production <strong>of</strong> ethanol. At <strong>the</strong> o<strong>the</strong>r end <strong>of</strong> <strong>the</strong> supply cha<strong>in</strong>, <strong>in</strong>2007 <strong>the</strong>re were an additional 120,000 jobs created <strong>in</strong> <strong>the</strong> <strong>in</strong>dustrial sector, mak<strong>in</strong>g a total <strong>of</strong> approximately405,000 jobs. In <strong>the</strong> same year, <strong>the</strong> total number <strong>of</strong> employees <strong>in</strong> <strong>the</strong> petrochemical sector, <strong>in</strong>clud<strong>in</strong>g petroleumand derivatives production, was 120,000 people.Table 2 shows <strong>the</strong> average age and educational level <strong>of</strong> employees <strong>in</strong> <strong>the</strong> sectors be<strong>in</strong>g studied. Between2002 and 2007, <strong>the</strong>re was an <strong>in</strong>crease <strong>in</strong> <strong>the</strong> average age <strong>of</strong> employees work<strong>in</strong>g for bus<strong>in</strong>esses where <strong>the</strong>ma<strong>in</strong> activity is sugarcane, compared with a decrease <strong>in</strong> <strong>the</strong> average age <strong>of</strong> employees <strong>in</strong> <strong>the</strong> o<strong>the</strong>r sectorsanalyzed.Generally speak<strong>in</strong>g, <strong>the</strong> average age <strong>of</strong> sugarcane agricultural employees is lower than <strong>in</strong> <strong>the</strong> <strong>in</strong>dustrialsectors. However, Oliveira (2009) shows that between 1992 and 2007 <strong>the</strong>re was an <strong>in</strong>crease <strong>in</strong> <strong>the</strong> averageage <strong>of</strong> employees <strong>in</strong> <strong>the</strong> Brazilian farm<strong>in</strong>g sector as a whole, and specifically <strong>in</strong> sugarcane agriculturalproduction. There are some <strong>in</strong>dications that this <strong>in</strong>crease <strong>of</strong> average worker age <strong>in</strong> <strong>the</strong> primary sector isrelated to <strong>the</strong> decrease <strong>in</strong> child labor ix .With respect to <strong>the</strong> educational pr<strong>of</strong>ile, <strong>the</strong>re is ample literature show<strong>in</strong>g that farm<strong>in</strong>g is one <strong>of</strong> <strong>the</strong> fewsectors <strong>of</strong> <strong>the</strong> economy that still employs workers with low educational levels, even employ<strong>in</strong>g illiteratepeople. Therefore, despite a 52% <strong>in</strong>crease <strong>in</strong> <strong>the</strong> average years <strong>of</strong> school<strong>in</strong>g <strong>of</strong> sugarcane plantation workersbetween 2002 and 2007, <strong>the</strong> general level <strong>of</strong> education rema<strong>in</strong>s low. In 2007, sugarcane workers had anaverage <strong>of</strong> 4.2 years <strong>of</strong> school<strong>in</strong>g, while <strong>the</strong> average for ethanol production workers was 7.7 years. Petroleumproduction work<strong>in</strong>gs had an average <strong>of</strong> 11.7 years <strong>of</strong> school<strong>in</strong>g, and petroleum derivatives productionworkers an average <strong>of</strong> 11.3 years.Comparison <strong>of</strong> educational levels Average age and years <strong>of</strong> school<strong>in</strong>gTable 2YearAverageAge<strong>Sugarcane</strong> Ethanol Oil production Derivatives productionAverageyears <strong>of</strong>school<strong>in</strong>gAverageAgeAverageyears <strong>of</strong>school<strong>in</strong>gAverageAgeAverageyears <strong>of</strong>school<strong>in</strong>gAverageAgeAverageyears <strong>of</strong>school<strong>in</strong>g2002 33.0 2.8 37.4 7.3 38.1 11.3 39.2 11.72003 33.5 2.8 35.6 7.3 40.0 12.2 39.6 11.42004 35.0 3.2 33.0 7.9 37.3 11.2 40.2 10.62005 33.4 3.5 34.6 8.3 37.8 11.4 36.0 12.52006 34.5 3.7 36.0 8.6 38.5 12.1 38.3 12.12007 33.9 4.2 35.8 7.7 37.7 11.7 36.5 11.3Change2002/072.9% 52.0% -4.2% 5.1% -1.0% 3.3% -6.8% -3.1%Source: Prepared by <strong>the</strong> authors from IBGE data (2002 – 2007).
56 Ethanol and Bioelectricity <strong>Sugarcane</strong> <strong>in</strong> <strong>the</strong> <strong>Future</strong> <strong>of</strong> <strong>the</strong> <strong>Energy</strong> <strong>Matrix</strong>With respect to wages <strong>in</strong> <strong>the</strong> activities be<strong>in</strong>g analyzed, we can see <strong>in</strong> Figure 1 that between 2002 and2007 <strong>the</strong>re was a decrease <strong>in</strong> <strong>the</strong> average <strong>in</strong>come <strong>of</strong> workers <strong>in</strong> <strong>the</strong> ethanol <strong>in</strong>dustry (-2.3%), petroleumproduction (-5.2%) and derivatives production (-10.3%), while <strong>the</strong> average <strong>in</strong>come <strong>of</strong> sugarcane plantationworkers showed <strong>in</strong>creas<strong>in</strong>g and ongo<strong>in</strong>g ga<strong>in</strong>s, up 48.0% dur<strong>in</strong>g this period.Oliveira (2009) states that readjustments to <strong>the</strong> m<strong>in</strong>imum wage impacted <strong>the</strong> earn<strong>in</strong>gs <strong>of</strong> farm workers. In<strong>the</strong> period 2001-2007 <strong>the</strong>re was a strong correlation between <strong>the</strong> m<strong>in</strong>imum wage and <strong>the</strong> average salary<strong>of</strong> employees <strong>in</strong> both cattle breed<strong>in</strong>g and arable farm<strong>in</strong>g. The author believes <strong>the</strong> national m<strong>in</strong>imum wageunderp<strong>in</strong>ned <strong>the</strong> behavior <strong>of</strong> bottom-rung wages <strong>in</strong> <strong>the</strong> agricultural sector.Despite <strong>the</strong> positive variation, <strong>the</strong> average <strong>in</strong>come <strong>of</strong> a sugarcane plantation employee is much lower than<strong>in</strong> <strong>the</strong> ethanol <strong>in</strong>dustry. However, <strong>the</strong> employee <strong>in</strong> <strong>the</strong> ethanol sector receives less than <strong>the</strong> employee <strong>in</strong> <strong>the</strong>petroleum production sector.It is well known that wages <strong>in</strong> Brazilian agricultural tend to be substantially lower than <strong>in</strong> <strong>the</strong> secondary(manufactur<strong>in</strong>g) and tertiary (services) sectors. Also, it is important to note that <strong>the</strong> petroleum and derivatives<strong>in</strong>dustries have wage levels that are amongst <strong>the</strong> highest <strong>in</strong> <strong>the</strong> Brazilian economy. Miranda (2001)observed that employees work<strong>in</strong>g <strong>in</strong> activities related to petroleum and derivatives production <strong>in</strong> <strong>the</strong> state<strong>of</strong> Rio de Janeiro had wage levels significantly above employees <strong>in</strong> o<strong>the</strong>r <strong>in</strong>dustrial sectors. Fur<strong>the</strong>rmore,when petroleum employees receive specialized tra<strong>in</strong><strong>in</strong>g to work <strong>of</strong>f-shore with specific equipment, <strong>the</strong>irwage levels <strong>in</strong>crease by at least 30% relative to o<strong>the</strong>rs <strong>in</strong> <strong>the</strong> sector. Depend<strong>in</strong>g on <strong>the</strong> market and given<strong>the</strong> risks and conditions <strong>in</strong>volved, <strong>the</strong> salary difference can reach 80%.Graph 1Comparison <strong>of</strong> monthly <strong>in</strong>come In R$, March 200943,532,521,510,502002 2003 2004 2005 2006 2007<strong>Sugarcane</strong> Ethanol Oil production Derivatives productionSource: Prepared by <strong>the</strong> authors from IBGE data (2002 – 2007)..
Social Externalities <strong>of</strong> Fuels57Earn<strong>in</strong>gs equationFor workers <strong>in</strong> sugarcane plantations, <strong>the</strong> ethanol <strong>in</strong>dustry, and petroleum and derivatives productionTable 3Variable2007Coefficient Difference (<strong>in</strong> %)Constant 3.7481Female -0.3101 -26.66AgeAge/10 0.1849(Age/10) 2 -0.0154(2)Level <strong>of</strong> educationLevel <strong>of</strong> education 10 years 0.1726 21.44 (1)Log (hours worked per week) 0.4755Color (base: white)Black or brown -0.0496 -4.84Yellow 0.5972 81.70 (2)Condition <strong>of</strong> <strong>the</strong> person <strong>in</strong> <strong>the</strong> family (base: head <strong>of</strong> family) 0.1131 11.97Rural dwell<strong>in</strong>g (base: urban dwell<strong>in</strong>g) -0.0771 -7.42Region (base: Nor<strong>the</strong>ast)North (3) 0.2437 27.60 (2)Sou<strong>the</strong>ast (exclud<strong>in</strong>g SP) 0.2010 22.26São Paulo 0.3932 48.17South 0.2043 22.66Center-West 0.1798 19.69Productive sector (base: sugarcane)Ethanol <strong>in</strong>dustry 0.2255 25.30Petroleum derivatives <strong>in</strong>dustry 0.5471 72.83Petroleum production <strong>in</strong>dustry 0.7429 110.19Informal workers (base: registered/formal workers) -0.4941 -38.99R 2 71.17F Test (4) 168.53N 1,317Source: Prepared by <strong>the</strong> authors from IBGE data (2007).(1)This is <strong>the</strong> percentage growth <strong>of</strong> earn<strong>in</strong>gs associated with one year <strong>of</strong> additional education, beyond 10 years, obta<strong>in</strong>ed as per this sample(2)calculation: 100[exp(0.0217+0.1726) -1]% = 21.44%. The coefficients are not statistically different from zero at a 5% significance level.(3) (4)Exclud<strong>in</strong>g rural areas <strong>of</strong> RO, AC, AM, RR, PA and AP states. The value <strong>of</strong> F is statistically significant at a 1% level.
58 Ethanol and Bioelectricity <strong>Sugarcane</strong> <strong>in</strong> <strong>the</strong> <strong>Future</strong> <strong>of</strong> <strong>the</strong> <strong>Energy</strong> <strong>Matrix</strong>The statistical technique <strong>of</strong> multiple regression makes it possible to determ<strong>in</strong>e if <strong>the</strong> differences <strong>in</strong> <strong>the</strong>process <strong>of</strong> establish<strong>in</strong>g <strong>the</strong> salary levels can be expla<strong>in</strong>ed by a set <strong>of</strong> personal characteristics (gender, age,educational level, color, be<strong>in</strong>g or not <strong>the</strong> head <strong>of</strong> <strong>the</strong> family, liv<strong>in</strong>g <strong>in</strong> a rural or urban situation) and jobcharacteristics (region, hours worked per week, and ma<strong>in</strong> area <strong>of</strong> activity).An equation was estimated <strong>in</strong> which <strong>the</strong> dependant variable is <strong>the</strong> logarithm <strong>of</strong> <strong>the</strong> job <strong>in</strong>come <strong>of</strong> each<strong>in</strong>dividual and <strong>the</strong> personal and job characteristics are explanatory variables. Table 3 shows <strong>the</strong> regressionequation coefficients adjusted with 2007 PNAD data for people employed <strong>in</strong> <strong>the</strong> four sectors be<strong>in</strong>ganalyzed xi . In <strong>the</strong> case <strong>of</strong> <strong>the</strong> b<strong>in</strong>ary variables, <strong>the</strong> figure shows <strong>the</strong> percentage difference xii between <strong>the</strong>expected <strong>in</strong>come <strong>of</strong> a given category and <strong>the</strong> expected <strong>in</strong>come <strong>of</strong> <strong>the</strong> base category, after discount<strong>in</strong>g <strong>the</strong>effects <strong>of</strong> <strong>the</strong> rema<strong>in</strong><strong>in</strong>g explanatory variables <strong>in</strong>cluded <strong>in</strong> <strong>the</strong> regression. In addition, it shows <strong>the</strong> values <strong>of</strong>F and <strong>the</strong> coefficient <strong>of</strong> determ<strong>in</strong>ation (R2). It should be noted that almost every coefficient is statisticallydifferent from zero at <strong>the</strong> 5% significance level xiii .Accord<strong>in</strong>g to <strong>the</strong> data <strong>in</strong> Graph 1, a person employed <strong>in</strong> petroleum production made, on average, five timesas much as a sugarcane plantation employee <strong>in</strong> 2007. The wages <strong>of</strong> employees <strong>in</strong> <strong>the</strong> petroleum derivativesand ethanol <strong>in</strong>dustries were, respectively, 4.5 and 2.1 times <strong>the</strong> average <strong>in</strong>come <strong>of</strong> sugarcane plantationworkers.However, us<strong>in</strong>g an estimated <strong>in</strong>come equation model shows that once <strong>the</strong> effects <strong>of</strong> all <strong>the</strong> o<strong>the</strong>r explanatoryvariables have been discounted; <strong>the</strong> ethanol <strong>in</strong>dustrial-sector worker tends to earn 25.3% more than<strong>the</strong> plantation worker l<strong>in</strong>ked to ethanol production. The petroleum production and derivatives workerstend to receive <strong>in</strong>comes respectively 72.8% and 110.2% higher than sugarcane field workers.Graph 2Average monthly earn<strong>in</strong>gs <strong>in</strong> <strong>the</strong> agriculture sector; selected crops(<strong>in</strong> R$ <strong>of</strong> August 2008)8007006005004003002001001992 1993 19959 1996 1997 1998 1999 2001 2002 2003 2004 2005 2006 2007Maniac Corn C<strong>of</strong>fee Rice <strong>Sugarcane</strong> SoybeansSource: Prepared by <strong>the</strong> authors from data <strong>in</strong> Oliveira (2007).
Social Externalities <strong>of</strong> Fuels59Income equation for agricultural workersTable 4VariableCoefficientAgriculture 2007% Diff.Constant 2.8703 -Female -0.1141 -10.78AgeAge/10 0.2143 -(Age/10) 2 -0.0242 -Level <strong>of</strong> educationLevel <strong>of</strong> education 9 years 0.0704 9.31 (1)Log (hours worked per week) 0.7245 -Color (base: white)Black or brown -0.0250 -2.47 (2)Yellow 0.1400 15.03 (2)Head <strong>of</strong> <strong>the</strong> family 0.0850 8.87Rural dwell<strong>in</strong>g -0.0044 -0.44 (2)Region (base: Nor<strong>the</strong>ast)North (3) 0.1876 20.63Sou<strong>the</strong>ast (exclud<strong>in</strong>g SP) 0.3350 39.80São Paulo 0.4314 53.94South 0.4011 49.34Center-West 0.4067 50.19Agricultural sector (Base: sugarcane)C<strong>of</strong>fee -0.1047 -9.94Manioc -0.2639 -23.20Corn -0.3688 -30.84Soybean 0.0023 0.23 (2)Rice -0.3577 -30.07O<strong>the</strong>r agricultural activities (4) -0.1332 -12.47Registered/formal workers -0.3795 -31.58Temporary workers -0.0923 -8.82Non-specialized workers -0.1504 -13.97R 2 57.54F Test (4) 266.53N 4.745Source: Oliveira (2009, p. 150), based on PNAD microdata for 2007.Note: The dependant variable is <strong>the</strong> logarithm <strong>of</strong> <strong>the</strong> <strong>in</strong>come <strong>of</strong> <strong>the</strong> pr<strong>in</strong>cipal occupation.(1)This is <strong>the</strong> percentage growth <strong>of</strong> <strong>in</strong>come associated with one additional year <strong>of</strong> education, after an <strong>in</strong>itial n<strong>in</strong>e years, calculated as follows:100[exp (0.0187+0.0704) – 1]% = 9.31%.(2)The coefficients are not statistically different from zero at a significance level <strong>of</strong> 5%.(3)Exclud<strong>in</strong>grural areas <strong>of</strong> RO, AC, AM, RR, PA and AP states.(4)O<strong>the</strong>r farm activities.(5)The values <strong>of</strong> F are statistically significant at a 1% level.
60 Ethanol and Bioelectricity <strong>Sugarcane</strong> <strong>in</strong> <strong>the</strong> <strong>Future</strong> <strong>of</strong> <strong>the</strong> <strong>Energy</strong> <strong>Matrix</strong>Table 5StatesImportance <strong>of</strong> sugarcane and ethanol for Brazilian statesJobEstablishment<strong>Sugarcane</strong>* Ethanol <strong>Sugarcane</strong> Ethanol2000 2008 2000 2008 2000 2008 2000 2008Rondônia - 122 - 244 - 5 - 5Acre - 0 - 125 - 1 - 1Amazonas - 544 - 0 2 2 - 0Roraima - 0 - 142 1 0 - 1Pará - 1 968 1,537 - 2 4 5Amapá - 0 - 0 - 2 - 0Tocant<strong>in</strong>s 641 22 41 18 5 8 3 4Maranhão 1,494 4,459 1,791 3,404 7 16 2 4Piauí 5 306 2,931 2,632 3 10 2 4Ceará 64 681 12 162 18 34 2 5Rio Grande do Norte 3,637 1,144 373 6,137 43 34 2 6Paraíba 7,558 11,199 4,811 10,505 153 194 14 9Pernambuco 9,147 10,851 2,433 7,507 679 636 20 14Alagoas 8,421 3,243 6,890 4,499 401 494 10 9Sergipe 1,368 4,921 2,569 1,874 29 60 2 4Bahia 350 4,606 2,911 438 26 70 6 8M<strong>in</strong>as Gerais 5,775 15,320 6,258 14,420 155 584 29 63Espírito Santo 3,064 6,896 844 3,354 28 90 7 5Rio de Janeiro 1,507 1,965 720 1,463 187 245 3 16São Paulo 85,516 136,345 15,512 65,983 5,794 16,172 210 185Paraná 18,345 19,429 7,497 27,338 138 356 29 41Santa Catar<strong>in</strong>a - 9 1 2 - 6 3 4Rio Grande do Sul 109 6 15 20 6 6 5 17Mato Grosso do Sul 7,324 20,114 3,307 14,281 38 113 11 57Mato Grosso 8,640 8,284 4,900 8,834 71 260 18 27Goiás 8,233 17,840 3,354 51,555 122 355 22 87Federal District 161 27 - 39 2 7 3 3Total 171,359 268,334 68,138 226,513 7,908 19,762 407 584Source: Prepared by <strong>the</strong> authors from RAIS data for 2000 and 2008.* To estimate <strong>the</strong> number <strong>of</strong> sugarcane plantation workers that can be attributed to ethanol production <strong>in</strong> each state we used <strong>the</strong> proportionalproduction mix (UNICA, 2002/03 and 2007/08)
Social Externalities <strong>of</strong> Fuels61We can thus see that workers <strong>in</strong> <strong>the</strong> sugarcane plantation and ethanol <strong>in</strong>dustrial sectors earn less than <strong>the</strong>employees work<strong>in</strong>g for <strong>the</strong> petroleum and derivatives production sectors. However, <strong>the</strong> sugarcane and ethanolsectors employ a much larger number <strong>of</strong> workers.Wages <strong>in</strong> <strong>the</strong> sugarcane sector are lower than those <strong>in</strong> <strong>in</strong>dustrial activities, but higher than wages <strong>in</strong> o<strong>the</strong>ragricultural activities. When analyz<strong>in</strong>g <strong>the</strong> trend <strong>of</strong> wages for sugarcane, soybeans, c<strong>of</strong>fee, corn, manioc andrice farm workers between 1992 and 2007, Oliveira (2009) observed a tendency for growth <strong>of</strong> average farmworker <strong>in</strong>comes <strong>in</strong> all <strong>of</strong> <strong>the</strong> crops, with sugarcane workers’ wages higher than all o<strong>the</strong>rs except soybeans, asshown <strong>in</strong> Graph 2.Adjust<strong>in</strong>g an equation for all Brazilian agricultural fieldworkers , based on PNAD 2007 data, Oliveira (2009) alsonotes <strong>the</strong> relatively favorable position <strong>of</strong> <strong>the</strong> wages paid to sugarcane fieldworkers. After tak<strong>in</strong>g <strong>in</strong>to account<strong>the</strong> effects <strong>of</strong> o<strong>the</strong>r variables <strong>in</strong> <strong>the</strong> model, <strong>the</strong> <strong>in</strong>come differential for o<strong>the</strong>r farm workers <strong>in</strong> comparison tosugarcane fieldworkers is: -9.9% for c<strong>of</strong>fee, -23.2% for manioc, -30.1% for corn, -0.2% for soy, -30.1% for riceand -12.5% <strong>in</strong> o<strong>the</strong>r agricultural activities, as shown <strong>in</strong> Table 4.As previously noted, <strong>the</strong> maximum level <strong>of</strong> geographical disaggregation possible with PNAD data is at <strong>the</strong>state level. This precludes any analysis <strong>of</strong> social and economic <strong>in</strong>dicators by municipality. For this reason RAISdata was used to analyze how production spreads through <strong>the</strong> municipalities, as well as for calculation <strong>of</strong> <strong>the</strong>location quotient.3.2 Characteristics <strong>of</strong> <strong>the</strong> formal market: RAIS dataThe number <strong>of</strong> jobs and bus<strong>in</strong>ess establishments <strong>in</strong> each state for <strong>the</strong> analyzed sectors (sugarcane, ethanol,petroleum and petroleum derivatives) is shown based on RAIS data.Table 5 shows <strong>the</strong> data for <strong>the</strong> first two sectors. Accord<strong>in</strong>g to RAIS data, <strong>the</strong> sugarcane sector employed481,662 formally-contracted workers <strong>in</strong> 2008. Consider<strong>in</strong>g that part <strong>of</strong> <strong>the</strong> sugarcane crop is dest<strong>in</strong>ed forsugar production and part for ethanol, <strong>the</strong> total number <strong>of</strong> workers was allocated <strong>in</strong> proportion to <strong>the</strong>product mix <strong>of</strong> sugar and ethanol <strong>in</strong> <strong>the</strong> 2007/08 harvest. In this way it is estimated that <strong>in</strong> 2008 <strong>the</strong>re were268,334 fieldworkers produc<strong>in</strong>g sugarcane specifically for ethanol production. Of this total, 50.8% were <strong>in</strong>São Paulo, which is <strong>the</strong> ma<strong>in</strong> produc<strong>in</strong>g state. O<strong>the</strong>r states with a significant number <strong>of</strong> sugarcane workersare: Pernambuco (4.0%), Mato Grosso do Sul (7.5%), M<strong>in</strong>as Gerais (5.7%), Paraná (7.2%), Goiás (6.6%), Paraiba(4.2%), Mato Grosso (3.1%), and Alagoas (1.2%). Workers <strong>in</strong> this category are to be found <strong>in</strong> 24 Brazilianstates (<strong>in</strong>clud<strong>in</strong>g <strong>the</strong> federal district), <strong>the</strong> exceptions be<strong>in</strong>g Acre, Roraima and Amapá.We can see from Table 5 that between 2000 and 2008 <strong>the</strong> number <strong>of</strong> formal jobs <strong>in</strong> <strong>the</strong> sugarcane sectorgrew by 56.59%, while <strong>the</strong> number <strong>of</strong> bus<strong>in</strong>ess establishments employ<strong>in</strong>g such workers grew by 149.9%(from 7,908 <strong>in</strong> 2000 to 19,762 <strong>in</strong> 2008).
62 Ethanol and Bioelectricity <strong>Sugarcane</strong> <strong>in</strong> <strong>the</strong> <strong>Future</strong> <strong>of</strong> <strong>the</strong> <strong>Energy</strong> <strong>Matrix</strong>The ethanol production sector is also heavily reliant on labor. In 2008, <strong>the</strong> sector employed 226,513 peopleand was present <strong>in</strong> 25 states (<strong>in</strong>clud<strong>in</strong>g <strong>the</strong> federal district), <strong>the</strong> exceptions be<strong>in</strong>g Amazonas and Amapá.The states creat<strong>in</strong>g most jobs <strong>in</strong> <strong>the</strong> sector <strong>in</strong> 2008 were São Paulo (29.13%), Goiás (22.76%), Paraná(12.07%), M<strong>in</strong>as Gerais (6.37%), Mato Grosso do Sul (6.3%) and Paraíba (4.64%).Count<strong>in</strong>g both activities, sugarcane dest<strong>in</strong>ed for both sugar and ethanol production, <strong>the</strong> data shows that494,847 formal jobs were created <strong>in</strong> 2008, spread amongst 1,086 municipalities. Of <strong>the</strong>se 248 municipalitieswere <strong>in</strong>volved <strong>in</strong> ethanol production and 1,024 <strong>in</strong> sugarcane. There were 186 municipalities with bothactivities.The number <strong>of</strong> ethanol production establishments <strong>in</strong>creased between 2000 and 2008 by 43.49%, go<strong>in</strong>gfrom 407 to 584. In 2000, 51.6% <strong>of</strong> <strong>the</strong>se establishments were <strong>in</strong> São Paulo, a proportion that had fallento 31.68% by 2008, demonstrat<strong>in</strong>g some decentralization <strong>of</strong> <strong>the</strong> sector.Table 6 shows <strong>the</strong> number <strong>of</strong> workers and bus<strong>in</strong>esses <strong>in</strong>volved <strong>in</strong> petroleum and derivatives production, <strong>in</strong>2000 and 2008.It can be seen that petroleum production employed 69,100 people <strong>in</strong> 2008, up by 227.57% compared to2000, when <strong>the</strong> sector <strong>of</strong>fered 21,095 formal jobs. The jobs <strong>in</strong> <strong>the</strong> petroleum production are spread among22 states (<strong>in</strong>clud<strong>in</strong>g <strong>the</strong> federal district), led by Rio de Janeiro (61.97%), Bahia (12.07%), Rio Grande doNorte (7.9%) and Sergipe (5.07%). These four states concentrated 87.01% <strong>of</strong> <strong>the</strong> sector jobs <strong>in</strong> 2008.Petroleum production was split between 411 bus<strong>in</strong>ess establishments <strong>in</strong> 2000, <strong>in</strong>creas<strong>in</strong>g by 111.68% to870 <strong>in</strong> 2008.In comparison, <strong>the</strong> production <strong>of</strong> petroleum derivatives created 21,186 jobs <strong>in</strong> 2008, distributed among 24states (<strong>in</strong>clud<strong>in</strong>g <strong>the</strong> federal district). Lead<strong>in</strong>g states were São Paulo (30.89%), Rio de Janeiro (18.94%), Bahia(10.4%), Rio Grande do Sul (8.91%), Paraná (7.97%) and M<strong>in</strong>as Gerais (7.76%). Toge<strong>the</strong>r <strong>the</strong>se six statescreated 84.87% <strong>of</strong> all jobs <strong>in</strong> <strong>the</strong> sector <strong>in</strong> 2008. There were 84 bus<strong>in</strong>ess establishments <strong>in</strong> 2000, grow<strong>in</strong>gby 365.48% to 391 <strong>in</strong> 2008.Taken toge<strong>the</strong>r, <strong>the</strong>se two activities – petroleum production and petroleum derivatives production – created90,286 formally-contracted jobs <strong>in</strong> 2008.Compar<strong>in</strong>g total formal employment <strong>in</strong> <strong>the</strong> sugarcane and ethanol sectors (494,847 jobs) to <strong>the</strong> petroleumand derivatives production sectors (90,286 jobs), we can see that <strong>in</strong> 2008 sugarcane and ethanol productioncreated 5.5 times <strong>the</strong> number <strong>of</strong> jobs.
Social Externalities <strong>of</strong> Fuels63Distribution <strong>of</strong> jobs and bus<strong>in</strong>ess establishments <strong>in</strong> petroleum and derivatives productionTabea 6StatePetroleum productionEmploymentDerivativesproductionBus<strong>in</strong>ess establishmentsPetroleum productionDerivativesproduction2000 2008 2000 2008 2000 2008 2000 2008Rondônia - - - - - 4 - -Acre - - - - - 2 - -Amazonas 499 1,192 - 597 13 12 2 2Roraima - - - 1 - - - 1Pará 29 73 - 301 7 11 - 9Amapá - 39 - - - 2 - 1Tocant<strong>in</strong>s - - - 4 1 3 - 4Maranhão 215 26 - 165 10 5 - 10Piauí - 10 - 54 - 6 - 2Ceará 283 523 186 801 7 15 3 11Rio Grande doNorte1,636 5,458 811 131 18 92 3 5Paraíba 7 34 - 118 1 7 - 3Pernambuco 138 301 2 162 5 18 2 14Alagoas 44 707 - 5 5 9 - 1Sergipe 762 3,502 304 85 13 35 3 3Bahia 1,591 8,339 5,524 2,203 39 83 6 22M<strong>in</strong>as Gerais 650 189 55 1,643 21 35 5 77Espírito Santo 774 2,823 57 120 13 52 5 4Rio de Janeiro 12,911 42,820 592 4,012 159 328 11 33São Paulo 429 2,153 904 6,544 31 84 24 73Paraná 342 434 104 1,689 15 10 6 33Santa Catar<strong>in</strong>a 600 276 8 372 17 15 2 21Rio Grande do Sul 39 47 511 1,887 7 16 7 33Mato Grosso do Sul 4 16 - 42 4 7 2 7Mato Grosso 8 - - 19 3 1 - 8Goiás 134 51 2 139 14 15 2 11Federal District - 87 - 92 8 3 1 3Total 21,095 69,100 9,060 21,186 411 870 84 391Source: Prepared by <strong>the</strong> authors from RAIS data for 2000 and 2008..
6 4 Ethanol and Bioelectricity <strong>Sugarcane</strong> <strong>in</strong> <strong>the</strong> <strong>Future</strong> <strong>of</strong> <strong>the</strong> <strong>Energy</strong> <strong>Matrix</strong>Figure 3Distribution <strong>of</strong> formal employment <strong>in</strong> <strong>the</strong> production <strong>of</strong> sugarcane and ethanolFormal Jobs - 2007<strong>Sugarcane</strong>0 - 99100 - 249250 - 499500 - 9991,000 - 2,4992,500 - 4,9995,000 - 7,4997,500 - 9.99910,000 - 11,999Over 12,000EthanolSource: Prepared from RAIS data (2007).Figura 4Distribution <strong>of</strong> formal employment <strong>in</strong> petroleum and derivatives productionFormal Jobs - 2007PetroleumDerivatives0 - 99100 - 249250 - 499500 - 9991,000 - 2,4992,500 - 4,9995,000 - 7,4997,500 - 9,99910,000 - 11,999Over 12,000Source: Prepared from RAIS data (2007).
Social Externalities <strong>of</strong> Fuels65Petroleum and derivatives production activities are located <strong>in</strong> 196 municipalities (128 for petroleum productionand 107 for derivatives production, with both activities be<strong>in</strong>g found <strong>in</strong> 39 municipalities). We can see thatsugarcane and ethanol production activities are present <strong>in</strong> approximately six times more municipalities (1,086)than those hav<strong>in</strong>g activities related to petroleum and derivatives production. This highlights how sugarcaneand ethanol activities are much more widely spread. Figures 5 and 6 illustrate, respectively, <strong>the</strong> distribution <strong>of</strong>formal employment <strong>in</strong> sugarcane and ethanol production, and <strong>in</strong> oil and derivatives production, <strong>in</strong> 2007.The next section seeks to widen <strong>the</strong> discussion with respect <strong>the</strong> capacity <strong>of</strong> <strong>the</strong> four sectors to spread jobcreation.3.3 The spread <strong>of</strong> job creation and <strong>the</strong> location quotient3.3.1 <strong>Sugarcane</strong>São Paulo is <strong>the</strong> state with <strong>the</strong> greatest number <strong>of</strong> people employed <strong>in</strong> sugarcane production. In 2008, <strong>the</strong>sector accounted for 255,851 formal jobs <strong>in</strong> <strong>the</strong> state, <strong>of</strong> which 136,345 were attributable to sugarcane forethanol production . <strong>Sugarcane</strong> production is present <strong>in</strong> 410 (63.6%) <strong>of</strong> <strong>the</strong> 645 municipalities <strong>in</strong> <strong>the</strong> state. Toidentify <strong>the</strong> relative importance <strong>of</strong> jobs created by <strong>the</strong> sector <strong>in</strong> <strong>the</strong> municipalities, we estimated <strong>the</strong> locationquotient for <strong>the</strong> 410 relevant municipalities. These were <strong>the</strong>n grouped by QL range.In 2008, São Paulo had 220 districts where <strong>the</strong> QL was greater than one, <strong>in</strong>dicat<strong>in</strong>g that <strong>in</strong> 55.9% <strong>of</strong> <strong>the</strong>municipalities where <strong>the</strong> activity is to be found <strong>in</strong> <strong>the</strong> state, it constitutes a specialization. These 220 municipalitiesrepresent 35.5% <strong>of</strong> all municipalities <strong>in</strong> São Paulo. This shows that production and job creation arewidespread.Table 7 presents <strong>the</strong> ma<strong>in</strong> <strong>in</strong>dicators for <strong>the</strong> 15 municipalities with <strong>the</strong> greatest number <strong>of</strong> sugarcane jobs<strong>in</strong> <strong>the</strong> state <strong>of</strong> São Paulo. Or<strong>in</strong>diuva was <strong>the</strong> municipality with <strong>the</strong> highest job QL (63.858). The average age<strong>of</strong> sugarcane workers <strong>in</strong> Or<strong>in</strong>diuva was 31.5 years, and <strong>the</strong> municipality registered annual per capita GDP <strong>of</strong>R$15,622 <strong>in</strong> 2006.3.3.2 EthanolSão Paulo is <strong>the</strong> state with <strong>the</strong> greatest number <strong>of</strong> people employed <strong>in</strong> ethanol production. In 2008, thisactivity created 63,983 formally-contracted jobs <strong>in</strong> <strong>the</strong> state.Ethanol production is present <strong>in</strong> 80 (12.4%) <strong>of</strong> municipalities <strong>in</strong> <strong>the</strong> state. Table 8 shows <strong>the</strong>se municipalitiesdistributed by range <strong>of</strong> location quotient. In 2008, São Paulo had 61 municipalities with QL greaterthan one, <strong>in</strong>dicat<strong>in</strong>g productive specialization <strong>in</strong> 76.3% <strong>of</strong> <strong>the</strong> municipalities that have this activity, and <strong>in</strong>9.46% <strong>of</strong> all municipalities <strong>in</strong> <strong>the</strong> state.
66 Ethanol and Bioelectricity <strong>Sugarcane</strong> <strong>in</strong> <strong>the</strong> <strong>Future</strong> <strong>of</strong> <strong>the</strong> <strong>Energy</strong> <strong>Matrix</strong>Table 9 shows <strong>the</strong> ma<strong>in</strong> <strong>in</strong>dicators for <strong>the</strong> 15 lead<strong>in</strong>g São Paulo state municipalities <strong>in</strong> terms <strong>of</strong> employmentrelated to ethanol production. Sebastianópolis do Sul had <strong>the</strong> best job QL (223.876) among <strong>the</strong>se municipalities.The annual GDP per capita <strong>in</strong> Sebastianópolis do Sul was R$14,032 <strong>in</strong> 2006, and <strong>the</strong> average age <strong>of</strong>ethanol workers was 32.9 years.Just as <strong>in</strong> sugarcane production, ethanol production also has a widespread impact, creat<strong>in</strong>g jobs <strong>in</strong> 61 municipalities<strong>of</strong> São Paulo where <strong>the</strong> QL is greater than one.Table 7Indicators by municipality <strong>in</strong> São Paulo stateMunicipality Jobs* Job LQ GDP per capita Average AgeParaguaçu Paulista 10,228 37.980 10,000 33.8Pontal 9,585 38.938 15,374 32.2Lençóis Paulista 8,145 17.649 26,043 35.2Novo Horizonte 8,087 29.277 22,399 34.2Promissão 6,857 55.512 9,478 30.5Or<strong>in</strong>diuva 6,475 63.858 15,622 31.5Catiguá 5,465 60.427 12,510 34.1Miguelópolis 5,253 55.316 8,365 31.6Guaíra 5,172 36.788 14,136 34.5Clement<strong>in</strong>a 4,937 9.59815,520 32.0Santa Adélia 4,866 19.29015,871 33.1Boca<strong>in</strong>a 4,825 23.915 20,238 34.7Santa Cruz das Palmeiras 4,527 49.631 10,295 34.1Florida Paulista 4,138 47.123 11,699 34.9Pirassununga 3,907 39.686 9,701 31.0Total for <strong>the</strong> state <strong>of</strong> São Paulo 255,851 - - 34.0Source: Prepared by <strong>the</strong> authors us<strong>in</strong>g data from <strong>the</strong> RAIS (2008) and <strong>the</strong> IBGE (2006).* To estimate <strong>the</strong> number <strong>of</strong> sugarcane plantation workers that can be attributed to ethanol production <strong>in</strong> São Paulo state we used <strong>the</strong>proportional production mixTable 8 Municipalities <strong>in</strong> <strong>the</strong> state <strong>of</strong> São Paulo by band <strong>of</strong> location quotient, <strong>in</strong> 2008Location quotientNumber <strong>of</strong> municipalities0 < QL< 1 191 < QL < 5 135 < QL< 10 1010 < QL 36Total districts: ethanol 80Source: Prepared by <strong>the</strong> authors from RAIS data (2008).
Social Externalities <strong>of</strong> Fuels673.3.3 Petroleum productionThe state <strong>of</strong> Rio de Janeiro is <strong>the</strong> lead<strong>in</strong>g generator <strong>of</strong> employment <strong>in</strong> petroleum production, account<strong>in</strong>g for61.97% <strong>of</strong> jobs <strong>in</strong> <strong>the</strong> sector. In 2008, this activity accounted for 42,820 formally-contracted jobs <strong>in</strong> <strong>the</strong> state.Unlike ethanol production, which creates jobs <strong>in</strong> 80 municipalities <strong>in</strong> São Paulo, <strong>the</strong> lead<strong>in</strong>g producer state,petroleum production is present <strong>in</strong> just 14 municipalities <strong>in</strong> <strong>the</strong> state <strong>of</strong> Rio de Janeiro.Table 10 shows <strong>the</strong>se 14 municipalities distributed by band <strong>of</strong> location quotient. In 2008, <strong>the</strong> state <strong>of</strong> Riode Janeiro had just two municipalities, Macaé and Três Rios, where <strong>the</strong> QL was greater than one, so <strong>in</strong>dicat<strong>in</strong>gproductive specialization <strong>in</strong> 2.17% <strong>of</strong> state municipalities and <strong>in</strong> 14.3% <strong>of</strong> <strong>the</strong> municipalities where <strong>the</strong>activity is present.Table 11 presents <strong>the</strong> ma<strong>in</strong> <strong>in</strong>dicators for <strong>the</strong> 14 municipalities where <strong>the</strong>re is petroleum production <strong>in</strong> <strong>the</strong>state <strong>of</strong> Rio de Janeiro.Macaé had <strong>the</strong> highest job QL (20.609). In 2008, <strong>the</strong> average age <strong>of</strong> a petroleum production worker <strong>in</strong> <strong>the</strong>municipality was 38, and <strong>the</strong> annual GDP per capita was R$40,281.Indicators by municipal district <strong>in</strong> <strong>the</strong> state <strong>of</strong> São PauloTable 9Municipality Jobs Job LQ GDP per capita Average AgeTeodoro Sampaio 3,512 124.489 7,725.00 33.6Guairá 3,484 53.554 15,871.00 33.2Sebastianópolis do Sul 3,413 223.876 14,032.00 32.9São Paulo 3,219 0.133 25,675.00 31.7Iracemápolis 3,072 82.357 26,226.00 36.9Sud Mennucci 2,834 158.833 13,742.00 32.7Batatais 2,614 34.365 13,815.00 34.3Narandiba 2,498 196.497 10,719.00 32.1Parapuã 2,473 148.328 9,282.00 33.4Valparaíso 2,448 61.239 11,562.00 30.9Caiuá 2,377 205.741 10,561.00 32.8Bento de Abreu 2,334 110.145 27,044.00 31.5Tanabi 2,288 80.165 8,746.00 31.3Junqueirópolis 2,205 84.91 9,641.00 34.7Presidente Alves 2,177 213.997 14,357.00 35.2State <strong>of</strong> São Paulo 65,983 - - 33.2Source: Prepared by <strong>the</strong> authors us<strong>in</strong>g data from <strong>the</strong> RAIS (2008) and IBGE (2006).
68 Ethanol and Bioelectricity <strong>Sugarcane</strong> <strong>in</strong> <strong>the</strong> <strong>Future</strong> <strong>of</strong> <strong>the</strong> <strong>Energy</strong> <strong>Matrix</strong>Table 10 Municipalities <strong>in</strong> <strong>the</strong> state <strong>of</strong> Rio de Janeiro by band <strong>of</strong> location quotient, <strong>in</strong> 2008Location QuotientNumber <strong>of</strong> Municipalities0 < LQ< 1 121 < LQ < 5 15 < LQ < 10 -10 < LQ 1Total municipalities: petroleum production 14Source: Prepared by <strong>the</strong> authors from RAIS data (2008).Table 11Indicators by municipal district <strong>in</strong> <strong>the</strong> state <strong>of</strong> Rio de JaneiroMunicipality Jobs Job LQ GDP per capita Average AgeMacaé 25,319 20.609 40,281 38.0Rio de Janeiro 15,538 0.627 20,851 41.0Niterói 1,233 0.636 15,651 36.7Três Rios 303 1.257 11,660 36.6Duque de Caxias 156 0.088 26,392 46.0Rio das Ostras 136 0.704 117,532 31.1Angra dos Reis 69 0.167 24,250 47.3Campos dos Goytacazes 0.02 53,797 36.7Volta Redonda 20 0.027 23,269 35.8Saquarema 12 0.083 9,185 28.2Silva Jardim 5 0.134 6,022 23.8Rio das Flores 4 0.125 20,955 47.8Teresópolis 4 0.012 10,476 31.0Rio Bonito 1 0.003 13,532 49.0State <strong>of</strong> Rio de Janeiro 42,820 - - 39.0Source: Prepared by <strong>the</strong> authors us<strong>in</strong>g data from <strong>the</strong> RAIS (2008) and IBGE (2006).Table 12 Municipalities <strong>in</strong> <strong>the</strong> state <strong>of</strong> São Paulo by band <strong>of</strong> location quotient, <strong>in</strong> 2008Location QuotientNumber <strong>of</strong> Municipalities0 < LQ < 1 91 < LQ < 5 105 < LQ < 10 210 < LQ 7Total municipalities: petroleum derivatives production 28Source: Prepared by <strong>the</strong> authors from RAIS data (2008).
Social Externalities <strong>of</strong> Fuels69Some caveats are necessary when analyz<strong>in</strong>g <strong>the</strong> number <strong>of</strong> jobs and <strong>the</strong> presence <strong>of</strong> bus<strong>in</strong>ess establishments<strong>in</strong> <strong>the</strong> municipalities. The RAIS database reflects <strong>in</strong>formation provided by <strong>the</strong> company and attributesto each productive activity <strong>the</strong> company’s registered location, as per its CNPJ number <strong>in</strong> <strong>the</strong> year <strong>of</strong><strong>the</strong> declaration. This is considered <strong>in</strong> <strong>the</strong> RAIS as <strong>the</strong> bus<strong>in</strong>ess establishment. The company also provides<strong>in</strong>formation about where each employee works, which is not necessarily <strong>the</strong> same place as <strong>the</strong> location<strong>of</strong> <strong>the</strong> bus<strong>in</strong>ess establishment. The Rio de Janeiro municipality <strong>of</strong> Campos dos Goytacazes, for example, issignificant <strong>in</strong> terms <strong>of</strong> creat<strong>in</strong>g jobs associated with petroleum, but does not have a high number <strong>of</strong> employees,because many <strong>of</strong> <strong>the</strong> workers registered <strong>the</strong>re could be work<strong>in</strong>g <strong>in</strong> ano<strong>the</strong>r municipality xvi .3.3.4 Petroleum derivativesThe state <strong>of</strong> São Paulo creates <strong>the</strong> greatest number <strong>of</strong> jobs associated with <strong>the</strong> production <strong>of</strong> petroleum derivatives.This activity created 6,544 formal jobs <strong>in</strong> <strong>the</strong> state <strong>in</strong> 2008 but was present <strong>in</strong> just 28 municipalities.Table 12 shows municipalities distributed by band <strong>of</strong> location quotient. In 2008, São Paulo had 19 municipalitieswith QL greater than one, thus <strong>in</strong>dicat<strong>in</strong>g productive specialization <strong>in</strong> 67.9% <strong>of</strong> <strong>the</strong> municipalitieswhere this activity is present, but <strong>in</strong> just 2.95% <strong>of</strong> all municipalities <strong>in</strong> <strong>the</strong> state.Table 13 shows <strong>the</strong> ma<strong>in</strong> <strong>in</strong>dicators for <strong>the</strong> 15 largest job creators <strong>in</strong> <strong>the</strong> state <strong>of</strong> São Paulo.Paulínia, besides hav<strong>in</strong>g <strong>the</strong> largest number <strong>of</strong> jobs <strong>in</strong> <strong>the</strong> activity, had <strong>the</strong> highest job QL (76.159) amongst<strong>the</strong> districts. The average age <strong>of</strong> <strong>the</strong> worker was 37.5 years and <strong>the</strong> district had an annual GDP per capita<strong>of</strong> R$104,728.3.4. Impact <strong>of</strong> substitut<strong>in</strong>g Type C gasol<strong>in</strong>e with hydrous ethanol <strong>in</strong> BrazilTables 14 and 15 show <strong>the</strong> net effect on employment and total wages <strong>in</strong> <strong>the</strong> economy <strong>of</strong> <strong>the</strong> simulated <strong>in</strong>crease<strong>in</strong> hydrous ethanol consumption xvii , suppos<strong>in</strong>g a 15% <strong>in</strong>crease <strong>in</strong> ethanol demand and an equivalent reduction<strong>in</strong> <strong>the</strong> consumption <strong>of</strong> Type C gasol<strong>in</strong>e, as per <strong>the</strong> methodology described <strong>in</strong> Section 2 above. As <strong>the</strong> largestsugarcane, sugar and ethanol produc<strong>in</strong>g state <strong>the</strong> results for São Paulo are presented separately, with those forrema<strong>in</strong><strong>in</strong>g states aggregated.An <strong>in</strong>crease <strong>of</strong> 15% <strong>in</strong> hydrous ethanol demand <strong>in</strong> <strong>the</strong> North-Nor<strong>the</strong>ast region, substitut<strong>in</strong>g Type C gasol<strong>in</strong>econsumption, would produce a total employment <strong>in</strong>crease <strong>of</strong> 67,843 jobs, distributed 632 jobs <strong>in</strong> São Paulo and67,211 <strong>in</strong> <strong>the</strong> rest <strong>of</strong> Brazil. If <strong>the</strong> alteration were made <strong>in</strong> <strong>the</strong> Center-South region, <strong>the</strong>n an additional 2,718 jobswould be created <strong>in</strong> São Paulo and 27,957 <strong>in</strong> o<strong>the</strong>r states, for a total <strong>of</strong> 30,674. If <strong>the</strong> substitution took placejust <strong>in</strong> São Paulo, <strong>the</strong>n <strong>the</strong> state itself would see 13,536 additional jobs created, with a fur<strong>the</strong>r 5,647 <strong>in</strong> <strong>the</strong> rest<strong>of</strong> Brazil, mak<strong>in</strong>g a total <strong>of</strong> 19,184. F<strong>in</strong>ally, a 15% substitution <strong>in</strong> all states would potentially create 117,701 additionaljobs, distributed 16,886 <strong>in</strong> São Paulo and 100,815 <strong>in</strong> <strong>the</strong> rest <strong>of</strong> <strong>the</strong> country.
70 Ethanol and Bioelectricity <strong>Sugarcane</strong> <strong>in</strong> <strong>the</strong> <strong>Future</strong> <strong>of</strong> <strong>the</strong> <strong>Energy</strong> <strong>Matrix</strong>A similar analysis was conducted to estimate <strong>the</strong> impact on total wages aris<strong>in</strong>g from a 15% <strong>in</strong>crease <strong>in</strong> hydrousethanol consumption with a correspond<strong>in</strong>g decrease <strong>in</strong> Type C gasol<strong>in</strong>e consumption. Table 15 shows that sucha substitution <strong>in</strong> <strong>the</strong> North-Nor<strong>the</strong>ast region would <strong>in</strong>crease total monthly wages <strong>in</strong> Brazil by R$98.27 million,distributed R$1.2 million <strong>in</strong> São Paulo and R$97.08 million <strong>in</strong> <strong>the</strong> rest <strong>of</strong> Brazil. If <strong>the</strong> change were made <strong>in</strong> <strong>the</strong>Center-South region, <strong>the</strong> total monthly wage <strong>in</strong>crease would be R$92.01 million, distributed as shown <strong>in</strong> Table15). However, a 15% substitution <strong>in</strong> São Paulo would <strong>in</strong>crease total wages by R$45.63 million xviii . Tak<strong>in</strong>g <strong>the</strong>country as a whole, a 15% <strong>in</strong>crease <strong>in</strong> hydrous ethanol consumption with a correspond<strong>in</strong>g reduction <strong>in</strong> Type Cgasol<strong>in</strong>e demand would potentially <strong>in</strong>crease total monthly wages by R$235.91 million, distributed R$92.87 millionfor São Paulo and R$143.05 million for <strong>the</strong> rest <strong>of</strong> Brazil.Both scenarios (more jobs and higher wages) would be positive for <strong>the</strong> Brazilian economy.F<strong>in</strong>ally, to underscore <strong>the</strong> importance <strong>of</strong> hydrous ethanol <strong>in</strong> terms <strong>of</strong> its potential for <strong>in</strong>creas<strong>in</strong>g jobs and wages,as an exercise we simulated a 0.8% <strong>in</strong>crease <strong>in</strong> Type C gasol<strong>in</strong>e consumption, with a correspond<strong>in</strong>g reduction <strong>in</strong>hydrous ethanol consumption xix .Table 13Indicators by municipality <strong>in</strong> <strong>the</strong> state <strong>of</strong> São PauloMunicipalities Jobs Job LQ GDP per capita Average AgePaulínia 1,441 76.159 104,728 37.5Cubatão 1,423 67.191 46,146 40.6São José dos Campos 1,071 10.583 25,419 40.1Lençóis Paulista 831 70.4 26,043 37.8Mauá 711 22.732 12,325 38.8Itupeva 192 19.5 28,650 35.7Barueri 148 1.041 95,966 33.1São Paulo 89 0.037 25,675 34.3Piracicaba 76 1.221 18,650 37.2Pederneiras 71 10.214 15,748 31.9Presidente Prudente 66 2.18 13,527 40.4Ribeirão Preto 63 0.654 20,139 32.8P<strong>in</strong>damonhangaba 55 3.764 20,828 31.4Guarulhos 52 0.322 19,999 32.9Catanduva 52 2.776 14,613 34.9State <strong>of</strong> São Paulo 6,544 - - 38.3Source: Prepared by <strong>the</strong> authors us<strong>in</strong>g data from <strong>the</strong> RAIS (2008) and IBGE (2006).
Social Externalities <strong>of</strong> Fuels71The net result showed a negative impact with a reduction <strong>of</strong> 45,799 jobs and drop <strong>of</strong> R$120.2 million <strong>in</strong> totalmonthly wages.We can <strong>the</strong>refore see impacts <strong>of</strong> a similar magnitude between <strong>the</strong> 0.8% <strong>in</strong>crease <strong>in</strong> Type C gasol<strong>in</strong>e consumptionand <strong>the</strong> 10% <strong>in</strong>crease <strong>in</strong> hydrous ethanol consumption. However, <strong>in</strong> <strong>the</strong> latter case it is a positive impact, with<strong>the</strong> creation <strong>of</strong> 78,467 jobs and an <strong>in</strong>crease <strong>of</strong> R$157 million <strong>in</strong> monthly earn<strong>in</strong>gs. This comparison highlights<strong>the</strong> importance for job creation <strong>in</strong> Brazil <strong>of</strong> hydrous ethanol production relative to Type C gasol<strong>in</strong>e.4. F<strong>in</strong>al considerationsThis study presents a comparative analysis <strong>of</strong> social <strong>in</strong>dicators related to <strong>the</strong> production <strong>of</strong> sugarcane, ethanol,petroleum and petroleum derivatives.It was estimated that <strong>in</strong> 2008, 495,000 jobs were generated <strong>in</strong> two stages <strong>of</strong> <strong>the</strong> ethanol supply cha<strong>in</strong>: 268,000<strong>in</strong> sugarcane plantations, count<strong>in</strong>g just <strong>the</strong> proportion <strong>of</strong> sugarcane dest<strong>in</strong>ed for ethanol production; and226,000 jobs <strong>in</strong> <strong>the</strong> <strong>in</strong>dustrial sector. In <strong>the</strong> same year <strong>the</strong> petrochemicals sector, <strong>in</strong>clud<strong>in</strong>g production <strong>of</strong> petroleumand petroleum derivatives, generated approximately 90,000 jobs. This corresponds to 18.2% <strong>of</strong> <strong>the</strong> jobscreated by <strong>the</strong> ethanol and sugarcane sectors. Similarly, employment <strong>in</strong> <strong>the</strong>se sectors was more widespread,consequently impact<strong>in</strong>g creation <strong>of</strong> jobs and wealth <strong>in</strong> several states and municipalities <strong>in</strong> Brazil.Impact on jobs <strong>of</strong> <strong>in</strong>creas<strong>in</strong>g demand for hydrous ethanol (<strong>in</strong> R$ millions)Number <strong>of</strong> jobs created <strong>in</strong> 2004 by a 15% <strong>in</strong>crease <strong>in</strong> hydrous ethanol demand, with an equivalent reduction <strong>in</strong> Type Cgasol<strong>in</strong>e consumption, consider<strong>in</strong>g direct, <strong>in</strong>direct and <strong>in</strong>come effects.Table 14Increases <strong>in</strong> hydrous ethanol consumption 15%Impact/ Shock North-Nor<strong>the</strong>ast South-Central São Paulo BrazilRest <strong>of</strong> Brazil 67,211 27,957 5,647 100,815São Paulo 632 2,718 13,536 16,886Brazil 67,843 30,674 19,184 117,701Source: Research results.Impact on wages <strong>of</strong> <strong>in</strong>creas<strong>in</strong>g demand for hydrous ethanolIncrease <strong>in</strong> aggregate monthly wages <strong>in</strong> 2004 result<strong>in</strong>g from a 15% <strong>in</strong>crease <strong>in</strong> hydrous ethanol demand, with anequivalent reduction <strong>in</strong> Type C gasol<strong>in</strong>e consumption, consider<strong>in</strong>g direct, <strong>in</strong>direct and <strong>in</strong>come effects.Table 15Increases <strong>in</strong> hydrous ethanol consumption 15%Impact/ Shock North-Nor<strong>the</strong>ast South-Central São Paulo BrazilRest <strong>of</strong> Brazil 97.08 77.93 -31.96 143.05São Paulo 1.2 14.07 77.6 92.87Brazil 98.27 92.01 45.63 235.91Source: Research results.
72 Ethanol and Bioelectricity <strong>Sugarcane</strong> <strong>in</strong> <strong>the</strong> <strong>Future</strong> <strong>of</strong> <strong>the</strong> <strong>Energy</strong> <strong>Matrix</strong>Simulat<strong>in</strong>g a 15% <strong>in</strong>crease <strong>in</strong> <strong>the</strong> consumption <strong>of</strong> hydrous ethanol as a substitute for Type C gasol<strong>in</strong>e <strong>in</strong>dicatedstrong potential for creat<strong>in</strong>g employment and <strong>in</strong>come, with an <strong>in</strong>crease <strong>of</strong> 117,701 jobs and R$235.91million <strong>in</strong> monthly <strong>in</strong>come. On <strong>the</strong> o<strong>the</strong>r hand, an <strong>in</strong>crease <strong>in</strong> Type C gasol<strong>in</strong>e consumption <strong>in</strong> place <strong>of</strong>hydrous ethanol showed unfavorable results, reduc<strong>in</strong>g employment and aggregate wage value <strong>in</strong> <strong>the</strong> Brazilianeconomy. In this situation <strong>the</strong>re would be an estimated reduction <strong>of</strong> 46,000 jobs and R$120.2 million<strong>in</strong> monthly wages. These results show that public policies that encourage ethanol consumption can <strong>of</strong>fersignificant social and economic benefit.Despite this potential for job creation <strong>in</strong> <strong>the</strong> sugar-ethanol sector, it should be noted that several studiessuggest that <strong>in</strong> <strong>the</strong> next few years <strong>the</strong> sugarcane production sector will reduce its demand for agriculturalworkers because <strong>of</strong> <strong>in</strong>creas<strong>in</strong>g mechanization. At <strong>the</strong> same time <strong>the</strong> sector will demand better-qualifiedworkers. Two observations should be made <strong>in</strong> this respect. First, <strong>the</strong> decrease <strong>in</strong> employment over time, and<strong>the</strong> change <strong>in</strong> employee pr<strong>of</strong>ile, are consistent with <strong>the</strong> pattern <strong>of</strong> development seen <strong>in</strong> modern economies.Second, <strong>the</strong> decrease <strong>of</strong> direct employment <strong>in</strong> sugarcane harvest<strong>in</strong>g and <strong>the</strong> consequent decrease <strong>in</strong> totalsector payroll is a matter for concern because it will reduce <strong>the</strong> <strong>in</strong>direct employment that is created by sugarcane,ethanol and sugar production xx . However, if we consider <strong>the</strong> potential for job creation <strong>in</strong> a scenario<strong>of</strong> ethanol substitut<strong>in</strong>g gasol<strong>in</strong>e, <strong>the</strong> prospect would <strong>the</strong> creation <strong>of</strong> additional jobs.In terms <strong>of</strong> agricultural jobs, it is important to recognize that sugarcane employs a large number <strong>of</strong> poorlyeducatedworkers. Without this opportunity for participat<strong>in</strong>g <strong>in</strong> <strong>the</strong> labor market, it would be difficult toabsorb <strong>the</strong>se workers <strong>in</strong> o<strong>the</strong>r sectors.We would emphasize that policies to encourage ethanol production should be accompanied by a concernto address <strong>the</strong> problem <strong>of</strong> low education among sugarcane cutters. Given <strong>the</strong> growth <strong>of</strong> mechanized production,<strong>the</strong> need for more qualified workers is a predictable trend <strong>in</strong> sugarcane production for <strong>the</strong> com<strong>in</strong>gyears. Without public and private policies to help workers complete <strong>the</strong>ir formal school<strong>in</strong>g and undergotra<strong>in</strong><strong>in</strong>g or retra<strong>in</strong><strong>in</strong>g, many people will lose <strong>the</strong>ir jobs <strong>in</strong> <strong>the</strong> face <strong>of</strong> technological advance, and <strong>the</strong>y willnot be easily absorbed <strong>in</strong>to <strong>the</strong> o<strong>the</strong>r activities that will ga<strong>in</strong> <strong>in</strong> prom<strong>in</strong>ence dur<strong>in</strong>g this process.The average number <strong>of</strong> years <strong>of</strong> school<strong>in</strong>g <strong>of</strong> sugarcane employees compared to <strong>the</strong> ethanol and petroleumsectors also expla<strong>in</strong>s a relevant part <strong>of</strong> <strong>the</strong> wage disparity between <strong>the</strong> sectors. This has important implications,because it is believed that a policy to reduce educational disparity among workers <strong>of</strong> <strong>the</strong> agriculturaland <strong>in</strong>dustrial areas <strong>of</strong> <strong>the</strong> sugar-ethanol sector could – <strong>in</strong> addition to <strong>in</strong>creas<strong>in</strong>g productivity and wages–contribute to fight<strong>in</strong>g <strong>in</strong>come <strong>in</strong>equality and poverty existent with<strong>in</strong> <strong>the</strong>se sectors.Ano<strong>the</strong>r question that deserved attention was <strong>the</strong> degree to which sugarcane and ethanol production isgeographically widespread. Based on <strong>the</strong> location quotient (QL) methodology and data from <strong>the</strong> RAIS,it can be seen that productive activities <strong>in</strong> <strong>the</strong> sugar-ethanol sector are located <strong>in</strong> rural areas <strong>of</strong> states, <strong>in</strong>particular <strong>the</strong> state <strong>of</strong> São Paulo, spread<strong>in</strong>g out <strong>in</strong>to small municipalities. At <strong>the</strong> same time, <strong>the</strong> production<strong>of</strong> petroleum and derivatives is highly concentrated <strong>in</strong> a few Brazilian cities, mean<strong>in</strong>g that <strong>the</strong> sugar-ethanolsector ga<strong>in</strong>s prom<strong>in</strong>ence for its capacity to add dynamism to regional development. As a next step, studies
Social Externalities <strong>of</strong> Fuels73should be conducted to determ<strong>in</strong>e causal and functional relationships between <strong>the</strong> presence <strong>of</strong> sugarethanolor petrochemical sectors <strong>in</strong> a specific Brazilian municipality and its socio-economic <strong>in</strong>dicators, <strong>in</strong>order to understand <strong>the</strong> possible impacts on quality <strong>of</strong> life <strong>in</strong> such locations.F<strong>in</strong>ally, it is important that Brazil re<strong>in</strong>forces <strong>the</strong> participation <strong>of</strong> ethanol <strong>in</strong> <strong>the</strong> energy matrix, tak<strong>in</strong>g <strong>in</strong>toaccount <strong>the</strong> positive social externalities for <strong>the</strong> entire population. In addition to its clean and renewablenature, ethanol production has <strong>the</strong> capacity to employ a large number <strong>of</strong> people with differ<strong>in</strong>g educationalbackgrounds and levels <strong>of</strong> qualification. It also stimulates regional development dynamics, given its widespreadimportance throughout several Brazilian states and municipalities.
74 Ethanol and Bioelectricity <strong>Sugarcane</strong> <strong>in</strong> <strong>the</strong> <strong>Future</strong> <strong>of</strong> <strong>the</strong> <strong>Energy</strong> <strong>Matrix</strong>5. Bibliography• Basaldi, O.V. – O mercado de trabalho assalariado na agricultura brasileira e suas diferenciações regionais.São Paulo: Aderaldo and Rothschild / Ordem dos Economistas do Brasil, 2008. 291 pages.• Corsuil, C.H.; Foguel, M.N. – Uma sugestão de deflatores para rendas obtidas a partir de algumas pesquisasdomiciliares do IBGE. Rio de Janeiro: IPEA, July 2002. 13 pages. (IPEA. Text for Discussion, 897).• H<strong>of</strong>fmann, R. – Mensuração da desigualdade e da pobreza no Brasil. In: Henriques, R. Desigualdade e pobreza noBrasil. Rio de Janeiro: IPEA, 2000, pages 81-107.• H<strong>of</strong>fmann, R.; Oliveira, F.C.R. de. – Remuneração e características das pessoas ocupadas na agro<strong>in</strong>dústria canavieirano Brasil, de 2002 a 2006. In: Congresso da Sociedade Brasileira de Economia e Sociologia Rural, 46., 2008, RioBranco. Anais. Brasília: Sober, 2008. 19 pages.• Guilhoto, J. J. M.; Maistro, M.C.M.; Barros, A.L.M. de; Istake, M. – Emprego e mecanização na colheita dacana-de-açúcar: diferenças regionais. In: Congresso da Sociedade Brasileira de Economia e Sociologia Rural, 42,2004, Cuiabá. Anais. Brasília: Sober, 2004. 19 pages.• IEDI. Clusters ou sistemas locais de produção e <strong>in</strong>ovação: identificação, caracterização e medidas de apoio.São Paulo, 2002.• Instituto Brasileiro de Geografia e Estatística (IBGE). Pesquisa nacional por amostra por domicílios 2006.Rio de Janeiro, 2006. v. 27, pages 1-125.• Kassouf, A.L; Ferro, A.R. – O trabalho <strong>in</strong>fantil no ramo agrícola brasileiro. Brasília: OIT, 2004. 96 pages. (Series:Legado em transformação).• M<strong>in</strong>istério do Trabalho e Emprego (MTE). Registros adm<strong>in</strong>istrativos: RAIS and Caged. –– Brasília: MTE, SPPE/DES/CGET, 2000. 17 pages.• M<strong>in</strong>istério do Trabalho e Emprego (MTE). Manual de orientação da RAIS: Brasília: MTE, 2008. 50 pages.• Miranda, C. – Petróleo mais uma vez lidera o crescimento <strong>in</strong>dustrial. Boletim do Fórum de Estudos Flum<strong>in</strong>enses, Riode Janeiro, 2001, nº 10, July/October 2001. p. 6. . Acessed on: July11, 2009.• Moraes, M.A.F.D. – A desregulamentação do setor sucrolcooleiro do Brasil. Americana: Cam<strong>in</strong>ho Editorial, 2000.238 pages.• Moraes, M.A.F.D. – Indicadores do mercado de trabalho do sistema agro<strong>in</strong>dustrial da cana-de-açúcar do Brasil.Estudos Econômicos, São Paulo, v. 37, nº4, p. 875-902, October/December 2007.• Oliveira, F.C.R. – Ocupação, emprego e remuneração na cana-de-açúcar e em outras atividades agropecuáriasno Brasil, de 1992 a 2007. 2009, 167 pages. Master’s Degree Thesis <strong>in</strong> Applied Economis, Escola Superior deAgricultura “Luiz de Queiroz”, Universidade de São Paulo, Piracicaba, 2009.• Brazilian <strong>Sugarcane</strong> Industry Association (UNICA), data on sugar and ethanol production mix. São Paulo: 2009.
Social Externalities <strong>of</strong> Fuels75Explanatory NotesiTo extract RAIS data, <strong>the</strong> follow<strong>in</strong>g CNAE codes were used: sugarcane: 01130; petroleum production: 06000 and 09106; petroleumderivatives production: 19217 and 19225; and ethanol: 1935. For <strong>the</strong> PNAD, <strong>the</strong> follow<strong>in</strong>g codes were used: sugarcane: 01105; petroleumproduction: 11000; petroleum derivatives production: 23010; and ethanol: 23400.iiThe RAIS is an adm<strong>in</strong>istration registry set up under Decree 76.900/75, under <strong>the</strong> responsibility <strong>of</strong> <strong>the</strong> M<strong>in</strong>istry <strong>of</strong> Labor. It was created foroperational, control and statistical purposes. The declaration is annual and mandatory for all bus<strong>in</strong>ess establishments <strong>in</strong> Brazil, <strong>in</strong>dependent<strong>of</strong> hav<strong>in</strong>g employees or not. Coverage exceeds 97% <strong>of</strong> <strong>the</strong> formal economy (MTE, 2006).iiiThe PNAD is a system <strong>of</strong> annual household surveys conducted by <strong>the</strong> IBGE s<strong>in</strong>ce 1967. It <strong>in</strong>vestigates several socio-economic characteristics <strong>of</strong>families and people <strong>in</strong> all Brazilian states. Certa<strong>in</strong> variables such as general population characteristics, education, labor, <strong>in</strong>come and hous<strong>in</strong>gare <strong>in</strong>cluded every year, while o<strong>the</strong>rs like migration, fertility, marriage, nutrition and health have variable frequency (IBGE, 2006).ivBecause <strong>the</strong> PNAD registers monthly <strong>in</strong>comes for September and a significant part <strong>of</strong> <strong>the</strong> population gets paid <strong>in</strong> early October, <strong>the</strong>appropriate <strong>in</strong>dex is obta<strong>in</strong>ed by calculat<strong>in</strong>g <strong>the</strong> geometric mean <strong>of</strong> <strong>the</strong> values <strong>of</strong> <strong>the</strong> INPC <strong>in</strong>flation <strong>in</strong>dex for September and October - asproposed by Corseuil and Foguel (2002).vTo simulate <strong>the</strong> demand shock <strong>in</strong> <strong>the</strong> <strong>in</strong>put-output matrix, <strong>the</strong> “o<strong>the</strong>r regions <strong>of</strong> Brazil” were separated <strong>in</strong>to <strong>the</strong> Center-South (exclud<strong>in</strong>g SãoPaulo) and <strong>the</strong> North-Nor<strong>the</strong>ast. This separation is also important because <strong>of</strong> <strong>the</strong> heterogeneity present <strong>in</strong> <strong>the</strong> economies <strong>of</strong> those regions,especially with regard to <strong>the</strong> products analyzed. The Center-South and North-Nor<strong>the</strong>ast have socio-economic characteristics that arerecognizably different. However, <strong>the</strong> results for <strong>the</strong>se regions were presented toge<strong>the</strong>r, because <strong>the</strong> North-Nor<strong>the</strong>ast region is limited <strong>in</strong> itscapacity to <strong>in</strong>crease ethanol production and <strong>the</strong> demand shock applied to this region can be satisfied by ano<strong>the</strong>r region.viGUILHOTO, J. J. M. (USP. Departamento de Economia – FEA, São Paulo). Personal memo. 2009.viiThe demand shock was applied <strong>in</strong> <strong>the</strong> Center-South, North-Nor<strong>the</strong>ast and São Paulo state, and was analyzed only for São Paulo stateand <strong>the</strong> o<strong>the</strong>r regions <strong>of</strong> Brazil as a group. We calculated <strong>the</strong> <strong>in</strong>crease <strong>in</strong> consumption <strong>of</strong> hydrous ethanol and <strong>the</strong> correspond<strong>in</strong>g gasol<strong>in</strong>econsumption <strong>in</strong> each state, <strong>the</strong>n added toge<strong>the</strong>r <strong>the</strong> states that comprise <strong>the</strong> regions analyzed.viiiThe value <strong>of</strong> Type C gasol<strong>in</strong>e consumption is greater than <strong>the</strong> value <strong>of</strong> <strong>the</strong> consumption equivalent to one million reais <strong>of</strong> hydrous ethanol if<strong>the</strong> relationship between Type C gasol<strong>in</strong>e prices and hydrous ethanol (PG / PE) is greater than 1.428. This is because,Valorgiven that: Vol E=Eand that: Valor G= Vol E* 0,7 * P G. Substitut<strong>in</strong>g Vol Eem ValorP GEPwill result: Valor G= * 07 *G. Where G is gasol<strong>in</strong>e C and E is hydrous ethanol.P EixKassouf and Ferro (2004) state that <strong>in</strong>dicators <strong>of</strong> child labor <strong>in</strong> Brazilian agriculture fell between 1992 and 2001.xSeveral studies po<strong>in</strong>t to <strong>the</strong> urgent need for tra<strong>in</strong><strong>in</strong>g <strong>of</strong> this labor qualification. See Moraes (2007), Balsadi (2008) and Oliveira (2009), amongo<strong>the</strong>rs.xiWhile <strong>the</strong> four sectors have different characteristics <strong>the</strong>y were aggregated <strong>in</strong> this regression analysis because <strong>the</strong>y had a high coefficient<strong>of</strong> determ<strong>in</strong>ation (R2), and <strong>the</strong> t-test was significant for almost all parameters. Ano<strong>the</strong>r model was adjusted, tak<strong>in</strong>g <strong>in</strong>to account only<strong>the</strong> <strong>in</strong>dustrial activities – production <strong>of</strong> petroleum, derivatives and ethanol. For this model, <strong>the</strong> coefficient <strong>of</strong> determ<strong>in</strong>ation was 59.48%.H<strong>of</strong>fmann and Oliveira (2008) also estimated earn<strong>in</strong>gs formulas with two b<strong>in</strong>aries dist<strong>in</strong>guish<strong>in</strong>g <strong>the</strong> ethanol <strong>in</strong>dustry, <strong>the</strong> sugar <strong>in</strong>dustry andsugarcane production (base), us<strong>in</strong>g data from PNAD 2006.xiiHav<strong>in</strong>g “b” as <strong>the</strong> coefficient, <strong>the</strong> percentage difference for each b<strong>in</strong>ary is 100[exp(b)–1]%.xiiiThis model expla<strong>in</strong>s 71.2% <strong>of</strong> <strong>the</strong> variations <strong>of</strong> <strong>the</strong> <strong>in</strong>come logarithm for people employed <strong>in</strong> <strong>the</strong> sugar-ethanol and petrochemical sectors.It is a very satisfactory result when compared with studies that use PNAD, given that important variables <strong>in</strong> determ<strong>in</strong><strong>in</strong>g personal earn<strong>in</strong>gs(such as ambition, creativity, entrepreneurship and material wealth) are difficult to measure, and are not obta<strong>in</strong>ed from <strong>the</strong>se householdsurveys (H<strong>of</strong>fmann, 2000, pg. 101).xivThe concept <strong>of</strong> agriculture used by <strong>the</strong> author refers only to <strong>the</strong> farm<strong>in</strong>g activities contemplated by <strong>the</strong> PNAD, <strong>in</strong>clud<strong>in</strong>g temporary andpermanent crops.xvWe adjusted <strong>the</strong> total number <strong>of</strong> jobs by <strong>the</strong> proportion <strong>of</strong> sugarcane dest<strong>in</strong>ed to ethanol (53.3%) <strong>in</strong> <strong>the</strong> 2007/08 harvest.xviAno<strong>the</strong>r aspect that deserves attention is <strong>the</strong> presence <strong>of</strong> bus<strong>in</strong>ess establishments without employees, given that <strong>the</strong>re is a requirementto provide <strong>the</strong> RAIS with a negative statement. Even if a company has no formal employees <strong>in</strong> <strong>the</strong> year <strong>of</strong> declaration, this fact must bereported. Such data can reflect a newly opened bus<strong>in</strong>ess that may not have started production, but appears <strong>in</strong> <strong>the</strong> RAIS database due to <strong>the</strong>requirement for annual registration, or firms <strong>in</strong> <strong>the</strong> process <strong>of</strong> closure (MTE, 2008).xviiBy “net effect” we mean <strong>the</strong> result for <strong>the</strong> <strong>in</strong>crease <strong>in</strong> hydrous ethanol consumption subtracted from <strong>the</strong> result for <strong>the</strong> equivalent reduction<strong>in</strong> Type C gasol<strong>in</strong>e consumption.xviiiThe reduction <strong>in</strong> <strong>the</strong> value <strong>of</strong> <strong>in</strong>come <strong>in</strong> <strong>the</strong> rest <strong>of</strong> Brazil due to an <strong>in</strong>crease <strong>in</strong> demand <strong>in</strong> <strong>the</strong> State <strong>of</strong> São Paulo can be expla<strong>in</strong>ed by <strong>the</strong> factthat <strong>the</strong> unit value <strong>of</strong> <strong>in</strong>come (salary) paid by <strong>the</strong> <strong>in</strong>dustries most impacted by <strong>the</strong> <strong>in</strong>creased consumption <strong>of</strong> hydrous ethanol is lower thanthose sectors impacted by <strong>the</strong> reduction <strong>of</strong> Type C gasol<strong>in</strong>e.xixA greater <strong>in</strong>crease was not possible, because <strong>the</strong> equivalent reduction <strong>of</strong> ethanol would exceed <strong>the</strong> volume <strong>of</strong> ethanol consumed <strong>in</strong> somestates.xxGuilhoto et al. (2004) discuss <strong>the</strong> impact <strong>of</strong> mechanization on direct, <strong>in</strong>direct and <strong>in</strong>duced employment <strong>in</strong> sectors that produce sugarcane,sugar and ethanol.
76 Ethanol and Bioelectricity <strong>Sugarcane</strong> <strong>in</strong> <strong>the</strong> <strong>Future</strong> <strong>of</strong> <strong>the</strong> <strong>Energy</strong> <strong>Matrix</strong>03
Ethanol and Bioelectricity <strong>Sugarcane</strong> <strong>in</strong> <strong>the</strong> <strong>Future</strong> <strong>of</strong> <strong>the</strong> <strong>Energy</strong> <strong>Matrix</strong>77Contribution <strong>of</strong> Ethanolto Climate ChangeLuiz Gylvan Meira FilhoIsaias C. Macedo
78 Ethanol and Bioelectricity <strong>Sugarcane</strong> <strong>in</strong> <strong>the</strong> <strong>Future</strong> <strong>of</strong> <strong>the</strong> <strong>Energy</strong> <strong>Matrix</strong>The use <strong>of</strong> low-carbon, renewable energy is an important strategy for mitigat<strong>in</strong>g emissions<strong>of</strong> greenhouse gases (GHG) and combat<strong>in</strong>g global warm<strong>in</strong>g. <strong>Sugarcane</strong> ethanol, which hasa very favorable energy and emissions balance, is a commercially available alternative with<strong>the</strong> potential to expand rapidly <strong>in</strong> many countries and as new applications emerge. From alifecycle perspective, sugarcane ethanol has <strong>the</strong> capacity, <strong>in</strong> Brazil, to reduce around 90% <strong>of</strong>GHG emissions when compared with gasol<strong>in</strong>e.In 2006 <strong>the</strong> reduction <strong>of</strong> GHG emissions attributable to <strong>the</strong> use <strong>of</strong> ethanol (as a gasol<strong>in</strong>esubstitute) reached 22% <strong>of</strong> f<strong>in</strong>al emissions for <strong>the</strong> transportation and electricity generationsectors <strong>in</strong> Brazil, and could reach 43% <strong>in</strong> 2020. In relation to Brazil’s total energy consumption(electricity, <strong>in</strong>dustrial, transportation, residential, and o<strong>the</strong>rs), large-scale consumption <strong>of</strong>ethanol avoided <strong>the</strong> equivalent <strong>of</strong> 10% <strong>of</strong> total emissions <strong>in</strong> 2006 and will reach 18% <strong>in</strong> 2020(exclud<strong>in</strong>g agricultural and land-use changes). The potential for new uses (substitut<strong>in</strong>g o<strong>the</strong>rfossil fuels and <strong>in</strong>creased exports) could considerably <strong>in</strong>crease this share.The emissions reductions to be sought globally through <strong>the</strong> com<strong>in</strong>g decades make it possible
Contribution <strong>of</strong> Ethanol to Climate Change79to study <strong>the</strong> “value” <strong>of</strong> GHG mitigations generated by ethanol (determ<strong>in</strong>ed by <strong>the</strong> additionalglobal cost <strong>of</strong> <strong>the</strong> appropriate set <strong>of</strong> technologies for a desired level <strong>of</strong> mitigation). This additionalvalue <strong>of</strong> Brazilian ethanol is estimated at US$0.20 per liter <strong>of</strong> ethanol. In o<strong>the</strong>r words,each liter <strong>of</strong> ethanol used is equivalent to US$0.20 that would o<strong>the</strong>rwise have to be spent onmeasures to mitigate greenhouse gas emissions, so reduc<strong>in</strong>g <strong>the</strong> <strong>in</strong>vestments that countrieswould need to make to control global warm<strong>in</strong>g.An analysis <strong>of</strong> expectations for <strong>the</strong> post-Kyoto regime concludes that <strong>the</strong> debate persists overglobal reductions goals. Fur<strong>the</strong>rmore, <strong>the</strong> mechanisms for <strong>the</strong> management <strong>of</strong> emissionsbetween countries (like <strong>the</strong> Clean Development Mechanism) are very limited, especially forrenewable energies like ethanol.For Brazil, it is necessary that <strong>in</strong>ternational goals be adopted <strong>in</strong> a uniform manner, <strong>in</strong>clud<strong>in</strong>gCh<strong>in</strong>a and India, to protect <strong>the</strong> competiveness <strong>of</strong> our <strong>in</strong>dustry. It is also necessary that a specificadvantage – <strong>the</strong> fact that Brazil has one <strong>of</strong> <strong>the</strong> cleanest energy matrices <strong>in</strong> <strong>the</strong> world – beconsidered <strong>in</strong> <strong>in</strong>ternational trade.
80 Ethanol and Bioelectricity <strong>Sugarcane</strong> <strong>in</strong> <strong>the</strong> <strong>Future</strong> <strong>of</strong> <strong>the</strong> <strong>Energy</strong> <strong>Matrix</strong>1. IntroductionThe relationship between climate change and <strong>in</strong>creas<strong>in</strong>g concentrations <strong>of</strong> greenhouse gases <strong>in</strong> <strong>the</strong> atmospherewas irrefutably demonstrated <strong>in</strong> 2007 by <strong>the</strong> Intergovernmental Panel on Climate Change (IPCC). Internationalnegotiations to prevent <strong>the</strong> <strong>in</strong>herent problems are currently focused on try<strong>in</strong>g to limit temperature <strong>in</strong>crease<strong>in</strong> 2100 (to maybe 2º C) with emissions reduction distributed between <strong>in</strong>dustrial and develop<strong>in</strong>g countries.Negotiations for establishment <strong>of</strong> <strong>the</strong>se rules are ongo<strong>in</strong>g.Given <strong>the</strong> size <strong>of</strong> <strong>the</strong> Brazilian program for ethanol use, it is important to verify, <strong>in</strong> <strong>the</strong> domestic and <strong>in</strong>ternationalcontext, its contribution to this global effort through <strong>the</strong> next decade. Knowledge <strong>of</strong> this contribution(and its value, <strong>in</strong> <strong>the</strong> context <strong>of</strong> o<strong>the</strong>r technologies and emission mitigation policies) is a necessary element <strong>in</strong><strong>the</strong> set <strong>of</strong> facts to be considered <strong>in</strong> <strong>the</strong> development <strong>of</strong> Brazilian policy for <strong>the</strong>se negotiations.2. Greenhouse gas emission mitigation via <strong>the</strong> productionand use <strong>of</strong> sugarcane ethanolAssessments <strong>of</strong> GHG emission reduction attributable to <strong>the</strong> use <strong>of</strong> sugarcane ethanol have been made s<strong>in</strong>ce1992 (Macedo 1992). Gradual improvements have been made to <strong>the</strong> databases, and changes made due tovariations <strong>in</strong> production and use technologies (Macedo 2007). More recently, work has been developed seek<strong>in</strong>gharmonization between <strong>the</strong> methodologies used for various raw materials and products (sugarcane, corn,gra<strong>in</strong>s, wood, ethanol, biodiesel, etc.). These assessments are generally made for <strong>the</strong> production and fuel usecycle, and <strong>in</strong>itially did not <strong>in</strong>clude effects <strong>of</strong> land-use change.Adoption <strong>of</strong> <strong>the</strong> European Directive <strong>in</strong> December 2008 led to <strong>the</strong> “<strong>of</strong>ficial” <strong>in</strong>troduction <strong>of</strong> quantification<strong>of</strong> <strong>the</strong> direct effects <strong>of</strong> land-use change (LUC) <strong>in</strong> bi<strong>of</strong>uel production. This quantification takes <strong>in</strong>to accountchanges <strong>in</strong> carbon stocks (above and below <strong>the</strong> soil) and seeks to implement a relatively simple calculation.Table 1Scenarios for ethanol demand In millions <strong>of</strong> m 3 per yearYearDomesticmkt2010 2015 2018 2020ExportDomesticmktExportDomesticmktExpDomesticmktUNICA (2008) 23 6 35 12 50 15Mapa (2007) 20 28 30EPE (2007) 20 4 26 10 34 14IE-UFRJ, scenario B (2006) 35Cepea (2007) 4,4 9,8 18Exp
Contribution <strong>of</strong> Ethanol to Climate Change81Given <strong>the</strong> absence <strong>of</strong> sufficient and reliable data for soil carbon levels <strong>in</strong> many regions this calculation isbased on IPCC default parameters. In 2009, <strong>the</strong> Environmental Protection Agency (EPA) and California AirResources Board (CARB) submitted proposals for discussion that <strong>in</strong>cluded direct and <strong>in</strong>direct LUC effects <strong>in</strong><strong>the</strong> United States.The so-called “<strong>in</strong>direct effects” <strong>of</strong> LUC have been under discussion s<strong>in</strong>ce 2008. These do occur, <strong>in</strong> certa<strong>in</strong> cases,but <strong>the</strong> tools available for <strong>the</strong>ir evaluation (<strong>the</strong> models and <strong>the</strong> cause-and-effect relations for <strong>in</strong>numerablesituations and locations) are clearly <strong>in</strong>adequate for <strong>the</strong> desired task. The European Directive has postponeddecisions on <strong>the</strong> use <strong>of</strong> <strong>in</strong>direct effect assessments to at least <strong>the</strong> end <strong>of</strong> 2010, while <strong>in</strong> <strong>the</strong> United States <strong>the</strong>discussions have advanced considerably <strong>in</strong> relation to <strong>in</strong>itial proposals.2.1 Emissions avoided through <strong>the</strong> use <strong>of</strong> sugarcane ethanol:estimates for 2009 – 2020Follow<strong>in</strong>g are estimates for <strong>the</strong> reduction <strong>of</strong> GHG emissions attributable to us<strong>in</strong>g sugarcane ethanol as asubstitute for gasol<strong>in</strong>e. The process <strong>of</strong> calculation entails:. Scenario 2009-2020 for ethanol fuel demand <strong>in</strong> Brazil and for export;. Technological scenario for <strong>the</strong> period (assum<strong>in</strong>g only <strong>the</strong> <strong>in</strong>troduction <strong>of</strong> commercial technologies forelectrical energy, and cont<strong>in</strong>uous progress <strong>in</strong> usage technologies);. Specific emissions for <strong>the</strong>se scenarios; composition for <strong>the</strong> total period.Ethanol demand 2010-2020Table 1 shows consumption estimates for <strong>the</strong> domestic and <strong>in</strong>ternational markets dur<strong>in</strong>g this decade, remember<strong>in</strong>gthat <strong>the</strong>se scenarios are very susceptible to change, depend<strong>in</strong>g on <strong>the</strong> public policies adopted <strong>in</strong>com<strong>in</strong>g years. This is particularly <strong>the</strong> case for developed countries, which have traditionally protected <strong>the</strong>irmarkets with high import tariffs. An “export” scenario was <strong>in</strong>cluded only to analyze expected mitigation. Itis a “moderate” scenario (Cepea, 2007).Domestic and export demand for ethanol Table 2As shown <strong>in</strong> Table 2, a scenario was adoptedfor 2020 specifically to estimate <strong>the</strong>In millions <strong>of</strong> m 3 per year2010 2015 2020emissions avoided by <strong>the</strong> use <strong>of</strong> ethanol.Domestic DemandThis takes <strong>in</strong>to account various scenarios andAnhydrous 6 6 5assumptions, toge<strong>the</strong>r with <strong>the</strong> demandHydrous 17 29 45analysis that <strong>in</strong>cludes ethanol blended withSubtotal, domestic 23 35 50Type A gasol<strong>in</strong>e and <strong>the</strong> <strong>in</strong>crease <strong>in</strong> <strong>the</strong> fleet<strong>of</strong> flex-fuel vehicles with a consequent riseExports, anhydrous 5 10 15<strong>in</strong> demand for hydrous ethanol (E-100).Total 28 35 65
82 Ethanol and Bioelectricity <strong>Sugarcane</strong> <strong>in</strong> <strong>the</strong> <strong>Future</strong> <strong>of</strong> <strong>the</strong> <strong>Energy</strong> <strong>Matrix</strong>Technological scenario for <strong>the</strong> periodTechnological developments <strong>in</strong> <strong>the</strong> period and <strong>the</strong>ir impact on GHG emissions are considered from a basepo<strong>in</strong>t <strong>of</strong> <strong>the</strong> current situation for <strong>the</strong> average for mills, us<strong>in</strong>g 2006 parameters as def<strong>in</strong>ed from data availablefor <strong>the</strong> Center-South region (Macedo 2007). This study considers only technologies that will be commerciallyavailable <strong>in</strong> this horizon (i.e. by 2020), toge<strong>the</strong>r with clearly identifiable trends, <strong>the</strong> most important<strong>of</strong> which is <strong>the</strong> use <strong>of</strong> sugarcane straw (up to 40%) and residual bagasse (up to 35%) to produce asurplus <strong>of</strong> electrical power via conventional high pressure (steam cycle) and co-generation systems (Seabra,2008). Expected advances <strong>in</strong> agricultural and <strong>in</strong>dustrial productivity, and <strong>in</strong> conversion efficiency, are also<strong>in</strong>cluded. In <strong>the</strong> agricultural area, we expect to see <strong>the</strong> optimized allocation <strong>of</strong> new varieties, <strong>the</strong> morerapid use <strong>of</strong> genetic modification <strong>in</strong> plants, and precision agriculture technology. We shall denote thistechnological stage as “Technology E” (with “E” for electricity). The penetration rates <strong>of</strong> <strong>the</strong> technology areestimated and <strong>in</strong>troduced <strong>in</strong> <strong>the</strong> study, differentiat<strong>in</strong>g new mills from exist<strong>in</strong>g mills.We did not take <strong>in</strong>to account technologies currently under development that are expected to achieve significantpenetration only after 2018, for example cellulosic hydrolysis. Estimates <strong>in</strong> this sense can be found<strong>in</strong> Macedo (2008) but are not essential for this study.Basic agricultural and <strong>in</strong>dustrial data, along with data for transport, distribution, and f<strong>in</strong>al usage <strong>of</strong> ethanol for<strong>the</strong> base year 2006 and for “Technology E” <strong>in</strong> 2020, can be found <strong>in</strong> Macedo and Seabra (2008). Some <strong>of</strong> <strong>the</strong>ma<strong>in</strong> parameters are shown below, bear<strong>in</strong>g <strong>in</strong> m<strong>in</strong>d that for “Technology E,” <strong>the</strong>y are not averages for all mills:Table 3 Production parameters for <strong>the</strong> period 2006-2020Tonnescane/haLitersethanol pertonne caneSurplus kWHper tonne <strong>of</strong>caneArea <strong>of</strong>sugarcane<strong>in</strong> millions<strong>of</strong> ha2006, average 87 86.3 9.2 2.42020, Technology E 95 93.2 135 7.3Table 4Correspond<strong>in</strong>g production <strong>of</strong> ethanol, electricity and sugarcane2006 2010 2015 2020Ethanol, domestic market (M 3 millions) 14.2 23 35 50Ethanol, export market (M 3 millions) 3.7 5 10 15<strong>Sugarcane</strong> planted area (ha millions) 2.4 3.6 4,2 7.3<strong>Sugarcane</strong> (tonnes millions) 207 318 385 697Electricity (tWh/year) 1.9 2.9 20.3 52
Contribution <strong>of</strong> Ethanol to Climate Change83Rates <strong>of</strong> penetration for Technology E were estimated tak<strong>in</strong>g <strong>in</strong>to account that <strong>the</strong> technology is alreadypartially <strong>in</strong> commercial use, be<strong>in</strong>g <strong>in</strong>corporated <strong>in</strong>to almost all new mills (high pressure steam generation).However, it will take some years to reach 40% usage levels for sugarcane straw. The follow<strong>in</strong>g hypo<strong>the</strong>seswere <strong>the</strong>refore adopted:. 2006-2010: as a conservative estimate, <strong>the</strong> conditions perta<strong>in</strong><strong>in</strong>g <strong>in</strong> 2006 were adopted, without completenew systems;. 2011-2020: 80% <strong>of</strong> <strong>in</strong>cremental production will use Technology E (electricity); and3% <strong>of</strong> 2010-level production shifts to Technology E each year.Thus, 35% <strong>of</strong> production will use Technology E by 2015, and 53% <strong>in</strong> 2020.Reduction <strong>of</strong> GHG emissions dur<strong>in</strong>g <strong>the</strong> perioda. Production cycle (without effects on land-use change)The analysis <strong>of</strong> GHG emissions follows <strong>the</strong> standards currently used for bi<strong>of</strong>uels, <strong>in</strong>clud<strong>in</strong>g CO 2 , methaneand N 2 O, which are considered to be <strong>the</strong> most important GHGs <strong>in</strong> relation to agricultural production, <strong>in</strong>dustrialconversion, transportation, distribution, and f<strong>in</strong>al use <strong>of</strong> ethanol. There are still disagreements (albeitsmaller today) about some po<strong>in</strong>ts, notably over <strong>the</strong> different ways <strong>of</strong> calculat<strong>in</strong>g emissions and mitigationvia by-products, and over some process<strong>in</strong>g parameters. When report<strong>in</strong>g <strong>the</strong> results, we have always sought<strong>the</strong> best <strong>in</strong>formation available, with <strong>the</strong> greatest transparent.Avoided emissionsSpecific emissions avoided by virtue <strong>of</strong> us<strong>in</strong>g ethanol, compared with gasol<strong>in</strong>e, for average 2006 conditions and forTechnology E <strong>in</strong> 2020; exclud<strong>in</strong>g impacts <strong>of</strong> land use change (tonnes CO 2e/m 3 ethanol)Table 5Year 2006 (average) Technology E (2020) (1)F<strong>in</strong>al use <strong>of</strong> ethanol E-100 E-25 E-100 FFV E-25Emissions dur<strong>in</strong>g production 0.44 0.46 0.34 0.34 0.36Emissions avoided 2.15 2.82 2.36 2.28 3.02Surplus bagasse (2) 0.14 0.15 0.00 0.00 0.00Surplus electricity (3) 0.03 0.03 0.38 0.38 0.40Use <strong>of</strong> ethanol (4, 5) 1.98 2.64 1.98 1.90 2.64Avoided emissions (net) 1.71 2.36 2.02 1.94 2.66Notes: (1) Technology E: Process improvements + Electricity production (high pressure, bagasse + 40% straw). (2) Substitution <strong>of</strong> oil-fired boilers(efficiency 92%; PCI) with boilers fired by bagasse (efficiency = 79%; PCI). (3) This study used an emissions factor based on <strong>the</strong> average <strong>of</strong> factors<strong>of</strong> <strong>the</strong> build marg<strong>in</strong> and <strong>the</strong> operat<strong>in</strong>g marg<strong>in</strong>, for Brazil: ~268 t CO 2e/gWh. Emission factors <strong>of</strong> 579 t and 560 t CO 2e/gWh(e) for 2006 and 2020,respectively (based on IEA estimates, average world emissions, electricity), and emissions <strong>of</strong> natural gas-fired generat<strong>in</strong>g plants, can also be taken <strong>in</strong>toconsideration. (4) Equivalencies: E-25: 1 L ethanol = 0.8 L Type A gasol<strong>in</strong>e; E-100: 1 L ethanol = 0.74 L Type A gasol<strong>in</strong>e; FFV: 1 L gasol<strong>in</strong>e = 0.72L E-25 = 0.66 L Type A gasol<strong>in</strong>e. (5) Gasol<strong>in</strong>e, emissions <strong>of</strong> GHG: 2.64 kg CO 2e/m 3 gasol<strong>in</strong>e.
8 4 Ethanol and Bioelectricity <strong>Sugarcane</strong> <strong>in</strong> <strong>the</strong> <strong>Future</strong> <strong>of</strong> <strong>the</strong> <strong>Energy</strong> <strong>Matrix</strong>The detailed analysis <strong>of</strong> <strong>the</strong> emissions – parameters, coefficients, default values used, database and its variation,and methodologies – for <strong>the</strong> current and Technology E cases can be found <strong>in</strong> <strong>the</strong> referenced work(Macedo and Seabra 2008, Macedo 2007). We note <strong>the</strong> <strong>in</strong>clusion <strong>of</strong> <strong>the</strong> average efficiency <strong>of</strong> motors, which<strong>in</strong> Brazil can be assessed based on many years <strong>of</strong> experience. Summariz<strong>in</strong>g, for blends conta<strong>in</strong><strong>in</strong>g up to 10%<strong>of</strong> ethanol, we have 1 liter <strong>of</strong> ethanol = 1 liter <strong>of</strong> Type A gasol<strong>in</strong>e (which becomes an 80% equivalence withE-25); while E-100 eng<strong>in</strong>es show an equivalence <strong>of</strong> 79% (1 liter <strong>of</strong> ethanol = 0.79 liters <strong>of</strong> Type C gasol<strong>in</strong>e) –Cetesb (2008). For flex-fuel vehicles, <strong>in</strong> 2005, we have 1 liter <strong>of</strong> ethanol = 0.72 liters <strong>of</strong> E-25 (which is 66%<strong>of</strong> equivalence compared to Type A gasol<strong>in</strong>e) – Joseph Jr. (2005); Cetesb (2008). The most <strong>in</strong>terest<strong>in</strong>g resultsare shown <strong>in</strong> Tabela 5.b. Effect <strong>of</strong> land-use changeThe direct effects <strong>of</strong> land-use change related to Brazilian sugarcane expansion have been analyzed <strong>in</strong> recentyears. It can be shown that:. Changes <strong>in</strong> land use to produce sugarcane for ethanol dur<strong>in</strong>g <strong>the</strong> last 25 years <strong>in</strong> Brazil should be consideredonly for <strong>the</strong> period 2002-2009, because <strong>the</strong> production <strong>of</strong> ethanol rema<strong>in</strong>ed constant at around 12million m3 per year from 1984 through 2002 (Macedo and Seabra, 2008).. The f<strong>in</strong>d<strong>in</strong>gs <strong>of</strong> several <strong>in</strong>dependent studies show that <strong>in</strong> this period <strong>the</strong> occupation <strong>of</strong> woodlands (cerrado/savannah,forests) was less than 2% <strong>of</strong> <strong>the</strong> total, with land-use changes <strong>in</strong>volv<strong>in</strong>g pr<strong>in</strong>cipally exist<strong>in</strong>gpastureland and land used for annual crops (Nassar, 2008).Table 6Alterations <strong>in</strong> carbon stocks by virtue <strong>of</strong> land use changes (LUC)CropChange <strong>in</strong> carbon stock (1)Emissions (kg <strong>of</strong> CO 2e/m 3 <strong>of</strong> ethanol)(tonnes <strong>of</strong> carbon / ha) 2006 2020 electricityPasture – degraded 10 -302 -259Pasture – natural -5 157 134Pasture – cultivated -1 29 25Soy -2 61 52Maize 11 -317 -272Cotton 13 -384 -329Cerrado (savannah) -21 601 515Open field -29 859 737Cerrado (dense) -36 1040 891LUC emissions (2) -118 -109Notes: (1) Based on average values for carbon stocks below and above <strong>the</strong> soil (only perennial). (2) Distribution <strong>of</strong> LUC: 2006 – 50% pasture land(70% degraded, 30% natural); 50% annual crops (65% soy, 35% o<strong>the</strong>rs); 2020 – 60% pasture land (70% degraded, 30% natural); 40% annual crops(65% soy, 35% o<strong>the</strong>rs); Cerrado less than 1%.
Contribution <strong>of</strong> Ethanol to Climate Change85. Information about carbon levels <strong>in</strong> <strong>the</strong> soil for <strong>the</strong> crops be<strong>in</strong>g substituted versus those for sugarcane donot differ greatly from <strong>the</strong> IPCC default levels, <strong>in</strong>dicat<strong>in</strong>g that sugarcane cultivation without burn<strong>in</strong>g could<strong>in</strong>crease <strong>the</strong> soil carbon balance for <strong>the</strong> majority <strong>of</strong> annual crop and pasture lands (Amaral, 2008).. An analysis <strong>of</strong> <strong>the</strong> average current situation for <strong>the</strong> change <strong>of</strong> land-use to sugarcane without burn<strong>in</strong>g issummarized <strong>in</strong> Table 6 (Macedo and Seabra, 2008), and <strong>in</strong>dicates an <strong>in</strong>crease <strong>in</strong> <strong>the</strong> soil carbon level. If<strong>the</strong> conditions <strong>of</strong> land-use change are ma<strong>in</strong>ta<strong>in</strong>ed (and this is to be expected, assum<strong>in</strong>g <strong>the</strong> <strong>in</strong>tensification<strong>of</strong> livestock graz<strong>in</strong>g) <strong>the</strong>n <strong>the</strong> direct effect <strong>of</strong> <strong>the</strong> land use change will be positive.Several studies now under way seek to improve <strong>the</strong> knowledge about soil carbon stocks <strong>in</strong> Brazil. In thisstudy, however, to ma<strong>in</strong>ta<strong>in</strong> our conservative posture, we have not yet <strong>in</strong>cluded <strong>the</strong> positive results thathave been obta<strong>in</strong>ed so far.c. Results: avoided emissionsTabela 7 shows total avoided emissions for selected years between 2006 and 2020. Two references areconsidered <strong>in</strong> regards to <strong>the</strong> avoided emissions for <strong>the</strong> substitution <strong>of</strong> electrical energy: an average between<strong>the</strong> build marg<strong>in</strong> and <strong>the</strong> operat<strong>in</strong>g marg<strong>in</strong> <strong>in</strong> Brazil (260 t CO 2e / gWh) and <strong>the</strong> value associated withnatural gas plants (570 t CO 2e /gWh).Thus, <strong>in</strong> <strong>the</strong> 11 years 2010 – 2020, total avoided emission would be 1,015 million tonnes <strong>of</strong> CO 2e, with anaverage <strong>of</strong> 92 million tonnes <strong>of</strong> CO 2e per year; or 7% more if <strong>the</strong> emissions from <strong>the</strong> substituted electricityare computed based on natural gas generation (a 12% <strong>in</strong>crease <strong>in</strong> <strong>the</strong> last year).2.2 Emissions avoided through ethanol use <strong>in</strong> <strong>the</strong> Brazilian contextThe values <strong>of</strong> avoided emissions <strong>in</strong>clude <strong>the</strong> effects <strong>of</strong> ethanol and electricity. For comparison, we use GHGemissions for <strong>the</strong> transportation and electricity generation sectors <strong>in</strong> Brazil, estimated for 2005 and 2020 (EPE2007). Here, as throughout this study, <strong>the</strong> computed electricity generation corresponds only to that portion <strong>of</strong>sugarcane used to produce ethanol; <strong>the</strong> sector generates almost as much aga<strong>in</strong> with <strong>the</strong> production <strong>of</strong> sugar.Table 7Emissions avoided through <strong>the</strong> use <strong>of</strong> ethanol (<strong>in</strong> Brazil and exported)In millions <strong>of</strong> tonnes <strong>of</strong> CO 2e per year2006 2010 2015 2020Mitigation (1) 36 55 91 133Mitigation (2) 37 56 97 149(1) Electricity: average <strong>of</strong> build and operat<strong>in</strong>g marg<strong>in</strong>s <strong>in</strong> Brazil (260 t CO 2e / gWh)(2) Electricity: natural gas generat<strong>in</strong>g stations (570 t CO 2e / gWh)
86 Ethanol and Bioelectricity <strong>Sugarcane</strong> <strong>in</strong> <strong>the</strong> <strong>Future</strong> <strong>of</strong> <strong>the</strong> <strong>Energy</strong> <strong>Matrix</strong>In 2006, emissions mitigation with ethanol (and associated energy) represented 22% <strong>of</strong> f<strong>in</strong>al emissions <strong>of</strong><strong>the</strong> two sectors, and could reach 43% by 2020.Brazil’s total annual emissions (related to energy production and use, across all sectors) were 350 milliontonnes <strong>of</strong> CO 2e <strong>in</strong> 2006, forecast to reach 720 million tonnes <strong>of</strong> CO 2e <strong>in</strong> 2020 (EPE 2007), exclud<strong>in</strong>g emissionsrelated to agriculture and changes <strong>in</strong> <strong>the</strong> use <strong>of</strong> land and forests. The ethanol sector avoided <strong>the</strong>equivalent <strong>of</strong> 10% <strong>of</strong> <strong>the</strong>se emissions <strong>in</strong> 2006, and could avoid 18% <strong>in</strong> 2020.3. The global contextGiven that <strong>the</strong> warm<strong>in</strong>g caused by <strong>in</strong>creased GHG emissions is a global problem, it is appropriate to put<strong>the</strong> emissions prevented by ethanol <strong>in</strong> this context. Anthropogenic emissions <strong>of</strong> <strong>the</strong> pr<strong>in</strong>cipal GHGs <strong>in</strong> 2005 iwere: 36 gigatonnes (Gt) <strong>of</strong> CO 2(<strong>of</strong> which 75% from energy and 11% from land-use change); 6 Gt CO 2e <strong>of</strong>methane; 2.5 Gt CO 2e <strong>of</strong> N 2O; and about 0.8 Gt CO 2e <strong>of</strong> fluor<strong>in</strong>ated gases.The reference scenario (WEA 2008), ma<strong>in</strong>ta<strong>in</strong><strong>in</strong>g policies <strong>in</strong> place <strong>in</strong> October 2008 (average values betweenvarious IPCC scenarios), po<strong>in</strong>ts to GHG emissions grow<strong>in</strong>g from 44.2 Gt CO 2e (2005) to 54 Gt <strong>in</strong> 2020 and59.6 Gt CO 2e by 2030. Emissions associated with energy correspond to 61%, 67%, and 68%, respectively,<strong>of</strong> <strong>the</strong>se totals. The Brazilian ethanol sector contributed to a 0.1% reduction <strong>of</strong> <strong>the</strong>se emissions <strong>in</strong> 2006,and could reach 0.25% <strong>in</strong> 2020.The relationships between GHG emissions and climate are complex. Factors like carbon removal could partiallyneutralize <strong>the</strong> greenhouse effect (IPCC 2007-a). Under current conditions, <strong>the</strong> variation <strong>of</strong> 1 ppm CO 2<strong>in</strong> <strong>the</strong> atmospheric concentration corresponds to 7.7 Gt CO 2e; but tak<strong>in</strong>g <strong>in</strong>to account removal processes(oceans, atmosphere, soils) <strong>the</strong> correspond<strong>in</strong>g emission would be 13.3 Gt CO 2e.It is estimated that average global temperatures today are 0.76° C higher than <strong>the</strong> pre-<strong>in</strong>dustrial average,and <strong>the</strong> rate <strong>of</strong> growth has <strong>in</strong>creased (0.19° C <strong>in</strong> <strong>the</strong> last 20 years).Table 8Emissions by sector and mitigation through <strong>the</strong> use <strong>of</strong> ethanolIn millions <strong>of</strong> tonnes <strong>of</strong> CO 2e per yearTransportation(1)Electricalenergy (1)Transportation+electricityEmissionsavoided: ethanol+ electricity (2)2006 140 20 160 362020 250 60 310 133Notes: (1) Emissions <strong>in</strong>clude a certa<strong>in</strong> quantity <strong>of</strong> ethanol <strong>in</strong> <strong>the</strong> mix (accord<strong>in</strong>g to EPE estimates); <strong>the</strong>yare <strong>the</strong>refore f<strong>in</strong>al emission values, accord<strong>in</strong>g to <strong>the</strong> EPE (2007). (2) Includes emissions avoidedby virtue <strong>of</strong> exported ethanol.
Contribution <strong>of</strong> Ethanol to Climate Change87Two scenarios considered (WEO 2008-a) for 2030 aim for GHG concentrations to stabilize at ei<strong>the</strong>r 550ppm <strong>of</strong> CO 2e, with a global temperature <strong>in</strong>crease <strong>of</strong> 3° C and emissions reach<strong>in</strong>g 33 Gt CO 2e; or 450 ppm,with a 2° C rise <strong>in</strong> temperature and an emissions <strong>in</strong>crease <strong>of</strong> 25 Gt CO 2e. The potentially harmful effects <strong>of</strong><strong>the</strong>se levels <strong>of</strong> temperature rise are well modeled today (IPCC 2007-a).Several models ii (Fischedick 2008) show that <strong>in</strong> <strong>the</strong> period 2000-2030 <strong>the</strong> most relevant mitigation technologies(for stabilization at 450-590 ppm CO 2) would be those <strong>of</strong> energy conservation and efficiency,followed by technologies related to renewable energy sources. Look<strong>in</strong>g fur<strong>the</strong>r ahead, to 2100, <strong>the</strong> sametechnologies will cont<strong>in</strong>ue to be important, alongside o<strong>the</strong>rs such as carbon capture and storage (CCS).One important po<strong>in</strong>t is that <strong>in</strong> order to obta<strong>in</strong> adequate emissions reductions, all <strong>the</strong> technology options underconsideration will be necessary. With regard to transportation (<strong>the</strong> case <strong>of</strong> ethanol), under <strong>the</strong> referencescenario global emissions will grow from 6.7 Gt CO 2e to 11.6 Gt CO 2 e between 2002 and 2030. Exist<strong>in</strong>goptions to <strong>in</strong>crease efficiency and <strong>the</strong> use <strong>of</strong> bi<strong>of</strong>uels could reduce this by 2.2 to 4.5 Gt CO 2e (IPCC 2007-c),but this potential mitigation would be partially <strong>of</strong>fset by <strong>the</strong> <strong>in</strong>creased use <strong>of</strong> non-conventional liquid fuelswith higher CO 2emissions. This means that transportation emissions will cont<strong>in</strong>ue grow<strong>in</strong>g through 2030,even with <strong>the</strong> use (with<strong>in</strong> <strong>the</strong>ir practical possibilities) <strong>of</strong> all mitigation options currently be<strong>in</strong>g analyzed.Cost <strong>of</strong> emission mitigation <strong>in</strong> <strong>the</strong> world, and <strong>the</strong> additional value <strong>of</strong> ethanolIn <strong>the</strong> current scenario, climate changes will imply significant costs to countries, <strong>in</strong> terms <strong>of</strong> implementationand adaptation. The goal is to m<strong>in</strong>imize this impact through <strong>the</strong> reduction <strong>of</strong> emissions, so m<strong>in</strong>imiz<strong>in</strong>gdamage (and <strong>the</strong> cost <strong>of</strong> adaptation). Uncerta<strong>in</strong>ties regard<strong>in</strong>g adaption costs are clear: annual valueswere estimated by <strong>the</strong> IPCC <strong>in</strong> 2007 to be between US$40 billion and US$170 billion after 2030, but wererecently revised to more than US$500 billion.For just now, it is possible to estimate <strong>the</strong> average cost <strong>of</strong> tonnes <strong>of</strong> avoided carbon emissions, to achieve certa<strong>in</strong>goals. For sugarcane ethanol, this cost is an <strong>in</strong>dicator <strong>of</strong> its additional value (a non-market externality).Cap and trade systems are seen as <strong>the</strong> most likely. In <strong>the</strong>se systems, <strong>the</strong> cost <strong>of</strong> stabiliz<strong>in</strong>g emissions dependson <strong>the</strong> target (i.e. <strong>the</strong> concentration <strong>of</strong> CO 2), <strong>the</strong> basel<strong>in</strong>e and <strong>the</strong> set <strong>of</strong> available technologies (Fischedick2008). Ideally, <strong>the</strong> technological options to be used would start with <strong>the</strong> lowest-cost options. Thiswas summarized <strong>in</strong> (IPCC 2007-a): “Studies <strong>in</strong>dicate <strong>the</strong> necessity for a diversified portfolio; carbon prices<strong>in</strong> <strong>the</strong> range US$20-50/t CO 2e would be sufficient to drive large-scale fuel-switch<strong>in</strong>g and make both CCSand low-carbon power sources economically viable as technologies mature.” Several studies have lookedat specific aspects <strong>of</strong> <strong>the</strong> estimated costs. In general, <strong>the</strong>re is a consensus that cost estimates are still veryimprecise. There is <strong>in</strong>sufficient knowledge about some specific costs (CCS, for example) for different scalesand timeframes. It is difficult to analyze <strong>in</strong>terdependent systems and <strong>the</strong>re is large variation depend<strong>in</strong>g onlocation. Some recent results are:
88 Ethanol and Bioelectricity <strong>Sugarcane</strong> <strong>in</strong> <strong>the</strong> <strong>Future</strong> <strong>of</strong> <strong>the</strong> <strong>Energy</strong> <strong>Matrix</strong>. Consider<strong>in</strong>g <strong>the</strong> available technologies for electricity (<strong>in</strong>clud<strong>in</strong>g CCS with coal and natural gas), and comparedto <strong>the</strong> base <strong>of</strong> 15.77 Gt CO 2e <strong>in</strong> 2030, emissions reduction could reach 4 Gt CO 2e with a carbonprice <strong>of</strong> up to US$20/t CO 2e; 6.4 Gt CO 2e with a price <strong>of</strong> up to US$50/t CO 2e; and 7.2 Gt CO 2e with a price<strong>of</strong> US$100/t CO 2e. (IPCC 2007-b). Stabilization at 550 ppm CO 2would correspond to a price <strong>of</strong> US$20-50/t CO 2e, between 2020 and 2030;but US$100/t would be necessary for 450 ppm CO 2. (IPCC 2007-a). It is possible to reduce emission by 55% by 2030 (lead<strong>in</strong>g to 550 ppm) with a price below 60 Euros/t CO 2e;and by 70% (for 450 ppm) with a price between 60 and 100 Euros/t CO 2e. (McK<strong>in</strong>sey 2009). There are two scenarios for 2050: ma<strong>in</strong>ta<strong>in</strong> emissions at <strong>the</strong> same level as 2005 (with marg<strong>in</strong>al costs <strong>of</strong>CO 2mitigation up to US$50/t CO 2e), or reduce 2005 emissions by half by 2050 – <strong>in</strong> this more optimisticscenario some technologies would go to US$200/t CO 2e, but <strong>the</strong> average would stay between US$38 andUS$117/t CO 2e). (IEA 2008). In <strong>the</strong> scenario <strong>of</strong> stabilization at 550 ppm CO 2, cap and trade would br<strong>in</strong>g <strong>the</strong> price <strong>of</strong> CO 2to US$90/tCO 2e <strong>in</strong> 2030 (OECD+), and US$40/t CO 2e <strong>in</strong> 2020. For stabilization at 450 ppm, <strong>the</strong> price would be upto US$180/t CO 2e <strong>in</strong> 2030. (WEO-2008-a)From <strong>the</strong>se <strong>in</strong>dications, and consider<strong>in</strong>g <strong>the</strong> need to reduce <strong>the</strong> atmospheric concentration <strong>of</strong> CO 2to 450ppm, we have assumed a reference cost for mitigation <strong>of</strong> US$100/t CO 2e for <strong>the</strong> next 20 years. This cost isdeterm<strong>in</strong>ed by <strong>the</strong> total emissions to be reduced, and from <strong>the</strong> cost and potential (vary<strong>in</strong>g by location andtime) <strong>of</strong> <strong>the</strong> various technologies under consideration.Consider<strong>in</strong>g <strong>the</strong> use <strong>of</strong> ethanol <strong>in</strong> substitution for gasol<strong>in</strong>e and its excess electricity, <strong>the</strong> avoided mitigationcost <strong>of</strong> US$100/t CO 2e and <strong>the</strong> average value <strong>of</strong> mitigation (~2 t CO 2e/m 3 ethanol, see Table 5) createan additional value for ethanol <strong>of</strong> US$0.20 per liter. This additional value (that is to say, <strong>in</strong> addition to <strong>the</strong>equivalent value <strong>of</strong> <strong>the</strong> gasol<strong>in</strong>e which it substitutes) is one <strong>of</strong> <strong>the</strong> externalities <strong>of</strong> ethanol use. While thisexternality is unremunerated, it should be taken <strong>in</strong>to account when develop<strong>in</strong>g appropriate policies to promote<strong>the</strong> production and use <strong>of</strong> ethanol.Possibilities for expansion <strong>of</strong> ethanol use <strong>in</strong> o<strong>the</strong>r sectors <strong>in</strong> BrazilEthanol could be used <strong>in</strong> o<strong>the</strong>r sectors <strong>in</strong> Brazil, so <strong>in</strong>creas<strong>in</strong>g its potential for emissions mitigation. Whilethis possibility is not <strong>in</strong>cluded <strong>in</strong> this assessment, we suggest some possibilities:. The use <strong>of</strong> natural gas (NG) needs to be redirected to areas like <strong>in</strong>dustry and <strong>the</strong>rmoelectric generation,where it is more appropriate than be<strong>in</strong>g used as vehicular natural gas (Compressed Natural Gas-CNG).In 2008, CNG use corresponded with about 4.5 million m 3 <strong>of</strong> ethanol (approximately 30% <strong>of</strong> <strong>the</strong> fuelethanol used <strong>in</strong> <strong>the</strong> country).. The consumption <strong>of</strong> diesel <strong>in</strong> isolated stand-alone generat<strong>in</strong>g systems was equivalent to 1.4 million m 3<strong>of</strong> ethanol.
Contribution <strong>of</strong> Ethanol to Climate Change89. The consumption <strong>of</strong> diesel just <strong>in</strong> <strong>the</strong> sugarcane agricultural sector was equivalent to about 2.2 millionm 3 <strong>of</strong> ethanol.. The use <strong>of</strong> ethanol substitut<strong>in</strong>g just 5% (by energy content) <strong>of</strong> diesel would require about 4 million m 3 <strong>of</strong>ethanol (this could occur as a priority <strong>in</strong> sectors like urban mass transportation).Evolution <strong>of</strong> knowledge on climate change;trends and expectations for <strong>the</strong> post-Kyoto regime; ethanol <strong>in</strong> BrazilGlobal climate change, caused by <strong>the</strong> <strong>in</strong>creased concentration <strong>of</strong> CO 2and o<strong>the</strong>r greenhouse gases <strong>in</strong> <strong>the</strong>atmosphere as a result <strong>of</strong> human activity, is “one <strong>of</strong> <strong>the</strong> greatest challenges <strong>of</strong> our times,” accord<strong>in</strong>g to <strong>the</strong>leaders <strong>of</strong> countries represented at <strong>the</strong> G-8 Major Economies Forum, held <strong>in</strong> L’Aquila, Italy, <strong>in</strong> July 2009.Climate change and greenhouse gasesGlobal warm<strong>in</strong>g is caused by human activity that <strong>in</strong>crease <strong>the</strong> atmospheric concentration <strong>of</strong> greenhousegases: carbon dioxide (from <strong>the</strong> burn<strong>in</strong>g <strong>of</strong> fossil fuels, cement production, and deforestation); methane(anaerobic decomposition <strong>of</strong> organic material); nitrous oxide (nitrogenated fertilizers and <strong>the</strong> chemical <strong>in</strong>dustry);and certa<strong>in</strong> <strong>in</strong>dustrial gases with halogen bases. The higher concentration <strong>of</strong> <strong>the</strong>se gases producesa gradual warm<strong>in</strong>g <strong>of</strong> <strong>the</strong> Earth’s surface, chang<strong>in</strong>g <strong>the</strong> dynamic <strong>of</strong> <strong>the</strong> oceans and <strong>the</strong> atmosphere. It ispredicted that such changes will have various harmful effects. Ecosystems and human activity are adaptedto <strong>the</strong> current climate, and <strong>the</strong> predicted climate change will be much quicker than <strong>the</strong> capacity <strong>of</strong> natureor humanity to adapt.In 1988, <strong>the</strong> Intergovernmental Panel on Climate Change (IPCC) was created by <strong>the</strong> United Nations to assess<strong>the</strong> state <strong>of</strong> human knowledge about climate change, <strong>in</strong>clud<strong>in</strong>g scientific questions, impact estimates andpossible response strategies. After <strong>the</strong> 1990 report, <strong>the</strong> rapid advance <strong>of</strong> knowledge about <strong>the</strong> topic madecont<strong>in</strong>uous reevaluation necessary. New reports were published <strong>in</strong> 1995, 2001 and 2007, and ano<strong>the</strong>r isplanned for 2013. The first report (1990) recorded an <strong>in</strong>crease <strong>in</strong> <strong>the</strong> concentration <strong>of</strong> carbon dioxide <strong>in</strong> <strong>the</strong>atmosphere and predicted that <strong>the</strong> average global surface temperature would <strong>in</strong>crease by about 3º C <strong>in</strong>2100. The report also predicted that ano<strong>the</strong>r decade would pass before climate change could be detected.The latest IPCC report <strong>in</strong> 2007 stated that man-made climate change had been unequivocally detected.Given that climate change <strong>in</strong>cludes natural effects (volcanic eruptions, solar variation, and El Niño), it is necessaryto separate <strong>the</strong>se out by us<strong>in</strong>g ma<strong>the</strong>matical models. Current models and <strong>the</strong> <strong>in</strong>creas<strong>in</strong>g <strong>in</strong>tensity <strong>of</strong>climate change allowed climate simulations for <strong>the</strong> past century. Compar<strong>in</strong>g <strong>the</strong>se with actual observationmakes it possible to separate natural causes from human-<strong>in</strong>duced climate change.The cause-and-effect cha<strong>in</strong> <strong>in</strong> <strong>the</strong> climate system starts with human decisions and actions, which lead to<strong>the</strong> emission <strong>of</strong> greenhouse gases. Increas<strong>in</strong>g concentrations <strong>of</strong> <strong>the</strong>se gases <strong>in</strong> <strong>the</strong> atmosphere leads towarm<strong>in</strong>g, higher temperatures, local and regional impacts from climate change and <strong>the</strong> associated harmful
90 Ethanol and Bioelectricity <strong>Sugarcane</strong> <strong>in</strong> <strong>the</strong> <strong>Future</strong> <strong>of</strong> <strong>the</strong> <strong>Energy</strong> <strong>Matrix</strong>effects. The relationship between emissions and <strong>the</strong> <strong>in</strong>crease <strong>in</strong> concentrations is dictated by <strong>the</strong> averagelifetime <strong>of</strong> each gas <strong>in</strong> <strong>the</strong> atmosphere. The relationship between <strong>the</strong> <strong>in</strong>crease <strong>in</strong> concentrations and <strong>the</strong> radiativestrength is a function <strong>of</strong> <strong>the</strong> properties <strong>of</strong> each gas. The relationship between <strong>the</strong> radiative strengthand <strong>the</strong> temperature <strong>in</strong>crease is determ<strong>in</strong>ed by <strong>the</strong> climatic sensitivity, which is <strong>the</strong> average <strong>in</strong>crease <strong>in</strong>surface temperature each time <strong>the</strong> carbon dioxide concentration is doubled, and by <strong>the</strong> timescale <strong>of</strong> <strong>the</strong>vertical transfer <strong>of</strong> heat <strong>in</strong> <strong>the</strong> oceans. There is a complex relationship between temperature <strong>in</strong>crease and<strong>the</strong> local and regional impacts <strong>of</strong> climate change, and as a consequence <strong>the</strong> harmful effects, but we cansay that it is a monotonically <strong>in</strong>creas<strong>in</strong>g function <strong>of</strong> <strong>the</strong> rise <strong>in</strong> temperature.We <strong>the</strong>refore know that stabiliz<strong>in</strong>g <strong>the</strong> temperature requires stabilization <strong>of</strong> <strong>the</strong> atmospheric concentration<strong>of</strong> greenhouse gases, which <strong>in</strong> turn requires stabiliz<strong>in</strong>g net anthropogenic emissions. “Net emissions” is aconcept that takes <strong>in</strong>to account <strong>the</strong> removal <strong>of</strong> carbon dioxide from <strong>the</strong> atmosphere, which is consideredas negative emissions. The only greenhouse gas that lends itself to anthropogenic removal is carbon dioxide,which can be removed from <strong>the</strong> atmosphere by plant<strong>in</strong>g trees, or through capture and geologicalstorage (<strong>in</strong> oil and gas wells or <strong>in</strong> sal<strong>in</strong>e aquifers), or by seed<strong>in</strong>g <strong>the</strong> oceans with iron salts. These last twotechnologies are still under development. Given a temporal pr<strong>of</strong>ile <strong>of</strong> future emissions, this correspondsto a s<strong>in</strong>gle pr<strong>of</strong>ile <strong>of</strong> <strong>in</strong>creas<strong>in</strong>g concentration and a s<strong>in</strong>gle pr<strong>of</strong>ile <strong>of</strong> ris<strong>in</strong>g temperature. The <strong>in</strong>verse is nottrue, however – <strong>the</strong>re is more than one possible emissions pr<strong>of</strong>ile that can achieve <strong>the</strong> same temperature<strong>in</strong>crease. In this case, <strong>the</strong> tendency is to look for <strong>the</strong> emissions pr<strong>of</strong>ile that corresponds to <strong>the</strong> lowest possiblecost for <strong>the</strong> same result.Reactions to climate changeOur knowledge about climate change has evolved slowly and gradually s<strong>in</strong>ce 1990. In parallel, societyhas become more aware and <strong>the</strong>re have been more positive actions from governments, bus<strong>in</strong>esses and<strong>in</strong>dividuals. The possible reactions – <strong>in</strong> addition <strong>of</strong> course to <strong>in</strong>action – are mitigation and adaptation. Mitigationcomprises actions to reduce net anthropogenic emissions <strong>of</strong> greenhouse gases. Adaptation relatesto measures that reduce <strong>the</strong> harmful impacts <strong>of</strong> climate change. The preferred comb<strong>in</strong>ation <strong>of</strong> <strong>in</strong>action,mitigation, and adaptation can be summarized as <strong>the</strong> choice <strong>of</strong> a tolerable limit for climate change.React<strong>in</strong>g to <strong>the</strong> first IPCC report, <strong>the</strong> UN General Assembly <strong>in</strong> 1990 established a negotiat<strong>in</strong>g process thatculm<strong>in</strong>ated <strong>in</strong> 1992 with <strong>the</strong> adoption <strong>of</strong> <strong>the</strong> text <strong>of</strong> a convention. In force s<strong>in</strong>ce 1994, this convention setsas a goal <strong>the</strong> stabilization <strong>of</strong> atmospheric greenhouse gas concentrations at a safe level, although it didnot specify this value. The convention also embodied <strong>the</strong> pr<strong>in</strong>ciple that all countries share a responsibilitythat is common, but differentiated <strong>in</strong> function by <strong>the</strong>ir respective capacities for action. At <strong>the</strong> first Conference<strong>of</strong> <strong>the</strong> Parties to <strong>the</strong> Convention (COP-1), <strong>in</strong> 1995, <strong>the</strong> assessment was that <strong>the</strong> commitments made by<strong>in</strong>dustrialized countries were <strong>in</strong>adequate to reach <strong>the</strong>ir goal <strong>of</strong> stabiliz<strong>in</strong>g <strong>the</strong> concentration <strong>of</strong> greenhousegases <strong>in</strong> <strong>the</strong> atmosphere. This led to a mandate to negotiate what became <strong>the</strong> Kyoto Protocol, adopted <strong>in</strong>1997 and <strong>in</strong> force s<strong>in</strong>ce 2005.
Contribution <strong>of</strong> Ethanol to Climate Change91In essence, <strong>the</strong> Kyoto Protocol established limits for national aggregate emissions for <strong>in</strong>dustrialized countries,national emission mitigation programs for all countries, and carbon market mechanisms to m<strong>in</strong>imize<strong>the</strong> overall cost <strong>of</strong> emissions reductions. The first period for verification <strong>of</strong> compliance to Kyoto targets is2008-2012. Limits for <strong>the</strong> second period are now under discussion.At <strong>the</strong> same time, <strong>the</strong> 13 th Conference <strong>of</strong> <strong>the</strong> Parties to <strong>the</strong> Convention (COP-13) <strong>in</strong> Bali, Indonesia, adopteda two-year plan <strong>of</strong> action generat<strong>in</strong>g decisions relat<strong>in</strong>g to an agreement that would be adopted at <strong>the</strong> COP-15 <strong>in</strong> Copenhagen at <strong>the</strong> end <strong>of</strong> 2009. This would be broader than <strong>the</strong> Kyoto Protocol and would seek toachieve <strong>the</strong> goal <strong>of</strong> <strong>the</strong> Convention, stabiliz<strong>in</strong>g atmospheric concentrations <strong>of</strong> greenhouse gases iii .The <strong>in</strong>ternational negotiation process, tak<strong>in</strong>g place under <strong>the</strong> aegis <strong>of</strong> <strong>the</strong> Kyoto Protocol, is mov<strong>in</strong>g todef<strong>in</strong>e new emissions limits for <strong>in</strong>dustrialized countries through 2020. It is reasonable to assume that <strong>the</strong>sevalues will be def<strong>in</strong>ed only at <strong>the</strong> end <strong>of</strong> <strong>the</strong> o<strong>the</strong>r front <strong>the</strong> negotiations. The limits under <strong>the</strong> Kyoto Protocolare also important because <strong>the</strong>y will have a direct impact on <strong>the</strong> market value <strong>of</strong> carbon credits underClean Development Mechanism (CDM).On <strong>the</strong> o<strong>the</strong>r front <strong>of</strong> <strong>the</strong> negotiations, under <strong>the</strong> aegis <strong>of</strong> <strong>the</strong> Convention but outside <strong>the</strong> scope <strong>of</strong> <strong>the</strong>Kyoto Protocol, <strong>the</strong> goal is to establish a longer-term regime that could lead to meet<strong>in</strong>g <strong>the</strong> goal <strong>of</strong> <strong>the</strong>Convention. Although <strong>the</strong> goal <strong>of</strong> <strong>the</strong> Convention mentions <strong>the</strong> stabilization <strong>of</strong> greenhouse gas concentrations<strong>in</strong> <strong>the</strong> atmosphere, <strong>the</strong> tendency today is to look for a limit to temperature <strong>in</strong>crease – a variable thatis more directly related to <strong>the</strong> magnitude <strong>of</strong> <strong>the</strong> harmful impacts <strong>of</strong> climate change. Also, as we have seen,<strong>the</strong>re is more than one temporal pr<strong>of</strong>ile for concentrations and emissions that generates <strong>the</strong> same result.This <strong>in</strong>troduces an additional degree <strong>of</strong> flexibility and <strong>the</strong>refore tends to m<strong>in</strong>imize <strong>the</strong> costs <strong>of</strong> mitigation.Although <strong>the</strong> <strong>of</strong>ficial negotiations take place <strong>in</strong> <strong>the</strong> Conferences <strong>of</strong> <strong>the</strong> Parties to <strong>the</strong> Convention, severalhigh level meet<strong>in</strong>gs tend to <strong>in</strong>clude <strong>the</strong> question <strong>of</strong> climate change on <strong>the</strong>ir agendas, seek<strong>in</strong>g to build <strong>the</strong>consensus that is necessary for <strong>the</strong> success <strong>of</strong> <strong>the</strong> <strong>of</strong>ficial conferences. The most recent such meet<strong>in</strong>g was<strong>the</strong> Major Economies Forum (MEF). This saw consensus between <strong>the</strong> 14 participat<strong>in</strong>g countries that climatechange should be limited to a temperature <strong>in</strong>crease <strong>of</strong> 2º C at <strong>the</strong> end <strong>of</strong> <strong>the</strong> century.A limit for <strong>the</strong> <strong>in</strong>crease <strong>in</strong> temperature (for example, 2º C) would imply <strong>the</strong> need to reduce net global anthropogenicemissions <strong>of</strong> greenhouse gas by approximately 60% <strong>in</strong> comparison to 1990 levels. As a firstsuggestion, <strong>the</strong> ma<strong>in</strong> <strong>in</strong>dustrialized countries <strong>in</strong> <strong>the</strong> G8 (<strong>in</strong>clud<strong>in</strong>g <strong>the</strong> European Union) at <strong>the</strong> same eventoutl<strong>in</strong>ed an effort to reduce <strong>the</strong>ir emissions by 80%, so allow<strong>in</strong>g develop<strong>in</strong>g nations to act more slowly.Although <strong>the</strong>se projections made four decades <strong>in</strong> advance are subject to many uncerta<strong>in</strong>ties, and still havenot been adopted, <strong>the</strong>y po<strong>in</strong>t to an important change <strong>in</strong> <strong>the</strong> global energy matrix with impacts for allcountries.
92 Ethanol and Bioelectricity <strong>Sugarcane</strong> <strong>in</strong> <strong>the</strong> <strong>Future</strong> <strong>of</strong> <strong>the</strong> <strong>Energy</strong> <strong>Matrix</strong>Bi<strong>of</strong>uels; Ethanol <strong>in</strong> Brazil and Climate ChangeGlobal studies (Pacala 2004) show that renewable bi<strong>of</strong>uels are a necessary part <strong>of</strong> this transformation. It willnot be possible to reach <strong>the</strong> desired goal for limit<strong>in</strong>g <strong>the</strong> <strong>in</strong>crease <strong>in</strong> temperature without a significant <strong>in</strong>crease<strong>in</strong> <strong>the</strong> participation <strong>of</strong> renewable bi<strong>of</strong>uels <strong>in</strong> <strong>the</strong> new energy matrix.It is <strong>in</strong>terest<strong>in</strong>g to consider <strong>the</strong> impact on global temperature <strong>in</strong>crease caused by <strong>the</strong> <strong>in</strong>troduction <strong>in</strong> Brazil <strong>of</strong>fuel ethanol to replace gasol<strong>in</strong>e. To do this we must first establish a basel<strong>in</strong>e. It has been common to use as abasel<strong>in</strong>e a “bus<strong>in</strong>ess as usual” scenario that corresponds to what would occur if no action were taken to reduceemissions. This emissions scenario is adopted by <strong>the</strong> IPCC and is based on demographic projections, <strong>the</strong><strong>in</strong>tensity <strong>of</strong> energy use and <strong>the</strong> technology used for its generation. This is done for <strong>the</strong> whole world, althoughit may sometimes be compiled regionally. In <strong>the</strong> case <strong>of</strong> <strong>in</strong>dividual projects, such as those <strong>in</strong> <strong>the</strong> CDM, <strong>the</strong>basel<strong>in</strong>e is constructed us<strong>in</strong>g an approved methodology that seeks to establish <strong>the</strong> most plausible scenario.The “bus<strong>in</strong>ess as usual” (BAU) basel<strong>in</strong>e scenarios are hypo<strong>the</strong>tical, or counterfactual – future scenarios thatcould happen, but have not happened – and <strong>the</strong>refore are not subject to objective demonstration or verification.Fur<strong>the</strong>rmore, <strong>the</strong>se scenarios lend <strong>the</strong>mselves to manipulation.The only way to avoid <strong>the</strong>se problems is to adopt a fixed and measurable reference. The trend <strong>in</strong> <strong>the</strong> Conventionand especially <strong>in</strong> <strong>the</strong> Kyoto Protocol is to adopt 1990 emissions as <strong>the</strong> fixed reference. The abovementionedneed to reduce global emissions by 60% refers to 1990 levels.Figure 1Increase <strong>in</strong> <strong>the</strong> average global surface temperature result<strong>in</strong>g from <strong>the</strong> use <strong>of</strong> ethanoland gasol<strong>in</strong>e <strong>in</strong> Brazil: 1990 to 2030 In ºC0.0020.00150.0010.000501980 2000 2020 2040 2060 2080 2100ReferenceReal and projectedReference: volume <strong>of</strong> ethanol held constant at 1990 level, from 1990 to 2030. Real and project: real consumption (1990-2008) and projected (2008-2030).
Contribution <strong>of</strong> Ethanol to Climate Change93Us<strong>in</strong>g 1990 as a base year – it has been adopted as a benchmark <strong>in</strong> <strong>in</strong>ternational negotiations – we cancalculate <strong>the</strong> contribution to climate change result<strong>in</strong>g from <strong>the</strong> use <strong>of</strong> Type A gasol<strong>in</strong>e and ethanol for acerta<strong>in</strong> period, for example, between 1990 and 2030. This benchmark implies hold<strong>in</strong>g constant dur<strong>in</strong>g <strong>the</strong>period <strong>the</strong> volume <strong>of</strong> ethanol produced <strong>in</strong> 1990 (11.8 million cubic meters), with <strong>the</strong> fuel consumption <strong>of</strong>Otto Cycle eng<strong>in</strong>es be<strong>in</strong>g complemented by gasol<strong>in</strong>e up to <strong>the</strong> levels <strong>of</strong> real demand for 1990-2008 andprojected demand for 2008-2030 (EPE 2007). Based on this benchmark we can calculate <strong>the</strong> effect <strong>of</strong>ethanol, measured by consumption <strong>of</strong> ethanol and gasol<strong>in</strong>e (real, from 1990 to 2008, and projected from2008 to 2030).Figure 1 shows <strong>the</strong> <strong>in</strong>crease <strong>in</strong> <strong>the</strong> average global surface temperature, <strong>in</strong>dicat<strong>in</strong>g <strong>the</strong> magnitude <strong>of</strong> climatechange from that date. Figure 2 shows <strong>the</strong> <strong>in</strong>crease <strong>in</strong> <strong>the</strong> atmospheric concentration <strong>of</strong> carbon dioxide.The calculation takes <strong>in</strong>to account <strong>the</strong> emissions relat<strong>in</strong>g to ethanol and gasol<strong>in</strong>e (as shown <strong>in</strong> Table 5),<strong>the</strong> dynamics <strong>of</strong> <strong>the</strong> process <strong>of</strong> CO 2absorption by <strong>the</strong> Earth, and <strong>the</strong> result <strong>of</strong> global warm<strong>in</strong>g itself <strong>in</strong> <strong>the</strong><strong>in</strong>crease <strong>of</strong> temperature.The forecast horizon is 2100, which is <strong>the</strong> year normally adopted by <strong>the</strong> IPCC and <strong>in</strong> political negotiationsabout <strong>the</strong> future regime <strong>of</strong> climate change. Note that we have used only <strong>of</strong>ficial data to <strong>the</strong> horizon forwhich <strong>the</strong>y are available (2030), to avoid any pre-judgment <strong>of</strong> what will happen after that date (zero emissionsfrom 2030 to 2100). Interest<strong>in</strong>gly, while Brazil’s National Climate Change Plan (PNMC) provides formitigation measures, and thus for limit<strong>in</strong>g greenhouse gas emissions, <strong>the</strong> government’s detailed energyplan foresees <strong>the</strong> resumption <strong>of</strong> exponential growth <strong>in</strong> Type C gasol<strong>in</strong>e consumption as <strong>of</strong> 2020, ma<strong>in</strong>ta<strong>in</strong><strong>in</strong>ga constant ratio between consumption <strong>of</strong> ethanol and Type C gasol<strong>in</strong>e. It does not <strong>in</strong>clude <strong>the</strong> proportional<strong>in</strong>crease <strong>in</strong> ethanol consumption that would seem to be compatible with <strong>the</strong> goals <strong>of</strong> <strong>the</strong> PNMC.Figure 2Impact on <strong>the</strong> concentration <strong>of</strong> CO 2<strong>in</strong> <strong>the</strong> atmosphere result<strong>in</strong>g from <strong>the</strong> use <strong>of</strong>ethanol and gasol<strong>in</strong>e <strong>in</strong> Brazil 1990 to 2030 Concentration <strong>of</strong> CO 2<strong>in</strong> PPM0,400,350,300,250,200,150,100,0501980 2000 2020 2040 2060 2080 2100ReferenceReal and projectedReference: volume <strong>of</strong> ethanol held constant at 1990 level, from 1990 to 2030. Real and project: real consumption (1990-2008) and projected (2008-2030).
94 Ethanol and Bioelectricity <strong>Sugarcane</strong> <strong>in</strong> <strong>the</strong> <strong>Future</strong> <strong>of</strong> <strong>the</strong> <strong>Energy</strong> <strong>Matrix</strong>Prospects for <strong>in</strong>ternational negotiationsThe trends <strong>in</strong> <strong>in</strong>ternational negotiations are:. Limit<strong>in</strong>g temperature <strong>in</strong>crease <strong>in</strong> 2100 to 2º C;. Industrialized countries reduce emissions by 80%, compared to 1990 levels;. Emerg<strong>in</strong>g countries reduce emissions <strong>in</strong> comparison to current trend;. Special consideration for least developed countries.Physical considerations allow us to state that, to achieve temperature stabilization, we must first stabilize <strong>the</strong>concentration <strong>of</strong> carbon dioxide (and o<strong>the</strong>r GHG) <strong>in</strong> <strong>the</strong> atmosphere. To stabilize <strong>the</strong> concentration <strong>of</strong> carbondioxide <strong>in</strong> <strong>the</strong> atmosphere, it will be necessary to reduce net anthropogenic emissions to a level 60% belowthat recorded <strong>in</strong> 1990. This reason<strong>in</strong>g allows us to estimate <strong>the</strong> level <strong>of</strong> emissions possible <strong>in</strong> develop<strong>in</strong>g countriesthat, taken toge<strong>the</strong>r with <strong>the</strong> 80% reduction <strong>in</strong> emissions <strong>of</strong> <strong>in</strong>dustrialized countries, will result <strong>in</strong> a 60%reduction <strong>in</strong> global emissions. Given that emissions from <strong>in</strong>dustrialized countries represented three-quarters<strong>of</strong> global emissions <strong>in</strong> 1990; <strong>the</strong> proposals under consideration today lead us to conclude that emerg<strong>in</strong>gcountries must limit <strong>the</strong>ir emissions to 1990 levels.There are no <strong>in</strong>dications <strong>of</strong> how to divide this limit amongst emerg<strong>in</strong>g countries. Assum<strong>in</strong>g, however, for purposes<strong>of</strong> illustration, that each country acts <strong>in</strong>dividually, we can conclude that Brazil should adopt measures <strong>in</strong>its national plann<strong>in</strong>g to stabilize emissions at 1990 levels. <strong>Energy</strong> plann<strong>in</strong>g <strong>in</strong> its current form does not <strong>in</strong>dicatemeasures <strong>in</strong> this manner, and it is <strong>the</strong>refore reasonable to assume that this plann<strong>in</strong>g needs to be revised tomatch <strong>the</strong> declared objectives <strong>of</strong> national policy and <strong>the</strong> PNMC.The options for limit<strong>in</strong>g greenhouse gas emissions can, <strong>in</strong> general, be classified <strong>in</strong> three ma<strong>in</strong> groups:i Regulatory policies and measures that require <strong>the</strong> adoption <strong>of</strong> certa<strong>in</strong> practices, for example energy efficiencystandards, <strong>the</strong> outright prohibition <strong>of</strong> certa<strong>in</strong> practices, and so on. In general, measures like <strong>the</strong>se tend to be<strong>the</strong> least efficient because <strong>the</strong>y <strong>in</strong>crease <strong>the</strong> cost to society <strong>of</strong> measures to conta<strong>in</strong> emissions;II Fiscal measures, rang<strong>in</strong>g from a tax on greenhouse gas emissions – a “carbon tax” – to tax <strong>in</strong>centives (effectivelynegative taxes) and <strong>the</strong> provision <strong>of</strong> credit on favorable terms for enterprises that result <strong>in</strong> reducedemissions;III Mechanisms to limit and trade emissions (cap-and-trade), under which <strong>the</strong> imposition <strong>of</strong> emission limits is accompaniedby <strong>the</strong> preparation <strong>of</strong> certificates that allow for emissions at levels compatible with <strong>the</strong> desired limits,coupled with permission to trade such certificates. This system is currently used <strong>in</strong> <strong>the</strong> European Union, where itis known as <strong>the</strong> European Union Emissions Trad<strong>in</strong>g System. Under certa<strong>in</strong> conditions to control emissions fromstationary sources, with available technology, this scheme can result <strong>in</strong> m<strong>in</strong>imiz<strong>in</strong>g costs for society as a whole,because <strong>the</strong> market is responsible for ensur<strong>in</strong>g that reductions will occur where <strong>the</strong>ir marg<strong>in</strong>al costs are lowest.
Contribution <strong>of</strong> Ethanol to Climate Change95There is also an <strong>in</strong>novative tendency to comb<strong>in</strong>e <strong>the</strong> second and third approaches, as for example <strong>in</strong> <strong>the</strong>Waxmann-Markey Bill, approved by <strong>the</strong> U.S. House <strong>of</strong> Representatives, where permits are auctioned ra<strong>the</strong>rthan handed out free. Brazil’s Secretary for Economic Policy at <strong>the</strong> M<strong>in</strong>istry <strong>of</strong> F<strong>in</strong>ance has expressed <strong>in</strong>terest<strong>in</strong> this model.In addition to <strong>the</strong> debates about global targets for temperature <strong>in</strong>crease (and thus for overall emissions),<strong>the</strong> allocation <strong>of</strong> <strong>the</strong>se targets amongst countries or groups <strong>of</strong> countries, and <strong>the</strong> list <strong>of</strong> possible domesticpolicies to be adopted by countries <strong>in</strong> general and Brazil <strong>in</strong> particular, two o<strong>the</strong>r questions rema<strong>in</strong>. Onerelates to <strong>in</strong>ternational mechanisms by which emissions limitations can be re-allocated among countries –<strong>the</strong> <strong>in</strong>ternational carbon trade; <strong>the</strong> o<strong>the</strong>r is <strong>the</strong> relative competitiveness <strong>of</strong> Brazil.The <strong>in</strong>ternational debate about <strong>the</strong> <strong>in</strong>ternational carbon market is still extremely limited. The exist<strong>in</strong>g mechanismwith<strong>in</strong> <strong>the</strong> ambit <strong>of</strong> <strong>the</strong> Kyoto Protocol, <strong>the</strong> Clean Development Mechanism, has its limitations, <strong>in</strong>particular with respect to renewable energy and ethanol.As for <strong>in</strong>ternational targets, <strong>the</strong>se need to be adopted uniformly, <strong>in</strong>clud<strong>in</strong>g Ch<strong>in</strong>a and India, <strong>in</strong> order toprotect <strong>the</strong> competitiveness <strong>of</strong> Brazilian <strong>in</strong>dustry.Brazil’s advantages, such as its relatively clean energy matrix, should also be <strong>in</strong>corporated. It is necessary toquantify and transfer this <strong>in</strong> order for it to be translated <strong>in</strong>to advantages <strong>in</strong> <strong>in</strong>ternational trade.
96 Ethanol and Bioelectricity <strong>Sugarcane</strong> <strong>in</strong> <strong>the</strong> <strong>Future</strong> <strong>of</strong> <strong>the</strong> <strong>Energy</strong> <strong>Matrix</strong>4. Bibliography. Amaral, W. A. N. et al. Environmental Susta<strong>in</strong>ability <strong>of</strong> <strong>Sugarcane</strong> Ethanol <strong>in</strong> Brazil, <strong>in</strong> “<strong>Sugarcane</strong> Ethanol: Contributionsto Climate Change Mitigation and <strong>the</strong> Environment. Ed. Peter Zuurbier, Jos van de Vooren; Wagen<strong>in</strong>genAcademic Publishers, 2008.. Cepea 2007. Cenários (<strong>of</strong>erta e demanda) para o setor de cana-de-açúcar. Cepea, Piracicaba, 2007 (Reservado).. Cetesb 2008. Relatório da Qualidade do ar no Estado de São Paulo – 2007. Governo do Estado de São Paulo, Secretariado Meio Ambiente.. EPE 2007. Plano Nacional de Energia 2030. Empresa de Planejamento Energético, MME, 2007.. Fischedick 2008. Mitigation Potential, Cost <strong>of</strong> Renewable <strong>Energy</strong> Systems and Costs <strong>of</strong> Transition.. Fischedick, M.; <strong>in</strong> IPCC Scop<strong>in</strong>g Meet<strong>in</strong>g on Renewable <strong>Energy</strong> Sources. Proceed<strong>in</strong>gs; Lubeck, January 2008).. IEA 2008. <strong>Energy</strong> Technology Perspectives 2008: Scenarios and Strategies for 2050. International <strong>Energy</strong> Agency,OECD/IEA, 2008.. IE-UFRJ 2006. Matriz Brasileira de Biocombustíveis. Proj. NAE-CGEE/IE-UFRJ, GEE. Instituto de Economia, UFRJ, Dec 2006.. IPCC 2007-a. Technical Summary. In: Climate Change 2007: Mitigation. Contribution <strong>of</strong> Work<strong>in</strong>g Group III to <strong>the</strong>Fourth Assessment Report <strong>of</strong> <strong>the</strong> Intergovernmental Panel on Climate Change [B. Metz, O. R. Davidson, P. R. Bosch, R.Dave, L. A. Meyer (eds)], Cambridge University Press, Cambridge, United K<strong>in</strong>gdom and New York, NY, USA.. IPCC 2007-b. R.E.H. Sims et al; <strong>Energy</strong> supply. In Climate Change 2007: Mitigation. Contribution <strong>of</strong> Work<strong>in</strong>g Group IIIto <strong>the</strong> Fourth Assessment Report <strong>of</strong> <strong>the</strong> IPCC [B. Metz, O.R. Davidson, P.R. Bosch, R. Dave, L.A. Meyer (eds)], CambridgeUniversity Press, Cambridge, United K<strong>in</strong>gdom and New York, NY, USA.. IPCC 2007-c. Kahn Ribeiro, S. et al. Transport and its Infrastructure. In Climate Change 2007: Mitigation. Contribution<strong>of</strong> Work<strong>in</strong>g Group III to <strong>the</strong> Fourth Assessment Report <strong>of</strong> <strong>the</strong> IPCC [B. Metz, O.R. Davidson, P.R. Bosch, R. Dave, L.A.Meyer (eds)], Cambridge University Press, Cambridge, United K<strong>in</strong>gdom and New York, NY, USA.. Joseph Jr, H. The use <strong>of</strong> ethanol blends as regular fuel for exist<strong>in</strong>g vehicular fleets. Report for <strong>the</strong> Brazilian EthanolMission to Japan, UNICA–COIMEX, 2005.. Macedo, I. C. The sugarcane agro-<strong>in</strong>dustry and its contribution to reduc<strong>in</strong>g CO 2emissions <strong>in</strong> Brazil. Biomass andBioenergy 1992; 3, pp. 77-80.. Macedo, I. C.; Seabra, J. E. A. ; Silva, J. E. A. R.; Greenhouse gases emissions <strong>in</strong> <strong>the</strong> production and use <strong>of</strong> ethanol fromsugarcane <strong>in</strong> Brazil: <strong>the</strong> 2005/2006 averages and a prediction for 2020. Biomass and Bioenergy (2008), doi:10.1016/j.biombioe.2007.12.006.. Macedo, I. C. GHG mitigation and cost analyses for expanded production and use <strong>of</strong> ethanol fuel <strong>in</strong> Brazil. F<strong>in</strong>al Report,Center for Clean Air Policy – CCAP, Wash<strong>in</strong>gton DC, July 2008.. Macedo, I. C. and Seabra, J. E. A. Mitigation <strong>of</strong> GHG emissions us<strong>in</strong>g sugarcane bioethanol; <strong>in</strong> “<strong>Sugarcane</strong> ethanol:Contributions to Climate Change Mitigation and <strong>the</strong> Environment. Ed Peter Zuurbier, Jos van de Vooren; Wagen<strong>in</strong>genAcademic Publishers, 2008.. McK<strong>in</strong>sey 2009. Pathways for a low carbon economy – Version 2 <strong>of</strong> <strong>the</strong> Global GHG abatment cost curve, McK<strong>in</strong>sey& Company, 2009.. Mapa 2007. Projeções do Agronegócio – Mundo e Brasil, 2006/07 to 2017/18. M<strong>in</strong>istério da Agricultura, Pecuária eAbastecimento (Mapa), Assessoria de Gestão Estratégica. December 2007.
Contribution <strong>of</strong> Ethanol to Climate Change97. Nassar, A. M. et al. Prospects <strong>of</strong> <strong>the</strong> sugarcane expansion <strong>in</strong> Brazil: impacts on direct and <strong>in</strong>direct land-use change;<strong>Sugarcane</strong> ethanol: contributions to climate change mitigation and <strong>the</strong> environment. Ed Peter Zuurbier, Jos van deVooren; Wagen<strong>in</strong>gen Academic Publishers, 2008.. Pacala, S.; Socolow, R.. Stabilization wedges: solv<strong>in</strong>g <strong>the</strong> climate problem for <strong>the</strong> next 50 years with current technologies.Science, Vol. 305, Issue 5686, pp. 968-972, August 13, 2004.. UNICA 2008. Citado por R. Rodrigues, Cenários e Respostas para a Agroenergia, São Paulo, 23/09/2008.. Seabra, J. E. A. Avaliação técnico-economica de opções para o aproveitamento <strong>in</strong>tegral da biomassa da cana no Brasil.Tese de doutorado, Unicamp, FEM – Planejamento de Sistemas Energéticos, July 2008.. World <strong>Energy</strong> Outlook 2008; International <strong>Energy</strong> Agency, OECD/IEA 2008. World <strong>Energy</strong> Outlook 2008-a. Tanaka, N. World <strong>Energy</strong> Outlook 2008: Options for a cleaner, smarter energy future.UNCCC, Poznan, Dec 2008.Explanatory NotesiSources: WEO 2008, EPA data for <strong>the</strong> IEA, IEA databases and IPCC 2007.iiImage, Ipac, AIM and Message.iiiThis study was concluded before <strong>the</strong> COP-15 meet<strong>in</strong>g <strong>in</strong> Copenhagen.
98 Ethanol and Bioelectricity <strong>Sugarcane</strong> <strong>in</strong> <strong>the</strong> <strong>Future</strong> <strong>of</strong> <strong>the</strong> <strong>Energy</strong> <strong>Matrix</strong>04
Ethanol and Bioelectricity <strong>Sugarcane</strong> <strong>in</strong> <strong>the</strong> <strong>Future</strong> <strong>of</strong> <strong>the</strong> <strong>Energy</strong> <strong>Matrix</strong>99Ethanol and HealthPaulo Hilário Nascimento SaldivaMaria de Fátima AndradeSimone Georges El Khouri MiragliaPaulo Afonso de André
100 Ethanol and Bioelectricity <strong>Sugarcane</strong> <strong>in</strong> <strong>the</strong> <strong>Future</strong> <strong>of</strong> <strong>the</strong> <strong>Energy</strong> <strong>Matrix</strong>This study shows that even a partial substitution <strong>of</strong> petroleum derivatives by ethanol <strong>in</strong> <strong>the</strong>vehicle fleet <strong>in</strong> <strong>the</strong> São Paulo metropolitan region would save hundreds <strong>of</strong> lives and preventthousands <strong>of</strong> hospitalizations, sav<strong>in</strong>g public c<strong>of</strong>fers hundreds <strong>of</strong> millions <strong>of</strong> dollars.The impacts <strong>of</strong> air pollution on health are well known <strong>in</strong> <strong>the</strong> scientific community. Fuel replacementis equivalent to a reduction <strong>in</strong> ozone formation (ethanol <strong>in</strong>stead <strong>of</strong> gasol<strong>in</strong>e) andparticulate emissions (ethanol <strong>in</strong>stead <strong>of</strong> diesel). Fur<strong>the</strong>rmore, <strong>the</strong> use <strong>of</strong> ethanol reducesgreenhouse gas emission and helps combat global warm<strong>in</strong>g.Over 12,000 hospitalizations and 875 deaths would be avoided per year <strong>in</strong> a scenario <strong>of</strong> totaloil and diesel replacement by ethanol <strong>in</strong> Greater São Paulo. Dur<strong>in</strong>g this period, public c<strong>of</strong>ferswould save nearly US$190 million.A more realistic goal – us<strong>in</strong>g ethanol <strong>in</strong> <strong>the</strong> bus fleet – would result <strong>in</strong> <strong>the</strong> reduction <strong>of</strong> 1,350hospitalizations per year due to ailments caused by diesel-generated pollution. In this waymore than US$3.8 million would be saved each year. Also, 220 deaths would be avoided peryear, equivalent to half <strong>the</strong> number <strong>of</strong> deaths from tuberculosis <strong>in</strong> <strong>the</strong> region <strong>in</strong> 2007.
Ethanol and Health101Pollutants considered <strong>in</strong> <strong>the</strong> analysis were f<strong>in</strong>e particulate matter and ozone. These pollutantswere chosen because <strong>the</strong>y exceed <strong>the</strong> recommended limits <strong>of</strong> <strong>the</strong> World Health Organizationand are considered <strong>the</strong> ma<strong>in</strong> challenges <strong>in</strong> <strong>the</strong> area <strong>of</strong> air pollution <strong>in</strong> Brazil.Greater São Paulo was chosen for <strong>the</strong> study because <strong>of</strong> <strong>the</strong> availability <strong>of</strong> good quality observationaldata on health and <strong>the</strong> environmental. S<strong>in</strong>ce air pollution is recognized as a problemthat affects o<strong>the</strong>r densely-populated regions, <strong>the</strong> results <strong>of</strong> this study can be extrapolated too<strong>the</strong>r areas with similar characteristics.Ano<strong>the</strong>r aspect that should be emphasized is that <strong>the</strong> results are underestimated, becausehealth affects are only measured <strong>in</strong> terms <strong>of</strong> hospital admissions and mortality. This is dueto <strong>the</strong> availability <strong>of</strong> <strong>of</strong>ficial <strong>in</strong>formation. However, it is known that <strong>the</strong>se cases represent am<strong>in</strong>ority <strong>of</strong> adverse health events and do not take <strong>in</strong>to account diseases that do not requirehospital care or cause death. In o<strong>the</strong>r words, <strong>the</strong> impact is even more serious than <strong>the</strong> numberspresented <strong>in</strong> <strong>the</strong> simulation.
102 Ethanol and Bioelectricity <strong>Sugarcane</strong> <strong>in</strong> <strong>the</strong> <strong>Future</strong> <strong>of</strong> <strong>the</strong> <strong>Energy</strong> <strong>Matrix</strong>Presentation <strong>of</strong> <strong>the</strong> problemMank<strong>in</strong>d is central to prospection and market<strong>in</strong>g <strong>in</strong> <strong>the</strong> oil, gas and renewable fuels <strong>in</strong>dustry. The availability<strong>of</strong> energy that can be stored and “packaged” <strong>in</strong>to fuel tanks or gas drums has opened <strong>the</strong> way for mechanizedmobility. Hydrocarbons conta<strong>in</strong>ed <strong>in</strong> petroleum have made possible <strong>the</strong> development <strong>of</strong> new productsand compounds that have changed <strong>the</strong> format and efficiency <strong>of</strong> several items <strong>of</strong> equipments and <strong>the</strong> production<strong>of</strong> new medic<strong>in</strong>es. More importantly, <strong>the</strong> availability <strong>of</strong> energy and new compounds has allowed societyto <strong>in</strong>corporate new attitudes and patterns <strong>of</strong> consumption, creat<strong>in</strong>g habits that require ever-<strong>in</strong>creas<strong>in</strong>genergy production. These new habits have become part <strong>of</strong> daily life and any change to <strong>the</strong> energy matrix or<strong>the</strong> way that we generate and consume energy do not seem to be feasible and efficient <strong>in</strong> <strong>the</strong> short term.Changes are happen<strong>in</strong>g slowly, and are subject not only to environmental but also to economic decisions.In this scenario, we are now confronted with extremely relevant issues for <strong>the</strong> energy <strong>in</strong>dustry. In our view,<strong>the</strong> follow<strong>in</strong>g are <strong>the</strong> most important po<strong>in</strong>ts:a What are <strong>the</strong> energy alternatives that will reconcile society’s <strong>in</strong>creased energy demand with questions <strong>of</strong>efficiency, price and susta<strong>in</strong>ability? The concentration <strong>of</strong> oil and gas production <strong>in</strong> some critical regions <strong>of</strong> <strong>the</strong>planet has led to various moments <strong>of</strong> tension <strong>in</strong> recent decades, impact<strong>in</strong>g <strong>the</strong> price <strong>of</strong> <strong>the</strong>se products <strong>in</strong> <strong>the</strong> <strong>in</strong>ternationalmarket. An expanded group <strong>of</strong> feasible energy alternatives is <strong>the</strong> best antidote to <strong>the</strong>se difficulties.b What are <strong>the</strong> energy sources that imply least environmental impact, be it at a global scale (m<strong>in</strong>imiz<strong>in</strong>g <strong>the</strong>effects <strong>of</strong> climate change) or at a regional scale (m<strong>in</strong>imiz<strong>in</strong>g adverse effects <strong>of</strong> fuel production and emissions)?Global warm<strong>in</strong>g from <strong>the</strong> emission <strong>of</strong> CO 2and o<strong>the</strong>r greenhouse gases is an issue that has movedbeyond <strong>the</strong> technical sphere <strong>of</strong> academia and <strong>in</strong>dustry to impact <strong>the</strong> daily life <strong>of</strong> ord<strong>in</strong>ary people. The samecan be said for <strong>the</strong> adverse effects <strong>of</strong> vehicular emissions, which have been <strong>the</strong> object <strong>of</strong> <strong>in</strong>creas<strong>in</strong>gly restrictivepolitical control <strong>in</strong> order to safeguard human health. As a result <strong>of</strong> <strong>the</strong>se problems, created through <strong>the</strong>consumption <strong>of</strong> fossil fuels by <strong>in</strong>dustry and transportation, <strong>the</strong>re is a grow<strong>in</strong>g sentiment <strong>in</strong> society that weshould reduce pollution emissions from stationary and mobile sources, which will affect <strong>the</strong> future marketfor <strong>the</strong>se fuels. It is important to note that, at <strong>the</strong> current technological level and for most uses <strong>of</strong> oil andgas (and <strong>the</strong>ir derivatives), no significant reduction <strong>in</strong> emissions can be achieved just by technological improvement<strong>of</strong> <strong>the</strong> <strong>in</strong>dustrial process or <strong>of</strong> motor eng<strong>in</strong>eer<strong>in</strong>g. It must necessarily consider fuel compositionas a determ<strong>in</strong>ant factor. A clear example <strong>of</strong> this is diesel vehicles, where <strong>the</strong> catalytic converter technologyis dependent on <strong>the</strong> fuel formulation.c How can we transform <strong>the</strong> energy generation process <strong>in</strong>to one <strong>of</strong> <strong>the</strong> tools that helps to achieve socioeconomicequality between rich and poor nations, and also reduces social and health <strong>in</strong>equalities with<strong>in</strong> acountry? <strong>Energy</strong> production is a source <strong>of</strong> wealth. In general, <strong>the</strong> choice <strong>of</strong> new energy sources is made <strong>in</strong>terms <strong>of</strong> cost-effectiveness, determ<strong>in</strong>ed from <strong>the</strong> po<strong>in</strong>t <strong>of</strong> view <strong>of</strong> <strong>the</strong> productive process. Activities relatedto fuel production, distribution and trade produce impacts on human life. Table 1 presents a summarycomparison between <strong>the</strong> potential risks to human health due to <strong>the</strong> use <strong>of</strong> petroleum-based fuels andsome bi<strong>of</strong>uels (ethanol and biodiesel).
Ethanol and Health103The analysis <strong>in</strong> Table 1 shows that risk to human health is <strong>in</strong>evitable at every stage <strong>of</strong> fuel production. Whatmatters is choos<strong>in</strong>g <strong>the</strong> alternative with <strong>the</strong> smallest impact. It is also important to implement and develop newpractices that ensure processes have maximum susta<strong>in</strong>ability, tak<strong>in</strong>g <strong>in</strong>to account environmental, economicand social aspects (for example, <strong>the</strong> elim<strong>in</strong>ation <strong>of</strong> sugarcane burn<strong>in</strong>g prior to <strong>the</strong> harvest).The above-mentioned set <strong>of</strong> situations <strong>in</strong>dicates that mank<strong>in</strong>d and <strong>the</strong> fuel production <strong>in</strong>dustry have forgedsuch close bonds that <strong>the</strong>y have sealed <strong>the</strong>ir fate <strong>in</strong> an implicit pact. The future <strong>of</strong> mank<strong>in</strong>d depends on <strong>in</strong>creas<strong>in</strong>g<strong>the</strong> production <strong>of</strong> clean and susta<strong>in</strong>able energy sources, while <strong>the</strong> future <strong>of</strong> <strong>the</strong> energy market will dependon its ability to meet <strong>the</strong> needs <strong>of</strong> mank<strong>in</strong>d through sources that ensure climate stability, with <strong>the</strong> least possibledamage to human health, and that lead to a future with less socio-economic <strong>in</strong>equality. In o<strong>the</strong>r words, by<strong>in</strong>clud<strong>in</strong>g susta<strong>in</strong>ability and a lower risk to health and <strong>the</strong> environment, <strong>the</strong> price <strong>of</strong> new fuels will depend, <strong>in</strong><strong>the</strong> near future, on <strong>the</strong> <strong>in</strong>corporation <strong>of</strong> values that go beyond <strong>the</strong> costs <strong>of</strong> prospection, production, ref<strong>in</strong><strong>in</strong>gand distribution. The <strong>in</strong>corporation <strong>of</strong> questions related to <strong>the</strong> impact on humans <strong>of</strong> <strong>the</strong> new energy alternativesthat Brazil has adopted could add new value to <strong>the</strong>se fuels and provide <strong>in</strong>formation that may assist <strong>the</strong>strategic plann<strong>in</strong>g <strong>of</strong> energy markets <strong>in</strong> <strong>the</strong> com<strong>in</strong>g decades.Comparison <strong>of</strong> potential risks to human healthTable 1ProductionTransport andStoragePetroleumWater and soil contam<strong>in</strong>ation from productionwaste or leaksCO 2emissions (flar<strong>in</strong>g)Fugitive emissionsWork conditions: onboard work on platforms,contam<strong>in</strong>ation from chemicals present atref<strong>in</strong>eriesLeaks (dur<strong>in</strong>g transport, tanks and pipel<strong>in</strong>es)Fugitive emissionsBi<strong>of</strong>uelsWater and soil contam<strong>in</strong>ation from pesticidesand production wasteStraw burn<strong>in</strong>g (ethanol)Work conditions: exhaustion, <strong>in</strong>halation <strong>of</strong>gases and particles after straw burn<strong>in</strong>gIncreased solubility <strong>of</strong> leak plumeFugitive emissionsEmissionsAtmospheric pollutants (particles, hydrocarbons,volatile organic compounds precursor <strong>of</strong> O 3)Increased greenhouse gas emissionsAtmospheric pollutants (carbonyl compounds<strong>in</strong> <strong>the</strong> case <strong>of</strong> ethanol, NO 2and long-cha<strong>in</strong>hydrocarbons such as acrole<strong>in</strong> <strong>in</strong> biodiesel)Variable greenhouse gas emissions balance,depend<strong>in</strong>g on <strong>the</strong> grid
104 Ethanol and Bioelectricity <strong>Sugarcane</strong> <strong>in</strong> <strong>the</strong> <strong>Future</strong> <strong>of</strong> <strong>the</strong> <strong>Energy</strong> <strong>Matrix</strong>General considerations about <strong>the</strong> relation between atmospheric pollution andhuman healthThe assessment <strong>of</strong> <strong>the</strong> impact <strong>of</strong> energy sources on health requires <strong>the</strong> availability <strong>of</strong> <strong>in</strong>formation at a series<strong>of</strong> <strong>in</strong>terconnected levels, as shown <strong>in</strong> Figure 1.Each element <strong>in</strong> Figure 1 represents critical <strong>in</strong>formation for determ<strong>in</strong><strong>in</strong>g environmental risk.One key po<strong>in</strong>t is <strong>the</strong> characterization <strong>of</strong> <strong>the</strong> emission source, with its chemical composition and emissionrates. In some situations <strong>the</strong> emission source is known, as <strong>in</strong> <strong>the</strong> case <strong>of</strong> vehicular, <strong>in</strong>dustrial or agriculturalemissions. However, <strong>the</strong>re are situations <strong>in</strong> which <strong>the</strong> emission source is unknown, as <strong>in</strong> <strong>the</strong> case <strong>of</strong> surfacewater pollution <strong>in</strong> a major hydrographic bas<strong>in</strong>.We must also consider various aspects related to dispersion and reactions <strong>in</strong> <strong>the</strong> environment. Primarypollutants are those emitted directly by <strong>the</strong> source – discharge po<strong>in</strong>ts <strong>of</strong> liquid effluents, <strong>in</strong>dustrial smokestacks,automotive tail pipes, and re-suspension from <strong>the</strong> soil, for example. Secondary pollutants are produced<strong>in</strong> <strong>the</strong> environment from chemical reactions, and have primary pollutants as <strong>the</strong>ir precursors. In thisgroup ozone and secondary aerosol particles are significant.Pollutants with local effects are those with a very short average life and that affect ma<strong>in</strong>ly <strong>the</strong> area surround<strong>in</strong>g<strong>the</strong>ir source. Pollutants with mesoscale effect are those with an average life <strong>of</strong> hours or days,affect<strong>in</strong>g larger regions because <strong>the</strong>y can be carried by w<strong>in</strong>ds, convection or water. Pollutants with regionalimpacts are those that reach <strong>the</strong>ir highest concentrations many miles from <strong>the</strong>ir po<strong>in</strong>t <strong>of</strong> formation. Aero-Figure 1Algorithm for evaluation <strong>of</strong> environmental riskSourceConcentrationEmissionRemovalReactionsDoseExposure, illness,hous<strong>in</strong>gEffectComorbidities,genetic,economic levelCostSource: Adapted from Kovats and cols, 2005.
Ethanol and Health105sol particles generated by fires <strong>in</strong> <strong>the</strong> Amazon affect <strong>the</strong> Sou<strong>the</strong>ast a few days after be<strong>in</strong>g formed. Thismeans that pollutants with a regional impact are those that are formed or carried a great distance from<strong>the</strong>ir source or from <strong>the</strong> orig<strong>in</strong> <strong>of</strong> <strong>the</strong>ir precursors. Pollutants with global effects are generally atmospheric<strong>in</strong> nature, and can be carried long distances <strong>in</strong> <strong>the</strong> troposphere or reach <strong>the</strong> stratosphere via vertical convection.CH 4(methane) and CO 2(carbon dioxide) are examples <strong>of</strong> this type <strong>of</strong> pollutant, and participate <strong>in</strong>global temperature change.The physical characteristics <strong>of</strong> <strong>the</strong> source, <strong>the</strong> type <strong>of</strong> pollutant emitted and its associated emission rate,reactions that occur <strong>in</strong> <strong>the</strong> atmosphere and <strong>the</strong> phenomena <strong>of</strong> transportation and removal are all crucial todef<strong>in</strong><strong>in</strong>g <strong>the</strong> environmental concentrations <strong>of</strong> pollutants.Concentration is not <strong>the</strong> only factor that determ<strong>in</strong>es <strong>the</strong> dose received by any specific <strong>in</strong>dividual or segment<strong>of</strong> <strong>the</strong> population. Factors that significantly alter <strong>the</strong> received dose <strong>in</strong>clude <strong>the</strong> time spent near sources <strong>of</strong>atmospheric emission, <strong>the</strong> level <strong>of</strong> physical activity, comorbidities that alter absorption, metabolism or rate<strong>of</strong> absorption <strong>of</strong> environmental pollutants and socio-economic factors that alter hous<strong>in</strong>g conditions <strong>in</strong> a waythat allows greater penetration <strong>of</strong> pollutants <strong>in</strong>side homes.On <strong>the</strong> o<strong>the</strong>r hand, <strong>the</strong> adverse effects on health for a given dose <strong>of</strong> pollutants will depend on factors relatedto <strong>in</strong>dividual susceptibility. The adverse effect <strong>of</strong> environmental pollutants will be modulated by factors suchas age, nutritional state, socio-economic level, pre-exist<strong>in</strong>g diseases and polymorphism <strong>of</strong> detoxify<strong>in</strong>g genes.The effect <strong>of</strong> pollutants on health also depends on time <strong>of</strong> exposure. Depend<strong>in</strong>g on <strong>the</strong> type <strong>of</strong> pollutant, <strong>the</strong>dose and <strong>the</strong> <strong>in</strong>dividual characteristics <strong>of</strong> <strong>the</strong> subject some adverse effects are manifested acutely (hours ordays after exposure), while o<strong>the</strong>rs are seen only after long periods <strong>of</strong> exposure (<strong>the</strong> so-called chronic effects).Increases <strong>in</strong> mortality associated with situations <strong>of</strong> excessive accumulation <strong>of</strong> atmospheric pollutants is a typicalexample <strong>of</strong> <strong>the</strong> acute effects <strong>of</strong> pollutants. Indoor pollution from cigarette smoke, decreased <strong>in</strong>telligencefrom lead exposure, and most <strong>of</strong> <strong>the</strong> pollutants that cause cancer are examples <strong>of</strong> how <strong>the</strong> magnitude <strong>of</strong>health damage can be accurately assessed only after prolonged periods <strong>of</strong> exposure.It is also important to establish limits for <strong>the</strong> health effects that will be assessed. Health effects on <strong>the</strong> populationdue to exposure to ambient pollutants are varied. Intensities and latency periods are different, and<strong>in</strong>clude: behavioral and cognitive effects; pulmonary and systemic <strong>in</strong>flammation; alterations to airway caliber,vascular tone and heart rate control; reproductive changes; morbidity and mortality from cardiac and respiratorydiseases; and <strong>in</strong>creased <strong>in</strong>cidence <strong>of</strong> cancer; among o<strong>the</strong>rs. Given <strong>the</strong> multiplicity <strong>of</strong> possible outcomes, itis necessary to def<strong>in</strong>e adverse health effects <strong>in</strong> an objective way. Based on this def<strong>in</strong>ition, we can <strong>the</strong>n selectwhich events are useful to determ<strong>in</strong>e <strong>the</strong> impact that an environmental change will have on <strong>the</strong> populationthat is exposed to it.Although <strong>the</strong> concept <strong>of</strong> adverse or detrimental effects to human health is widely used to def<strong>in</strong>e measures<strong>of</strong> risk assessment or environmental management, a precise def<strong>in</strong>ition <strong>of</strong> <strong>the</strong> boundaries between a f<strong>in</strong>d<strong>in</strong>gthat is statistically significant and a change that will <strong>in</strong> fact result <strong>in</strong> relevant health effects still requires fur<strong>the</strong>rdef<strong>in</strong>ition. A description and analysis <strong>of</strong> current def<strong>in</strong>itions can be found <strong>in</strong> Annex 1.
106 Ethanol and Bioelectricity <strong>Sugarcane</strong> <strong>in</strong> <strong>the</strong> <strong>Future</strong> <strong>of</strong> <strong>the</strong> <strong>Energy</strong> <strong>Matrix</strong>The def<strong>in</strong>ition <strong>of</strong> adverse health effects must necessarily be accompanied by a characterization <strong>of</strong> <strong>the</strong> mostsusceptible groups. Increased susceptibility to pollutants depends on <strong>in</strong>dividual, hous<strong>in</strong>g and socio-economicfactors. Among those <strong>of</strong> an <strong>in</strong>dividual nature, <strong>the</strong> most important are age, associated morbidities, and geneticcharacteristics. The extremes <strong>of</strong> <strong>the</strong> age pyramid have been identified as prime targets for <strong>the</strong> adverse effects<strong>of</strong> air pollutants, especially <strong>in</strong> <strong>the</strong> segments below five and above 65 years <strong>of</strong> age. Associated morbidities suchas asthma, chronic bronchitis, a<strong>the</strong>rosclerosis, diabetes mellitus, cardiomyopathies and cardiac arrhythmiasare among <strong>the</strong> pathological conditions known to be more susceptible to air pollution effects.Liv<strong>in</strong>g conditions affect <strong>the</strong> dose received and, consequently, <strong>the</strong> susceptibility to pollutants. In large urbancenters, <strong>the</strong>re are areas where <strong>the</strong> generation and dispersion <strong>of</strong> pollutants leads to ambient pollution levelsthat are significantly higher than <strong>the</strong> urban average. Places that present a greater risk to residents are thoseadjacent to major traffic corridors, low-ly<strong>in</strong>g regions <strong>in</strong> urban centers, areas with high build<strong>in</strong>gs, and areassubject to constant traffic jams. For example, measurement <strong>of</strong> <strong>in</strong>halable f<strong>in</strong>e particulate matter carried outunder <strong>the</strong> Costa e Silva elevated highway <strong>in</strong> São Paulo showed levels three times greater than city averages.The type <strong>of</strong> construction also affects <strong>the</strong> degree <strong>of</strong> pollution penetration <strong>in</strong>side homes. Older build<strong>in</strong>gs thatlack air condition<strong>in</strong>g tend to have greater air pollution penetration. We must also take <strong>in</strong>to account thatcontributions from <strong>in</strong>ternal sources can significantly deteriorate air quality <strong>in</strong> homes. Socio-economic conditionsalso <strong>in</strong>terfere with <strong>the</strong> susceptibility to air pollutants. In São Paulo, it was shown that, given <strong>the</strong> samevariation <strong>of</strong> ambient pollution (expressed <strong>in</strong> terms <strong>of</strong> <strong>in</strong>halable particulate matter, PM10), mortality is higher<strong>in</strong> neighborhoods with worse socio-economic <strong>in</strong>dicators (Mart<strong>in</strong>s et al, 2004).Factors that determ<strong>in</strong>e <strong>the</strong> greater vulnerability <strong>of</strong> <strong>the</strong> underprivileged to air pollutants can be divided <strong>in</strong>totwo ma<strong>in</strong> categories: events related to health conditions and access to care and medication, and conditionsthat foster greater exposure to pollutants. In <strong>the</strong> first category, we know that <strong>the</strong> less fortunate segment <strong>of</strong><strong>the</strong> population has worse health due to deficient sanitation and nutrition, lack <strong>of</strong> access to medical services,and lower purchas<strong>in</strong>g power to buy medication when ill. The second category – greater exposure – has beenrecognized as a relevant factor <strong>in</strong> <strong>the</strong> relationship between air pollution and health.The relationship between social exclusion and greater exposure to pollutants occurs both at cont<strong>in</strong>ental levelsand with<strong>in</strong> <strong>in</strong>dividual communities. Dirtier <strong>in</strong>dustrial processes, vehicles with obsolete technology, and fuelswith higher concentrations <strong>of</strong> contam<strong>in</strong>ants are found more frequently <strong>in</strong> develop<strong>in</strong>g countries. To a lesserdegree, it is common with<strong>in</strong> a given community for <strong>the</strong> pr<strong>of</strong>essions that lead to greater exposure to pollutants(street workers, for example) to be performed by <strong>the</strong> most needy segments <strong>of</strong> <strong>the</strong> population. Similarly, it ismore common for disadvantaged groups to live <strong>in</strong> houses beside roads with high traffic, and to use firewoodor waste for cook<strong>in</strong>g. We can thus see that <strong>the</strong> greater vulnerability <strong>of</strong> poorer social groups to air pollution isdeterm<strong>in</strong>ed both by worse basic conditions <strong>of</strong> health and access to health <strong>in</strong>frastructure, and also by greaterexposure to pollution.
Ethanol and Health107Impacts <strong>of</strong> sugarcane ethanol production on human healthIt is appropriate to emphasize that <strong>the</strong> analysis <strong>of</strong> health effects reported <strong>in</strong> this chapter will be based on<strong>the</strong> effects <strong>of</strong> atmospheric emissions, <strong>in</strong> particular for emitted pollutants and <strong>the</strong> emission <strong>of</strong> greenhousegases. For comparative purposes, <strong>the</strong> effects observed <strong>in</strong> <strong>the</strong> case <strong>of</strong> ethanol will be compared to thosepresent <strong>in</strong> <strong>the</strong> current alternative, i.e., petroleum derivatives.Fuel production is strongly associated with air emissions that have <strong>the</strong> potential to <strong>in</strong>terfere with humanhealth. In São Paulo State, <strong>the</strong> current practice <strong>of</strong> burn<strong>in</strong>g <strong>of</strong>f sugarcane straw <strong>in</strong> order to manually harvestsugarcane has been associated with <strong>in</strong>creased morbidity caused by respiratory diseases <strong>in</strong> adults and children,and cardiovascular diseases <strong>in</strong> adults. Health effects appear to be strongly dependent on <strong>the</strong> fraction<strong>of</strong> particulate emissions, and have sufficient magnitude to constitute a significant public health problemfor those exposed to <strong>the</strong>m. As a result <strong>of</strong> <strong>the</strong>se impacts, a protocol was signed <strong>in</strong> 2007 between <strong>the</strong> EnvironmentalSecretariat <strong>of</strong> São Paulo State (SMA), and <strong>the</strong> Brazilian <strong>Sugarcane</strong> Industry Association (UNICA),establish<strong>in</strong>g a progressive reduction <strong>in</strong> plantation burn<strong>in</strong>g with a correspond<strong>in</strong>g <strong>in</strong>crease <strong>in</strong> mechanizedharvest. Accord<strong>in</strong>g to <strong>the</strong> SMA, mechanization accounted for 49.1% <strong>of</strong> <strong>the</strong> 2008-2009 harvest. Accord<strong>in</strong>gto <strong>the</strong> protocol, all areas with slopes <strong>of</strong> less than 12% will be mechanized by 2014. Vegetation cover <strong>in</strong>São Paulo will <strong>in</strong>crease as a result <strong>of</strong> reforestation <strong>in</strong> areas where <strong>the</strong> slopes are too steep for mechanizedharvest, for example along river banks.Activities related to petroleum production and ref<strong>in</strong><strong>in</strong>g are harmful to human health. Several epidemiologicalstudies have reported an <strong>in</strong>crease <strong>in</strong> cases <strong>of</strong> respiratory diseases, cardiovascular diseases and tumors(leukemia and cancers <strong>of</strong> <strong>the</strong> central nervous system) <strong>in</strong> areas near ref<strong>in</strong>eries and petrochemical plants. Recentstudies <strong>in</strong> <strong>the</strong> Paraíba Valley <strong>in</strong> São Paulo showed <strong>in</strong>creased rates <strong>of</strong> change <strong>in</strong> biomarkers <strong>in</strong> <strong>the</strong> vic<strong>in</strong>ity<strong>of</strong> <strong>the</strong> oil ref<strong>in</strong>ery, along with <strong>in</strong>creased rates <strong>of</strong> cardiovascular disease and cancer. Organic compounds <strong>in</strong><strong>the</strong> gaseous and particulate phases <strong>of</strong> emissions from ref<strong>in</strong>eries and petrochemical complexes are mutagenicand lend biological plausibility to <strong>the</strong> toxicological and epidemiological f<strong>in</strong>d<strong>in</strong>gs outl<strong>in</strong>ed above.The set <strong>of</strong> <strong>in</strong>formation concern<strong>in</strong>g <strong>the</strong> production process shows that <strong>the</strong> nature <strong>of</strong> chemical compoundsand <strong>the</strong> severity <strong>of</strong> health f<strong>in</strong>d<strong>in</strong>gs <strong>in</strong>dicate that sugarcane production is significant <strong>in</strong> terms <strong>of</strong> atmosphericemissions. This po<strong>in</strong>ts to <strong>the</strong> need to reduce or end sugarcane straw burn<strong>in</strong>g prior to harvest.Climate change and public health<strong>Sugarcane</strong> ethanol has significant advantages over petroleum-based fuels <strong>in</strong> terms <strong>of</strong> greenhouse gasemissions. This question – <strong>the</strong> health consequences <strong>of</strong> predicted climate change due to global warm<strong>in</strong>g –deserves some special consideration.Medical literature has been devot<strong>in</strong>g <strong>in</strong>creas<strong>in</strong>g attention to <strong>the</strong> potential impacts <strong>of</strong> climate change onhuman health. With<strong>in</strong> this scenario, bi<strong>of</strong>uels such as ethanol may also help reduce health impacts due
108 Ethanol and Bioelectricity <strong>Sugarcane</strong> <strong>in</strong> <strong>the</strong> <strong>Future</strong> <strong>of</strong> <strong>the</strong> <strong>Energy</strong> <strong>Matrix</strong>to global warm<strong>in</strong>g, because <strong>the</strong>y are more neutral <strong>in</strong> terms <strong>of</strong> greenhouse gas emissions compared topetroleum-derived fuels: <strong>the</strong> balance between <strong>the</strong> absorption <strong>of</strong> CO 2dur<strong>in</strong>g plant growth and emissionsdur<strong>in</strong>g production and fuel burn<strong>in</strong>g is almost neutral, while <strong>the</strong> elim<strong>in</strong>ation <strong>of</strong> straw burn<strong>in</strong>g, among o<strong>the</strong>radvances, fur<strong>the</strong>r reduces emissions. This document focuses on three aspects <strong>of</strong> <strong>the</strong> relationship betweenhealth and climate change: food security, water shortages and heat stress.Food security is one <strong>of</strong> <strong>the</strong> most evident problems <strong>of</strong> global warm<strong>in</strong>g. Climate models project that, ma<strong>in</strong>ta<strong>in</strong><strong>in</strong>g<strong>the</strong> current rate <strong>of</strong> warm<strong>in</strong>g, areas <strong>of</strong> Brazil such as <strong>the</strong> semi-arid region <strong>of</strong> <strong>the</strong> Nor<strong>the</strong>ast maypresent a process <strong>of</strong> desertification. Paradoxically, <strong>in</strong>creased levels <strong>of</strong> atmospheric CO 2may cause somecrops, especially <strong>in</strong> <strong>the</strong> South, Sou<strong>the</strong>ast and Midwest <strong>of</strong> <strong>the</strong> country, to <strong>in</strong>crease <strong>in</strong> productivity if wateris available. If <strong>the</strong>se forecasts come true, <strong>the</strong>re will be an <strong>in</strong>crease <strong>in</strong> social and economic <strong>in</strong>equality, withmigration from new desert areas and an <strong>in</strong>crease <strong>in</strong> <strong>the</strong> poverty belt around major cities. This process willtend to be more <strong>in</strong>tense <strong>in</strong> regions with a greater proportion <strong>of</strong> family or small farms, which will be lessable to make <strong>the</strong> necessary adjustments.The quality and quantity <strong>of</strong> water available for human consumption are crucial determ<strong>in</strong>ants <strong>in</strong> <strong>the</strong> relationshipbetween health and illness. Infectious diseases transmitted via water are among <strong>the</strong> lead<strong>in</strong>g causes<strong>of</strong> morbidity and mortality worldwide. The desertification process <strong>in</strong> <strong>the</strong> semi-arid region will exacerbatewater shortages <strong>in</strong> <strong>the</strong> area. Moreover, climate changes are caus<strong>in</strong>g ra<strong>in</strong>fall <strong>in</strong> <strong>the</strong> Nor<strong>the</strong>ast to occur <strong>in</strong>greater <strong>in</strong>tensity at <strong>the</strong> beg<strong>in</strong>n<strong>in</strong>g <strong>of</strong> <strong>the</strong> ra<strong>in</strong>y season, peter<strong>in</strong>g out later <strong>in</strong> this season. The example <strong>of</strong>2009 is a clear <strong>in</strong>dicator <strong>of</strong> this phenomenon. Systems <strong>of</strong> storage tanks and ponds were compromisedaround <strong>the</strong> flooded areas. This could have led to water shortages if ra<strong>in</strong>s had been <strong>in</strong>sufficient, as well asto contam<strong>in</strong>ation <strong>of</strong> reservoirs by human and animal waste. In coastal regions, <strong>the</strong> rise <strong>in</strong> sea level po<strong>in</strong>tsto <strong>in</strong>creased sal<strong>in</strong>ity <strong>of</strong> aquifers, with <strong>the</strong> consequent reduction <strong>in</strong> <strong>the</strong> quantity and quality <strong>of</strong> water. If thissituation persists, it is forecast that global warm<strong>in</strong>g will <strong>in</strong>crease morbidity and mortality from waterbornediseases, while forc<strong>in</strong>g <strong>the</strong> migration <strong>of</strong> <strong>the</strong> population from affected regions.F<strong>in</strong>ally, it is appropriate to discuss <strong>the</strong>rmal stress. Our bodies are ma<strong>in</strong>ta<strong>in</strong>ed <strong>in</strong> a narrow temperature rangearound 37° C, <strong>in</strong>dependent <strong>of</strong> <strong>the</strong> temperature range that <strong>the</strong> external environment imposes on us. Thef<strong>in</strong>e control <strong>of</strong> body temperature is <strong>the</strong> result <strong>of</strong> <strong>the</strong> body’s <strong>the</strong>rmal regulatory centers, and <strong>the</strong> adaptation<strong>of</strong> our cloth<strong>in</strong>g and dwell<strong>in</strong>gs. Each population has a range <strong>of</strong> <strong>the</strong>rmal comfort, and this varies for differentregions. When <strong>the</strong> external environment presents temperatures outside <strong>of</strong> this comfort zone, health <strong>in</strong>dicatorssuch as hospital consultations and excess mortality start to rise. A schematic representation, whichtranslates empirically what happens <strong>in</strong> São Paulo, is shown <strong>in</strong> Figure 3.Figure 3 shows that <strong>the</strong> relationship between excess mortality from temperature extremes is not l<strong>in</strong>ear,but <strong>in</strong>creases disproportionately with extremes <strong>of</strong> m<strong>in</strong>imum daily temperature. The range <strong>of</strong> <strong>the</strong>rmal comfortcan be def<strong>in</strong>ed as ly<strong>in</strong>g between a m<strong>in</strong>imum daily temperature <strong>of</strong> 10 and 20 degrees centigrade, wi<strong>the</strong>xcess mortality caused by waves <strong>of</strong> cold and heat. In <strong>the</strong> case <strong>of</strong> São Paulo, <strong>the</strong> effect <strong>of</strong> a cold spell ismore <strong>in</strong>tense than that observed with heat waves. In a cold city, <strong>the</strong> opposite occurs, i.e., heat waves havea greater impact on health. Those most affected are people whose mechanisms <strong>of</strong> adaptation are less ef-
Ethanol and Health109ficient – children (respiratory disease) and <strong>the</strong> elderly (respiratory diseases <strong>in</strong> cold spells and cardiovasculardiseases <strong>in</strong> heat waves). Social and economic factors also modify <strong>the</strong> effects <strong>of</strong> extreme temperatures.Lower <strong>in</strong>come dwell<strong>in</strong>gs <strong>of</strong>fer greater “permeability” to external temperature variations, while <strong>the</strong> reducedvegetation rates <strong>in</strong> <strong>the</strong> poorest regions <strong>of</strong> <strong>the</strong> city <strong>in</strong>crease <strong>the</strong> local daily temperature range and are responsiblefor <strong>the</strong> greater impact <strong>of</strong> <strong>the</strong>rmal extremes among <strong>the</strong> poorest members <strong>of</strong> a community.Some o<strong>the</strong>r aspects <strong>of</strong> <strong>the</strong> relationship between global warm<strong>in</strong>g and disease – such as possible <strong>in</strong>creasedspread <strong>of</strong> <strong>in</strong>fectious diseases transmitted by <strong>in</strong>sects, and natural disasters such as floods and landslidescaused by extreme ra<strong>in</strong>fall – also significant, but are not addressed at this time due to space limitations.Impact <strong>of</strong> fuel ethanol from <strong>the</strong> perspective <strong>of</strong> accidentsdur<strong>in</strong>g transportation and storageLeakage <strong>of</strong> oil and its derivatives is a major source <strong>of</strong> environmental accidents, with notable environmentalimpacts. Hydrocarbons and metals present <strong>in</strong> petroleum can be consumed by people and produce adversehealth effects by contam<strong>in</strong>at<strong>in</strong>g water on <strong>the</strong> surface or deep underground, or by enter<strong>in</strong>g <strong>the</strong> food cha<strong>in</strong>cycle. The expected effects are reproductive disturbances, changes <strong>in</strong> bone marrow function (damag<strong>in</strong>g<strong>the</strong> formation <strong>of</strong> red blood cells – anemia – and white blood cells – low immunity) and <strong>in</strong>creased risks <strong>of</strong>develop<strong>in</strong>g cancer, especially leukemia and lymphomas. Ethanol’s chemical structure and greater capacityto break down <strong>in</strong> <strong>the</strong> natural environment implies virtually zero risk <strong>of</strong> <strong>the</strong> changes just described. OneFigure 3Representation <strong>of</strong> additional deaths attributable to extremes <strong>of</strong> m<strong>in</strong>imum temperatures<strong>in</strong> <strong>the</strong> city <strong>of</strong> São Paulo Additional deaths per day / M<strong>in</strong>imum temperature <strong>in</strong> centigrade76543210-18º 10º 12º 14º 16º 18º 20º 22º
110 Ethanol and Bioelectricity <strong>Sugarcane</strong> <strong>in</strong> <strong>the</strong> <strong>Future</strong> <strong>of</strong> <strong>the</strong> <strong>Energy</strong> <strong>Matrix</strong>downside <strong>of</strong> ethanol comes with fuel storage at fill<strong>in</strong>g stations, given <strong>the</strong> <strong>in</strong>creased permeability <strong>of</strong> gasol<strong>in</strong>e<strong>in</strong> soil when it is mixed with ethanol (McDowell et al, 2003). In o<strong>the</strong>r words, <strong>the</strong> addition <strong>of</strong> ethanol togasol<strong>in</strong>e <strong>in</strong>creases <strong>the</strong> plume dispersion <strong>of</strong> gasol<strong>in</strong>e <strong>in</strong> <strong>the</strong> soil, <strong>in</strong>creas<strong>in</strong>g <strong>the</strong> risk <strong>of</strong> surface water contam<strong>in</strong>ation<strong>in</strong> <strong>the</strong> case <strong>of</strong> a fill<strong>in</strong>g station leak. This situation deserves greater attention <strong>in</strong> terms <strong>of</strong> monitor<strong>in</strong>gtank seal<strong>in</strong>g at fill<strong>in</strong>g stations <strong>in</strong> urban areas. And what about <strong>the</strong> risk <strong>of</strong> <strong>in</strong>halation?Health effects <strong>of</strong> emissions by ethanol powered vehiclesWe know <strong>in</strong>tuitively that, regardless <strong>of</strong> <strong>the</strong> fuel used, automotive emissions conta<strong>in</strong> compounds that havepotential effects on human health. Inhalation <strong>of</strong>fers a gateway for <strong>the</strong>se compounds, given that an adult’slungs have an alveolar surface <strong>of</strong> around 70 square meters, and a barrier <strong>of</strong> cells with an average thickness<strong>of</strong> less than one thousandth <strong>of</strong> a millimeter is <strong>in</strong>terposed between our <strong>in</strong>ternal environment (<strong>the</strong> <strong>in</strong>side <strong>of</strong>alveolar capillaries) and <strong>the</strong> external environment. As <strong>the</strong> air passes through approximately 30 centimeters<strong>of</strong> airways, it must be heated to 37° C, reach a relative humidity <strong>of</strong> around 90% and be filtered <strong>of</strong> microorganismsand ambient pollutants. The arrival <strong>in</strong> <strong>the</strong> alveolar territory <strong>of</strong> chemical compounds, both <strong>in</strong> <strong>the</strong>gaseous state or adher<strong>in</strong>g to soot particles, gives rise to a possible local or systemic <strong>in</strong>flammatory responseas <strong>the</strong>se compounds access <strong>the</strong> bloodstream. It is <strong>the</strong>refore imperative that <strong>the</strong> analysis <strong>of</strong> health effects<strong>of</strong> emissions from ethanol-powered vehicles be conducted <strong>in</strong> comparison to <strong>the</strong> emission from vehiclespowered by gasol<strong>in</strong>e or diesel.Laboratory studies with rodents <strong>in</strong> <strong>the</strong> 1980s showed that emissions from light vehicles runn<strong>in</strong>g on ethanolwere less toxic than those from gasol<strong>in</strong>e-powered eng<strong>in</strong>es, <strong>in</strong> tests for both acute and chronic toxicity.Ethanol emissions produced lower levels <strong>of</strong> lung <strong>in</strong>flammation and <strong>of</strong> mutations. In <strong>the</strong>se studies, <strong>the</strong> lowertoxicity <strong>of</strong> ethanol emissions was attributed to <strong>the</strong> type <strong>of</strong> organic compounds emitted.In <strong>the</strong> case <strong>of</strong> emissions from ethanol-powered eng<strong>in</strong>es, <strong>the</strong> organic compounds are almost entirely ethanol,account<strong>in</strong>g for 70%, and aldehydes, amount<strong>in</strong>g to 10% (this fraction comprised 85% acetaldehyde and14% formaldehyde). Gasol<strong>in</strong>e eng<strong>in</strong>es on <strong>the</strong> o<strong>the</strong>r hand emit a whole family <strong>of</strong> volatile compounds andpolycyclic aromatic hydrocarbons with high toxic and carc<strong>in</strong>ogenic potential. This approach, while usefulas an <strong>in</strong>itial step, does not take <strong>in</strong>to account photochemical processes that can occur <strong>in</strong> <strong>the</strong> so-called “realworld”, i.e. <strong>in</strong> <strong>the</strong> atmosphere <strong>of</strong> big cities. It is extremely important to analyze <strong>the</strong> formation <strong>of</strong> secondarypollutants, especially ozone and o<strong>the</strong>r compounds <strong>of</strong> <strong>the</strong> photochemical oxidants family formed by <strong>the</strong><strong>in</strong>teraction <strong>of</strong> primary pollutants with solar radiation.An <strong>in</strong>creased level <strong>of</strong> aldehydes (acetaldehyde and formaldehyde) <strong>in</strong> <strong>the</strong> atmosphere is undeniably one <strong>of</strong><strong>the</strong> consequences <strong>of</strong> us<strong>in</strong>g fuel ethanol. On <strong>the</strong> o<strong>the</strong>r hand, formaldehyde is <strong>the</strong> most characteristic aldehyde<strong>in</strong> vehicular emissions from <strong>the</strong> use <strong>of</strong> petroleum and its byproducts, notably diesel. It is important tolook <strong>in</strong> more detail here at <strong>the</strong> behavior and toxicity <strong>of</strong> atmospheric aldehydes, both from <strong>the</strong> perspective<strong>of</strong> <strong>the</strong>ir direct toxicity, as well as <strong>the</strong>ir potential for ozone formation.
Ethanol and Health111Structure and metabolism <strong>of</strong> aldehydesAldehydes are highly reactive organic substances. They conta<strong>in</strong> a carbonyl group (double bond betweencarbon and oxygen atoms), and have a high aff<strong>in</strong>ity with lipids, prote<strong>in</strong>s and DNA (Comeap, 2000) i . Aldehydescan be divided <strong>in</strong>to three classes based on <strong>the</strong>ir structure and reactivity with organic substrates(Comeap, 2000):a Simple or saturated aldehydes: <strong>the</strong> metabolism <strong>of</strong> <strong>the</strong>se aldehydes happens through <strong>the</strong> oxidation <strong>of</strong><strong>the</strong>ir carboxylic acids (via aldehyde dehydrogenase) or by reduc<strong>in</strong>g <strong>the</strong> alcohol dehydrogenase. L<strong>in</strong>ks withthiol groups, as well as l<strong>in</strong>ks with several prote<strong>in</strong>s, <strong>in</strong>clud<strong>in</strong>g those that make up DNA, also occur and expla<strong>in</strong><strong>the</strong> carc<strong>in</strong>ogenic potential <strong>of</strong> <strong>the</strong>se aldehydes. The aldehydes <strong>of</strong> <strong>in</strong>terest <strong>in</strong> this study – formaldehydeand acetaldehyde – are representatives <strong>of</strong> this category <strong>of</strong> aldehydes.b Unsaturated α,β-aldehydes (for example, acrole<strong>in</strong>): <strong>the</strong>se aldehydes b<strong>in</strong>d to substrates such as glutathioneor cyste<strong>in</strong>e, and oxidize after <strong>the</strong>se l<strong>in</strong>ks. As <strong>in</strong> <strong>the</strong> previous case, this class <strong>of</strong> aldehydes can b<strong>in</strong>d toam<strong>in</strong>o groups <strong>of</strong> DNA, and may lead to <strong>the</strong> development <strong>of</strong> mutations.c Halogenated or modified aldehydes (benzoaldehyde): <strong>the</strong> metabolism <strong>of</strong> <strong>the</strong>se aldehydes depends on<strong>the</strong> nature <strong>of</strong> <strong>the</strong>ir functional group; some can be oxidized (for example, benzoaldehyde, furfural, malodialdehyde)while o<strong>the</strong>rs are predom<strong>in</strong>antly conjugated with glutathione, cyste<strong>in</strong>e or ser<strong>in</strong>e.Sources <strong>of</strong> aldehydes <strong>in</strong> <strong>the</strong> external environment <strong>of</strong> large citiesIn outdoor areas <strong>of</strong> large cities, <strong>the</strong> different classes <strong>of</strong> aldehydes described above are produced by vehicleemissions, biomass burn<strong>in</strong>g or through photochemical reactions (Miller et al, 2001). In <strong>the</strong> atmosphere <strong>of</strong>large urban centers, <strong>the</strong> relative contribution to aldehydes production <strong>of</strong> direct emissions and photochemicalprocesses will depend on <strong>the</strong> rate <strong>of</strong> emission from anthropogenic sources and climatic conditions.The emission <strong>of</strong> aldehydes <strong>in</strong> urban environments is <strong>the</strong> result <strong>of</strong> <strong>in</strong>complete oxidation <strong>of</strong> vehicle fuel, be thatgasol<strong>in</strong>e, gasohol, ethanol, natural gas or diesel (Abrantes et al, 2005; Durb<strong>in</strong> et al, 2007; Kado et al 2005;Mart<strong>in</strong>s et al 2008). In <strong>the</strong> polluted atmosphere <strong>of</strong> large cities, <strong>the</strong> ma<strong>in</strong> precursors <strong>of</strong> aldehydes are hydrocarbons,alcohols, e<strong>the</strong>rs and aromatic compounds <strong>of</strong> anthropogenic orig<strong>in</strong>, subjected to <strong>the</strong> action <strong>of</strong> ozone orOH, HO 2and NO 3radicals (Andrade et al, 2002).In <strong>the</strong> city <strong>of</strong> São Paulo, carbonyl directly emitted by vehicles predom<strong>in</strong>ates <strong>in</strong> <strong>the</strong> morn<strong>in</strong>g, with greater participation<strong>of</strong> photochemical processes <strong>in</strong> <strong>the</strong> afternoon (Miller et al, 2001). Usually <strong>in</strong> <strong>the</strong> morn<strong>in</strong>g, <strong>the</strong> concentration<strong>of</strong> acetaldehyde is higher than that <strong>of</strong> formaldehyde; this behavior is reversed <strong>in</strong> <strong>the</strong> afternoon afterphotochemical processes.
112 Ethanol and Bioelectricity <strong>Sugarcane</strong> <strong>in</strong> <strong>the</strong> <strong>Future</strong> <strong>of</strong> <strong>the</strong> <strong>Energy</strong> <strong>Matrix</strong>Aldehydes as ozone precursorsIn addition to <strong>the</strong>ir direct toxicity, atmospheric aldehydes can contribute to <strong>the</strong> formation <strong>of</strong> ozone, one <strong>of</strong><strong>the</strong> pollutants most associated with adverse effects for human health. The basic aspects <strong>of</strong> <strong>the</strong> photochemicalreactions related to aldehydes and ozone are <strong>of</strong> great importance to understand<strong>in</strong>g <strong>the</strong> consequences<strong>of</strong> us<strong>in</strong>g different fuels, and are presented <strong>in</strong> Annex 2 (aldehydes as precursors <strong>of</strong> ozone). Fur<strong>the</strong>r detailscan be found <strong>in</strong> specific literature (Carter, 1994; Saldiva et al, 2005).Effects <strong>of</strong> formaldehyde and acetaldehyde on human healthThe vast majority <strong>of</strong> our knowledge about <strong>the</strong> effects <strong>of</strong> formaldehyde and acetaldehyde on human healthcomes from <strong>the</strong> occupational area or from a context <strong>of</strong> external environments. This <strong>in</strong>formation is <strong>of</strong> littlevalue when one takes <strong>in</strong>to account <strong>the</strong> scope <strong>of</strong> <strong>the</strong> current study, which has as its ma<strong>in</strong> objective <strong>the</strong>analysis <strong>of</strong> aldehydes <strong>in</strong> an ambient context. The detailed survey <strong>of</strong> <strong>the</strong> medical literature did not reveal <strong>the</strong>existence <strong>of</strong> population-based studies, relat<strong>in</strong>g ambient concentrations <strong>of</strong> formaldehyde and acetaldehydeto <strong>in</strong>dicators <strong>of</strong> morbidity or mortality.There are major problems with transposition <strong>of</strong> data from occupational studies to an ambient context. Fora start, <strong>the</strong>re are significant differences <strong>in</strong> <strong>the</strong> degree <strong>of</strong> concentration <strong>of</strong> aldehydes <strong>in</strong> <strong>the</strong> ambient study;this tends to be much greater <strong>in</strong> <strong>the</strong> work<strong>in</strong>g environment. On <strong>the</strong> o<strong>the</strong>r hand, <strong>the</strong> susceptibility <strong>of</strong> exposedpopulations tends to be different. There is much less frequency <strong>in</strong> <strong>the</strong> work<strong>in</strong>g environment <strong>of</strong> those <strong>in</strong>dividualswho are most prone to suffer greater adverse effects when exposed to ambient levels <strong>of</strong> atmosphericpollutants, such as <strong>the</strong> elderly, children or patients with severe asthma or cardiovascular diseases.In this scenario, <strong>the</strong> estimated risk <strong>of</strong> <strong>the</strong> adverse effects <strong>of</strong> formaldehyde and acetaldehyde on <strong>in</strong>dicators<strong>of</strong> morbidity – <strong>in</strong> o<strong>the</strong>r words, <strong>the</strong> <strong>in</strong>duction or worsen<strong>in</strong>g <strong>of</strong> disease – presents as a limit<strong>in</strong>g aspect <strong>the</strong> factthat symptoms or abnormalities observed <strong>in</strong> humans or experimental animals were observed <strong>in</strong> ambientconcentrations much greater than those found <strong>in</strong> Brazilian cities.The U.S. Environmental Protection Agency (EPA) has not def<strong>in</strong>ed a reference concentration for chronic<strong>in</strong>halation <strong>of</strong> formaldehyde (Iris, 1990) ii . Based on studies with rodents, <strong>the</strong> EPA has identified cancer riskfrom exposure to formaldehyde through <strong>in</strong>halation, establish<strong>in</strong>g <strong>the</strong> unit <strong>of</strong> risk for <strong>in</strong>halation at 1.3 x 10 -5per μg/m 3 . This means that lifetime exposure to a concentration <strong>of</strong> 1 μg/m 3 leads to an additional 1.3 cancercases per 100,000 <strong>in</strong>habitants. The same situation occurs for acetaldehyde, which does not have a setsafety standard for chronic <strong>in</strong>halation, except for <strong>the</strong> risk <strong>of</strong> develop<strong>in</strong>g tumors (Iris, 1991). In <strong>the</strong> case <strong>of</strong>acetaldehyde, lifetime exposure to a concentration <strong>of</strong> 1 μg/m 3 leads to an excess <strong>of</strong> 2.2 x 10⁻⁶ per 1 μg/m 3 .This means that lifetime exposure to a concentration <strong>of</strong> 1 μg/m 3 creates an additional 2.2 cancer cases perone million <strong>in</strong>habitants.
Ethanol and Health113Effects <strong>of</strong> ozone on human healthAs noted earlier, aldehydes are important precursors <strong>of</strong> ozone formation. In this case, unlike <strong>the</strong> situationfor formaldehyde and acetaldehyde, <strong>the</strong>re is a solid mass <strong>of</strong> population-targeted <strong>in</strong>formation relat<strong>in</strong>g ambientvariations <strong>of</strong> ozone to adverse health outcomes.Studies us<strong>in</strong>g controlled <strong>in</strong>halation, both <strong>in</strong> animals and <strong>in</strong> humans, <strong>in</strong>dicate that ozone has <strong>the</strong> potential tocause adverse effects to human health, such as:. Short-duration exposure produces <strong>in</strong>flammation <strong>of</strong> <strong>the</strong> respiratory tract, ma<strong>in</strong>ly <strong>in</strong> <strong>the</strong> upper airways and <strong>in</strong><strong>the</strong> transition region between <strong>the</strong> respiratory bronchioles and alveoli;. Studies <strong>in</strong> <strong>in</strong>toxication chambers demonstrate that <strong>the</strong> ozone levels present <strong>in</strong> large Brazilian cities(160 μg/m 3 ) are capable <strong>of</strong> <strong>in</strong>duc<strong>in</strong>g significant pulmonary <strong>in</strong>flammation <strong>in</strong> both humans and animals; thisis established a few hours after <strong>the</strong> end <strong>of</strong> exposure;. Ozone <strong>in</strong>halation can <strong>in</strong>duce a systemic <strong>in</strong>flammatory response that is characterized by <strong>the</strong> activation <strong>of</strong>serum levels <strong>of</strong> complement and acute-phase prote<strong>in</strong>s;. Ozone <strong>in</strong>halation impairs pulmonary defenses through <strong>the</strong> functional impairment <strong>of</strong> <strong>the</strong> mucociliary system,reduc<strong>in</strong>g <strong>the</strong> activity <strong>of</strong> alveolar macrophages and impair<strong>in</strong>g activation <strong>of</strong> circulat<strong>in</strong>g lymphocytes;. Ambient levels <strong>of</strong> ozone cause <strong>in</strong>creased bronchial reactivity;. Repeated <strong>in</strong>halation <strong>of</strong> ozone leads to a degree <strong>of</strong> adaptation by <strong>the</strong> recipient, through an <strong>in</strong>crease <strong>in</strong> production<strong>of</strong> anti-oxidant substances by <strong>the</strong> respiratory tract. However, we must caution that this “adaptation”does not prevent <strong>the</strong> development <strong>of</strong> pulmonary <strong>in</strong>flammation, especially <strong>in</strong> term<strong>in</strong>al bronchiolar units;. Some host factors modulate <strong>the</strong> magnitude <strong>of</strong> <strong>the</strong> response to ozone, such as age, respiratory co-morbidity,and genetic factors that modulate <strong>the</strong> syn<strong>the</strong>sis <strong>of</strong> anti-oxidant substances through <strong>the</strong> respiratory tract.a Effects <strong>of</strong> ozone on morbidity <strong>in</strong>dicatorsThere is conv<strong>in</strong>c<strong>in</strong>g evidence that ambient levels <strong>of</strong> ozone are associated with <strong>in</strong>creased morbidity <strong>in</strong> <strong>the</strong>exposed population. The <strong>in</strong>dicators <strong>of</strong> morbidity most consistently associated with ambient ozone variationsare school absence, hospitalization for asthma and respiratory <strong>in</strong>fections <strong>in</strong> emergency rooms, andepisodes <strong>of</strong> worsen<strong>in</strong>g chronic obstructive pulmonary disease.Romieu et al (1992) showed a 20% <strong>in</strong>crease <strong>in</strong> <strong>in</strong>fant day care absences due to respiratory <strong>in</strong>fections <strong>in</strong>Mexico City, when ozone levels rema<strong>in</strong>ed above 260 μg/m 3 for two consecutive days. A study <strong>of</strong> first gradestudents <strong>in</strong> 12 Californian cities found that an <strong>in</strong>crease <strong>of</strong> 40 μg/m 3 <strong>of</strong> ozone was associated with an <strong>in</strong>crease<strong>of</strong> 62.9% <strong>in</strong> general absences, 82.9% for respiratory diseases, and 45.1% for diseases <strong>of</strong> <strong>the</strong> lowerrespiratory tract (Gilliland et al, 2001). A Nevada study found a 13% <strong>in</strong>crease <strong>in</strong> absence <strong>of</strong> first graderswith eight-hour <strong>in</strong>crements <strong>of</strong> 100 μg/m 3 <strong>in</strong> average ozone concentration (Chen et al, 2000). And a study
114 Ethanol and Bioelectricity <strong>Sugarcane</strong> <strong>in</strong> <strong>the</strong> <strong>Future</strong> <strong>of</strong> <strong>the</strong> <strong>Energy</strong> <strong>Matrix</strong>conducted with first grade Korean students showed that an <strong>in</strong>crease <strong>of</strong> 32 μg/m 3 was related to an <strong>in</strong>crease<strong>of</strong> 8% <strong>in</strong> absences (Park et al, 2002). These studies suggest that data for school absences can constitute anextremely sensitive <strong>in</strong>strument to detect acute effects <strong>of</strong> ozone on <strong>the</strong> <strong>in</strong>fant population.Monitor<strong>in</strong>g <strong>the</strong> severity <strong>of</strong> asthma <strong>in</strong> children is ano<strong>the</strong>r approach that has been used successfully todeterm<strong>in</strong>e <strong>the</strong> adverse effects <strong>of</strong> ozone. A study <strong>in</strong> New Haven, Connecticut, showed that an <strong>in</strong>crease <strong>of</strong>100 μg/m 3 <strong>in</strong> hourly ozone levels was associated with <strong>in</strong>creases <strong>of</strong> 35% <strong>in</strong> cases <strong>of</strong> wheez<strong>in</strong>g and 47% <strong>in</strong>cases <strong>of</strong> respiratory symptoms (Gent et al, 2003). In a cohort study <strong>of</strong> 846 asthmatic children, an <strong>in</strong>crease <strong>of</strong>30 μg/m 3 was associated with morn<strong>in</strong>g respiratory symptoms (16%), followed by reduction <strong>of</strong> peak expiratoryflow (Mortimer et al, 2000, 2002).With regard to hospital admissions, <strong>the</strong> magnitude <strong>of</strong> <strong>the</strong> effects <strong>of</strong> ozone on <strong>the</strong> exposed population dependson <strong>the</strong> climate <strong>in</strong> <strong>the</strong> region where <strong>the</strong> study is conducted and on <strong>the</strong> type <strong>of</strong> <strong>in</strong>dicator used. Given<strong>the</strong> large number <strong>of</strong> publications on this subject, Table 3 summarizes <strong>the</strong> expected effects <strong>of</strong> differentconcentrations <strong>of</strong> ozone on hospital admissions.b Effects <strong>of</strong> ozone on mortalityContrary to <strong>the</strong> situation for particulate material, <strong>the</strong> relationship between ozone and mortality is less clear.This is because <strong>the</strong> magnitude <strong>of</strong> <strong>the</strong> effects was significantly affected by <strong>the</strong> specifications <strong>of</strong> <strong>the</strong> statisticalmodels employed or <strong>the</strong> geographical location <strong>of</strong> <strong>the</strong> community be<strong>in</strong>g studied. However, studiesconducted <strong>in</strong> various cities and more recent meta-analyses show that <strong>the</strong>re are acute effects <strong>of</strong> variations<strong>in</strong> ozone and mortality <strong>of</strong> <strong>the</strong> exposed population, with an average coefficient <strong>of</strong> 0.256% <strong>in</strong> excess deathsfor a 10 μg/m 3 <strong>in</strong>crease <strong>of</strong> ozone. A summary <strong>of</strong> <strong>the</strong>se studies can be seen <strong>in</strong> Table 4.As for chronic effects, exposure to ozone has been l<strong>in</strong>ked to reduced lung function <strong>in</strong> children. However, <strong>the</strong>association with decreased life expectancy and <strong>in</strong>creased risk for develop<strong>in</strong>g cancer has not yet been clarified.Ambient concentrations <strong>of</strong> aldehydes <strong>in</strong> Brazilian citiesThe research available <strong>in</strong> <strong>the</strong> scientific literature is somewhat disappo<strong>in</strong>t<strong>in</strong>g, with a relatively small number<strong>of</strong> atmospheric aldehyde measurements. Taken toge<strong>the</strong>r, <strong>the</strong>se studies show that <strong>the</strong>se measurementswere a result <strong>of</strong> <strong>the</strong> <strong>in</strong>itiative <strong>of</strong> research groups <strong>in</strong>terested <strong>in</strong> <strong>the</strong> subject, ra<strong>the</strong>r than any systematic attemptat ambient monitor<strong>in</strong>g <strong>of</strong> air quality for <strong>the</strong> purpose <strong>of</strong> safeguard<strong>in</strong>g public health. This is a concern<strong>in</strong> a country such as ours, where mobile sources have high potential for emission <strong>of</strong> atmospheric aldehydes,given <strong>the</strong> wide use <strong>of</strong> ethanol, natural gas and diesel.
Ethanol and Health115Table 5 shows available data for measurements <strong>of</strong> atmospheric concentrations <strong>of</strong> formaldehyde and acetaldehyde<strong>in</strong> some Brazilian cities.Figures 4 and 5 show temporal variation <strong>of</strong> formaldehyde and acetaldehyde measurements <strong>in</strong> cities wheredata could be found <strong>in</strong> <strong>the</strong> literature. The compiled data does not permit a clear trace <strong>of</strong> <strong>the</strong> changes over<strong>the</strong> past 20 years. Moreover, <strong>the</strong> most recent data is from 2003, and so does not reflect <strong>the</strong> impact <strong>of</strong> flexfuelvehicle growth, as well as <strong>the</strong> high rate <strong>of</strong> conversion <strong>of</strong> vehicles to natural gas.Estimate <strong>of</strong> <strong>the</strong> expected <strong>in</strong>crease <strong>in</strong> hospital admissions for respiratory diseasescompared to changes <strong>in</strong> <strong>the</strong> ambient ozone levelTable 3Expected <strong>in</strong>crease <strong>of</strong> hospital admissionsdue to respiratory illness1-hour averageO 3concentration (μg/m 3 )8-hour Average5% 30 2510% 60 5020% 120 100Summary <strong>of</strong> representative studies that l<strong>in</strong>k acute variations <strong>of</strong> ozone with mortalityTable 4Location <strong>of</strong> study F<strong>in</strong>d<strong>in</strong>gs Reference95 North American cities 20 μg/m 3 <strong>of</strong> ozone was associated with <strong>in</strong>crements <strong>of</strong>0.52% <strong>in</strong> total mortality and 0.64% <strong>in</strong> cardio-respiratorymortality.23 European cities An <strong>in</strong>crease <strong>of</strong> 10 μg/m 3 was associated with an <strong>in</strong>crease<strong>of</strong> 0.33% <strong>in</strong> overall mortality, <strong>in</strong>clud<strong>in</strong>g 0.45% <strong>of</strong>cardiovascular mortality and 1.13% <strong>in</strong> respiratory mortality.Meta-analysis <strong>of</strong> studies conducted<strong>in</strong> seven European citiesAn <strong>in</strong>crease <strong>of</strong> 10 μg/m 3 was associated with an <strong>in</strong>crease<strong>of</strong> 0.3% <strong>in</strong> overall mortality and 0.4% <strong>of</strong> mortality fromcardiovascular diseases.14 U.S. cities AAn <strong>in</strong>crease <strong>of</strong> 20 μg/m 3 <strong>in</strong> <strong>the</strong> hourly ozone averagewas associated with an <strong>in</strong>crease <strong>of</strong> 0.23% <strong>in</strong> respiratorymortality.Meta-analysis <strong>of</strong> 39 time-seriesstudies <strong>in</strong> <strong>the</strong> United StatesMeta-analysis <strong>of</strong> 43 studiesconducted <strong>in</strong> different parts <strong>of</strong> <strong>the</strong>world, with seven additional NorthAmerican studiesMeta-analysis <strong>of</strong> 28 North AmericanstudiesAn <strong>in</strong>crease <strong>of</strong> 10 μg/m 3 was associated with an <strong>in</strong>crease<strong>of</strong> 1.1% <strong>in</strong> mortality from cardiovascular disease.An <strong>in</strong>crease <strong>of</strong> 20-μg/m 3 <strong>in</strong> <strong>the</strong> hourly ozone average wasassociated with an <strong>in</strong>crease <strong>of</strong> 0.39% <strong>in</strong> overall mortality.Increase <strong>of</strong> 0.21% <strong>in</strong> overall mortality for an <strong>in</strong>crease <strong>of</strong>10 μg/m 3 <strong>in</strong> <strong>the</strong> average concentration <strong>of</strong> ozone.Bell et al, 2004Gryparis et al, 2004Anderson et al, 2004Schwartz, 2005Bell et al, 2005Ito et al, 2005Levy et al, 2005
116 Ethanol and Bioelectricity <strong>Sugarcane</strong> <strong>in</strong> <strong>the</strong> <strong>Future</strong> <strong>of</strong> <strong>the</strong> <strong>Energy</strong> <strong>Matrix</strong>As can be seen <strong>in</strong> Table 5 and Figures 4 and 5, <strong>the</strong>re is a larger set <strong>of</strong> data for <strong>the</strong> cities <strong>of</strong> Rio de Janeiro and SãoPaulo. Consolidat<strong>in</strong>g <strong>the</strong> measurements for <strong>the</strong>se two cities, <strong>the</strong> ambient values <strong>of</strong> acetaldehyde and formaldehydeare those shown <strong>in</strong> Table 5. Generally speak<strong>in</strong>g, <strong>the</strong> formaldehyde/acetaldehyde ratio <strong>in</strong> <strong>the</strong>se two cities isabout 0.5. Moreover, <strong>the</strong> concentrations <strong>of</strong> formaldehyde and acetaldehyde <strong>in</strong> Rio de Janeiro and São Paulo aremuch higher than those observed <strong>in</strong> o<strong>the</strong>r cities around <strong>the</strong> world, even those <strong>of</strong> similar size.Estimated health effects <strong>of</strong> aldehydesAs mentioned earlier, <strong>the</strong>re are no Brazilian or <strong>in</strong>ternational studies l<strong>in</strong>k<strong>in</strong>g ambient variations <strong>of</strong> formaldehydeand acetaldehyde to population morbidity <strong>in</strong>dicators. What has been established is a numeric <strong>in</strong>dicatorfor <strong>the</strong> risk <strong>of</strong> develop<strong>in</strong>g cancer, especially <strong>in</strong> <strong>the</strong> respiratory tract, as a result <strong>of</strong> ambient concentrations<strong>of</strong> <strong>the</strong>se aldehydes.Table 5Descriptive statistics <strong>of</strong> <strong>the</strong> measurements available <strong>in</strong> <strong>the</strong> literature on ambient levels(<strong>in</strong> μg/m 3 ) <strong>of</strong> formaldehyde and acetaldehyde <strong>in</strong> <strong>the</strong> atmosphere <strong>of</strong> Brazilian citiesCity Formaldehyde AcetaldehydeSão PauloNAverageMedianM<strong>in</strong>imumMaximumDP1711.78.81.628.88.11724.318.85.054.816.6Rio de JaneiroNAverageMedianM<strong>in</strong>imumMaximumDP811.78.92.333.09.7826.210.73.486.331.6Londr<strong>in</strong>aNAverageMedianM<strong>in</strong>imumMaximumDP45.75.71.29.93.644.73.80.810.24.2Porto AlegreNAverageMedianM<strong>in</strong>imumMaximumDP311.59.05.719.67.3314.96.96.331.714.5SalvadorNAverageMedianM<strong>in</strong>imumMaximumDP315.513.73.629.112.8319.011.36.339.617.9Source: Monteiro et al, 2001; Andrade et al, 2002; P<strong>in</strong>to et al; 2007, Mart<strong>in</strong>s et al, 2006.
Ethanol and Health117Accord<strong>in</strong>g to census projections, <strong>the</strong> adult population (aged 20 years and over) <strong>in</strong> <strong>the</strong> metropolitan region <strong>of</strong>São Paulo is 12,674,944 <strong>in</strong>habitants. Consider<strong>in</strong>g <strong>the</strong> unitary risk <strong>of</strong> develop<strong>in</strong>g cancer estimated for formaldehyde(1.3 x 10 -5 cases per μg/m 3 ), and <strong>the</strong> average concentration <strong>of</strong> formaldehyde obta<strong>in</strong>ed from measurements<strong>in</strong> <strong>the</strong> literature (Table 5), we can estimate that approximately 1,928 and 678 cancer cases are due toFigure 4Average values and correspond<strong>in</strong>g standard errors <strong>of</strong> formaldehyde concentrationsmeasured <strong>in</strong> Brazilian cities between <strong>the</strong> years 1985 and 2003. Formaldehyde (µg/m 3 )403020100-10N= 2 3 2 1 1 2 2 2 12 2 2 1 1 1 11 1 1 3 111985 1987 1989 1993 1996 1998 2000 2003São Paulo Rio de Janeiro Salvador Porto Alegre Londr<strong>in</strong>aFigure 5Average values and correspond<strong>in</strong>g standard errors <strong>of</strong> acetaldehyde concentrationmeasured <strong>in</strong> Brazilian cities between <strong>the</strong> years 1985 to 2003. Acetaldehyde (µg/m 3 )120100806040200-20-40N= 2 3 2 1 1 2 2 2 12 2 2 1 1 1 11 1 1 3 111985 1987 1989 1993 1996 1998 2000 2003São Paulo Rio de Janeiro Salvador Porto Alegre Londr<strong>in</strong>a
118 Ethanol and Bioelectricity <strong>Sugarcane</strong> <strong>in</strong> <strong>the</strong> <strong>Future</strong> <strong>of</strong> <strong>the</strong> <strong>Energy</strong> <strong>Matrix</strong>ambient concentrations <strong>of</strong> formaldehyde and acetaldehyde, respectively, <strong>in</strong> <strong>the</strong> metropolitan region <strong>of</strong> SãoPaulo. Consider<strong>in</strong>g that <strong>the</strong> average life <strong>of</strong> residents is about 70 years, and tak<strong>in</strong>g <strong>in</strong>to account that populationdata was obta<strong>in</strong>ed for residents aged 20 years and over, <strong>the</strong>n we can say that 52 new cases <strong>of</strong> cancer causedby concentrations <strong>of</strong> both aldehydes are observed <strong>in</strong> São Paulo each year.Ano<strong>the</strong>r possibility is to estimate <strong>the</strong> effects <strong>of</strong> aldehydes on health <strong>in</strong> <strong>the</strong> context <strong>of</strong> <strong>the</strong>ir potential forozone formation. This type <strong>of</strong> approach has <strong>the</strong> advantage <strong>of</strong> <strong>of</strong>fer<strong>in</strong>g a certa<strong>in</strong> degree <strong>of</strong> support for <strong>the</strong>creation <strong>of</strong> vehicle emission standards directed to control ozone. Only one detailed study has been done <strong>in</strong>Brazil <strong>of</strong> vehicular emission factors for volatile organic compounds for vehicles <strong>in</strong> urban traffic conditions (astudy <strong>of</strong> tunnels conducted by Mart<strong>in</strong>s et al, 2006). The results <strong>of</strong> this study are shown <strong>in</strong> Table 6. The sametable also presents respective values <strong>of</strong> maximum <strong>in</strong>cremental reactivity (MIR) for each <strong>of</strong> <strong>the</strong> compoundsevaluated <strong>in</strong> <strong>the</strong> study, toge<strong>the</strong>r with <strong>the</strong> estimated potential for ozone formation for each compound,def<strong>in</strong>ed as <strong>the</strong> product <strong>of</strong> emission factors (<strong>in</strong> g.km-1) multiplied by <strong>the</strong>ir respective MIR.Volatile organic compounds have different levels <strong>of</strong> reactivity, which means <strong>the</strong>y may have different potentialsfor form<strong>in</strong>g ozone and o<strong>the</strong>r photochemical oxidants. These differences <strong>in</strong> <strong>the</strong> effects ozone formationare referred to as “VOC reactivity”. The effect <strong>of</strong> <strong>the</strong> variation <strong>in</strong> VOC emission on ozone formation<strong>in</strong> a particular episode will depend on <strong>the</strong> magnitude <strong>of</strong> <strong>the</strong> variation <strong>of</strong> <strong>the</strong> emission. The MIR scale wasdeveloped by Carter (1994) and is based on averages for <strong>the</strong> <strong>in</strong>crease <strong>in</strong> reactivity, calculated for variousscenarios based on chamber studies and box type models. NOx concentrations have a considerable effectTable 6Values <strong>of</strong> ambient concentrations <strong>of</strong> formaldehyde and acetaldehydeobta<strong>in</strong>ed <strong>in</strong> different cities <strong>of</strong> <strong>the</strong> world (<strong>in</strong> µg/m 3 )FormaldehydeAcetaldehydeLos Angeles 1.8-13 1.8-16.5Denver 2.8-4,8 1.,8-3Atlanta 3.3 3.7México 43.5 4.7-5.7Copenhague 0.3-8 0.3-33Paris 5-40 3.7-16.5Grenoble 3.1-22 3.6-18Roma 10.2-21.2 5.3-12.1Londres 5.0-32.5 2.9-5.3Leipzig 1.6-12.5 0.7-2.3Urawa (Japão) 3.1-14.2 2.4-12.5Algéria 5.2-27.1 2.6-10.3Cairo 40 –Hong-Kong 4.9 2.4Source: accord<strong>in</strong>g to data reported by Cec<strong>in</strong>ato et al, 2002.
Ethanol and Health119on VOC reactivities. In conditions <strong>of</strong> high NOx concentration, VOC reactivities are relatively <strong>in</strong>sensitive too<strong>the</strong>r conditions <strong>of</strong> <strong>the</strong> study scenario. However, <strong>in</strong> conditions <strong>of</strong> low NOx concentration, relative reactivitiestend to be more sensitive to o<strong>the</strong>r ambient conditions.Potential for ozone formation can be represented graphically via <strong>the</strong> comb<strong>in</strong>ation <strong>of</strong> different types <strong>of</strong>volatile organic compounds, as shown <strong>in</strong> Figure 6. Volatile organic compounds measured <strong>in</strong> this studyrepresent a fraction <strong>of</strong> <strong>the</strong> total VOCs actually emitted. Thus, <strong>the</strong>re is a significant part not <strong>in</strong>cluded <strong>in</strong> <strong>the</strong>experiments. Therefore, <strong>the</strong> figures presented <strong>in</strong> Figure 6 refer to <strong>the</strong> percentage <strong>of</strong> total VOCs measured<strong>in</strong> <strong>the</strong> <strong>in</strong>terior <strong>of</strong> <strong>the</strong> tunnels.It is important to note that <strong>the</strong> tunnels study was conducted <strong>in</strong> São Paulo <strong>in</strong> 2004, thus preced<strong>in</strong>g <strong>the</strong>significant <strong>in</strong>crease <strong>in</strong> flex-fuel vehicles observed <strong>in</strong> recent years. It is also important to po<strong>in</strong>t out that<strong>the</strong> measurements taken <strong>in</strong> <strong>the</strong> study by Mart<strong>in</strong>s et al (2006) represent a fraction <strong>of</strong> total volatile organiccompounds emitted. In <strong>the</strong>se conditions, <strong>the</strong> 14.7% potential for ozone formation attributed to aldehydesrepresents an over-estimation.Accord<strong>in</strong>g to Cetesb data, annual averages for one-hour maximum ozone concentrations are around90 μg/m 3 <strong>in</strong> São Paulo. As shown <strong>in</strong> Figure 6, all aldehydes toge<strong>the</strong>r represent approximately 14.7% <strong>of</strong> <strong>the</strong>potential for ozone formation among <strong>the</strong> VOCs analyzed. The study by Grosjean et al (2002) shows thatformaldehyde and acetaldehyde are <strong>the</strong> dom<strong>in</strong>ant aldehydes for ozone formation. If percentages attributableto aldehydes <strong>in</strong> ozone formation shown <strong>in</strong> Figure 6 are applied to ambient concentrations measured <strong>in</strong>São Paulo, <strong>the</strong> annual averages for maximum one-hour ozone concentration would be 7.7 μg/m 3 producedby acetaldehyde and 5.6 μg/m 3 produced by formaldehyde. The estimated adverse events attributed underthis scenario to direct and <strong>in</strong>direct effects <strong>of</strong> formaldehyde and acetaldehyde, for <strong>the</strong> metropolitan region<strong>of</strong> São Paulo, are presented <strong>in</strong> Table 8.Figure 6Relative maximum potential for ozone formation <strong>of</strong> <strong>the</strong> classes <strong>of</strong> volatile organic compoundsemitted by automotive sourcesValue determ<strong>in</strong>ed by multiply<strong>in</strong>g <strong>the</strong> emission rate (<strong>in</strong> g.km-1) by <strong>the</strong> respective MIRAlkene41.1%Aromatics32.7%Aldehydes14.7%Alkynes11.3%Carbonyls0.1%0% 10% 20% 30%40% 50%Source: Andrade and cols, 2006.
120 Ethanol and Bioelectricity <strong>Sugarcane</strong> <strong>in</strong> <strong>the</strong> <strong>Future</strong> <strong>of</strong> <strong>the</strong> <strong>Energy</strong> <strong>Matrix</strong>Bi<strong>of</strong>uels policy as a tool to promote public healthFrom what has been presented so far, we see that <strong>the</strong> process <strong>of</strong> fuel production generates pollutants thatare associated with significant damage to health. Given <strong>the</strong> body <strong>of</strong> evidence about <strong>the</strong> adverse health impactsfor sugar workers and <strong>the</strong> residents <strong>of</strong> towns surround<strong>in</strong>g <strong>the</strong> sugarcane plantations it is important to<strong>in</strong>corporate harvest mechanization <strong>in</strong>to ethanol production, so avoid<strong>in</strong>g <strong>the</strong> adverse impacts <strong>of</strong> emissionscom<strong>in</strong>g from straw burn<strong>in</strong>g (Ribeiro H., 2009).When we look at <strong>the</strong> products <strong>of</strong> vehicular emission, acetaldehyde and formaldehyde represent a “newfact” <strong>in</strong> <strong>the</strong> use <strong>of</strong> ethanol as a light vehicle fuel, given <strong>the</strong>ir potential to form ozone. This is particularlyimportant for <strong>the</strong> atmosphere <strong>in</strong> Brazilian cities that have high levels <strong>of</strong> NO 2, a situation imply<strong>in</strong>g that ozoneformation becomes highly dependent on <strong>the</strong> <strong>in</strong>creas<strong>in</strong>g carbonyl concentration.The use <strong>of</strong> ethanol as a fuel for heavy vehicles would also promote changes <strong>in</strong> <strong>the</strong> pr<strong>of</strong>ile <strong>of</strong> emissions. Withrespect to aldehydes, <strong>the</strong> use <strong>of</strong> ethanol means exchang<strong>in</strong>g formaldehyde emissions (a characteristic <strong>of</strong>diesel) for acetaldehyde (ethanol). More importantly, emissions <strong>of</strong> ethanol-fueled vehicles are much lowerthan those <strong>of</strong> <strong>the</strong> vehicles currently <strong>in</strong> use <strong>in</strong> Brazil, mean<strong>in</strong>g that <strong>the</strong> emission <strong>of</strong> exist<strong>in</strong>g particulate matterfrom this automotive source would drop to virtually zero.Each <strong>of</strong> <strong>the</strong> above cases deserves separate consideration. For <strong>the</strong> case <strong>of</strong> light vehicles that use ethanol as fuel,<strong>the</strong> <strong>in</strong>crease <strong>in</strong> emissions <strong>of</strong> aldehydes is accompanied by a reduction <strong>of</strong> o<strong>the</strong>r volatile organic compoundsassociated with gasol<strong>in</strong>e emissions. To simplify matters, we shall outl<strong>in</strong>e a situation <strong>of</strong> exchang<strong>in</strong>g acetaldehydefor benzene, toluene and xylene, which are <strong>the</strong> volatile organic compounds most associated with petroleumderivatives. Consider<strong>in</strong>g <strong>the</strong> emission rates determ<strong>in</strong>ed <strong>in</strong> tunnels (Mart<strong>in</strong>s & Andrade, 2008a) andpresented <strong>in</strong> Table 7, we can <strong>in</strong>fer that <strong>the</strong> potential for ozone formation <strong>of</strong> aromatic compounds (typical <strong>of</strong>petroleum products) is 6.3 times greater than that <strong>of</strong> acetaldehyde. Consider<strong>in</strong>g that aromatic compoundsand olef<strong>in</strong>s have ozone formation potential estimated from tunnel measurements <strong>of</strong> about 32.7% and41.1%, respectively, and tak<strong>in</strong>g <strong>in</strong>to account only <strong>the</strong> reduction <strong>of</strong> aromatic compounds, we can <strong>in</strong>fer thatus<strong>in</strong>g ethanol to replace gasol<strong>in</strong>e would reduce <strong>the</strong> potential for ozone formation by about two times <strong>the</strong>current gasol<strong>in</strong>e formulation. These results are consistent with those found <strong>in</strong> Mart<strong>in</strong>s and Andrade (2006)who – based on simulations with Eulerian photochemical models – obta<strong>in</strong>ed significant reductions <strong>in</strong> ozoneTable 8Lethal effectsEstimate <strong>of</strong> <strong>the</strong> additional number <strong>of</strong> events that can be attributed to <strong>the</strong> direct effects (cases <strong>of</strong> cancer) and<strong>in</strong>direct effects (premature death from ozone formation) <strong>in</strong> <strong>the</strong> São Paulo metropolitan region, tak<strong>in</strong>g as a base estimatesby Cetesb <strong>of</strong> direct emissions <strong>of</strong> <strong>the</strong> vehicle fleet and environmental measures <strong>of</strong> ozone.São Paulo Formaldehyde Acetaldehyde TotalCancer 38 14 52Premature death 120 169 289
Ethanol and Health121Pollution <strong>in</strong> tunnels <strong>in</strong> São PauloEmission factors <strong>of</strong> volatile organic compounds emitted by vehicular sources, calculated from averages <strong>in</strong>tunnels <strong>in</strong> São Paulo, and <strong>the</strong> potential for ozone formation under maximum conditions def<strong>in</strong>ed as <strong>the</strong> product <strong>of</strong> multiply<strong>in</strong>g<strong>the</strong> emissions factor by <strong>the</strong> respective MIR <strong>of</strong> each compound (gO 3/km)Table 7Type MIR Emission (mg/Km) Potential for ozone formationtoluene 2.7 134.5 363.151-butene 8.9 113.9 1013.71n-pentane 1.04 87.9 91.42cyclohexane 1.28 81.3 104.06benzene 0.42 78.3 32.89n-butane 1.02 74.9 76.4M+p-xylene 7.4 62 458.8n-hexane 0.98 60.1 58.91,2,4-trimethylbenzene 8.8 52.5 462formaldehyde 7.2 48.4 348.48acetaldehyde 5.5 45.7 251.35o-xylene 6.5 44.4 288.6n-heptane 0.81 41.1 33.291-ethyl-4-methylbenzene 8.8 32 281.6ethylbenzene 2.7 31.1 83.97n-octane 0.6 29.3 17.58methylpentane 1.5 28.7 43.05aldehydes >C2 6.3 24.9 156.87n-nonane 0.54 22.6 12.2isobutane 1.21 20.9 25.291,3,5-trimethylbenzene 10.1 20.8 210.081-pentene 6.2 19.6 121.523-methylhexane 1.4 19.5 27.31-ethyl-3-methylbenzene 2.7 19.3 52.11cumene 6.5 17.9 116.351-ethyl-2-methylbenzene 8.8 16.4 144.32decanoic acid 0.46 14 6.44n-propylbenzene 2.1 12.2 25.62methylcyclopentane 2.8 11.2 31.36n-undecanoic acid 0.42 9.6 4.03acetone 0.56 9.3 5.21methylcyclohexane 1.8 9.2 16.561-methylethyl benzene 3 8.3 24.92,3-dimethylpentane 1.31 7.9 10.35isoprene 9.1 7.6 69.162-butanone 1.02 6.9 7.041-hexene 4.4 6.8 29.92n-dodecanoic acid 0.38 6.2 2.36Styrene 2.2 5.7 12.542,2-dimethylbutane 0.82 4 3.282.4-dimethylpentane 1.5 3.7 5.552,3-dimethylhexane 1.31 3.3 4.32Source: Mart<strong>in</strong>s et al, 2006.
122 Ethanol and Bioelectricity <strong>Sugarcane</strong> <strong>in</strong> <strong>the</strong> <strong>Future</strong> <strong>of</strong> <strong>the</strong> <strong>Energy</strong> <strong>Matrix</strong>production when consider<strong>in</strong>g a fictional scenario to replace all gasol<strong>in</strong>e with ethanol <strong>in</strong> <strong>the</strong> light vehicle fleet.Various scenarios were considered for different gasol<strong>in</strong>e formulas with reduced aromatics and olef<strong>in</strong>s, buteven so <strong>the</strong> use <strong>of</strong> ethanol had <strong>the</strong> effect <strong>of</strong> a greater reduction <strong>in</strong> ozone production.Particulate matter also merits detailed analysis. An analysis <strong>of</strong> filters conta<strong>in</strong><strong>in</strong>g f<strong>in</strong>e particulate matter,conducted over <strong>the</strong> past three years and associated with receptor model<strong>in</strong>g, <strong>in</strong>dicates that diesel vehicleemissions account for about 25% <strong>of</strong> ambient concentrations <strong>of</strong> this pollutant <strong>in</strong> <strong>the</strong> cities <strong>of</strong> São Paulo andRio de Janeiro. S<strong>in</strong>ce particulate matter emissions from heavy vehicles runn<strong>in</strong>g on ethanol are practicallynonexistent, <strong>the</strong> use <strong>of</strong> ethanol as fuel for heavy vehicles <strong>of</strong>fers significant potential for reduc<strong>in</strong>g f<strong>in</strong>e particulatematter, which is clearly associated with adverse health effects.With respect to mortality, long-term studies conducted by Pope and colleagues (Pope et al, 2002) <strong>in</strong>dicatethat an <strong>in</strong>crease <strong>of</strong> 10 μg/m 3 <strong>in</strong> <strong>the</strong> annual average <strong>of</strong> f<strong>in</strong>e particulate matter leads to a 6% <strong>in</strong>crease <strong>in</strong>general mortality.As for morbidity, several epidemiological studies available <strong>in</strong> <strong>the</strong> literature relate morbid effects with bothrespiratory and cardio-vascular diseases for different age groups <strong>of</strong> <strong>the</strong> population, pr<strong>in</strong>cipally <strong>in</strong> terms <strong>of</strong>hospital admissions.Given that we know <strong>the</strong> epidemiological coefficients for ozone and f<strong>in</strong>e particulate matter, we can calculate <strong>the</strong>expected variations <strong>in</strong> health outcomes for changes <strong>in</strong> pollutant concentration levels by us<strong>in</strong>g equation 12:[Events (MPolt)] = [exp (β*(MPolt)-1] * Total EventswhereEvents is <strong>the</strong> total number <strong>of</strong> morbid outcomes associated with ambient exposure;MPolt is <strong>the</strong> average change <strong>in</strong> pollutant concentration;exp is <strong>the</strong> exponential function;β is <strong>the</strong> regression coefficient obta<strong>in</strong>ed through epidemiologic studies; andTotal Events is <strong>the</strong> total number <strong>of</strong> morbid outcomes <strong>in</strong> <strong>the</strong> period under review.Estimated ambient concentrations <strong>in</strong> scenarios for fuel substitutionWe need data on health outcomes <strong>in</strong> order to apply <strong>the</strong> function described <strong>in</strong> equation 12. Figures regard<strong>in</strong>gmortality and hospital admissions under <strong>the</strong> public health system, as well as <strong>the</strong> coverage rate <strong>of</strong> <strong>the</strong>private health care system, can be obta<strong>in</strong>ed from DATASUS databases. The relationship between remuneration<strong>of</strong> hospital admissions paid for by <strong>the</strong> public system and those paid for by <strong>the</strong> private health systemwere obta<strong>in</strong>ed from <strong>the</strong> São Paulo Hospital das Cl<strong>in</strong>icas. Ambient concentrations <strong>of</strong> ozone, <strong>the</strong> availability<strong>of</strong> ethanol and gasol<strong>in</strong>e <strong>in</strong> <strong>the</strong> metropolitan region <strong>of</strong> São Paulo, and <strong>the</strong> composition <strong>of</strong> gasohol (gasol<strong>in</strong>eblended with ethanol) are available on <strong>the</strong> website <strong>of</strong> Cetesb, <strong>the</strong> São Paulo State environmental agency,while <strong>the</strong> concentrations <strong>of</strong> <strong>in</strong>halable f<strong>in</strong>e particulate matter are at <strong>the</strong> stage <strong>of</strong> be<strong>in</strong>g published.
Ethanol and Health123As ozone is not a pollutant emitted directly by vehicles, but results from <strong>the</strong> photochemical reaction <strong>of</strong>several so-called precursor gases that are emitted by vehicles, among o<strong>the</strong>r sources, we shall consider <strong>the</strong>study by Mart<strong>in</strong>s and Andrade (2008b). This study used model<strong>in</strong>g and simulation to estimate a reduction <strong>of</strong>29 mg/m 3 <strong>in</strong> <strong>the</strong> ambient concentration <strong>of</strong> ozone if all gasol<strong>in</strong>e were to be substituted by ethanol <strong>in</strong> <strong>the</strong> SãoPaulo vehicle fleet. Scenarios for <strong>the</strong> partial replacement <strong>of</strong> gasol<strong>in</strong>e by ethanol <strong>the</strong>refore use a proportionalreduction <strong>of</strong> this ozone concentration.Thus, <strong>the</strong> partial replacement <strong>of</strong> gasol<strong>in</strong>e with ethanol would reduce <strong>the</strong> direct vehicular emission <strong>of</strong> precursorgases, and be potentially capable <strong>of</strong> reduc<strong>in</strong>g <strong>the</strong> ozone concentration <strong>in</strong> <strong>the</strong> same proportion to <strong>the</strong>maximum reduction estimated <strong>in</strong> <strong>the</strong> above-mentioned study. Were ethanol to be used by <strong>the</strong> diesel fleet,this would promote a direct reduction <strong>in</strong> f<strong>in</strong>e particle emissions.Based on <strong>the</strong> above assumptions, we can estimate <strong>the</strong> reduction <strong>in</strong> expected deaths and hospital admissions,avoided by ozone reduction, due to ethanol use <strong>in</strong> <strong>the</strong> scenarios <strong>of</strong> 5%, 10%, 15% and 100% gasol<strong>in</strong>e replacement,and <strong>the</strong> reduction <strong>in</strong> expected deaths and hospital admissions avoided by <strong>the</strong> reduction <strong>of</strong> f<strong>in</strong>eparticulate matter under scenarios <strong>of</strong> 5%, 10%, 15%, 50% and 100% ethanol use <strong>in</strong> <strong>the</strong> heavy vehicle fleet.Table 9 presents <strong>the</strong> impacts on <strong>the</strong> ambient concentration <strong>of</strong> <strong>in</strong>halable f<strong>in</strong>e particulate matter (MP2.5) for<strong>the</strong> diesel/ethanol scenarios, and ozone for <strong>the</strong> gasol<strong>in</strong>e/ethanol scenarios.As shown <strong>in</strong> Table 9, scenarios for ethanol use <strong>in</strong> place <strong>of</strong> diesel allow us to estimate a reduction <strong>in</strong> <strong>the</strong>ambient concentration <strong>of</strong> <strong>in</strong>halable f<strong>in</strong>e particulate matter <strong>of</strong> 2% to 25%, depend<strong>in</strong>g on <strong>the</strong> replacementscenario. When ethanol replaces gasol<strong>in</strong>e, <strong>the</strong>n depend<strong>in</strong>g on <strong>the</strong> replacement scenario we can expected adecrease <strong>of</strong> 2% to 30% <strong>in</strong> <strong>the</strong> ambient concentrations <strong>of</strong> ozone (due to precursors).Estimated health costs avoided through environmental improvementEstablish<strong>in</strong>g priorities for health prevention and management implies <strong>the</strong> need to estimate <strong>the</strong> cost <strong>of</strong> adverseeffects <strong>of</strong> diseases. It is also important as an <strong>in</strong>strument for public management. Several approachescan be used to achieve this goal, <strong>the</strong> most direct one be<strong>in</strong>g to estimate <strong>the</strong> expenditure on direct <strong>in</strong>vestments<strong>in</strong> <strong>the</strong> health system and <strong>of</strong> expenditure lost due to <strong>the</strong> consequences <strong>of</strong> disease.There are various approaches to determ<strong>in</strong><strong>in</strong>g environmental costs, and more specifically <strong>the</strong> public healthcosts aris<strong>in</strong>g from a particular environmental variation, which <strong>in</strong> <strong>the</strong> case <strong>of</strong> this study is a change <strong>in</strong> airquality.The allocation <strong>of</strong> economic value to natural resources is based on pr<strong>in</strong>ciples <strong>of</strong> neoclassical economics,where <strong>the</strong> approach is to assign monetary values to social and environmental losses that result from ambientdegradation. Thus, <strong>the</strong> idea <strong>of</strong> attribut<strong>in</strong>g economic value seeks to treat <strong>the</strong> social costs and benefitsprovided by <strong>the</strong> environment as an economic agent (Pearce, 1987).
124 Ethanol and Bioelectricity <strong>Sugarcane</strong> <strong>in</strong> <strong>the</strong> <strong>Future</strong> <strong>of</strong> <strong>the</strong> <strong>Energy</strong> <strong>Matrix</strong>The most accurate way to measure <strong>the</strong> impact <strong>of</strong> air pollution <strong>in</strong> a given region is to conduct epidemiologicalstudies to establish dose-response functions that correlate morbidity and mortality <strong>in</strong> susceptiblepopulations with ambient air concentrations.Several methods have been used <strong>in</strong> various studies to put a value on health costs associated with ambientpollution. These methods can be grouped <strong>in</strong>to two broad categories. The first approach – defensive expenditure– <strong>in</strong>cludes methods that measure only direct <strong>in</strong>come loss (lost wages and additional costs). Thesedo not <strong>in</strong>clude <strong>in</strong>convenience, suffer<strong>in</strong>g, loss <strong>of</strong> leisure and o<strong>the</strong>r <strong>in</strong>tangible impacts on <strong>in</strong>dividuals and onfamily well-be<strong>in</strong>g, and may well disregard or seriously underestimate <strong>the</strong> health costs <strong>of</strong> people who arenot part <strong>of</strong> <strong>the</strong> labor market. This approach <strong>the</strong>refore <strong>in</strong>dicates only <strong>the</strong> lower limit <strong>of</strong> <strong>the</strong> social costs <strong>of</strong>pollution and underestimates <strong>the</strong> total cost for <strong>in</strong>dividuals. The second broad approach – quota valuation– <strong>in</strong>cludes methods that attempt to capture <strong>the</strong> will<strong>in</strong>gness <strong>of</strong> <strong>in</strong>dividuals to pay to avoid or reduce <strong>the</strong> risk<strong>of</strong> death or disease.The cost <strong>of</strong> illness approach is applied to morbidity. Direct morbidity costs can be divided <strong>in</strong>to two categories:medical expenses for treatment <strong>of</strong> ailments (cost <strong>of</strong> hospital care and out-patient treatment) andloss <strong>of</strong> wages dur<strong>in</strong>g hospitalization, days missed at work and o<strong>the</strong>r times when activities are significantlyrestricted due to illness.The preventive cost approach constitutes an attempt to <strong>in</strong>fer <strong>the</strong> m<strong>in</strong>imum amount that people are will<strong>in</strong>gto pay to reduce health risks, and are calculated based on <strong>the</strong> amount that people liv<strong>in</strong>g <strong>in</strong> polluted areasspend on preventive measures. For example, expenditure on bottled water to avoid water-borne diseases,or <strong>in</strong>stallation <strong>of</strong> air filters to prevent <strong>in</strong>door air pollution.Table 9Scenarios for <strong>the</strong> reduction <strong>of</strong> particulate materialExpected behavior <strong>of</strong> a 2.5 PM concentration for scenarios <strong>of</strong> replacement <strong>of</strong> diesel by ethanol<strong>in</strong> <strong>the</strong> heavy vehicle fleet, and <strong>in</strong> <strong>the</strong> ozone concentration for scenarios for <strong>the</strong> substitution <strong>of</strong> gasol<strong>in</strong>e by ethanol<strong>in</strong> <strong>the</strong> light vehicle fleet <strong>in</strong> <strong>the</strong> São Paulo Metropolitan Region.Fuel substitution scenario Environmental expectation for <strong>the</strong> pollutant concentration Expected variation5% <strong>of</strong> diesel by ethanol10% <strong>of</strong> diesel by ethanol15% <strong>of</strong> diesel by ethanol50% <strong>of</strong> diesel by ethanol100% <strong>of</strong> diesel by ethanolReduction <strong>in</strong> <strong>the</strong> 2.5 PM from direct emissionReduction <strong>in</strong> <strong>the</strong> 2.5 PM from direct emissionReduction <strong>in</strong> <strong>the</strong> 2.5 PM from direct emissionReduction <strong>in</strong> <strong>the</strong> 2.5 PM from direct emissionReduction <strong>in</strong> <strong>the</strong> 2.5 PM from direct emissionUp to 2%Up to 3%Up to 4%Up to 13%Up to 25%5% <strong>of</strong> gasol<strong>in</strong>e by ethanol10% <strong>of</strong> gasol<strong>in</strong>e by ethanol15% <strong>of</strong> gasol<strong>in</strong>e by ethanol100% <strong>of</strong> gasol<strong>in</strong>e by ethanolPotential reduction <strong>of</strong> ozone from precursor emissionsPotential reduction <strong>of</strong> ozone from precursor emissionsPotential reduction <strong>of</strong> ozone from precursor emissionsPotential reduction <strong>of</strong> ozone from precursor emissionsUp to 2%Up to 3%Up to 5%Up to 30%
Ethanol and Health125The cont<strong>in</strong>gency value approach uses survey data to determ<strong>in</strong>e how much people are will<strong>in</strong>g to pay toreduce <strong>the</strong> risk <strong>of</strong> premature death from disease. Studies on cont<strong>in</strong>gency valuation produced Values <strong>of</strong>a Statistical Life (VSL) that are relatively lower than <strong>the</strong> wage differential, rang<strong>in</strong>g from US$1.2 million toUS$9.7 million per statistical life (IEI, 1992; U.S. EPA, 1997).The technique <strong>of</strong> calculat<strong>in</strong>g <strong>the</strong> economic value <strong>of</strong> health impacts used to make this estimate was based onevidence from epidemiological studies and economic <strong>the</strong>ory, developed by <strong>the</strong> World Health Organization(WHO) and by Harvard University. It is called <strong>the</strong> Disability-Adjusted Life Year (DALY), imply<strong>in</strong>g <strong>the</strong> years<strong>of</strong> life lost or lived with disability (Murray and Lopez, 1996). This method is based on studies that associatean ambient factor (<strong>in</strong> this case pollution) with a health <strong>in</strong>dicator (hospital admissions and mortality)to estimate how many years each adverse health event has impacted <strong>the</strong> population. In o<strong>the</strong>r words, howmany years <strong>of</strong> life each affected person has lived with temporary or permanent disability – def<strong>in</strong>ed as healthstatus less than perfect – and how many years <strong>of</strong> life were lost, relative to <strong>the</strong>ir life expectancy, by eachperson suffer<strong>in</strong>g premature death. The years <strong>of</strong> life <strong>in</strong>dicator can be converted <strong>in</strong>to a monetary base for <strong>the</strong>purpose <strong>of</strong> a cost-benefit evaluation (Miraglia, 2002).Techniques to place an economic value on health impacts constitute a tool for evaluat<strong>in</strong>g projects and policiesfor public health and pollution control, lend<strong>in</strong>g support to <strong>the</strong> decision mak<strong>in</strong>g process.In this sense, estimat<strong>in</strong>g potential health costs that could be avoided by virtue <strong>of</strong> ambient improvement <strong>in</strong>air quality aris<strong>in</strong>g from <strong>the</strong> adoption <strong>of</strong> scenarios to use ethanol <strong>in</strong> place <strong>of</strong> gasol<strong>in</strong>e <strong>in</strong> light vehicles, and<strong>in</strong> place <strong>of</strong> diesel <strong>in</strong> heavy vehicles, provide this analysis with an important parameter for benchmark<strong>in</strong>gbi<strong>of</strong>uels policy.Mortality – annual avoided costsTabela 10 shows total annual deaths that would potentially be avoided through <strong>the</strong> use <strong>of</strong> ethanol <strong>in</strong> <strong>the</strong>various scenarios, due to improvements <strong>in</strong> ambient concentrations <strong>of</strong> ozone and f<strong>in</strong>e particulate matter,toge<strong>the</strong>r with <strong>the</strong> related value <strong>of</strong> avoided mortality costs. The calculation <strong>of</strong> value <strong>of</strong> deaths avoided by <strong>the</strong>reductions <strong>in</strong> concentrations <strong>of</strong> ozone and f<strong>in</strong>e particulate matter were obta<strong>in</strong>ed from <strong>the</strong> average values <strong>of</strong>years <strong>of</strong> life lost due to ambient concentrations <strong>of</strong> air pollutants <strong>in</strong> São Paulo (Miraglia et al, 2005) appliedto scenarios for potential mortality reductions (Table 9) and us<strong>in</strong>g <strong>the</strong> current rates <strong>of</strong> life expectancy <strong>of</strong> <strong>the</strong>population (IBGE, 2008).As can be seen <strong>in</strong> Table 10, <strong>the</strong> potential for avoided mortality through <strong>the</strong> <strong>in</strong>troduction <strong>of</strong> ethanol <strong>in</strong>to <strong>the</strong>energy matrix can be translated <strong>in</strong>to annual economic benefits rang<strong>in</strong>g from US$1 million to US$133 million,respectively, for scenarios <strong>of</strong> ethanol replac<strong>in</strong>g 5% <strong>of</strong> gasol<strong>in</strong>e, and 100% <strong>of</strong> diesel. These values po<strong>in</strong>tto <strong>the</strong> magnitude <strong>of</strong> potential benefits that could come from <strong>the</strong> implementation <strong>of</strong> a bi<strong>of</strong>uel policy for <strong>the</strong>Metropolitan Region <strong>of</strong> São Paulo, even under <strong>the</strong> conservative scenarios.
126 Ethanol and Bioelectricity <strong>Sugarcane</strong> <strong>in</strong> <strong>the</strong> <strong>Future</strong> <strong>of</strong> <strong>the</strong> <strong>Energy</strong> <strong>Matrix</strong>Morbidity – annual avoided costsThe estimate <strong>of</strong> morbidity detailed here takes <strong>in</strong>to account only those costs associated with hospital admissionsfor diseases and population age groups that are most consistently associated with air pollution, namely,hospital admissions for respiratory diseases for children up to four years <strong>of</strong> age and adults over 40 years <strong>of</strong>age, and cardiovascular disease only for adults over 40 years <strong>of</strong> age. This estimate may <strong>the</strong>refore be consideredconservative, by omitt<strong>in</strong>g o<strong>the</strong>r less frequent outcomes and o<strong>the</strong>r age groups, but it is <strong>in</strong> l<strong>in</strong>e with <strong>the</strong>criteria commonly used <strong>in</strong> this type <strong>of</strong> estimate.Table 11 shows <strong>the</strong> benefit <strong>in</strong> terms <strong>of</strong> morbidity reduction that would arise as a result <strong>of</strong> us<strong>in</strong>g ethanol <strong>in</strong>place <strong>of</strong> gasol<strong>in</strong>e and diesel. It also presents estimates <strong>of</strong> value for each fleet replacement scenario, us<strong>in</strong>g <strong>the</strong>methodology described.Conservative estimates <strong>the</strong>refore <strong>in</strong>dicate that us<strong>in</strong>g ethanol <strong>in</strong> <strong>the</strong> replacement scenarios described abovewould create a morbidity reduction that, translated <strong>in</strong>to economic benefits, would range from US$0.6 millionto $19.8 million annually for <strong>the</strong> scenarios <strong>of</strong> ethanol replac<strong>in</strong>g 5% diesel and 100% <strong>of</strong> gasol<strong>in</strong>e, respectively,and consider<strong>in</strong>g only <strong>the</strong> Metropolitan Region <strong>of</strong> São Paulo.F<strong>in</strong>al thoughts, and an analysis <strong>of</strong> uncerta<strong>in</strong>tiesThis chapter assumes that impacts on human health should be part <strong>of</strong> <strong>the</strong> life cycle analysis <strong>of</strong> fuels. Theexposure <strong>of</strong> entire populations to atmospheric emissions, both <strong>in</strong> <strong>the</strong> fuel production process as well asfrom vehicle emissions <strong>in</strong> major metropolitan areas, clearly po<strong>in</strong>ts <strong>in</strong> that direction. In <strong>the</strong> case <strong>of</strong> ethanol,both positive and negative characteristics have been identified for its use as an alternative to fossil fuels.Table 10Potential annual variation <strong>in</strong> mortality by scenarios <strong>of</strong> ethanol addition<strong>in</strong> <strong>the</strong> metropolitan region <strong>of</strong> São Paulo and its economic assessmentScenario forsubstitution <strong>of</strong> fuelsAnnual MortalityDiagnosis Quantity US$ million5% <strong>of</strong> diesel by ethanol10% <strong>of</strong> diesel by ethanol15% <strong>of</strong> diesel by ethanol50% <strong>of</strong> diesel by ethanol100% <strong>of</strong> diesel by ethanolReductionReductionReductionReductionReduction37751123737456.6313.4520.0866.89133.605% <strong>of</strong> gasol<strong>in</strong>e by ethanol10% <strong>of</strong> gasol<strong>in</strong>e by ethanol15% <strong>of</strong> gasol<strong>in</strong>e by ethanol100% <strong>of</strong> gasol<strong>in</strong>e by ethanolReductionReductionReductionReduction613191301.072.333.4023.31
Ethanol and Health127The ma<strong>in</strong> negative aspects <strong>in</strong> <strong>the</strong> ethanol production process are <strong>the</strong> process <strong>of</strong> burn<strong>in</strong>g <strong>of</strong>f straw dur<strong>in</strong>gharvest, and <strong>the</strong> question <strong>of</strong> water balance dur<strong>in</strong>g <strong>the</strong> plant’s grow<strong>in</strong>g cycle, toge<strong>the</strong>r with <strong>the</strong> problems <strong>of</strong>mono-culture and land use. Fortunately, <strong>the</strong> <strong>in</strong>dustry can significantly reduce this trend via self regulation.The assessment <strong>of</strong> <strong>the</strong> current impacts <strong>of</strong> sugarcane straw burn<strong>in</strong>g is based on <strong>the</strong> few studies that havebeen conducted <strong>in</strong> São Paulo. The absence <strong>of</strong> an efficient monitor<strong>in</strong>g network <strong>in</strong> rural areas complicatesan <strong>in</strong>-depth analysis <strong>of</strong> this issue. Burn<strong>in</strong>g sugarcane straw also underm<strong>in</strong>es bio-ethanol’s efficiency <strong>in</strong> <strong>the</strong>balance <strong>of</strong> greenhouse gases. Consider<strong>in</strong>g <strong>the</strong>se two po<strong>in</strong>ts – local effects <strong>of</strong> pollutants and global effectson climate – <strong>the</strong> conclusion must be that <strong>the</strong>re is no environmental or human health argument to justifystraw burn<strong>in</strong>g prior to harvest.With regards to <strong>the</strong> effects <strong>of</strong> vehicle emissions, ethanol has advantages over both gasol<strong>in</strong>e and diesel. Thisis evidenced by <strong>the</strong> favorable balance <strong>in</strong> terms <strong>of</strong> global climate change, and also as a factor <strong>in</strong> reduc<strong>in</strong>g troposphericozone production (when used as a substitute for gasol<strong>in</strong>e) and aerosol (substitut<strong>in</strong>g diesel). Given<strong>the</strong> quality <strong>of</strong> petroleum derivative fuels sold <strong>in</strong> Brazil today, ethanol constitutes an alternative with<strong>in</strong> <strong>the</strong> list<strong>of</strong> measures and possible improvements <strong>in</strong> terms <strong>of</strong> air quality and reduced health impacts <strong>of</strong> air pollution.One <strong>of</strong> <strong>the</strong> most significant aspects, <strong>in</strong> our view, is us<strong>in</strong>g ethanol <strong>in</strong> bus fleets <strong>in</strong> major urban centers.The impact <strong>of</strong> ethanol on ozone production is one <strong>of</strong> <strong>the</strong> key po<strong>in</strong>ts <strong>in</strong> <strong>the</strong> discussion about <strong>the</strong> health effects<strong>of</strong> ethanol emissions. Given <strong>the</strong> current formulation <strong>of</strong> Brazilian gasol<strong>in</strong>e, current vehicle technology,and <strong>the</strong> scenario <strong>of</strong> high concentrations <strong>of</strong> nitrogen oxides <strong>in</strong> Brazilian cities, our projections are that fuelethanol reduces tropospheric ozone formation. In this case, <strong>the</strong>re are some degrees <strong>of</strong> uncerta<strong>in</strong>ty. Themost significant limitation here is <strong>the</strong> lack <strong>of</strong> historical and consolidated data for ambient concentrations<strong>of</strong> aldehydes <strong>in</strong> <strong>the</strong> regions under study. The available data relate to sampl<strong>in</strong>g periods with different sampl<strong>in</strong>gtimes and were usually performed <strong>in</strong> isolated spots. It is regrettable that Brazil, where <strong>the</strong> last threedecades have seen significant changes <strong>in</strong> <strong>the</strong> matrix <strong>of</strong> automotive fuels, has paid so little attention toambient measurement <strong>of</strong> aldehydes. Ano<strong>the</strong>r limit<strong>in</strong>g aspect <strong>of</strong> <strong>the</strong> study is <strong>the</strong> shortage <strong>of</strong> data for auto-Table 11Annual potential variation <strong>of</strong> morbidity under scenarios for <strong>the</strong> addition <strong>of</strong> ethanol<strong>in</strong> <strong>the</strong> São Paulo Metropolitan Region, and respective economic valuesScenario forsubstitution <strong>of</strong> fuelsAnnual morbidityHospitalizations (SUS and private)Diagnosis Quantity US$ million5% <strong>of</strong> diesel by ethanol10% <strong>of</strong> diesel by ethanol15% <strong>of</strong> diesel by ethanol50% <strong>of</strong> diesel by ethanol100% <strong>of</strong> diesel by ethanolReductionReductionReductionReductionReduction2244506752,2704,5880.631.261.896.3812.865% <strong>of</strong> gasol<strong>in</strong>e by ethanol10% <strong>of</strong> gasol<strong>in</strong>e by ethanol15% <strong>of</strong> gasol<strong>in</strong>e by ethanol100% <strong>of</strong> gasol<strong>in</strong>e by ethanolReductionReductionReductionReduction3987951,1938,0020.981.962.9519.79
128 Ethanol and Bioelectricity <strong>Sugarcane</strong> <strong>in</strong> <strong>the</strong> <strong>Future</strong> <strong>of</strong> <strong>the</strong> <strong>Energy</strong> <strong>Matrix</strong>motive emissions based on measurements <strong>in</strong> <strong>the</strong> field, such as <strong>the</strong> tunnels experiments mentioned earlier.Significant changes <strong>in</strong> fleet pr<strong>of</strong>ile – <strong>the</strong> <strong>in</strong>troduction <strong>of</strong> flex-fuel vehicles and <strong>the</strong> significant conversion <strong>of</strong>part <strong>of</strong> <strong>the</strong> fleet to vehicles runn<strong>in</strong>g on natural gas – could not be considered <strong>in</strong> this study, a step that wouldhave allowed health risks to be broken down by sectors <strong>of</strong> <strong>the</strong> vehicle fleet.The two above-mentioned factors prevent <strong>the</strong> creation <strong>of</strong> photochemical models with <strong>the</strong> accuracy neededto assess <strong>the</strong> contribution <strong>of</strong> different fuels to <strong>the</strong> production <strong>of</strong> aldehydes and ozone. It is <strong>the</strong>refore necessaryto obta<strong>in</strong> this key <strong>in</strong>formation to reduce <strong>the</strong> uncerta<strong>in</strong>ty <strong>of</strong> <strong>the</strong> estimates and, as a consequence,to support <strong>the</strong> development <strong>of</strong> consistent public policies <strong>in</strong> <strong>the</strong> areas <strong>of</strong> air pollution and public health <strong>in</strong>urban centers.There is also a lack <strong>of</strong> studies on <strong>the</strong> effects <strong>of</strong> bi<strong>of</strong>uels use on <strong>the</strong> emissions <strong>of</strong> heavy vehicles, with respectto <strong>the</strong> behavior <strong>of</strong> <strong>the</strong> eng<strong>in</strong>e and <strong>the</strong> filter system for particulate matter. There are many studies regard<strong>in</strong>gchanges <strong>in</strong> emissions <strong>of</strong> nitrogen oxides and f<strong>in</strong>e particles due to <strong>the</strong> use <strong>of</strong> bi<strong>of</strong>uels <strong>in</strong> heavy vehicle eng<strong>in</strong>es.The calculation <strong>of</strong> <strong>the</strong> economic value <strong>of</strong> environmental benefits translated <strong>in</strong>to health <strong>in</strong>dicators shows afavorable scenario for implement<strong>in</strong>g such a change <strong>in</strong> <strong>the</strong> current energy matrix, <strong>in</strong>creas<strong>in</strong>g resources foro<strong>the</strong>r <strong>in</strong>vestments which should prioritize <strong>the</strong> health <strong>of</strong> populations exposed to air pollutants, as well asrail transportation.
Ethanol and Health129Concept <strong>of</strong> adverse or harmful effect on human healthAnnex 1The most widely adopted def<strong>in</strong>ition used to describe an adverse health effect is <strong>the</strong> one approved by<strong>the</strong> American Thoracic Society (1995). This def<strong>in</strong>es a health impact as “a significant medical event, characterizedby one or more <strong>of</strong> <strong>the</strong> follow<strong>in</strong>g factors: 1) <strong>in</strong>terference with <strong>the</strong> normal activity <strong>of</strong> <strong>the</strong> affected<strong>in</strong>dividuals; 2) episodic respiratory illness; 3) <strong>in</strong>capacitat<strong>in</strong>g illness; 4) permanent respiratory disease;5) progressive respiratory dysfunction.”In 2000, <strong>in</strong> light <strong>of</strong> new scientific knowledge, <strong>the</strong> American Thoracic Society expanded <strong>the</strong> scope <strong>of</strong> itsprevious def<strong>in</strong>ition, <strong>in</strong>corporat<strong>in</strong>g <strong>the</strong> follow<strong>in</strong>g events: biomarkers, quality <strong>of</strong> life, physiological effects,symptoms, <strong>in</strong>creased demand for medical care and f<strong>in</strong>ally, mortality (American Thoracic Society, 2000).More recently, <strong>in</strong> 2004, <strong>the</strong> American Cardiology Society (Brook et al, 2004) published a document acknowledg<strong>in</strong>gair pollution as a risk factor for aggravat<strong>in</strong>g cardiovascular diseases, <strong>in</strong> particular acute myocardial<strong>in</strong>farction, congestive heart failure, and <strong>the</strong> development <strong>of</strong> arrhythmias.Studies with data from <strong>the</strong> American Cancer Society (Pope et al, 2002) <strong>in</strong>clude lung cancer as an <strong>in</strong>dicator<strong>of</strong> <strong>the</strong> effects <strong>of</strong> air pollution. F<strong>in</strong>ally, reproductive alterations such as low birth weight, miscarriage andabnormal sex ratio at birth have also been <strong>in</strong>corporated <strong>in</strong>to <strong>the</strong> set <strong>of</strong> <strong>in</strong>dicators <strong>of</strong> significant adverseeffects <strong>of</strong> air pollution.As mentioned above, several adverse effects <strong>of</strong> air pollution on human health can be identified. Some <strong>of</strong><strong>the</strong>m are acutely apparent, manifest<strong>in</strong>g just hours or days after exposure, while o<strong>the</strong>rs become evident onlyafter long periods <strong>of</strong> exposure. Both <strong>the</strong> acute and chronic effects may exhibit different levels <strong>of</strong> severity,rang<strong>in</strong>g from vague discomfort to death – <strong>the</strong> outcome <strong>of</strong> greatest severity. Some examples may help tobetter clarify <strong>the</strong>se ideas. Increases <strong>in</strong> air pollution will cause cognitive alterations or non-specific irritability<strong>in</strong> a large fraction <strong>of</strong> <strong>the</strong> population. A smaller proportion <strong>of</strong> exposed <strong>in</strong>dividuals will present <strong>in</strong>creases <strong>in</strong>plasma markers and lung <strong>in</strong>flammation, <strong>in</strong>dicat<strong>in</strong>g <strong>the</strong> presence <strong>of</strong> subcl<strong>in</strong>ical <strong>in</strong>flammation. In an evensmaller proportion <strong>of</strong> <strong>the</strong> population, this <strong>in</strong>flammation may cause functional alterations such as <strong>in</strong>creasedblood pressure, mild disturbance <strong>of</strong> autonomic heart control or a reduction <strong>in</strong> <strong>in</strong>dicators <strong>of</strong> lung function.At a greater level <strong>of</strong> severity, chronic users <strong>of</strong> medication to control respiratory and cardiac diseases (forexample, asthma and hypertension) will need larger amounts <strong>of</strong> drugs to control <strong>the</strong>ir conditions. There willbe those who, unable to control <strong>the</strong> changes by <strong>the</strong>mselves, consult a doctor or, <strong>in</strong> more serious cases, willreceive treatment at first aid posts or hospitals. F<strong>in</strong>ally, a fraction <strong>of</strong> those affected will die <strong>the</strong> same day, ora few days later, due to <strong>the</strong> effects <strong>of</strong> <strong>the</strong> pollution to which <strong>the</strong>y were exposed (Figure 2).Most studies that use severe outcomes, such as respiratory hospitalizations and mortality, to assess acutepollution effects are likely to have human health and air pollution related coefficients that underm<strong>in</strong>e <strong>the</strong>real effects, s<strong>in</strong>ce events that affect quality <strong>of</strong> life, such as impaired control <strong>of</strong> chronic diseases, are notaccounted for by <strong>the</strong> lack <strong>of</strong> mandatory report<strong>in</strong>g <strong>of</strong> such issues.
130 Ethanol and Bioelectricity <strong>Sugarcane</strong> <strong>in</strong> <strong>the</strong> <strong>Future</strong> <strong>of</strong> <strong>the</strong> <strong>Energy</strong> <strong>Matrix</strong>Annex 1Concept <strong>of</strong> adverse or harmful effect on human healthLong-term studies that monitor population groups for extended periods <strong>of</strong> time recognized that pollutioneffects could only be detected after years <strong>of</strong> exposure. Similar to <strong>the</strong> effects <strong>of</strong> cigarettes, which only manifestafter years <strong>of</strong> tobacco consumption, pollution presents, to a lesser extent, some <strong>of</strong> <strong>the</strong> same chronic effects.Table 2 shows <strong>the</strong> relationship <strong>of</strong> some chronic effects <strong>of</strong> air pollution.Figure 2Diagrammaticrepresentation <strong>of</strong> <strong>the</strong>relationship between <strong>the</strong>severity <strong>of</strong> pollution effectsand <strong>the</strong> number <strong>of</strong> peopleaffected by pollution <strong>in</strong> agiven community.DeathHospitaladmissionsIncrease <strong>in</strong>medical consultationsIncrease <strong>in</strong> use <strong>of</strong> medic<strong>in</strong>eNumber <strong>of</strong> people affectedSource: adapted fromAmerican ThoracicSociety, 2000.Subcl<strong>in</strong>ical <strong>in</strong>flamationTable 2Some <strong>of</strong> <strong>the</strong> secondary outcomes most consistently reported <strong>in</strong> <strong>the</strong> literatureas relat<strong>in</strong>g to chronic exposure to air pollutantsIncreased respiratory symptomsReduced lung functionReduction <strong>of</strong> birth weightGreater <strong>in</strong>cidence <strong>of</strong> obstructive pulmonary diseaseWorsen<strong>in</strong>g <strong>of</strong> arterial a<strong>the</strong>roscleroticIncreased frequency <strong>of</strong> abortionsHigher <strong>in</strong>cidence <strong>of</strong> pulmonary neoplasmsLoss <strong>of</strong> years <strong>of</strong> life due to cardio-respiratory diseasesSource: adapted from WHO, 2006.
Ethanol and Health131Aldehydes as ozone precursorsAnnex 2The general simplified equations govern<strong>in</strong>g photochemical atmospheric pollution can be summarized asfollows:NO 2is dissociated by <strong>the</strong> action <strong>of</strong> ultraviolet rays form<strong>in</strong>g NO and atomic oxygen;(1) NO 2+ hv (λ ≤ 430 nm) → NO + OThe oxygen atom comb<strong>in</strong>es with one molecule <strong>of</strong> oxygen to form ozone;(2) O + O 2→ O 3Ozone is decomposed by <strong>the</strong> reaction with NO, form<strong>in</strong>g NO 2and one oxygen molecule;(3) NO + O 3→ NO 2+ O 2The process described <strong>in</strong> reactions 1 to 3 is photostationary. In o<strong>the</strong>r words, <strong>the</strong> balance <strong>of</strong> ozone productionis close to zero. However, <strong>the</strong> atmosphere <strong>of</strong> major cities favors <strong>the</strong> disruption <strong>of</strong> photostationary cycle,allow<strong>in</strong>g <strong>the</strong> generation <strong>of</strong> significant amounts <strong>of</strong> ozone, as clearly shown by environmental measurementstaken <strong>in</strong> Brazilian urban centers. The reaction <strong>of</strong> NO with peroxides is <strong>the</strong> greatest cause <strong>of</strong> photochemicalimbalance, as shown <strong>in</strong> reaction 4;(4) NO + RO 2·→ NO 2+ ROAtmospheric peroxides are formed by <strong>the</strong> oxidation <strong>of</strong> several organic compounds, as shown <strong>in</strong> <strong>the</strong> follow<strong>in</strong>gequations, which illustrate possible outcomes <strong>of</strong> <strong>the</strong> oxidation <strong>of</strong> an alkene;(5) RCHCHR + O → RCH 2· + RCO· (generation <strong>of</strong> free radicals)(6) RCH 2· + O 2→ RCH 2O 2(generation <strong>of</strong> peroxides)(7) RCH 2O·+ O 2→ RCHO + HO 2· (generation <strong>of</strong> aldehydes)(8) RCH 2O 2· + NO 2→ RCH 2O 2NO 2(generation <strong>of</strong> organic nitrates)The group <strong>of</strong> above-mentioned reactions exemplifies some <strong>of</strong> <strong>the</strong> possibilities by which volatile organiccompounds (VOCs), such as aldehydes, can be generated or <strong>in</strong>terfere with <strong>the</strong> stationary photochemicalequilibrium, allow<strong>in</strong>g <strong>the</strong> formation <strong>of</strong> ozone. The process can be summarized as follows: <strong>in</strong> <strong>the</strong> absence <strong>of</strong>VOCs, <strong>the</strong> amount <strong>of</strong> ozone formed <strong>in</strong> <strong>the</strong> troposphere is very low; <strong>the</strong> presence <strong>of</strong> VOCs can consume NOor convert NO to NO2, creat<strong>in</strong>g <strong>the</strong> real possibility <strong>of</strong> <strong>the</strong> formation <strong>of</strong> ozone, accord<strong>in</strong>g to <strong>the</strong> follow<strong>in</strong>ggeneral formulas:(9) VOC + OH· → RO 2· + <strong>in</strong>termediate products(10) RO 2· + NO → NO 2+ free radicals(11) radicals → OH· + <strong>in</strong>termediate products
132 Ethanol and Bioelectricity <strong>Sugarcane</strong> <strong>in</strong> <strong>the</strong> <strong>Future</strong> <strong>of</strong> <strong>the</strong> <strong>Energy</strong> <strong>Matrix</strong>Annex 2Aldehydes as Ozone PrecursorsUnder <strong>the</strong> conditions set out above, <strong>the</strong> process <strong>of</strong> ozone formation is dependent on <strong>the</strong> amount <strong>of</strong> VOCsavailable <strong>in</strong> <strong>the</strong> troposphere, as well as <strong>the</strong> amount <strong>of</strong> OH radicals or o<strong>the</strong>r chemical species with whichVOCs can <strong>in</strong>teract (Carter, 1994). The <strong>in</strong>fluence <strong>of</strong> VOCs on ozone formation depends on <strong>the</strong> amount <strong>of</strong>NOx available. If NOx levels are sufficiently high, <strong>the</strong> amount <strong>of</strong> VOCs is <strong>the</strong> limit<strong>in</strong>g factor for ozone formation.In <strong>the</strong>se conditions, when NOx concentrations are high, <strong>the</strong> NOx <strong>in</strong>hibits <strong>the</strong> formation <strong>of</strong> ozonebecause <strong>the</strong> reaction <strong>of</strong> OH with NO 2limits <strong>the</strong> formation <strong>of</strong> reactive species <strong>in</strong> <strong>the</strong> atmosphere. On <strong>the</strong>o<strong>the</strong>r hand, when NOx concentrations are low, ozone formation is dependent on <strong>the</strong> availability <strong>of</strong> NOx,caus<strong>in</strong>g <strong>the</strong> <strong>in</strong>crease <strong>in</strong> <strong>the</strong> concentration <strong>of</strong> NOx to <strong>in</strong>crease <strong>the</strong> rate <strong>of</strong> ozone formation.These equations expla<strong>in</strong> <strong>the</strong> sequence <strong>of</strong> ozone formation. However, at night and close to large sources <strong>of</strong>NO (for example high-traffic zones), ozone concentrations are reduced via processes <strong>of</strong> removal <strong>of</strong> O 3by<strong>the</strong> reaction with NO [equation 3].Dur<strong>in</strong>g <strong>the</strong> day this reaction is generally balanced by <strong>the</strong> photolysis <strong>of</strong> NO 2[equation 1]. However <strong>in</strong> <strong>the</strong>vic<strong>in</strong>ity <strong>of</strong> large emissions <strong>of</strong> NO <strong>the</strong> net result is <strong>the</strong> conversion <strong>of</strong> O3 to NO 2. In <strong>the</strong> vic<strong>in</strong>ity <strong>of</strong> such sources,ozone is consumed and can become higher as <strong>the</strong> plume moves with <strong>the</strong> w<strong>in</strong>d (plume ag<strong>in</strong>g). As <strong>the</strong>re isno photolysis <strong>of</strong> NO 2at night, this [equation 3] leads to ozone removal.The classification between systems with saturation <strong>of</strong> NOx and sensitive to NOx (NOx-limited) is determ<strong>in</strong>ed by<strong>the</strong> chemistry <strong>of</strong> hydroxyl radical (OH) and hydroperoxide (HO 2) and peroxyl radicals <strong>in</strong> organic RO 2form.The atmosphere manifests a system that is sensitive to NOx (NOx-limited) when peroxides and carboxylicacids represent <strong>the</strong> dom<strong>in</strong>ant radical s<strong>in</strong>k. In this case, <strong>the</strong> ambient concentrations <strong>of</strong> HO 2and RO 2will bedeterm<strong>in</strong>ed by <strong>the</strong> balance between free radical sources and reactions for <strong>the</strong> formation <strong>of</strong> peroxides andcarboxylic acids.S<strong>in</strong>ce <strong>the</strong> rate <strong>of</strong> peroxide formation is quadratic <strong>in</strong> HO 2, ambient concentrations <strong>of</strong> HO 2and RO 2vary onlyslightly <strong>in</strong> response to changes <strong>in</strong> NOx and VOC. The rate <strong>of</strong> ozone formation is determ<strong>in</strong>ed by <strong>the</strong> reaction<strong>of</strong> HO 2and RO 2with NO. In polluted regions <strong>the</strong> rate <strong>of</strong> ozone formation is generally little affected byvariations <strong>in</strong> VOC. In more remote areas, <strong>the</strong> rate <strong>of</strong> ozone formation also <strong>in</strong>creases with <strong>the</strong> <strong>in</strong>crease <strong>in</strong>concentration <strong>of</strong> VOCs.NOx-saturated regimes (VOC-limited) occur when nitric acid is <strong>the</strong> dom<strong>in</strong>ant radical s<strong>in</strong>k. In this case, ambientconcentrations <strong>of</strong> OH will be determ<strong>in</strong>ed by <strong>the</strong> balance between free radicals and <strong>the</strong> reaction <strong>of</strong> OHwith NO 2. S<strong>in</strong>ce <strong>the</strong> rate <strong>of</strong> nitric acid formation <strong>in</strong>creases with NO 2, <strong>the</strong> ambient OH decreases with <strong>the</strong><strong>in</strong>crease <strong>of</strong> NO 2. The rate <strong>of</strong> ozone formation is determ<strong>in</strong>ed by <strong>the</strong> rate <strong>of</strong> VOC and CO reaction with OH.This rate <strong>in</strong>creases with <strong>in</strong>creas<strong>in</strong>g VOC and decreases with <strong>in</strong>creas<strong>in</strong>g NOx.
Ethanol and Health133Aldehydes as Ozone PrecursorsAnnex 2The division between regimes that are sensitive to NOx (NOx-limited) or to VOCs (VOC-limited) isclosely related to <strong>the</strong> ratio <strong>of</strong> <strong>the</strong> sum <strong>of</strong> VOCs with NO 2, bear<strong>in</strong>g <strong>in</strong> m<strong>in</strong>d that <strong>the</strong> sums are weightedby <strong>the</strong> reactivity <strong>of</strong> <strong>the</strong> VOCs.The ratio <strong>of</strong> free radicals to <strong>the</strong> rate <strong>of</strong> nitric acid formation is proportional to <strong>the</strong> ratio <strong>of</strong> <strong>the</strong> sum <strong>of</strong>all VOCs (weighted by reactivity with OH) with NO 2. When this ratio is high, <strong>the</strong> peroxides become<strong>the</strong> dom<strong>in</strong>ant radical s<strong>in</strong>k and conditions are sensitive to NOx. When this ratio is low, nitric acidbecomes <strong>the</strong> dom<strong>in</strong>ant radical s<strong>in</strong>k and conditions are <strong>of</strong> NOx saturation. Ozone photolysis is <strong>the</strong>greatest source <strong>of</strong> <strong>the</strong> hydroxyl radical (OH) <strong>in</strong> <strong>the</strong> troposphere <strong>of</strong> remote regions, mean<strong>in</strong>g that an<strong>in</strong>crease <strong>in</strong> O 3will produce more OH, result<strong>in</strong>g <strong>in</strong> a decrease <strong>in</strong> <strong>the</strong> lifetime <strong>of</strong> many trace speciessuch as methane and hydrochlor<strong>of</strong>luorocarbons (HCFCs), which are species <strong>of</strong> great importance tophysical and chemical processes <strong>in</strong> <strong>the</strong> stratosphere.
134 Ethanol and Bioelectricity <strong>Sugarcane</strong> <strong>in</strong> <strong>the</strong> <strong>Future</strong> <strong>of</strong> <strong>the</strong> <strong>Energy</strong> <strong>Matrix</strong>Bibliography. Air Quality Guidel<strong>in</strong>es – Global Update 2005: Particulate matter, ozone, nitrogen dioxide and sulfur dioxide. WorldHealth Organization, 2006.. Andrade, J.B., Pereira, P.A.P., Miguel, A.H. Measurements <strong>of</strong> semivolatile polycyclic aromatic hydrocarbons <strong>in</strong> a busstation and an urban tunnel <strong>of</strong> Salvador, Brazil. Journal <strong>of</strong> Environmental Monitor<strong>in</strong>g, England, v. 4, p. 558-561, 2002.. Andrade, M.F. Caracterização das fontes de material particulado e ozônio troposféricos na Região Metropolitana deSão Paulo; Tenureship <strong>the</strong>sis. Instituto de Astronomia Ge<strong>of</strong>ísica e Ciências Atmosféricas. 2006.. Bell M.L., Dom<strong>in</strong>ici F., Samet J.M. A meta-analysis <strong>of</strong> time-series studies <strong>of</strong> ozone and mortality with comparison to<strong>the</strong> national morbidity, mortality, and air pollution study. Epidemiology, 2005, 16:436–445.. Brook R.D. et al. Inhalation <strong>of</strong> f<strong>in</strong>e particulate air pollution and ozone causes acute arterial vasoconstriction <strong>in</strong> healthyadults. Circulation, 2002, 105:1534–1536.. Cec<strong>in</strong>ato A., Yassaa N., Di Palo V., Possanz<strong>in</strong>o M. Observation <strong>of</strong> volatile and semi-volatile carbonyls <strong>in</strong> an Algerianurban environment us<strong>in</strong>g d<strong>in</strong>itrophenylhydraz<strong>in</strong>e/sílica-HPLC and pentafluorophenylhydraz<strong>in</strong>e/sílica-GC-MS. J EnvironMonit, v. 4, p. 223-228, 2002.. Chen L. et al. Elementary school absenteeism and air pollution. Inhalation Toxicology, 2000, 12:997–1016.. Companhia de Tecnologia de Saneamento Ambiental (Ceteb) [web site]. São Paulo, Brazil, 2004 (www.cetesb.sp.gov.br, accessed November 8, 2006).. Corrêa S.M., Mart<strong>in</strong>s E., Arbilla G. Formaldehyde and acetaldehyde <strong>in</strong> high traffic street <strong>of</strong> Rio de Janeiro, Brazil.Atmospheric Environment; v. 37, I. 1, p. 23-29, 2003.. Gent J.F. et al. Association <strong>of</strong> low-level ozone and f<strong>in</strong>e particles with respiratory symptoms <strong>in</strong> children with asthma.Jama, 2003, 290:1915–1917.. Gilliland F.D. et al. The effects <strong>of</strong> ambient air pollution on school absenteeism due to respiratory illnesses.Epidemiology, 2001, 12:43–54.. Grosjean D., Grosjean E., Moreira L.F.R. Speciated Ambient Carbonyls <strong>in</strong> Rio de Janeiro, Brazil. Environ. Sci. Technol;v. 36, p. 1389-1395, 2002.. Gryparis A. et al. Acute effects <strong>of</strong> ozone on mortality from <strong>the</strong> “Air pollution and health: a European approach”project. American Journal <strong>of</strong> Respiratory and Critical Care Medic<strong>in</strong>e, 2004, 170:1080–1087.. IBGE. Breves notas sobre a mortalidade no Brasil no período 1991/2007. 2008. IEI (Industrial Economics Incorporated). Revisions to <strong>the</strong> proposed value <strong>of</strong> life, Memo, Cambridge, Mass., 1992.. Ito K., DeLeon S.F., Lippmann M. Associations between ozone and daily mortality: Analysis and meta-analysis.Epidemiology, 2005, 16:446–457.. Kovats R.S., Campbell-Lendrum D., Matthies F. Climate change and human health: estimat<strong>in</strong>g avoidable deaths anddisease. Risk Analysis; v. 25, p. 1409-18, 2005.. Levy J.I., Chemeryynski S.M., Sarnat J.A. Ozone exposure and mortality: an empiric Bayes multiregression analysis.Epidemiology, 2005, 16:458–468.. Mart<strong>in</strong>s L.C.; Pereira L.A.A.; L<strong>in</strong> C.A.; Prioli, G.; Luiz O.D.C.; Saldiva P.H.N.; Braga A.L.F. The Effects <strong>of</strong> Air Pollutionon Cardiovascular Diseases: Lag Structures. Efeitos da Poluição do Ar nas Doenças Cardiovasculares: Estruturas deDefasagem. Revista de Saúde Pública / Journal <strong>of</strong> Public Health, 2006, v. 40, n. 4, p. 677-683.. Mart<strong>in</strong>s L.D., Andrade M.F. Emission scenario assessment <strong>of</strong> gasohol reformulation proposals and ethanol use <strong>in</strong> <strong>the</strong>Metropolitan Area <strong>of</strong> São Paulo. The Open Atmospheric Science Journal; v. 2, p. 131-140, 2008b.
Ethanol and Health135. Mart<strong>in</strong>s L.D., Andrade M.F. Ozone formation potentials <strong>of</strong> volatile organic compounds and sensitivety to <strong>the</strong>iremission <strong>in</strong> <strong>the</strong> megacity <strong>of</strong> São Paulo, Brazil. Water, Air and Soil Pollution; v. 195, p. 201-213, 2008a.. Mart<strong>in</strong>s M.A.H., Fatigati F.L., Véspoli T.C., Mart<strong>in</strong>s L.C., Pereira L.A.A., Mart<strong>in</strong>s M.A., Saldiva P.H.N., Braga A.L.F.Influence <strong>of</strong> socioeconomic conditions on air pollution adverse health effects <strong>in</strong> eldery people: an analysis <strong>of</strong> sixregions <strong>in</strong> São Paulo, Brazil. J Epidemiol Community Health; v. 58, p. 41-46, 2004.. McDowell C.J., Powers S.E. Mechanisms affect<strong>in</strong>g <strong>the</strong> <strong>in</strong>filtration and distribution <strong>of</strong> ethanol-blended gasol<strong>in</strong>e <strong>in</strong> <strong>the</strong>vadose zone. Environ Sci Technol, v. 37(9), p. 1803-10, 2003.. Miraglia S.G.E.K., Saldiva P.H.N., Böhm G.M. An Evaluation <strong>of</strong> Air Pollution Health. Impacts and Costs <strong>in</strong> São Paulo,Brazil. Environmental Management, v. 35, n. 5, p. 667-76, 2005.. Miraglia S.G.E.K. O ônus da poluição atmosférica sobre a população do Município de São Paulo: uma aplicação dométodo Daly; estimativa em anos de vida perdidos e vividos com <strong>in</strong>capacidades. Doctoral <strong>the</strong>sis, FMUSP, 2002.. Monteiro L., Vasconcellos P., Souza S., Pires M., Sanchez O., Andrade M.F., Carvalho L. Measurements <strong>of</strong>Atmospheric Carboxylic Acids and Carbonyl Compounds <strong>in</strong> São Paulo City, Brazil. Environmental Science andTechnology (Wash<strong>in</strong>gton), USA, v. 35, p. 3071-3081. 2001.. Nguyena H.T.H., Takenaka N., Bandowa H., Maeda Y., Oliva S.T., Botelho T.M. Atmospheric alcohols and aldehydesconcentrations measured <strong>in</strong> Osaka, Japan and <strong>in</strong> São Paulo, Brazil. Atmospheric Environment; v. 35, I. 18, p. 3075-83, 2001.. Park H. et al. Association <strong>of</strong> air pollution with absenteeism due to illness. Archives <strong>of</strong> Pediatric and AdolescentMedic<strong>in</strong>e, 2002, 156:1235–1239.. Pearce D. Foundations <strong>of</strong> an ecological economics. Ecological Modell<strong>in</strong>g, v. 8, p. 9-18, 1987.. Pope C.A. et al. Lung cancer, cardiopulmonary mortality, and long-term exposure to f<strong>in</strong>e particulate air pollution.Jama, 2002, 287:1132–1141.. Ribeiro, H. Can urban areas close to sugarcane production be healthy? Journal <strong>of</strong> Urban Health, v. 86, p. 479-479, 2009.. Romieu I. et al. Antioxidant supplementation and lung functions among children with asthma exposed to high levels<strong>of</strong> air pollutants. American Journal <strong>of</strong> Respiratory and Critical Care Medic<strong>in</strong>e, 2002, 166:703–709.. Saldiva P.H.N.; Simões S.M.; Santos M.A.; Fernezlian S.M.; Garippo A.L.; Mart<strong>in</strong>s M.A.; Mauad T.; Dolhnik<strong>of</strong>f M.Inflammatory Cell Mapp<strong>in</strong>g <strong>of</strong> <strong>the</strong> Respiratory Tract <strong>in</strong> Fatal Asthma. Cl<strong>in</strong>ical and Experimental Allergy; 2005, v. 35,n. 5, p. 602-611.. Schwartz J. How sensitive is <strong>the</strong> association between ozone and daily deaths to control for temperature? Journal <strong>of</strong>Respiratory and Critical Care Medic<strong>in</strong>e, 2005, 171:627–631.. US EPA. The Costs and Benefits <strong>of</strong> <strong>the</strong> Clean Air Act, 1997.Explanatory NotesiComeap (Committee on <strong>the</strong> Medical Effects <strong>of</strong> Air Pollution).iiIris (Integrated Risk Information System).
136 Ethanol and Bioelectricity <strong>Sugarcane</strong> <strong>in</strong> <strong>the</strong> <strong>Future</strong> <strong>of</strong> <strong>the</strong> <strong>Energy</strong> <strong>Matrix</strong>05
Ethanol and Bioelectricity <strong>Sugarcane</strong> <strong>in</strong> <strong>the</strong> <strong>Future</strong> <strong>of</strong> <strong>the</strong> <strong>Energy</strong> <strong>Matrix</strong>137Sugar-Ethanol Bioelectricity<strong>in</strong> <strong>the</strong> Electricity <strong>Matrix</strong>Nivalde José de CastroRoberto BrandãoGuilherme de A. Dantas
138 Ethanol and Bioelectricity <strong>Sugarcane</strong> <strong>in</strong> <strong>the</strong> <strong>Future</strong> <strong>of</strong> <strong>the</strong> <strong>Energy</strong> <strong>Matrix</strong>Bioelectricity related to <strong>the</strong> production <strong>of</strong> sugar and ethanol has exceptional potential to playa strategic role <strong>in</strong> <strong>the</strong> expansion <strong>of</strong> <strong>the</strong> national electrical power system. This is because it ishighly complementary to hydroelectricity, allows for distribution close to centers <strong>of</strong> consumption,and <strong>of</strong>fers significant socio-economic and environmental benefits.Bioelectricity produced from bagasse complements hydropower because it provides electricitydur<strong>in</strong>g <strong>the</strong> driest months <strong>of</strong> <strong>the</strong> year. In 2008, <strong>the</strong> country’s potential hydraulic energy (ENA <strong>in</strong>Portuguese) was between 80 to 90 GW av from January to March, fall<strong>in</strong>g to between 30 to 40GW av <strong>in</strong> <strong>the</strong> period June to November, while sugarcane crush<strong>in</strong>g <strong>in</strong> <strong>the</strong> Center-South regionwas above 80% <strong>of</strong> its maximum value <strong>in</strong> <strong>the</strong> period May through September. It is important tonote that <strong>the</strong> potential for annual production <strong>of</strong> bioelectricity is almost 15,000 MW av by <strong>the</strong>end <strong>of</strong> <strong>the</strong> decade, represent<strong>in</strong>g approximately 15% <strong>of</strong> Brazilian national demand.New hydropower dams <strong>in</strong>crease <strong>the</strong> need for this complementarity, given <strong>the</strong> significant reduction<strong>in</strong> <strong>the</strong>ir reservoir capacity as a result <strong>of</strong> physical and environmental restrictions. With <strong>the</strong>construction <strong>of</strong> new dams <strong>in</strong> <strong>the</strong> North <strong>of</strong> Brazil (<strong>in</strong>clud<strong>in</strong>g Belo Monte), <strong>the</strong> ENA will be close to120 GW av from January to April, but will not exceed 40 GW av between July and October.This complementary characteristic <strong>of</strong> bioelectricity and hydroelectricity can play a strategic role<strong>in</strong> help<strong>in</strong>g <strong>the</strong> country ma<strong>in</strong>ta<strong>in</strong> a clean and renewable energy matrix, avoid<strong>in</strong>g <strong>the</strong> need to use
Sugar-Ethanol Bioelectricity <strong>in</strong> <strong>the</strong> Electricity <strong>Matrix</strong>139fossil fuel powered <strong>the</strong>rmoelectric stations as a backup. Estimates from <strong>the</strong> National ElectricitySystem Operator (ONS <strong>in</strong> Portuguese) <strong>in</strong>dicate that every GW av <strong>of</strong> bioelectricity <strong>in</strong>jected <strong>in</strong>to<strong>the</strong> National Interconnected System (SIN <strong>in</strong> Portuguese) can economize 4% <strong>of</strong> <strong>the</strong> reservoirs <strong>in</strong><strong>the</strong> Sou<strong>the</strong>ast/Center-South electricity sub-system dur<strong>in</strong>g <strong>the</strong> dry season.The A-3 and A-5 auctions for new energy (open to projects <strong>of</strong> all sources) held <strong>in</strong> 2007 and2008 used criteria and rules that favored oil-fired <strong>the</strong>rmoelectrics, which have high costs <strong>of</strong>generation. Of <strong>the</strong> <strong>the</strong>rmoelectric plants contracted, 98.9% were powered by fossil fuels (63%by oil) and just 1.1% by bagasse.<strong>Sugarcane</strong> bioelectricity <strong>of</strong>fers environmental benefits (reduction <strong>in</strong> <strong>the</strong> emission <strong>of</strong> greenhousegases), economic benefits (job creation), and <strong>the</strong> guarantee <strong>of</strong> electrical energy supply(with decentralization). However, this competitive advantage is not be<strong>in</strong>g given adequatelyvalue by <strong>the</strong> current rules for energy auctions.We recommend contract<strong>in</strong>g energy through specific actions for each source, or auctions thatare specific for generation dur<strong>in</strong>g <strong>the</strong> dry season, and <strong>the</strong> formulation <strong>of</strong> a specific <strong>in</strong>dustrial policythat can create better conditions for power plants to connect to <strong>the</strong> grid and sell energy.
14 0 Ethanol and Bioelectricity <strong>Sugarcane</strong> <strong>in</strong> <strong>the</strong> <strong>Future</strong> <strong>of</strong> <strong>the</strong> <strong>Energy</strong> <strong>Matrix</strong>1. IntroductionThe Brazilian electricity matrix is based predom<strong>in</strong>antly on hydropower. This gives <strong>the</strong> country a privilegedposition vis-à-vis <strong>the</strong> rest <strong>of</strong> <strong>the</strong> world <strong>in</strong> matters <strong>of</strong> environmental susta<strong>in</strong>ability. Most countries nowadaysare seek<strong>in</strong>g to <strong>in</strong>crease <strong>the</strong> participation <strong>of</strong> renewable energy sources <strong>in</strong> <strong>the</strong>ir electricity matrixes <strong>in</strong> orderto expand <strong>the</strong>ir energy supply while reduc<strong>in</strong>g <strong>the</strong>ir greenhouse gas emissions.However, Brazil’s unique matrix should not prevent <strong>the</strong> country from <strong>in</strong>vest<strong>in</strong>g <strong>in</strong> alternative and renewableenergy sources like sugarcane bioelectricity. An adequate understand<strong>in</strong>g <strong>of</strong> <strong>the</strong> dynamics <strong>of</strong> <strong>in</strong>troduc<strong>in</strong>grenewable and alternative energy sources <strong>in</strong>to <strong>the</strong> national energy matrix requires an acknowledgmentthat <strong>the</strong> current model, based on hydropower plants with large reservoirs, is com<strong>in</strong>g to an end. Limit<strong>in</strong>gfactors are physical questions and <strong>the</strong> attitude <strong>of</strong> environmental authorities, who will only license new hydroelectricitypower plants that have small reservoirs. This means that diversification <strong>of</strong> national generat<strong>in</strong>gcapacity is both necessary and <strong>in</strong>evitable with<strong>in</strong> <strong>the</strong> growth <strong>of</strong> <strong>the</strong> Brazilian electricity system through <strong>the</strong>next few decades, with particular emphasis on energy sources that complement hydropower.Given this process <strong>of</strong> evolution, it is important to analyze which alternative energy resources should beprioritized <strong>in</strong> <strong>the</strong> com<strong>in</strong>g years.One strategic option for Brazil’s energy future is contract<strong>in</strong>g energy sources that are complementary tohydropower, and that simultaneously contribute to ma<strong>in</strong>ta<strong>in</strong><strong>in</strong>g Brazil’s clean energy matrix. <strong>Sugarcane</strong>bioelectricity is outstand<strong>in</strong>g among such sources, ma<strong>in</strong>ly thanks to <strong>the</strong> follow<strong>in</strong>g characteristics:i Costs competitivenessII Seasonal complementarity <strong>in</strong> relation to <strong>the</strong> ra<strong>in</strong>fall patternIII Maturity <strong>of</strong> <strong>the</strong> sugar and ethanol <strong>in</strong>dustryiv Contribution to reduction <strong>of</strong> GHG emissionsv Proximity to demand centersThe goal <strong>of</strong> this paper is to analyze and demonstrate <strong>the</strong> importance <strong>of</strong> sugarcane bioelectricity for ma<strong>in</strong>ta<strong>in</strong><strong>in</strong>g<strong>the</strong> key characteristics <strong>of</strong> <strong>the</strong> electricity matrix, ensur<strong>in</strong>g: reliable supply; national economic competitiveness,and environmental susta<strong>in</strong>ability. <strong>Sugarcane</strong> bioelectricity <strong>of</strong>fers <strong>the</strong> advantages <strong>in</strong>herent <strong>in</strong>a renewable energy source, generated through an efficient co-generation process, us<strong>in</strong>g as its primaryenergy source residual biomass from ethanol and sugar production. On <strong>the</strong> o<strong>the</strong>r hand, bioelectricity <strong>of</strong>fersadditional advantages for Brazil, such as <strong>the</strong> creation <strong>of</strong> <strong>in</strong>come and employment <strong>in</strong> rural areas, stimulusfor <strong>the</strong> capital goods <strong>in</strong>dustry, and a positive impact on <strong>the</strong> trade balance – <strong>the</strong> import coefficient is closeto zero, avoid<strong>in</strong>g not only <strong>the</strong> importation <strong>of</strong> equipment, but also <strong>of</strong> fuel.This study is divided <strong>in</strong>to two parts. The first is dedicated to an analysis <strong>of</strong> <strong>the</strong> transition currently underway<strong>in</strong> <strong>the</strong> Brazilian energy matrix, and <strong>the</strong> grow<strong>in</strong>g need to develop energy sources that are complementaryto hydroelectric power, while <strong>the</strong> second part looks at bioelectricity as a complementary and competitive
Sugar-Ethanol Bioelectricity <strong>in</strong> <strong>the</strong> Electricity <strong>Matrix</strong>141source for <strong>the</strong> Brazilian energy matrix, while also present<strong>in</strong>g a brief study <strong>of</strong> its environmental susta<strong>in</strong>ability.F<strong>in</strong>ally, we present conclusions that <strong>in</strong> general terms demonstrate bioelectricity’s high degree <strong>of</strong>competitiveness, provided that current criteria for contract<strong>in</strong>g energy are reviewed, as are <strong>the</strong> externalities<strong>of</strong> bioelectricity <strong>in</strong> comparison to o<strong>the</strong>r energy sources.2. Transformation <strong>of</strong> <strong>the</strong> Brazilian generation matrixHydroelectric power plants constitute more than 80% <strong>of</strong> Brazil’s energy generat<strong>in</strong>g capacity i . In terms <strong>of</strong> effectivegeneration, around 90% <strong>of</strong> <strong>the</strong> Brazilian electricity supply comes from hydropower plants, as shown<strong>in</strong> Table 1. Brazil is second only to Norway <strong>in</strong> terms <strong>of</strong> hydropower participation with<strong>in</strong> total capacity, asshown <strong>in</strong> Table 2.The preponderance <strong>of</strong> hydropower <strong>in</strong> <strong>the</strong> Brazilian energy matrix ensures <strong>the</strong> supply <strong>of</strong> electricity at competitiveprices ii and with reduced levels <strong>of</strong> carbon emissions iii . However, it is important to understand how <strong>the</strong>Participation <strong>of</strong> hydropower <strong>in</strong> total generation – Brazil In %Table 1Year 2000 2001 2002 2003 2004 2005 2006 2007 2008Percentage (%) 94.11 89.65 90.97 92.14 88.63 92.45 91.81 92.78 88.61Source: site <strong>of</strong> ONS (National Electricity System Operator); operational history.Participation <strong>of</strong> hydropower <strong>in</strong> total<strong>in</strong>stalled generat<strong>in</strong>g capacity – selectedcountries In 2006Table 2Countries Participation percentage (%)Norway 98.5Brazil 83.2Venezuela 72Canada 58Sweden 43.1Russia 17.6India 15.3Ch<strong>in</strong>a 15.2Japan 8.7USA 7.4Rest <strong>of</strong> <strong>the</strong> World 14.3World Mean 16.4Source: IEA (2008).
142 Ethanol and Bioelectricity <strong>Sugarcane</strong> <strong>in</strong> <strong>the</strong> <strong>Future</strong> <strong>of</strong> <strong>the</strong> <strong>Energy</strong> <strong>Matrix</strong>Brazilian electricity generat<strong>in</strong>g sector manages to supply such a high percentage <strong>of</strong> total demand even thoughit is subject to irregular precipitation and seasonal variation <strong>of</strong> <strong>the</strong> rivers. Graph 1 shows <strong>the</strong> seasonal behavior<strong>of</strong> average river flows. We can see that potential hydraulic energy (ENA) iv exceeded 89,000 MW av <strong>in</strong> February,compared with an average <strong>of</strong> 30,000 MW av <strong>in</strong> September v . Ano<strong>the</strong>r relevant fact is <strong>the</strong> comparison between<strong>the</strong> average ENA and <strong>the</strong> load. Dur<strong>in</strong>g <strong>the</strong> dry season, between May and November, <strong>the</strong> ENA is around 38,000MW av while <strong>the</strong> load <strong>of</strong> <strong>the</strong> National Interconnected System (SIN) is around 51,000 MW av (2008 data).Up until now, it has only been possible to exploit Brazil’s great hydropower potential with <strong>the</strong> construction<strong>of</strong> dams that have large reservoirs. The uncerta<strong>in</strong>ties related to seasonal river flows have been reduced bystor<strong>in</strong>g water dur<strong>in</strong>g <strong>the</strong> wet season for its eventual use dur<strong>in</strong>g <strong>the</strong> dry season. The potential energy <strong>of</strong>water <strong>in</strong> <strong>the</strong> reservoirs (called Stored <strong>Energy</strong> or SE) allows for <strong>the</strong> constant generation <strong>of</strong> energy throughout<strong>the</strong> year, or even for a few years.Although Brazil has so far developed only 30% <strong>of</strong> its total hydroelectric potential vi , <strong>the</strong> current model basedon power plants with large reservoirs is draw<strong>in</strong>g to an end. Installed hydroelectric capacity will grow <strong>in</strong> <strong>the</strong>com<strong>in</strong>g years with small <strong>in</strong>creases <strong>in</strong> <strong>the</strong> energy storage capacity <strong>of</strong> <strong>the</strong> system. This will reduce <strong>the</strong> ability toregularize energy supply dur<strong>in</strong>g <strong>the</strong> year, as shown <strong>in</strong> Graph 2.There are both physical and environmental restrictions on <strong>the</strong> construction <strong>of</strong> new reservoirs. Physicallimitations lie ma<strong>in</strong>ly <strong>in</strong> <strong>the</strong> fact that <strong>the</strong> majority <strong>of</strong> potential hydropower sites <strong>in</strong> <strong>the</strong> Brazilian altiplanohave now been developed, and rema<strong>in</strong><strong>in</strong>g sites lie ma<strong>in</strong>ly <strong>in</strong> <strong>the</strong> flatter North region. It is difficult to buildhydropower stations with substantial regulatory reservoirs <strong>in</strong> a region where <strong>the</strong> topography is predom<strong>in</strong>antlysmooth. It would be possible to flood large areas, but given <strong>the</strong> gentle slopes even large reservoirswould afford only modest energy storage. There are also environmental restrictions. Brazilian environmentallegislation has become much tougher s<strong>in</strong>ce <strong>the</strong> <strong>in</strong>troduction <strong>of</strong> <strong>the</strong> new Constitution <strong>in</strong> 1988, andGraph 1 • Potential hydraulic energyHistoric average; <strong>in</strong>cludes SIN subsystems (2008 configuration) <strong>in</strong> thousands <strong>of</strong> MW average90,00080,00070,00060,00050,00040,00030,00020,00010,0000Jan Feb Mar Apr May Jun Jul Aug Sep Oct Nov DecSource: ONS website (www.ons.org.br). Data assembled by GESEL/IE/UFRJ from <strong>the</strong> operation’s historic databank <strong>in</strong> 2008.
Sugar-Ethanol Bioelectricity <strong>in</strong> <strong>the</strong> Electricity <strong>Matrix</strong>143environmental authorities limit <strong>the</strong> construction <strong>of</strong> new reservoirs and even expansion <strong>of</strong> <strong>the</strong> country’shydroelectric capacity.Given <strong>the</strong> physical and environmental restrictions mentioned above, <strong>the</strong> new hydropower plants now be<strong>in</strong>gbuilt or planned have essentially run-<strong>of</strong>-river characteristics, without significant storage reservoirs. Thesites on <strong>the</strong> Madeira River that recently went to tender are representative <strong>of</strong> this trend: <strong>the</strong> new reservoirswill occupy an area only slightly larger than is normally flooded dur<strong>in</strong>g <strong>the</strong> ra<strong>in</strong>y season. Belo Monte and<strong>the</strong> stations on <strong>the</strong> Tapajós and Teles-Pires rivers will follow <strong>the</strong> same general pattern. The <strong>in</strong>evitable consequencewill be less ability to regulate <strong>the</strong> river flow and reduced hydropower generation.The decreased ability to regularize <strong>the</strong> power supply by us<strong>in</strong>g large reservoirs will lead to grow<strong>in</strong>g difficulty<strong>in</strong> meet<strong>in</strong>g energy demand from hydropower sources alone dur<strong>in</strong>g <strong>the</strong> dry season. This allows us to concludethat <strong>the</strong> Brazilian electricity sector faces <strong>the</strong> challenge <strong>of</strong> complement<strong>in</strong>g <strong>the</strong> exist<strong>in</strong>g hydropowerplants with generators that operate efficiently dur<strong>in</strong>g <strong>the</strong> dry season. Contracts for generation that complementshydropower capacity have given preference to <strong>the</strong>rmoelectric plants burn<strong>in</strong>g fossil fuels, which <strong>in</strong>most cases have poor technical and economic efficiency. These power plants have low fixed costs, but highvariable costs <strong>of</strong> generation. The logic <strong>of</strong> contract<strong>in</strong>g power from such plants is to provide a backup for<strong>the</strong> hydropower capacity, because expectations are that <strong>the</strong>y have a low probability <strong>of</strong> be<strong>in</strong>g dispatched.However, with <strong>the</strong> reduced ability <strong>of</strong> reservoirs to ma<strong>in</strong>ta<strong>in</strong> constant power supply, <strong>the</strong>se <strong>the</strong>rmoelectricpower plants will be dispatched more frequently than <strong>the</strong> orig<strong>in</strong>al prediction, above all dur<strong>in</strong>g <strong>the</strong> dry season.When <strong>the</strong> <strong>the</strong>rmoelectric generators cease to play <strong>the</strong> role <strong>of</strong> simple back-up dur<strong>in</strong>g moments <strong>of</strong> lowerra<strong>in</strong>fall, <strong>the</strong>ir operational cost with lower technical and economic efficiency will prove to be excessive.The Brazilian power sector <strong>the</strong>refore requires new generat<strong>in</strong>g stations that will complement <strong>the</strong> hydrostations with <strong>the</strong> technical and economic pr<strong>of</strong>ile to supply base load dur<strong>in</strong>g <strong>the</strong> dry season. Among <strong>the</strong>alternatives to complement hydropower generation, sugarcane bioelectricity is <strong>the</strong> most efficient.Graph 2Change <strong>in</strong> reservoir capability to regularize generation Maximum stored energy/load7.06.56.05.55.04.54.02000 2001 2002 2003 2004 2005 2006 2007 2008 2009 2010 2011 2012Source: Chipp, Hermes. Operational procedures to ensure SIN energy supply. Presentation at GESEL-IE-UFRJ, Rio de Janeiro, July 9th, 2008.
14 4 Ethanol and Bioelectricity <strong>Sugarcane</strong> <strong>in</strong> <strong>the</strong> <strong>Future</strong> <strong>of</strong> <strong>the</strong> <strong>Energy</strong> <strong>Matrix</strong>3. Characteristics and benefits <strong>of</strong> sugarcane bioelectricityGuarantee<strong>in</strong>g security <strong>of</strong> supply coupled with environmental susta<strong>in</strong>ability will require <strong>in</strong>vestment <strong>in</strong> alternativeand renewable sources as well as efficient processes <strong>of</strong> generation. Bioelectricity fits this premise becauseit is generated from biomass left over from sugar and ethanol production. Because it uses waste as its primaryenergy source, bioelectricity is, by def<strong>in</strong>ition, a renewable, efficient and susta<strong>in</strong>able source <strong>of</strong> energy. It is energyproduced via co-generation, a process that ensures a significant degree <strong>of</strong> efficiency vii . Moreover, most <strong>of</strong> it is produced<strong>in</strong> São Paulo and neighbor<strong>in</strong>g states, which is <strong>the</strong> country’s ma<strong>in</strong> region for electricity demand. This constitutesano<strong>the</strong>r plus <strong>in</strong> terms <strong>of</strong> economic and electricity efficiency, by reduc<strong>in</strong>g transmission costs and losses.However, <strong>the</strong>se benefits have not been adequately and correctly priced <strong>in</strong> at Brazil’s auctions for new energy.Auction results <strong>in</strong>dicate bioelectricity’s apparent lack <strong>of</strong> competitiveness <strong>in</strong> comparison to o<strong>the</strong>r sources<strong>of</strong> energy. The supposed lack <strong>of</strong> competitiveness is <strong>the</strong> result <strong>of</strong> unfavorable auction methodology, whichdoes not correctly value <strong>the</strong> benefits that bioelectricity <strong>of</strong>fers to <strong>the</strong> Brazilian electricity system thanks to itsnatural complementation <strong>of</strong> <strong>the</strong> hydropower generation system.<strong>Sugarcane</strong> bioelectricity is an energy source that contributes to <strong>the</strong> security <strong>of</strong> Brazilian electricity supplyby diversify<strong>in</strong>g <strong>the</strong> matrix and above all by complement<strong>in</strong>g hydropower production, besides be<strong>in</strong>g environmentallysusta<strong>in</strong>able. Unlike o<strong>the</strong>r forms <strong>of</strong> <strong>the</strong>rmal energy production, bioelectricity is carbon neutral. Thisis a highly desirable characteristic that has not been properly valued at auctions.3.1 Potential and costs <strong>of</strong> bioelectricityAccord<strong>in</strong>g to Corrêa Neto and Ramón (2002), <strong>the</strong> sugar-energy sector is traditionally self-sufficient <strong>in</strong> terms<strong>of</strong> energy, meet<strong>in</strong>g 98% <strong>of</strong> its energy demand by burn<strong>in</strong>g sugarcane bagasse. Co-generation provides <strong>the</strong><strong>the</strong>rmal, mechanical and electrical energy needed for <strong>the</strong> production <strong>of</strong> ethanol and sugar. However, thisself-sufficiency has traditionally been ensured via <strong>in</strong>efficient production processes that yield just enoughenergy to supply <strong>the</strong> mill itself.Accord<strong>in</strong>g to Dantas (2008), <strong>the</strong> decision to adopt low-efficiency cogeneration technologies was aimed atmaximiz<strong>in</strong>g bagasse <strong>in</strong>c<strong>in</strong>eration, given <strong>the</strong> difficulties <strong>of</strong> stor<strong>in</strong>g <strong>the</strong> product and <strong>the</strong> low market value <strong>of</strong>raw bagasse. There was also no commercial <strong>in</strong>terest <strong>in</strong> <strong>in</strong>vest<strong>in</strong>g <strong>in</strong> more efficient power plants that wouldbe able to export surplus energy to <strong>the</strong> grid.Until <strong>the</strong> early 1990s, <strong>the</strong> Brazilian energy sector was organized <strong>in</strong> vertically <strong>in</strong>tegrated monopolies withcentralized energy production. Regulations did not permit entities o<strong>the</strong>r than <strong>the</strong> concessionaires to sellenergy. This arrangement lasted until <strong>the</strong> mid 1990s, when <strong>in</strong>dependent energy producers were allowed.This created a legal structure that allowed sugar and ethanol plants to “export” electricity to <strong>the</strong> grid, socreat<strong>in</strong>g <strong>the</strong> scenario for <strong>in</strong>vestment <strong>in</strong> efficient co-generation plants, aim<strong>in</strong>g to sell surplus energy.
Sugar-Ethanol Bioelectricity <strong>in</strong> <strong>the</strong> Electricity <strong>Matrix</strong>145Although <strong>the</strong> sugarcane sector has long had <strong>the</strong> technical potential to sell its surplus energy, it is only recentlythat this has become possible from a commercial po<strong>in</strong>t <strong>of</strong> view. It is thus important to look at howbioelectricity can contribute to <strong>the</strong> Brazilian energy supply <strong>in</strong> <strong>the</strong> com<strong>in</strong>g decades.Bioelectricity generation potential is a function <strong>of</strong> <strong>the</strong> sugarcane harvest, because <strong>the</strong> amount <strong>of</strong> harvestedsugarcane will determ<strong>in</strong>e <strong>the</strong> amount <strong>of</strong> residual biomass available for bioelectricity generation. The potentialalso depends on <strong>the</strong> technology used, which determ<strong>in</strong>es <strong>the</strong> efficiency <strong>of</strong> <strong>the</strong> conversion <strong>of</strong> biomass<strong>in</strong>to electrical energy.Follow<strong>in</strong>g <strong>the</strong> ethanol <strong>in</strong>dustry boom, lead by <strong>the</strong> Proálcool program <strong>in</strong> <strong>the</strong> 1980s, and <strong>the</strong> cycle <strong>of</strong> sugarexpansion <strong>in</strong> <strong>the</strong> 1990s, <strong>the</strong> last few years have seen a new growth phase for <strong>the</strong> sugar and ethanol <strong>in</strong>dustry.Prospects now po<strong>in</strong>t to fur<strong>the</strong>r <strong>in</strong>creases <strong>in</strong> <strong>the</strong> supply <strong>of</strong> sugar and ethanol <strong>in</strong> com<strong>in</strong>g years. Estimates <strong>in</strong>dicateBrazilian sugarcane production will <strong>in</strong>crease from <strong>the</strong> current 550 million tonnes to exceed one billiontonnes <strong>of</strong> crushed sugarcane per harvest with<strong>in</strong> 10 years. In addition to <strong>the</strong> expansion <strong>of</strong> sugarcane production,ano<strong>the</strong>r fact will <strong>in</strong>crease <strong>the</strong> amount <strong>of</strong> biomass available as an <strong>in</strong>put for energy generation: <strong>the</strong> end <strong>of</strong>pre-harvest burn<strong>in</strong>g viii will allow sugarcane straw to be used as a primary energy source alongside bagasse.With respect to cogeneration technology, sugar and ethanol plants have traditionally used counter-pressurecycles that ensured only <strong>the</strong> energy self-sufficiency <strong>of</strong> <strong>the</strong> plants <strong>the</strong>mselves. Even with<strong>in</strong> this configuration,however, some modifications, pr<strong>in</strong>cipally <strong>the</strong> use <strong>of</strong> high-pressure cauldrons, make it possible to achieveconsiderable energy efficiency, generat<strong>in</strong>g around 40 kWh per tonne <strong>of</strong> processed sugarcane (Corrêa Netoand Ramón, 2002).New greenfield projects are currently adopt<strong>in</strong>g extraction-condensation technology, which allows for production<strong>of</strong> significant energy surpluses at low costs. This technology can generate up to 96 kWh per tonne <strong>of</strong> processedsugarcane, <strong>of</strong> which an average <strong>of</strong> 80 kWh can be exported. These numbers take <strong>in</strong>to account only bagasseuse, but with <strong>the</strong> <strong>in</strong>c<strong>in</strong>eration <strong>of</strong> straw not burned <strong>in</strong> <strong>the</strong> plantation (with <strong>the</strong> end <strong>of</strong> manual harvest<strong>in</strong>g), it ispossible to reach up to 200 kWh per tonne <strong>of</strong> processed sugarcane (Kitayama, 2008). The cost <strong>of</strong> <strong>in</strong>vestment <strong>in</strong>this technology is around R$3,000 per <strong>in</strong>stalled kW. Table 3 shows data for <strong>the</strong> short, medium and long termpotential for bioelectricity generation, assum<strong>in</strong>g all sugar and ethanol plants adopt <strong>the</strong> best technology.The estimates <strong>of</strong> bioelectricity potential are based on extraction-condensation technology that has alreadybeen fully mastered and is economically viable. However, <strong>the</strong> development <strong>of</strong> biomass gasification technology– which has already been mastered <strong>in</strong> <strong>the</strong> technical sense but is not yet commercially viable – couldrepresent a major leap forward <strong>in</strong> <strong>the</strong> potential for bioelectricity generation. This technology is capable <strong>of</strong>produc<strong>in</strong>g up to 270 kWh <strong>of</strong> surplus energy per tonne <strong>of</strong> processed cane.Dantas and Castro (2008) state that <strong>the</strong> development <strong>of</strong> cellulosic ethanol could negatively impact <strong>the</strong>future supply <strong>of</strong> bioelectricity, because it may <strong>of</strong>fer an alternate economic use for biomass. However, basedon recent projections for <strong>the</strong> ethanol and electricity markets, <strong>the</strong> authors have assumed that <strong>in</strong>vestments<strong>in</strong> cogeneration will not be reduced. Ra<strong>the</strong>r, <strong>the</strong>y are likely to be <strong>in</strong>creased, especially if specific policies are
146 Ethanol and Bioelectricity <strong>Sugarcane</strong> <strong>in</strong> <strong>the</strong> <strong>Future</strong> <strong>of</strong> <strong>the</strong> <strong>Energy</strong> <strong>Matrix</strong>adopted, for example auctions for new energy separated by source. The 2008 auction for Reserve <strong>Energy</strong>is an example.However, because <strong>the</strong> potential for bioelectricity generation is calculated <strong>in</strong> relation to <strong>the</strong> total harvest, it isimportant to analyze <strong>the</strong> situation <strong>of</strong> exist<strong>in</strong>g sugar and ethanol plants, which need to be retr<strong>of</strong>itted to generateelectricity more efficiently. These plants must replace part <strong>of</strong> <strong>the</strong>ir equipment to adopt more moderncogeneration technologies. It is a question <strong>of</strong> replac<strong>in</strong>g function<strong>in</strong>g equipment, which may have a considerablerema<strong>in</strong><strong>in</strong>g service life and that already ensures energy self-sufficiency for <strong>the</strong> plant. Realiz<strong>in</strong>g <strong>the</strong> generat<strong>in</strong>gpotential <strong>of</strong> <strong>the</strong>se plants <strong>the</strong>refore requires an auction price cap higher than that applied to greenfieldprojects. Accord<strong>in</strong>g to Castro (2008) and based on pre-crisis economic parameters <strong>in</strong> September 2008, whilenew projects are viable sell<strong>in</strong>g energy an average price <strong>of</strong> R$155/MWh, retr<strong>of</strong>itted projects need an averageprice <strong>of</strong> R$180/MWh to be viable. It should be noted that <strong>the</strong> sugar-energy sector has a heterogeneous productionstructure and <strong>the</strong>se values may have a high standard deviation, especially when factor<strong>in</strong>g <strong>in</strong> <strong>the</strong> costs<strong>of</strong> connection to <strong>the</strong> electricity grid, which is <strong>the</strong> responsibility <strong>of</strong> <strong>the</strong> bioelectricity entrepreneur.3.2 Bioelectricity complement<strong>in</strong>g <strong>the</strong> Brazilian electricity system, and externalitiesThe mere fact <strong>of</strong> <strong>in</strong>corporat<strong>in</strong>g bioelectricity <strong>in</strong>to <strong>the</strong> system on a scale compatible with its potential wouldcontribute to <strong>in</strong>creas<strong>in</strong>g <strong>the</strong> security <strong>of</strong> Brazilian electricity supply by virtue <strong>of</strong> diversify<strong>in</strong>g <strong>the</strong> energy matrix.However, <strong>the</strong> most favorable characteristic <strong>of</strong> sugarcane bioelectricity for <strong>the</strong> Brazilian electricity system securityis its complementary quality <strong>in</strong> relation to ra<strong>in</strong>fall patterns <strong>in</strong> <strong>the</strong> Center-South region, where 70% <strong>of</strong> Brazilianreservoir capacity is concentrated. The sugar-energy harvest takes place between April and November, co<strong>in</strong>cid<strong>in</strong>gwith <strong>the</strong> dry season <strong>in</strong> <strong>the</strong> Center-South region. Graph 3 compares <strong>the</strong> sugarcane crush<strong>in</strong>g pattern withnatural hydropower energy flow, demonstrat<strong>in</strong>g <strong>the</strong> complementarity <strong>of</strong> bioelectricity and hydropower.Because sugarcane bioelectricity generation is concentrated dur<strong>in</strong>g <strong>the</strong> dry season, it constitutes an energysource <strong>of</strong> great relevance to complement <strong>the</strong> <strong>in</strong>stalled hydropower base. It is effectively a “w<strong>in</strong>ter energy”.Accord<strong>in</strong>g to <strong>the</strong> ONS, every 1,000 MW av <strong>of</strong> bioelectricity <strong>in</strong>jected <strong>in</strong>to <strong>the</strong> <strong>in</strong>terconnected system dur<strong>in</strong>g <strong>the</strong>dry season is equivalent to a 4% sav<strong>in</strong>g <strong>of</strong> reservoirs <strong>in</strong> <strong>the</strong> Center-South subsystem.Table 3Estimates <strong>of</strong> sugarcane bioelectricity potential*Harvest <strong>Sugarcane</strong> (<strong>in</strong> millions <strong>of</strong> tonnes) Generation potential (<strong>in</strong> MW av)2012/13 696 9,6422015/16 829 11,4842020/21 1038 14,379* These estimates assume <strong>the</strong> use <strong>of</strong> extraction-condensation technology, with <strong>the</strong> use <strong>of</strong> 75% <strong>of</strong> available bagasse and 50% <strong>of</strong> available straw.Source: Prepared by Gesel/IE/UFRJ from UNICA data.
Sugar-Ethanol Bioelectricity <strong>in</strong> <strong>the</strong> Electricity <strong>Matrix</strong>1473.3 Economic viabilityDespite all <strong>the</strong> acknowledged benefits <strong>of</strong> <strong>in</strong>corporat<strong>in</strong>g bioelectricity <strong>in</strong> <strong>the</strong> electricity matrix, <strong>the</strong>re aredoubts and arguments about its viability and economic competitiveness. The ma<strong>in</strong> argument is that if bioelectricitywere competitive, it would already be sold <strong>in</strong> <strong>the</strong> new energy auctions. However, <strong>the</strong> methodologyused at auctions for contact<strong>in</strong>g new energy does not necessarily select <strong>the</strong> best generation projects,as discussed by Castro et al (2009a).Table 4 presents <strong>in</strong>formation that demonstrates <strong>the</strong> need for a more detailed analysis regard<strong>in</strong>g <strong>the</strong> apparentlack <strong>of</strong> competitiveness <strong>of</strong> bioelectricity.This table shows that 71.1% <strong>of</strong> contracted <strong>the</strong>rmoelectric power had variable cost greater than R$200 <strong>in</strong>July <strong>of</strong> 2009, to which must be added to <strong>the</strong> fixed costs <strong>of</strong> <strong>the</strong> generat<strong>in</strong>g station. Given this data, it is fairto question whe<strong>the</strong>r a biomass generator with a fixed generation cost <strong>of</strong> R$155 per MWh or even R$180for a retr<strong>of</strong>itted mill really constitutes a threat to <strong>the</strong> rates structure.It is important to note that, to obta<strong>in</strong> <strong>the</strong> cost <strong>of</strong> <strong>the</strong>se generat<strong>in</strong>g stations that are dispatched <strong>in</strong> order <strong>of</strong>merit, one cannot simply add <strong>the</strong> fixed and variable costs, because <strong>the</strong>se stations were contracted as backup,with estimated dispatch for a small number <strong>of</strong> hours per year. It is because <strong>of</strong> this methodology – lowfixed cost, high variable cost and <strong>in</strong>frequent dispatch – that <strong>the</strong>se plants appear competitive at auctions.However, <strong>in</strong> a hydroelectric system with decl<strong>in</strong><strong>in</strong>g regulatory capacity, where complementary generationGraph 390Complementarity <strong>of</strong> hydroelectricity and <strong>the</strong> sugar-energy sectorAs a % <strong>of</strong> <strong>the</strong> month with <strong>the</strong> greatest supply9080706050403020100Jan Feb Mar Apr May Jun Jul Aug Sep Oct Nov Decn ENA (Natural Hydropower <strong>Energy</strong> Flow) Braziln <strong>Sugarcane</strong> crush<strong>in</strong>g <strong>in</strong> Center-South <strong>of</strong> BrazilSource: ONS (www.ons.org.br) website and UNICA. Data prepared from 2008 operational history (ENA) and sugarcane crush<strong>in</strong>g <strong>in</strong> <strong>the</strong>2007/2008 harvest <strong>in</strong> <strong>the</strong> Center-South <strong>of</strong> Brazil.
14 8 Ethanol and Bioelectricity <strong>Sugarcane</strong> <strong>in</strong> <strong>the</strong> <strong>Future</strong> <strong>of</strong> <strong>the</strong> <strong>Energy</strong> <strong>Matrix</strong>will be <strong>in</strong>creas<strong>in</strong>gly necessary (especially dur<strong>in</strong>g <strong>the</strong> dry season), <strong>the</strong>se power plants are not <strong>the</strong> best option.They will prove to be much more expensive for <strong>the</strong> system than sugarcane bioelectricity <strong>the</strong>rmal plants thatoperate <strong>in</strong>flexibly with no variable costs.3.4 Environmental susta<strong>in</strong>ability: GHG emissionsThe Brazilian energy matrix, and particularly <strong>the</strong> electricity matrix, has unique characteristics <strong>in</strong> terms <strong>of</strong>reduced environmental impact, especially with regard to emission <strong>of</strong> greenhouse gases (GHG). However,this cannot be used as an argument for contract<strong>in</strong>g dirty and pollut<strong>in</strong>g energy sources.The energy sector has <strong>the</strong> greatest responsibility for global greenhouse gas emissions, with 48.8% <strong>of</strong> <strong>the</strong>worldwide total. Table 5 compares <strong>the</strong> Brazilian emissions pr<strong>of</strong>ile with that <strong>of</strong> o<strong>the</strong>r countries, illustrat<strong>in</strong>g<strong>the</strong> differences. It can be seen that most Brazilian emissions come under <strong>the</strong> head<strong>in</strong>g <strong>of</strong> “Land use, land-usechange and forestry (LULUCF)”, which <strong>in</strong>cludes burn<strong>in</strong>g. Emissions from <strong>the</strong> Brazilian energy sector accountfor only 8.8% <strong>of</strong> <strong>the</strong> country’s total.Because bioelectricity is a renewable source <strong>of</strong> energy, it is neutral <strong>in</strong> GHG emissions. This is a marked contrastto <strong>the</strong> significant emissions <strong>of</strong> <strong>the</strong>rmal energy generation with fossil fuels, as shown <strong>in</strong> Table 6.Based on an estimated potential total <strong>of</strong> 14,379 MW av <strong>of</strong> bioelectricity for export <strong>in</strong> <strong>the</strong> 2020/21 harvest,we can calculate <strong>the</strong> equivalent generation <strong>of</strong> 125,960 GWh. Production <strong>of</strong> this same energy by coal-firedpower plants would create total emissions <strong>of</strong> 100.7 million tonnes <strong>of</strong> CO 2. Were this generation from oil-Table 4Variable unit cost (VUC) <strong>of</strong> <strong>the</strong>rmal generation <strong>in</strong> <strong>the</strong> National Interconnected System (SIN)In 2009VUC (R$/MWH) Available power (MWa) % Totalup to 100 1,536 6.80%100 to 150 3,655 1.30%150 to 200 1,313 5.80%200 to 250 6,386 28.40%250 to 300 2,723 12.10%300 to 400 3,561 15.90%400 to 600 1,643 7.30%more than 600 1,637 7.30%Total 22,454 100%Source: ONS, PMO <strong>of</strong> July 2009.
Sugar-Ethanol Bioelectricity <strong>in</strong> <strong>the</strong> Electricity <strong>Matrix</strong>149fired stations, emissions would be 69.3 million tonnes <strong>of</strong> CO 2. Even with comb<strong>in</strong>ed-cycle natural gas plants,emissions would be 50.4 million tonnes <strong>of</strong> CO 2. We can <strong>the</strong>refore clearly see <strong>the</strong> importance <strong>of</strong> bioelectricityfor ma<strong>in</strong>ta<strong>in</strong><strong>in</strong>g a matrix with reduced carbon <strong>in</strong>tensity, and so contribut<strong>in</strong>g to climate change mitigation.3.5 Source <strong>of</strong> distributed generation and additional benefits <strong>of</strong> bioelectricityBioelectricity counts as a source <strong>of</strong> distributed generation by virtue <strong>of</strong> be<strong>in</strong>g located <strong>in</strong> <strong>the</strong> Center-South region,close to <strong>the</strong> country’s pr<strong>in</strong>cipal demand centers. This proximity reduces <strong>the</strong> need for expansion <strong>of</strong> transmission,which constitutes both an environmental benefit (reduction <strong>of</strong> losses <strong>in</strong> <strong>the</strong> transmission system)and an economic benefit (less need for <strong>in</strong>vestment <strong>in</strong> <strong>the</strong> expansion <strong>of</strong> <strong>the</strong> transmission system). Bioelectricitycan even be <strong>in</strong>jected directly <strong>in</strong>to <strong>the</strong> distribution network, without any need to re<strong>in</strong>force <strong>the</strong> very high tensionbasic grid. We can thus see that bioelectricity is compatible with <strong>the</strong> new technological paradigm <strong>of</strong> <strong>the</strong>electricity sector, which places great emphasis on <strong>the</strong> exploitation <strong>of</strong> niches for distributed generation.Region/CountryEmission pr<strong>of</strong>iles <strong>of</strong> selected countries In percentage, 2005 data<strong>Energy</strong>TransportationIndustrialprocessesTable 5Agriculture LULUCF Waste TotalWorld 48.8 11.8 3.4 13.8 18.6 3.6 100Annex 1 63.3 18.6 3.6 8.2 - 6.2 100Non- Annex 1 36.9 6.1 3.2 15.6 35.1 3 100Ch<strong>in</strong>a 64.6 4.6 7.9 21.4 -1 2.5 100India 52.3 6.8 3.5 34.8 -2.2 4.8 100Indonesia 7.9 2 0.5 4 83.6 1.9 100South Korea 68.8 17.5 9.2 2.8 0.2 1.6 100Brazil 8.8 5.7 1.5 20.1 62 1.8 100Mexico 50.5 16.6 3.5 8.2 15.8 5.3 100South Africa 73.7 9.6 2.7 10.7 0.5 2.9 100Source: Souza and Azevedo (2006).* Land use, land-use change and forestryGHG emissions by different sources In kg per MWhTable 6<strong>Energy</strong> sourceCO 2emissions (<strong>in</strong> Kg per MWh)Natural Gas (open cycle) 440Natural Gas (comb<strong>in</strong>ed cycle) 400Oil 550Coal 800Hydroelectricity 25W<strong>in</strong>d Power 28Source: European Union (2007).
150 Ethanol and Bioelectricity <strong>Sugarcane</strong> <strong>in</strong> <strong>the</strong> <strong>Future</strong> <strong>of</strong> <strong>the</strong> <strong>Energy</strong> <strong>Matrix</strong>Fur<strong>the</strong>rmore, <strong>the</strong> Brazilian capital goods <strong>in</strong>dustry is ready to provide <strong>the</strong> necessary equipment for <strong>the</strong>construction <strong>of</strong> cogeneration plants. In this sense, <strong>in</strong>vestments <strong>in</strong> new, more efficient, cogeneration plants– notably retr<strong>of</strong>it conversions – do not require substantial importation <strong>of</strong> equipment, thus sav<strong>in</strong>g hard currencyand provid<strong>in</strong>g a boost to <strong>the</strong> Brazilian <strong>in</strong>dustrial sector.On <strong>the</strong> o<strong>the</strong>r hand, bioelectricity uses a nationally-produced primary energy source, as opposed to o<strong>the</strong>rtypes <strong>of</strong> generation that require imported fuel. In this sense not only <strong>the</strong>re are foreign exchange sav<strong>in</strong>gs, butalso <strong>the</strong> price volatility <strong>of</strong> energy is reduced. This becomes clear <strong>in</strong> <strong>the</strong> contracts aris<strong>in</strong>g from <strong>the</strong> auctionsfor new energy: <strong>the</strong> cost <strong>of</strong> generation us<strong>in</strong>g oil, coal and natural gas is <strong>in</strong>dexed to <strong>the</strong> <strong>in</strong>ternational spotprice <strong>of</strong> <strong>the</strong>se energy <strong>in</strong>puts, while bioelectricity is <strong>in</strong>dexed to <strong>the</strong> Broad Consumer Price Index (IPCA).4. ConclusionsThe Brazilian electricity matrix is go<strong>in</strong>g through a phase <strong>of</strong> transition, fac<strong>in</strong>g <strong>the</strong> <strong>in</strong>creas<strong>in</strong>g need to complementhydropower generation with o<strong>the</strong>r options to generate electricity efficiently dur<strong>in</strong>g <strong>the</strong> dry season.Bioelectricity is an energy source that is <strong>in</strong>tr<strong>in</strong>sically complementary to hydro generation, because <strong>the</strong> sugarcaneharvest co<strong>in</strong>cides with <strong>the</strong> dry season.The cycle <strong>of</strong> expansion <strong>of</strong> <strong>the</strong> sugar-energy sector, toge<strong>the</strong>r with <strong>the</strong> gradual end <strong>of</strong> burn<strong>in</strong>g sugarcane,ensures <strong>the</strong> necessary biomass for significant bioelectricity generation <strong>in</strong> <strong>the</strong> com<strong>in</strong>g years. This justifies<strong>in</strong>vestments <strong>in</strong> technology that allows bioelectricity to be <strong>in</strong>corporated <strong>in</strong>to <strong>the</strong> Brazilian electricity matrix.The apparent lack <strong>of</strong> competitiveness <strong>of</strong> bioelectricity at auctions for new energy is <strong>the</strong> consequence <strong>of</strong> exist<strong>in</strong>gcriteria for contract<strong>in</strong>g energy, that do not correctly take <strong>in</strong>to account all <strong>the</strong> benefits <strong>of</strong> bioelectricityfor <strong>the</strong> Brazilian electricity system. In this sense, merely <strong>the</strong> reasons restricted to <strong>the</strong> “energy world” wouldbe sufficient to justify <strong>the</strong> <strong>in</strong>corporation <strong>of</strong> bioelectricity <strong>in</strong>to <strong>the</strong> Brazilian electricity matrix <strong>in</strong> a scale compatiblewith its potential. However, besides reasons <strong>of</strong> energy, <strong>the</strong>re is <strong>the</strong> relevant fact that bioelectricityis a renewable energy source <strong>in</strong> a world that demands measures to reduce greenhouse gas emissions, andso mitigate climate change.These reasons justify modify<strong>in</strong>g <strong>the</strong> policy <strong>of</strong> contract<strong>in</strong>g energy via auctions for <strong>the</strong> regulated market.Adoption <strong>of</strong> auctions by specific type <strong>of</strong> energy source, or auctions specifically for base-load generationdur<strong>in</strong>g <strong>the</strong> dry season, would seem to be a more efficient alternative than auctions that are open to anytype <strong>of</strong> project, and which have not been stimulat<strong>in</strong>g <strong>the</strong> efficient contract<strong>in</strong>g <strong>of</strong> new projects. This guidel<strong>in</strong>ewould be one <strong>of</strong> <strong>the</strong> most important components for a public bioelectricity policy.Ano<strong>the</strong>r po<strong>in</strong>t to be addressed via public policy is <strong>the</strong> creation <strong>of</strong> conditions for exist<strong>in</strong>g sugar and ethanolmills to be connected to <strong>the</strong> grid and sell energy. Sugar and ethanol mills are geographically dispersed;many are far away from sub-stations capable <strong>of</strong> receiv<strong>in</strong>g <strong>the</strong> energy produced. This means that accessto <strong>the</strong> grid becomes an obstacle to <strong>the</strong> <strong>in</strong>corporation <strong>in</strong>to <strong>the</strong> system <strong>of</strong> new bioelectricity generation
Sugar-Ethanol Bioelectricity <strong>in</strong> <strong>the</strong> Electricity <strong>Matrix</strong>151ventures. The solution found for this problem around <strong>the</strong> time <strong>of</strong> <strong>the</strong> Reserve <strong>Energy</strong> Auction – <strong>the</strong> design<strong>of</strong> a collection grid to serve various projects <strong>in</strong> <strong>the</strong> same region – was certa<strong>in</strong>ly a step <strong>in</strong> <strong>the</strong> right direction.However, given that <strong>the</strong> f<strong>in</strong>ancial commitment to build <strong>the</strong> collection grid had to be made before <strong>the</strong>auction, this was not an ideal alternative. Bear<strong>in</strong>g <strong>in</strong> m<strong>in</strong>d <strong>the</strong> competitiveness <strong>of</strong> bioelectricity, studiesare recommended to re<strong>in</strong>force <strong>the</strong> grid <strong>in</strong> regions where <strong>the</strong>re is high production potential, even beforeconfirm<strong>in</strong>g that mills <strong>in</strong> <strong>the</strong> region have been successful at energy auctions.In summary, <strong>the</strong> follow<strong>in</strong>g are important po<strong>in</strong>ts for a public policy for <strong>the</strong> sugarcane bioelectricity sector:1) give appropriate value to <strong>the</strong> seasonal complementarities <strong>of</strong> bioelectricity at auctions for new energy; 2)hold regular auctions restricted to this source, or at least to sources that are compatible with it; and 3) plan<strong>the</strong> expansion <strong>of</strong> transmission systems <strong>in</strong> a way that effectively allows for <strong>in</strong>corporation <strong>of</strong> bioelectricity<strong>in</strong>to <strong>the</strong> generation matrix.
152 Ethanol and Bioelectricity <strong>Sugarcane</strong> <strong>in</strong> <strong>the</strong> <strong>Future</strong> <strong>of</strong> <strong>the</strong> <strong>Energy</strong> <strong>Matrix</strong>5. Bibliography. Aneel. Atlas de Energia Elétrica do Brasil. 3a. edição. Brasília, 2008.. Castro, Nivalde José; Dantas, Guilherme de A.; Brandão, Roberto; Leite, André Luiz da Silva. Bioeletricidade e aIndústria de Álcool e Açúcar: possibilidades e limites. Synergia. Rio de Janeiro, 2008.. Castro, Nivalde José; Brandão, Roberto; DANTAS, Guilherme de A.. A seleção de projetos nos Leilões de Energia Novae a questão do valor da energia. Mimeo. Gesel/IE/UFRJ. Rio, August 2009a.. Castro, Nivalde José; Brandão, Roberto; DANTAS, Guilherme de A.. Problemas no cálculo das Garantias Físicas para osLeilões de Energia Nova. Mimeo. Gesel/IE/UFRJ. Rio, September 2009b.. Castro, Nivalde José; Brandão, Roberto; Dantas, Guilherme de A.. Considerações sobre a Ampliação da GeraçãoComplementar ao Parque Hídrico Brasileiro. Texto de Discussão do Setor Elétrico n.o 15. Gesel/IE/UFRJ. Rio deJaneiro, January 2010.. Castro, Nivalde José de; Bueno, Daniel. Os Leilões de Energia Nova: vetores de crise ou de ajuste entre <strong>of</strong>erta edemanda? Rio de Janeiro: IE-UFRJ, June 18, 2007.. Corrêa Neto, V.; Ramón, D. Análise de Opções Tecnológicas para Projetos de Cogeração no Setor Sucroalcooleiro.Setap. Brasília, 2002.. Dantas, Guilherme de A. O Impacto dos Créditos de Carbono na Rentabilidade da Cogeração SucroalcooleiraBrasileira. Master’s Degree Thesis. ISEG/Universidade Técnica de Lisboa, 2008.. Dantas, Guilherme de A.; Castro, Nivalde José de. O Uso do Bagaço e da Palha: Bioeletricidade ou Etanol Celulósico?In: I Workshop do Infosucro sobre Impactos Econômicos e Tecnológicos da Indústria Sucroalcoleira no Brasil. Rio deJaneiro, November 2008.. Goldenberg, P.; Guerra, F. Inovação na Geração de Energia Elétrica a Partir do Bagaço de Cana. In: I Workshop doInfosucro sobre Impactos Econômicos e Tecnológicos da Indústria Sucroalcoleira no Brasil. Rio de Janeiro, November2008.. International <strong>Energy</strong> Agency. Key World <strong>Energy</strong> Statistics. Paris, 2008.. Kitayama, Onorio. Bioeletricidade: perspectives e desafios. In: III Sem<strong>in</strong>ário Internacional do Setor de Energia Elétrica– Gesel/IE/UFRJ. Rio de Janeiro, 2008.. Souza, Z. Geração de Energia Elétrica Excedente no Setor Sucroalcooleiro. Ph.D. Thesis. Departamento de Engenhariade Produção/Universidade Federal de São Carlos. São Carlos, 2003.. Souza, Z; Azevedo, P. Energia Elétrica Excedente no Setor Sucroalcooleiro: um estudo a partir de us<strong>in</strong>as paulistas.Revista de Economia e Sociologia Rural. Brasília-DF, 2006.
Sugar-Ethanol Bioelectricity <strong>in</strong> <strong>the</strong> Electricity <strong>Matrix</strong>153Explanatory NotesiIncludes <strong>the</strong> Paraguayan half <strong>of</strong> Itaipu.iiCompetitiveness at <strong>the</strong> generation level, as shown <strong>in</strong> auctions for <strong>the</strong> Rio Madeira dams. F<strong>in</strong>al electricity prices <strong>in</strong> Brazil are not low for anumber <strong>of</strong> reasons that are beyond <strong>the</strong> scope <strong>of</strong> this paper.iiiCO 2emissions by <strong>the</strong> Brazilian energy matrix per tonne equivalent <strong>of</strong> petroleum are 1.57, compared to 2.36 for <strong>the</strong> global energy matrix.Hydroelectricity and <strong>the</strong> large-scale use <strong>of</strong> ethanol are among <strong>the</strong> factors responsible for reduc<strong>in</strong>g carbon <strong>in</strong>tensity <strong>in</strong> <strong>the</strong> Brazilian matrix.ivHydraulic energy <strong>in</strong> rivers, available for energy purposes.vThese numbers <strong>in</strong>clude only those rivers that already have hydropower stations.viBrazil hydropower generation potential is estimated at approximately 260 GW.viiCogeneration can be def<strong>in</strong>ed as <strong>the</strong> simultaneous production from <strong>the</strong> same primary energy source <strong>of</strong> <strong>the</strong>rmal and mechanical energy thatcan be converted <strong>in</strong>to electricity.viiiThe Agro-Environmental Protocol <strong>in</strong> <strong>the</strong> State <strong>of</strong> São Paulo contemplates <strong>the</strong> end <strong>of</strong> sugarcane burn<strong>in</strong>g and manual harvest<strong>in</strong>g <strong>in</strong> flat areas by2014. Over 50% <strong>of</strong> <strong>the</strong> harvest is already mechanized. Therefore, even though part <strong>of</strong> <strong>the</strong> cane will be left on <strong>the</strong> soil to protect it, <strong>the</strong>re willbe a significant <strong>in</strong>crease <strong>in</strong> <strong>the</strong> biomass available for energy use.
154 Ethanol and Bioelectricity <strong>Sugarcane</strong> <strong>in</strong> <strong>the</strong> <strong>Future</strong> <strong>of</strong> <strong>the</strong> <strong>Energy</strong> <strong>Matrix</strong>06
Ethanol and Bioelectricity <strong>Sugarcane</strong> <strong>in</strong> <strong>the</strong> <strong>Future</strong> <strong>of</strong> <strong>the</strong> <strong>Energy</strong> <strong>Matrix</strong>155Ethanol as a FuelFrancisco NigroAlfred Szwarc
156 Ethanol and Bioelectricity <strong>Sugarcane</strong> <strong>in</strong> <strong>the</strong> <strong>Future</strong> <strong>of</strong> <strong>the</strong> <strong>Energy</strong> <strong>Matrix</strong>Flex-fuel vehicles were launched <strong>in</strong> 2003 and currently account for about 90% <strong>of</strong> new sales,constitut<strong>in</strong>g <strong>the</strong> high po<strong>in</strong>t <strong>of</strong> Brazilian ethanol’s success story this decade. This doesn’t meanthat <strong>the</strong>re is no room for improvement <strong>in</strong> terms <strong>of</strong> ga<strong>in</strong>s <strong>in</strong> energy efficiency and environmentalperformance. On <strong>the</strong> contrary, significant technological advance is possible, provided <strong>the</strong> necessarypublic policies are adopted.At <strong>the</strong> start <strong>of</strong> <strong>the</strong> Proálcool Program <strong>the</strong> development <strong>of</strong> ethanol eng<strong>in</strong>es was directed towards<strong>in</strong>creas<strong>in</strong>g energy efficiency, which reached a maximum <strong>of</strong> 16% higher than that <strong>of</strong> gasol<strong>in</strong>evehicles. Development <strong>in</strong> <strong>the</strong> 1980s was geared towards control <strong>of</strong> pollutant emission and <strong>the</strong>energy advantage <strong>of</strong> ethanol fell through <strong>the</strong> 1990s as <strong>the</strong> <strong>in</strong>dustry <strong>in</strong>vested more <strong>in</strong> gasol<strong>in</strong>evehicle technology, respond<strong>in</strong>g to <strong>the</strong> drop <strong>in</strong> oil prices.Vehicle manufacturers have different strategies for <strong>the</strong> development <strong>of</strong> flex-fuel eng<strong>in</strong>es. Ingeneral, however, adequate use is still not made <strong>of</strong> ethanol’s greater latent heat <strong>of</strong> vaporizationand higher octane for reduc<strong>in</strong>g consumption. At <strong>the</strong> same time gasol<strong>in</strong>e consumption hasimproved, so that <strong>in</strong> <strong>of</strong>ficial tests <strong>of</strong> flex-fuel vehicles <strong>the</strong> energy advantage <strong>of</strong> ethanol has beenvirtually annulled. In tests conducted by specialized magaz<strong>in</strong>es, however, ethanol has shownsignificantly higher energy efficiency compared to gasol<strong>in</strong>e. This <strong>in</strong>dicates a need to th<strong>in</strong>k abouthow standardized consumption tests could be made more representative <strong>of</strong> typical usage.While <strong>the</strong> technologies to improve energy efficiency <strong>of</strong> flex-fuel eng<strong>in</strong>es are well known, <strong>the</strong>irdevelopment is largely determ<strong>in</strong>ed by technical and economic questions that depend on how
Ethanol as a Fuel157much consumers are will<strong>in</strong>g to pay for <strong>the</strong> benefits. In Brazil, popular models have productionvolumes that can support <strong>in</strong>tensive eng<strong>in</strong>eer<strong>in</strong>g development, but <strong>the</strong>y are very sensitive toprice <strong>in</strong>creases.Brazil was a pioneer when it launched flex-fuel motorcycles <strong>in</strong> 2009. These build on <strong>the</strong> solutionsthat were developed <strong>in</strong> <strong>the</strong> 1980s for ethanol-powered motorcycles. They are <strong>in</strong>novative,low-cost vehicles that could represent an export opportunity. Some <strong>of</strong> <strong>the</strong> <strong>in</strong>novations adopted<strong>in</strong> four-wheel vehicles could also be used for motorcycles.F<strong>in</strong>ally, <strong>the</strong>re are great opportunities for us<strong>in</strong>g ethanol as a substitute for diesel, particularly <strong>in</strong><strong>the</strong> sugar-energy sector and <strong>in</strong> <strong>the</strong> urban transportation <strong>of</strong> passengers and cargo, where it isdesirable to use clean and renewable fuels. In such cases, <strong>the</strong> use <strong>of</strong> ethanol <strong>in</strong> captive fleetspermits <strong>the</strong> development <strong>of</strong> technical solutions that are optimized for ethanol. Due to <strong>the</strong> socialcharacter <strong>of</strong> urban passenger transport, <strong>the</strong>re is potential for tax <strong>in</strong>centives that improve its viability.Technological alternatives now under development po<strong>in</strong>t to four options: a) <strong>the</strong> conversion<strong>of</strong> diesel eng<strong>in</strong>es <strong>in</strong>to Otto Cycle eng<strong>in</strong>es; b) <strong>the</strong> use <strong>of</strong> ethanol with an additive; c) <strong>the</strong> use<strong>of</strong> vaporized ethanol <strong>in</strong> diesel eng<strong>in</strong>es; and d) blends <strong>of</strong> ethanol and diesel with a co-solvent.Despite <strong>the</strong> success <strong>of</strong> ethanol, public policies are needed to re<strong>in</strong>force Brazilian technologicalcapability for <strong>the</strong> efficient and susta<strong>in</strong>able use <strong>of</strong> <strong>the</strong> fuel. Such policies would <strong>in</strong>clude tra<strong>in</strong><strong>in</strong>ghuman resources for research and development, stimulus for domestic automotive eng<strong>in</strong>eer<strong>in</strong>g,and <strong>in</strong>centives for consumers.
158 Ethanol and Bioelectricity <strong>Sugarcane</strong> <strong>in</strong> <strong>the</strong> <strong>Future</strong> <strong>of</strong> <strong>the</strong> <strong>Energy</strong> <strong>Matrix</strong>1. IntroductionBrazilian use <strong>of</strong> ethanol as a vehicle fuel grew sharply from 1975 with <strong>the</strong> establishment <strong>of</strong> <strong>the</strong> NationalEthanol Program, known <strong>in</strong> Portuguese as Proálcool. This program <strong>in</strong>itially encouraged <strong>the</strong> production <strong>of</strong>anhydrous ethanol (AEAC) to be blended <strong>in</strong>to gasol<strong>in</strong>e up to a level <strong>of</strong> 20%, <strong>the</strong>n as <strong>of</strong> 1977 Proálcool alsobegan to promote <strong>the</strong> use <strong>of</strong> pure hydrous ethanol (AEHC) as vehicle fuel.Given <strong>the</strong> <strong>in</strong>itial resistance by automakers to produc<strong>in</strong>g all-ethanol vehicles, <strong>the</strong> <strong>in</strong>itial strategy for Proálcoolwas to dissem<strong>in</strong>ate <strong>the</strong> technology for convert<strong>in</strong>g gasol<strong>in</strong>e eng<strong>in</strong>es to run on hydrous ethanol. Eng<strong>in</strong>erebore workshops were selected to carry out conversions, backed up by a network <strong>of</strong> Technology SupportCenters (CATs). These centers were based on research <strong>in</strong>stitutes and public universities <strong>in</strong> various states.The goal was to make conversion techniques uniform and consistent, <strong>in</strong> l<strong>in</strong>e with a study presented by <strong>the</strong>São Paulo State Institute for Technological Research (IPT – Castro et al. 1982). The CATs certified <strong>in</strong>terestedcompanies <strong>of</strong> proven technical competence to perform eng<strong>in</strong>e conversions and helped develop and approveconversion procedures by certified companies.Although this period <strong>of</strong> eng<strong>in</strong>e conversion, and <strong>the</strong> demonstration fleets that were established at <strong>the</strong> time,helped spur consumer <strong>in</strong>terest <strong>in</strong> <strong>the</strong> use <strong>of</strong> hydrous ethanol, it was only <strong>in</strong> 1979 that <strong>the</strong> program reallytook <strong>of</strong>f, with <strong>the</strong> factory production <strong>of</strong> new ethanol-powered vehicles. This followed an agreement betweenProálcool and Anfavea (<strong>the</strong> National Association <strong>of</strong> Automotive Vehicle Manufacturers).The ma<strong>in</strong> vector for <strong>the</strong> development <strong>of</strong> ethanol eng<strong>in</strong>e technology at this time was <strong>in</strong>creas<strong>in</strong>g energy efficiency.This was consistent with <strong>the</strong> strategic and economic factors that led to creation <strong>of</strong> Proálcool. Environmentalconcerns were not a priority, although ethanol’s characteristic as a renewable fuel had been recognizedand was cited as an important quality. In <strong>the</strong> same context, <strong>the</strong> search began around 1980 for alternatives toreplace <strong>the</strong> large-scale use <strong>of</strong> diesel <strong>in</strong> agricultural mach<strong>in</strong>ery, freight and public passenger transport.In addition to <strong>the</strong> above-mentioned questions, ethanol’s environmental and social characteristics startedga<strong>in</strong><strong>in</strong>g importance around <strong>the</strong> mid-eighties. From an automotive eng<strong>in</strong>eer<strong>in</strong>g standpo<strong>in</strong>t, technology developmentwas driven primarily by environmental requirements for pollutant emission control and end-usersatisfaction, with energy efficiency <strong>of</strong>ten tak<strong>in</strong>g a back seat.This chapter seeks to analyze <strong>the</strong> evolution <strong>of</strong> Brazilian technology for us<strong>in</strong>g ethanol as a fuel, po<strong>in</strong>t<strong>in</strong>g out <strong>the</strong>ma<strong>in</strong> technological challenges to be overcome to make fuel ethanol more competitive and suggest<strong>in</strong>g publicpolicy measures that can help overcome <strong>the</strong>se challenges. We give special attention to flex-fuel vehicle technologiesand to replac<strong>in</strong>g diesel fuel with ethanol, especially <strong>in</strong> terms <strong>of</strong> energy efficiency and technical feasibility.Consider<strong>in</strong>g that over <strong>the</strong> past hundred years <strong>the</strong> <strong>in</strong>ternal combustion eng<strong>in</strong>e has been developed andref<strong>in</strong>ed to run on gasol<strong>in</strong>e and diesel, and that <strong>the</strong>se fuels have also been better adapted to <strong>the</strong>ir respectiveeng<strong>in</strong>es, <strong>the</strong> approach used <strong>in</strong> this paper to expla<strong>in</strong> <strong>the</strong> evolution <strong>of</strong> ethanol eng<strong>in</strong>e technology will bebased on a comparative evaluation <strong>of</strong> <strong>the</strong> properties <strong>of</strong> ethanol with those <strong>of</strong> petroleum derivatives.
Ethanol as a Fuel159Currently, <strong>the</strong> technological fuel-eng<strong>in</strong>e <strong>in</strong>terface – which historically developed as a symbiotic relationshipbetween <strong>the</strong> automotive and oil ref<strong>in</strong><strong>in</strong>g <strong>in</strong>dustries – is be<strong>in</strong>g challenged by renewed <strong>in</strong>terest <strong>in</strong> bi<strong>of</strong>uels,particularly ethanol. However, consider<strong>in</strong>g <strong>the</strong> global context <strong>in</strong> which <strong>the</strong> auto <strong>in</strong>dustry operates, petroleumderivatives still account for 97% <strong>of</strong> fuel consumed by eng<strong>in</strong>es. The feasibility <strong>of</strong> any alternative fuelis <strong>the</strong>refore heavily dependent on us<strong>in</strong>g <strong>the</strong> <strong>in</strong>dustrial <strong>in</strong>frastructure already established for transport<strong>in</strong>g,stor<strong>in</strong>g and distribut<strong>in</strong>g gasol<strong>in</strong>e and diesel. This important economic and structural question represents<strong>the</strong> ma<strong>in</strong> competitive advantage <strong>of</strong> renewable fuels <strong>in</strong> comparison to o<strong>the</strong>r alternative sources <strong>of</strong> energyfor <strong>the</strong> transportation sector, and justifies <strong>the</strong> approach used here to promote <strong>the</strong> grow<strong>in</strong>g use <strong>of</strong> ethanolthrough technological development, ra<strong>the</strong>r than as a disruptive technology.2. Flex-fuel vehicles2.1 Historical context, orig<strong>in</strong>s and pr<strong>in</strong>ciples <strong>of</strong> operationTo facilitate an understand<strong>in</strong>g <strong>of</strong> <strong>the</strong> technical questions that lay beh<strong>in</strong>d <strong>the</strong> development <strong>of</strong> ethanol eng<strong>in</strong>esand <strong>the</strong> emergence <strong>of</strong> flex-fuel eng<strong>in</strong>es, it is necessary to consider <strong>the</strong> ma<strong>in</strong> similarities and differences betweenethanol and petroleum derivatives from <strong>the</strong> perspective <strong>of</strong> <strong>the</strong>ir use <strong>in</strong> <strong>in</strong>ternal combustion eng<strong>in</strong>es.One key difference is <strong>the</strong> high oxygen content <strong>of</strong> ethanol (35% by mass). This would <strong>in</strong>itially <strong>in</strong>dicate a calorificvalue around 65% <strong>of</strong> that <strong>of</strong> oil derivatives, toge<strong>the</strong>r with <strong>the</strong> possibility <strong>of</strong> a cleaner burn <strong>in</strong> <strong>the</strong> eng<strong>in</strong>e.Ano<strong>the</strong>r important feature <strong>of</strong> ethanol, associated with its short molecular cha<strong>in</strong>, is its considerable volatilityand high resistance to spontaneous ignition. These features make it suitable for spark-plug ignition (Ottoeng<strong>in</strong>es). It is important to note that as a pure substance, ethanol has a constant distillation temperature<strong>of</strong> 78 °C at atmospheric pressure, whereas gasol<strong>in</strong>e, which is a mixture <strong>of</strong> over 500 hydrocarbon cha<strong>in</strong>stypically conta<strong>in</strong><strong>in</strong>g five to 12 carbons, undergoes distillation usually between 30 °C to 220 °C. This characteristicis used as a parameter for design <strong>of</strong> Otto eng<strong>in</strong>es.Ideally, Otto eng<strong>in</strong>es require a homogeneous mixture <strong>of</strong> fuel vapor and air <strong>in</strong> a stoichiometric (chemicallyideal) proportion. This is compressed <strong>in</strong> <strong>the</strong> combustion chamber. The eng<strong>in</strong>e <strong>in</strong>duces ignition by a sparkfrom <strong>the</strong> spark plug and combustion occurs by flame propagation, without <strong>the</strong> occurrence <strong>of</strong> auto-ignition.Fuels that are more resistant to auto-ignition make it possible to <strong>the</strong> <strong>in</strong>crease <strong>of</strong> <strong>the</strong> compression ratio <strong>of</strong><strong>the</strong> eng<strong>in</strong>e and consequently its energy efficiency. Octane rat<strong>in</strong>g is a measure <strong>of</strong> resistance to auto-ignition<strong>of</strong> fuels <strong>in</strong> Otto eng<strong>in</strong>es. It is measured <strong>in</strong> a special eng<strong>in</strong>e under standardized conditions, and <strong>the</strong> values forethanol are significantly higher than those for gasol<strong>in</strong>e. i This characteristic makes it possible to add ethanolto gasol<strong>in</strong>e to <strong>in</strong>crease its octane rat<strong>in</strong>g, a fact that allowed Brazil to become one <strong>of</strong> <strong>the</strong> first countries toelim<strong>in</strong>ate tetraethyl lead, a substance known for its high toxicity, such as anti-knock additive <strong>in</strong> gasol<strong>in</strong>e.Add<strong>in</strong>g ethanol to gasol<strong>in</strong>e also contributed to elim<strong>in</strong>at<strong>in</strong>g <strong>the</strong> need to <strong>in</strong>crease <strong>the</strong> presence <strong>of</strong> aromatichydrocarbons <strong>in</strong> gasol<strong>in</strong>e <strong>in</strong> ref<strong>in</strong>ery operations, a practice frequently used to <strong>in</strong>crease octane rat<strong>in</strong>g, butwhich has <strong>the</strong> disadvantage <strong>of</strong> <strong>in</strong>creas<strong>in</strong>g <strong>the</strong> toxicity <strong>of</strong> both <strong>the</strong> fuel and its combustion byproducts.
160 Ethanol and Bioelectricity <strong>Sugarcane</strong> <strong>in</strong> <strong>the</strong> <strong>Future</strong> <strong>of</strong> <strong>the</strong> <strong>Energy</strong> <strong>Matrix</strong>Given its considerable volatility, low lubricity and high resistance to auto-ignition, ethanol is traditionallynot used as a fuel <strong>in</strong> compression ignition motors (Diesel Cycle). In this type <strong>of</strong> eng<strong>in</strong>e, air is compressedbefore <strong>the</strong> fuel is <strong>in</strong>jected at <strong>the</strong> right time via a high-pressure system, and auto-ignites. The air-fuel mixtureis heterogeneous, which facilitates <strong>the</strong> formation <strong>of</strong> particulate matter <strong>in</strong> <strong>the</strong> exhaust fumes, and <strong>the</strong><strong>in</strong>jection system is normally lubricated by <strong>the</strong> fuel itself, which to this end requires specific characteristics<strong>of</strong> viscosity and lubricity.Ethanol is completely miscible with gasol<strong>in</strong>e and water, and is sold <strong>in</strong> Brazil as anhydrous ethanol (AEAC)or hydrous ethanol (AEHC) conta<strong>in</strong><strong>in</strong>g 5-6% <strong>of</strong> water by volume. AEAC is mixed with Type A gasol<strong>in</strong>e <strong>in</strong> aquantity that can vary between 20% to 25% ± 1% <strong>in</strong> volume to form Type C gasol<strong>in</strong>e, which is sold at fill<strong>in</strong>gstations. AEAC concentration <strong>in</strong> gasol<strong>in</strong>e is set by <strong>the</strong> Inter-m<strong>in</strong>isterial Sugar and Ethanol Commission(CIMA) <strong>in</strong> function <strong>of</strong> supply and demand conditions for <strong>the</strong> product <strong>in</strong> <strong>the</strong> market, and has been held at25% <strong>in</strong> recent years. Given that Type A gasol<strong>in</strong>e is not miscible with water, <strong>the</strong> stability <strong>of</strong> <strong>the</strong> ternary mixturedepends on <strong>the</strong> proportion <strong>of</strong> <strong>the</strong> components. Fortunately, when Type C gasol<strong>in</strong>e is mixed with AEHC<strong>the</strong> mixture is stable even at temperatures down to -10 °C. This means that flex-fuel vehicles can be usedwithout restriction <strong>in</strong> Brazil (Neto et al., 1993).Ano<strong>the</strong>r property <strong>of</strong> ethanol that is quite different from petroleum is <strong>the</strong> latent heat <strong>of</strong> vaporization. Forethanol this corresponds to 3.2% <strong>of</strong> its calorific value, while for petroleum derivatives it is about 0.7%.As mentioned above, spark-ignition eng<strong>in</strong>es require a mixture <strong>of</strong> air and fuel vapor that is close to <strong>the</strong> stoichiometricratio <strong>in</strong> order to function properly, with low emission <strong>of</strong> pollutants. This means that <strong>the</strong> amount<strong>of</strong> ethanol required to fully utilize <strong>the</strong> same amount <strong>of</strong> air is much higher than that for gasol<strong>in</strong>e, which <strong>in</strong>turn means that an ethanol eng<strong>in</strong>e fuel system has to supply a quantity <strong>of</strong> fuel about 60% higher than <strong>in</strong>a gasol<strong>in</strong>e eng<strong>in</strong>e <strong>of</strong> equivalent power.F<strong>in</strong>ally, it should be noted that all components <strong>of</strong> <strong>the</strong> fuel system must be made <strong>of</strong> materials that <strong>of</strong>ferchemical compatibility with <strong>the</strong> fuel to be used. Various materials were substituted <strong>in</strong> <strong>the</strong> 1980s, ma<strong>in</strong>lyplastics, rubber and metallic substances used to protect surfaces that were <strong>in</strong>compatible with ethanol.More recently <strong>the</strong> automotive sector has only used materials that are compatible with both ethanol andpetroleum derivatives.The rebore <strong>in</strong>dustry converted gasol<strong>in</strong>e eng<strong>in</strong>es to use AEHC, with <strong>the</strong> technology compris<strong>in</strong>g <strong>the</strong> follow<strong>in</strong>gelements: <strong>in</strong>crease <strong>of</strong> eng<strong>in</strong>e compression ratios by lower<strong>in</strong>g cyl<strong>in</strong>der heads and replac<strong>in</strong>g pistons; recalibration<strong>of</strong> carburetors for ethanol; alteration <strong>of</strong> centrifugal advance and vacuum curves <strong>in</strong> <strong>the</strong> distributor toensure optimal spark tim<strong>in</strong>g for ethanol combustion; use <strong>of</strong> spark plugs with lower operat<strong>in</strong>g temperaturethan gasol<strong>in</strong>e ones; and <strong>in</strong>stallation <strong>of</strong> an auxiliary cold start system with gasol<strong>in</strong>e <strong>in</strong>jection <strong>in</strong>to <strong>the</strong> <strong>in</strong>takemanifold. Some models also received heated <strong>in</strong>take manifolds, us<strong>in</strong>g ei<strong>the</strong>r <strong>the</strong> eng<strong>in</strong>e’s cool<strong>in</strong>g water orits exhaust gases. This facilitated ethanol vaporization and allowed for better use <strong>of</strong> <strong>the</strong> correspond<strong>in</strong>genergy. To prevent <strong>the</strong> higher compression ratio generat<strong>in</strong>g undue mechanical stress, <strong>the</strong> fuel-air mixturewas less enriched than that used <strong>in</strong> gasol<strong>in</strong>e-powered eng<strong>in</strong>es at full power ii , thus ma<strong>in</strong>ta<strong>in</strong><strong>in</strong>g <strong>the</strong> torque
Ethanol as a Fuel161and horsepower <strong>of</strong> <strong>the</strong> orig<strong>in</strong>al eng<strong>in</strong>e. This helped decrease consumption. In order to ma<strong>in</strong>ta<strong>in</strong> compatibilitybetween ethanol and <strong>the</strong> materials used <strong>in</strong> <strong>the</strong> fuel supply system, elastomeric seals and some ferrousand plastic components <strong>of</strong> <strong>the</strong> system were changed and carburetors received anti-corrosion protection. Toreceive certification, eng<strong>in</strong>e conversions had to demonstrate: ma<strong>in</strong>tenance <strong>of</strong> <strong>the</strong> eng<strong>in</strong>e torque curve at fullpower with no more than a 25% <strong>in</strong>crease <strong>in</strong> AEHC consumption by volume when compared to <strong>the</strong> orig<strong>in</strong>aleng<strong>in</strong>e us<strong>in</strong>g ‘gasohol’ (gasol<strong>in</strong>e with up to 20% ethanol); calibration <strong>of</strong> <strong>the</strong> mixture and tim<strong>in</strong>g advance toensure that, when operat<strong>in</strong>g under partial load (25%, 50% and 75% <strong>of</strong> full load) over <strong>the</strong> entire range <strong>of</strong> eng<strong>in</strong>espeeds, consumption was at most 6% greater than m<strong>in</strong>imum consumption at each operat<strong>in</strong>g po<strong>in</strong>t.When tak<strong>in</strong>g <strong>in</strong>to account <strong>the</strong> calorific value <strong>of</strong> <strong>the</strong> fuels, we can see that <strong>the</strong> energy efficiency obta<strong>in</strong>edby us<strong>in</strong>g ethanol at full load was about 25% higher than gasol<strong>in</strong>e. This ga<strong>in</strong> was possible because at thattime <strong>the</strong> gasol<strong>in</strong>e/air mixture at full load was very rich – excess gasol<strong>in</strong>e <strong>of</strong> up to 15% compared to <strong>the</strong> stoichiometricmixture to ensure a rich mix even <strong>in</strong> a cyl<strong>in</strong>der receiv<strong>in</strong>g less fuel – and <strong>the</strong> compression ratio <strong>in</strong>eng<strong>in</strong>es runn<strong>in</strong>g on Brazilian gasol<strong>in</strong>e was less than 8:1. Moreover, <strong>the</strong> reference gasol<strong>in</strong>e eng<strong>in</strong>e used wasa normal production eng<strong>in</strong>e, while <strong>the</strong> converted eng<strong>in</strong>e was specially calibrated us<strong>in</strong>g a dynamometer, afact that could expla<strong>in</strong> perhaps 5% <strong>of</strong> <strong>the</strong> efficiency ga<strong>in</strong>. The <strong>in</strong>crease <strong>in</strong> compression ratio for values upto 12:1 implied an efficiency <strong>in</strong>crease <strong>of</strong> around 7%, while <strong>the</strong> use <strong>of</strong> latent heat <strong>of</strong> ethanol vaporizationaccounted for about 2%.As reported by <strong>the</strong> IPT <strong>in</strong> <strong>the</strong> already-mentioned study, <strong>the</strong> consumption <strong>of</strong> vehicles converted to ethanol,measured <strong>in</strong> field tests and on a chassis dynamometer, was around 20% higher by volume than that <strong>of</strong> normalproduction cars, albeit with loss <strong>of</strong> drivability.On <strong>the</strong> o<strong>the</strong>r hand, <strong>the</strong> eng<strong>in</strong>es <strong>of</strong> new ethanol-powered cars produced by automakers s<strong>in</strong>ce 1979 havetaken advantage <strong>of</strong> ethanol characteristics that <strong>in</strong>crease torque and power, with carburetors calibrated touse a rich mixture at full load and a lean mixture on partial loads.The fuel consumption <strong>of</strong> vehicles produced dur<strong>in</strong>g <strong>the</strong> period <strong>in</strong> which ethanol-powered cars accounted formore than 90% <strong>of</strong> new vehicle sales can be compared by us<strong>in</strong>g data from <strong>the</strong> Fuel Economy Program (Programade Economia de Combustíveis – PECO) iii signed between <strong>the</strong> Federal Government – represented by <strong>the</strong>M<strong>in</strong>istry <strong>of</strong> Industry and Commerce and <strong>the</strong> M<strong>in</strong>istry <strong>of</strong> M<strong>in</strong>es and <strong>Energy</strong> – and automakers, represented byAnfavea. Implemented by <strong>the</strong> Secretariat <strong>of</strong> Industrial Technology (STI/MIC), from 1983 to 1986 <strong>the</strong> programpublished a booklet entitled The Right Choice – A Consumption Guide to Your Car, which conta<strong>in</strong>ed averageconsumption values for new cars sold at that time. Measurements were carried out <strong>in</strong> accordance with ABNTNBR 7024, a standard created at that time and called “Light on-road motor vehicles – Measurement <strong>of</strong> fuelconsumption – Test method”. For example, <strong>the</strong> consumption <strong>of</strong> one <strong>of</strong> <strong>the</strong> most popular ethanol-poweredmodels (1985, 830 kg weight and eng<strong>in</strong>e rated at 43.9 kW) was 11.2 liters/100 km (8.9 km /liter) <strong>in</strong> <strong>the</strong> cityand 7.7 liters/100 km (13.0 km/l) on <strong>the</strong> highway. The average <strong>in</strong>crease <strong>in</strong> consumption <strong>of</strong> ethanol poweredvehicles when compared to <strong>the</strong> equivalent gasol<strong>in</strong>e model was 25% by volume, which implies an energy ga<strong>in</strong><strong>of</strong> 16% <strong>in</strong> favor <strong>of</strong> ethanol, although it should be noted that tests were performed <strong>in</strong> pre-heated eng<strong>in</strong>es.Under <strong>the</strong>se average vehicular operation conditions, <strong>the</strong> <strong>in</strong>creased compression ratio possibly accounted for
162 Ethanol and Bioelectricity <strong>Sugarcane</strong> <strong>in</strong> <strong>the</strong> <strong>Future</strong> <strong>of</strong> <strong>the</strong> <strong>Energy</strong> <strong>Matrix</strong>around 6%, <strong>the</strong> leaner mixture for about 7% and <strong>the</strong> use <strong>of</strong> <strong>the</strong> greater latent heat <strong>of</strong> ethanol vaporizationfor 1%. Ano<strong>the</strong>r factor worth mention<strong>in</strong>g is that ethanol-powered models were more modern than gasol<strong>in</strong>eones. As such, <strong>the</strong>y <strong>in</strong>corporated <strong>in</strong>cremental developments <strong>in</strong> advance <strong>of</strong> <strong>the</strong> gasol<strong>in</strong>e models.At that time, accord<strong>in</strong>g to Cetesb iv , average emissions <strong>of</strong> ethanol-powered vehicles were: carbon monoxide(CO) - 16.9 g/km, hydrocarbons (HC) - 1.6 g/km, nitrogen oxides (NOx) – 1.2 g/km, and aldehydes (RCHO)- 0.18 g/km. Gasol<strong>in</strong>e-powered vehicles meanwhile emitted considerably more, with <strong>the</strong> exception <strong>of</strong> aldehydes:CO - 28 g/km; HC - 2.4 g/km; NOx - 1.6 g/km, and RCHO - 0.05 g/km.After 1989, <strong>the</strong>re were some market shortages due to <strong>in</strong>sufficient supply <strong>of</strong> ethanol, co<strong>in</strong>cid<strong>in</strong>g with a drop<strong>in</strong> oil prices and <strong>the</strong> open<strong>in</strong>g <strong>of</strong> <strong>the</strong> domestic car market for imported vehicles, most <strong>of</strong> which were gasol<strong>in</strong>epowered.Consequently, <strong>the</strong> demand for ethanol cars fell sharply, and from 1995 it rema<strong>in</strong>ed below 5%.Environmental concerns were becom<strong>in</strong>g <strong>in</strong>creas<strong>in</strong>gly important dur<strong>in</strong>g that period, and Cetesb developedtechniques for measur<strong>in</strong>g vehicle pollutants. This culm<strong>in</strong>ated <strong>in</strong> <strong>the</strong> creation <strong>of</strong> Proconve, <strong>the</strong> Programto Control Motor Vehicle Air Pollution, established by Conama Resolution No. 18/86 and subsequentlyconsolidated by Law No. 8723/93 and complementary regulations. The program was run by Ibama, withCetesb as its technical agent, and limited new vehicle emissions <strong>in</strong> progressively stricter stages. Follow<strong>in</strong>g<strong>the</strong> <strong>in</strong>troduction <strong>of</strong> <strong>the</strong> legislation, vehicle development came to be dom<strong>in</strong>ated by emission targets forregulated pollutant, while aspects such as cost and energy efficiency became secondary. With <strong>the</strong> start <strong>of</strong>Stage L-3 <strong>in</strong> January 1997, three-way catalyzers became necessary to achieve maximum limits <strong>of</strong> CO (2 g/km), HC (0.3 g/m), NOx (0.6 g/km), and RCHO (0.03 g/km). This led to <strong>the</strong> use <strong>of</strong> stoichiometric mixtures<strong>in</strong> both ethanol and gasol<strong>in</strong>e eng<strong>in</strong>es. The negative impact was greater on fuel consumption <strong>of</strong> ethanolpoweredvehicles than gasol<strong>in</strong>e vehicles, s<strong>in</strong>ce <strong>the</strong> higher speed <strong>of</strong> propagation <strong>of</strong> <strong>the</strong> lam<strong>in</strong>ar flame <strong>in</strong>ethanol and <strong>the</strong> higher compression ratios <strong>of</strong> <strong>the</strong> eng<strong>in</strong>es allowed for <strong>the</strong> use <strong>of</strong> leaner mixtures than <strong>in</strong>gasol<strong>in</strong>e eng<strong>in</strong>es with partial loads.As <strong>of</strong> 1999, ethanol prices once aga<strong>in</strong> became competitive aga<strong>in</strong>st gasol<strong>in</strong>e <strong>in</strong> <strong>the</strong> Brazilian market. Ethanol-poweredvehicles were available, and new all-ethanol eng<strong>in</strong>es were developed. However, sales did notpick up, because <strong>the</strong>re was a lack <strong>of</strong> consumer trust.It was <strong>in</strong> this context that <strong>the</strong> first Brazilian flex-fuel vehicle was launched <strong>in</strong> March 2003, capable <strong>of</strong> runn<strong>in</strong>gon hydrous ethanol, Type C gasol<strong>in</strong>e or any mixture <strong>of</strong> <strong>the</strong> two. This gave motorists <strong>the</strong> freedom tochoose <strong>the</strong>ir fuel at each fill-up, tak<strong>in</strong>g <strong>in</strong>to account cost and availability.Alternative fuels research <strong>in</strong> <strong>the</strong> United States, Europe and Japan <strong>in</strong> <strong>the</strong> early 1980s (Pefley et al., 1980)had already led to development <strong>of</strong> prototypes, anticipat<strong>in</strong>g <strong>the</strong> possibility <strong>of</strong> us<strong>in</strong>g ethanol, methanol orgasol<strong>in</strong>e <strong>in</strong> <strong>the</strong> same eng<strong>in</strong>e. These prototypes took advantage <strong>of</strong> <strong>the</strong> flexibility <strong>of</strong> electronic fuel <strong>in</strong>jectionsystems that were start<strong>in</strong>g to be used on a commercial scale, controlled by feedback <strong>of</strong> <strong>the</strong> sensor signalthat measured <strong>the</strong> oxygen content <strong>in</strong> exhaust gases.
Ethanol as a Fuel163The first flex-fuel vehicles developed by automakers came from Ford <strong>in</strong> <strong>the</strong> United States <strong>in</strong> 1984 and wereused <strong>in</strong> demonstration programs <strong>of</strong> flex-fuel technology. General Motors launched <strong>the</strong> first commercialflex-fuel vehicle <strong>in</strong> <strong>the</strong> United States <strong>in</strong> 1992, <strong>the</strong> Lum<strong>in</strong>a van, with a capacitive sensor for measur<strong>in</strong>g <strong>the</strong>ethanol content <strong>in</strong> <strong>the</strong> fuel.The flex-fuel vehicle fleet <strong>in</strong> <strong>the</strong> United States grew strongly, stimulated by several U.S. government regulationsand tax <strong>in</strong>centives v . This was despite <strong>the</strong> lack <strong>of</strong> fuel supply <strong>in</strong>frastructure. It is worth mention<strong>in</strong>gthat U.S. flex-fuel vehicles accept as limit<strong>in</strong>g fuels gasol<strong>in</strong>e with zero ethanol (E0) and gasol<strong>in</strong>e with 85%anhydrous ethanol (E85).In Brazil, <strong>the</strong> first studies were developed by Bosch <strong>in</strong> 1990, as described by Conti, 2002, at a sem<strong>in</strong>arorganized by <strong>the</strong> IPT <strong>in</strong> March 2000. The first prototype vehicle us<strong>in</strong>g <strong>the</strong> Motronic Flex Fuel system waspresented by Castro et al (1994). In 2000, Magneti Marelli presented its Flex-fuel Sensor S<strong>of</strong>tware system(SFS) System vi . This constituted an <strong>in</strong>novation <strong>in</strong> that it did not require <strong>the</strong> additional capacitive sensor usedby <strong>the</strong> Bosch system to detect <strong>the</strong> percentage <strong>of</strong> blended ethanol; <strong>in</strong>stead this was replaced by <strong>the</strong> oxygensensor already used to control pollutant emissions. As a simpler, cheaper and more reliable system, it became<strong>the</strong> preferred choice for automakers. Moreover, <strong>the</strong> federal government allowed flex-fuel vehicles toenjoy <strong>the</strong> same IPI tax rates as alcohol vehicles (lower than gasol<strong>in</strong>e vehicles), a factor that <strong>of</strong>fset <strong>the</strong> <strong>in</strong>vestment<strong>in</strong> technological development and allowed <strong>the</strong> technology to be deployed throughout Brazil.The operat<strong>in</strong>g pr<strong>in</strong>ciple <strong>of</strong> flex-fuel technology used <strong>in</strong> Brazil is based on <strong>the</strong> oxygen content sensor <strong>in</strong><strong>the</strong> exhaust gas (lambda probe), an item that is already required to meet Proconve Phase L-3 emissionstandards. As previously mentioned, <strong>the</strong> air/fuel mixture must be ma<strong>in</strong>ta<strong>in</strong>ed at its stoichiometric or ideallevel so that <strong>the</strong> three-way catalyzer can dramatically reduce HC, CO, NOx and RCHO. The function <strong>of</strong> <strong>the</strong>lambda probe is to <strong>in</strong>struct <strong>the</strong> eng<strong>in</strong>e’s electronic control unit (ECU) to <strong>in</strong>ject more or less fuel if <strong>the</strong> mixtureis too lean or too rich (hav<strong>in</strong>g less or more fuel), thus keep<strong>in</strong>g <strong>the</strong> fuel stoichiometrically correct forcombustion. Moreover, <strong>in</strong> order to accurately detect <strong>the</strong> eng<strong>in</strong>e operat<strong>in</strong>g po<strong>in</strong>t (percentage <strong>of</strong> load androtation), additional sensors measure eng<strong>in</strong>e rotation and <strong>the</strong> <strong>in</strong>take air flow and report this to <strong>the</strong> ECU.Given that <strong>the</strong> values <strong>of</strong> <strong>the</strong> stoichiometric ratios <strong>of</strong> air/ethanol and air/gasol<strong>in</strong>e are known and are stored <strong>in</strong><strong>the</strong> ECU memory, it is possible to calculate <strong>the</strong> ethanol ratio <strong>in</strong> <strong>the</strong> fuel be<strong>in</strong>g <strong>in</strong>jected <strong>in</strong>to <strong>the</strong> eng<strong>in</strong>e – <strong>the</strong>ECU <strong>in</strong>fers <strong>the</strong> amount <strong>of</strong> fuel be<strong>in</strong>g <strong>in</strong>jected to ma<strong>in</strong>ta<strong>in</strong> <strong>the</strong> stoichiometric air/fuel mixture from <strong>the</strong> length <strong>of</strong>time that <strong>the</strong> <strong>in</strong>jectors need to be kept open. Based on this calculated content, o<strong>the</strong>r eng<strong>in</strong>e operat<strong>in</strong>g parameterswhose optimal values depend on <strong>the</strong> ethanol content <strong>in</strong> <strong>the</strong> fuel are controlled. These <strong>in</strong>clude ignitiontim<strong>in</strong>g; <strong>the</strong> need for gasol<strong>in</strong>e <strong>in</strong>jection at a cold start; <strong>the</strong> amounts that need to be <strong>in</strong>jected to meet transitoryeng<strong>in</strong>e response <strong>in</strong> hot and cold conditions and strategies to improve <strong>the</strong> efficiency <strong>of</strong> <strong>the</strong> catalyzer.Ano<strong>the</strong>r fundamental aspect for <strong>the</strong> rapid <strong>in</strong>troduction and development <strong>of</strong> flex-fuel technology <strong>in</strong> Brazilwas <strong>the</strong> immediate <strong>in</strong>corporation <strong>of</strong> improvements made previously to ethanol eng<strong>in</strong>e, <strong>in</strong> terms <strong>of</strong> materialcompatibility, degree <strong>of</strong> ignition heat, fuel pump and filter system, and cold start, among o<strong>the</strong>rs.
16 4 Ethanol and Bioelectricity <strong>Sugarcane</strong> <strong>in</strong> <strong>the</strong> <strong>Future</strong> <strong>of</strong> <strong>the</strong> <strong>Energy</strong> <strong>Matrix</strong>2.2 Development <strong>of</strong> <strong>the</strong> technology <strong>in</strong> BrazilThe <strong>in</strong>troduction <strong>of</strong> flex-fuel eng<strong>in</strong>e technology <strong>in</strong> Brazil was <strong>in</strong>itially based on <strong>the</strong> concept <strong>of</strong> not modify<strong>in</strong>g<strong>the</strong> orig<strong>in</strong>al gasol<strong>in</strong>e eng<strong>in</strong>e. In <strong>the</strong> first generation, <strong>the</strong>refore, attention was focused almost exclusively onsystem functionality and meet<strong>in</strong>g emission requirements, with little concern paid to ethanol consumption.The compression ratio <strong>of</strong> eng<strong>in</strong>es us<strong>in</strong>g Type C gasol<strong>in</strong>e was ma<strong>in</strong>ta<strong>in</strong>ed, and ga<strong>in</strong>s <strong>in</strong> torque and powerderiv<strong>in</strong>g from <strong>the</strong> use <strong>of</strong> ethanol were around 2%. Dur<strong>in</strong>g <strong>the</strong> second generation, compression ratios roseby about one percentage po<strong>in</strong>t compared to Type C gasol<strong>in</strong>e eng<strong>in</strong>es, represent<strong>in</strong>g <strong>the</strong> search for greaterequilibrium <strong>in</strong> <strong>the</strong> development <strong>of</strong> an eng<strong>in</strong>e for both fuels. Ga<strong>in</strong>s <strong>in</strong> horsepower and torque for ethanolwere <strong>in</strong> <strong>the</strong> range <strong>of</strong> 3% to 4%. New catalyzers and spark plugs appropriate for <strong>the</strong> new compression ratioswere also <strong>in</strong>troduced. In <strong>the</strong> third generation, some automakers with greater experience <strong>in</strong> <strong>the</strong> development<strong>of</strong> ethanol eng<strong>in</strong>es adopted <strong>in</strong> some models compression ratios close to <strong>the</strong> maximum acceptable forethanol, with torque ga<strong>in</strong>s <strong>of</strong> over 5% when us<strong>in</strong>g ethanol.Table 1 was adapted from a presentation made by a Volkswagen representative vii at <strong>the</strong> 2009 Ethanol Summit,and summarizes <strong>the</strong> progress <strong>of</strong> <strong>the</strong> technology <strong>in</strong> <strong>the</strong> vision <strong>of</strong> this automaker. Note that Volkswagen’sfourth generation technology has a cold start system with ethanol pre-heat<strong>in</strong>g, so elim<strong>in</strong>at<strong>in</strong>g <strong>the</strong> need foran auxiliary gasol<strong>in</strong>e fuel tank.While this division <strong>in</strong>to generations helps visualize <strong>the</strong> general trends, each eng<strong>in</strong>e model has its owncharacteristics and limitations. It may thus be impracticable <strong>in</strong> some cases to apply <strong>the</strong> whole concept <strong>of</strong>second generation.Three data sources can be used to compare <strong>the</strong> latest developments <strong>in</strong> fuel consumption <strong>of</strong> new ethanolpoweredcars with that <strong>of</strong> cars runn<strong>in</strong>g on Type C gasol<strong>in</strong>e: Reports <strong>of</strong> Production Emission Values viii , <strong>the</strong>Brazilian Vehicle Label<strong>in</strong>g Program, and specialized magaz<strong>in</strong>es.Table 1Evolution <strong>of</strong> flex-fuel technology, accord<strong>in</strong>g to VolkswagenGenerationMarket entryEng<strong>in</strong>ecompressionratiosPower ga<strong>in</strong>swith ethanolTorque ga<strong>in</strong>swith ethanolLoss <strong>of</strong>mileage wi<strong>the</strong>thanolCold start withgasol<strong>in</strong>e1 st 2003 10.1 – 10.8 2.1% 2.1% 25% - 35% Yes2 nd 2006 10.8 – 13.0 4.4% 3.2% 25% - 35% Yes3 rd 2008 11.0– 13.0 5.6% 9.3% 25% - 30% Yes4 th 2009 11.0 – 13.0 5.6% 9.3% 25% - 30% No
Ethanol as a Fuel1652.2.1. Reports <strong>of</strong> production emission values (RVEP)In addition to consumption data obta<strong>in</strong>ed from measurements to certify that pollutant emissions are with<strong>in</strong>current limits, <strong>the</strong>re is a database <strong>of</strong> eng<strong>in</strong>e fuel consumption generated by emission tests carried out byautomakers to ensure that production rema<strong>in</strong>s <strong>in</strong> compliance with <strong>the</strong> environmental legislation. This datais reported by automakers via <strong>the</strong> Reports <strong>of</strong> Production Emission Values (Relatórios de Valores de Emissãoda Produção – RVEP) submitted to Cetesb and Ibama, and corresponds to a m<strong>in</strong>imum <strong>of</strong> 0.2% <strong>of</strong> newvehicles sold. This allows for a solid statistical comparison, despite vehicles be<strong>in</strong>g tested before <strong>the</strong>y are run<strong>in</strong>. Vehicle emission values are measured at <strong>the</strong> exhaust pipe accord<strong>in</strong>g to <strong>the</strong> NBR 6601 urban cycle andrefer to <strong>the</strong> follow<strong>in</strong>g regulated pollutants: CO, HC, NOx and RCHO. Some automakers also report resultsfor carbon dioxide (CO 2) emissions and <strong>in</strong> <strong>the</strong>se cases, it is possible to calculate fuel consumption. It shouldbe noted that NBR 7024, which standardizes <strong>the</strong> measurement <strong>of</strong> fuel consumption, uses <strong>the</strong> same urbancycle as NBR 6601, while also provid<strong>in</strong>g a specific highway cycle.Cetesb has published ix factors for average emissions for new vehicles, <strong>in</strong>clud<strong>in</strong>g CO 2, s<strong>in</strong>ce 2002, as shown<strong>in</strong> Table 2. Average emission values are calculated as a weighted average for <strong>the</strong> number <strong>of</strong> vehicles sold foreach model. The values for consumption <strong>of</strong> Type C gasol<strong>in</strong>e and ethanol, presented <strong>in</strong> Table 2 and referr<strong>in</strong>gto <strong>the</strong> urban cycle, were recalculated accord<strong>in</strong>g to NBR 7024. The numbers relative to ethanol are slightlydifferent to those shown <strong>in</strong> <strong>the</strong> Cetesb report, which does not correct <strong>the</strong> calculation formula.When <strong>the</strong> lower calorific value and <strong>the</strong> specific mass <strong>of</strong> Type C gasol<strong>in</strong>e and hydrous ethanol used <strong>in</strong>emissions tests are taken <strong>in</strong>to consideration, <strong>in</strong> accordance with <strong>the</strong> Technical Regulations <strong>of</strong> <strong>the</strong> BrazilianVehicle Label<strong>in</strong>g Program x , it can be seen that 1.443 liters <strong>of</strong> ethanol is energetically equivalent to 1.0liters <strong>of</strong> Type C gasol<strong>in</strong>e. The last column <strong>of</strong> <strong>the</strong> table was calculated based on energy density values used<strong>in</strong> <strong>the</strong> Label<strong>in</strong>g Program (28.99 MJ/L for Type C gasol<strong>in</strong>e and 20.09 MJ/L for hydrous ethanol). This allowsfor a comparison <strong>in</strong> terms <strong>of</strong> average energy consumption <strong>of</strong> new vehicles for each fuel s<strong>in</strong>ce 2002. It isworth mention<strong>in</strong>g that <strong>the</strong> Type C gasol<strong>in</strong>e used <strong>in</strong> tests conta<strong>in</strong>s 22% <strong>of</strong> anhydrous ethanol by volume,while that currently sold <strong>in</strong> Brazil should conta<strong>in</strong> 25±1% <strong>of</strong> AEAC. This results <strong>in</strong> an energy equivalence <strong>of</strong>1.426±0.006 liters <strong>of</strong> AEHC for 1.0 liter <strong>of</strong> Type C gasol<strong>in</strong>e.Look<strong>in</strong>g at <strong>the</strong> results <strong>of</strong> <strong>the</strong> last column <strong>in</strong> <strong>the</strong> table, and <strong>in</strong> particular those referr<strong>in</strong>g to flex-fuel vehiclesoperat<strong>in</strong>g with both fuels from 2003 through 2007, it can be seen that <strong>in</strong> those cases where any variation<strong>of</strong> energy consumption was detected, <strong>the</strong> difference was less than 1%. This <strong>in</strong>dicates that, on average, flexfuelvehicles are still not sufficiently developed to take advantage <strong>of</strong> <strong>the</strong> greater latent heat <strong>of</strong> vaporizationand <strong>the</strong> higher octane rat<strong>in</strong>g <strong>of</strong> ethanol to achieve a significant difference <strong>in</strong> energy consumption.As for pollutant emission, flex-fuel vehicles operat<strong>in</strong>g on ethanol on average emitted values greater thanthose emitted when operat<strong>in</strong>g with gasol<strong>in</strong>e. This is shown <strong>in</strong> Table 3, prepared with Cetesb data thatwas calculated from RVEP reports. The limit<strong>in</strong>g values for each year were calculated based on <strong>the</strong> limitsfor Proconve Phases L-3 and L-4, where start<strong>in</strong>g dates for Phase L-4 were: 40% <strong>in</strong> 2005, 70% <strong>in</strong> 2006 and100% <strong>in</strong> 2007. Aldehydes emission when operat<strong>in</strong>g with ethanol is approximately five times greater than <strong>in</strong>
166 Ethanol and Bioelectricity <strong>Sugarcane</strong> <strong>in</strong> <strong>the</strong> <strong>Future</strong> <strong>of</strong> <strong>the</strong> <strong>Energy</strong> <strong>Matrix</strong>gasol<strong>in</strong>e operation, although <strong>the</strong> nature and toxicity <strong>of</strong> <strong>the</strong> aldehydes are very different for <strong>the</strong> two fuels,and are more favorable for ethanol. Of <strong>the</strong> three ma<strong>in</strong> pollutants that should be reduced by <strong>the</strong> emissioncontrol system (CO, HC and NOx), HC has on average been <strong>the</strong> most critical. Given that <strong>the</strong> balance betweenoxidation reactions and reductions <strong>in</strong> <strong>the</strong> catalytic converter xi can be altered by slightly chang<strong>in</strong>g<strong>the</strong> stoichiometry <strong>of</strong> <strong>the</strong> air/fuel mixture, <strong>the</strong> coefficient here called <strong>the</strong> “Limit Fraction” was <strong>in</strong>troduced.This is calculated as <strong>the</strong> average value <strong>of</strong> relations between <strong>the</strong> three pollutants and <strong>the</strong>ir respective limits.This coefficient <strong>in</strong>dicates that, as <strong>the</strong> years pass, <strong>the</strong>re has been a reduction <strong>in</strong> <strong>the</strong> difference between <strong>the</strong>results with both fuels. This is a result <strong>of</strong> greater attention given by automakers to ethanol operation. Thecoefficient also <strong>in</strong>dicates that, <strong>in</strong> <strong>the</strong> past two years, <strong>the</strong> average emission <strong>of</strong> <strong>the</strong>se three pollutants <strong>in</strong> <strong>the</strong>case <strong>of</strong> gasol<strong>in</strong>e operation appears to tend towards 90% <strong>of</strong> emissions with ethanol.One aspect that should be highlighted is that this data refers to new vehicles. However, emissions also dependon <strong>the</strong> deterioration <strong>of</strong> catalyzers, which is faster with gasol<strong>in</strong>e than ethanol. Emissions also dependon <strong>the</strong> quality <strong>of</strong> fuels at pumps. Emission results for flex fuel models sold <strong>in</strong> 2009, which meet ProconveTable 2Average factors for emissions and fuel consumption for new light vehicleModel Fuel CO g/km HC g/kmNOxg/kmRCHOg/kmCO 2g/kmMileagekm/literConsumptionMJ/km2002Gasol<strong>in</strong>e CEthanol0.430.740.110.160.120.080.0040.01719819110.937.472.652.692003Gasol<strong>in</strong>e CEthanolFlex-Gasol<strong>in</strong>e CFlex-Ethanol0.400.770.500.510.110.160.050.150.120.090.040.140.0040.0190.0040.02019418321020011.157.7910.317.152.602.582.812.812004Gasol<strong>in</strong>e CEthanolFlex-Gasol<strong>in</strong>e CFlex-Ethanol0.350.820.390.460.110.170.080.140.090.080.050.140.0040.0160.0030.01419016020119011.398.8910.777.522.552.262.692.672005Gasol<strong>in</strong>e CEthanolFlex-Gasol<strong>in</strong>e CFlex-Ethanol0.340.820.450.390.100.170.110.140.090.080.050.100.0040.0160.0030.01419216018818011.288.8911.507.942.572.262.522.532006Gasol<strong>in</strong>e CEthanolFlex-Gasol<strong>in</strong>e CFlex-Ethanol0.330.670.480.470.080.120.100.110.080.050.050.070.0020.0140.0030.01419220018517711.287.1411.698.082.572.812.482.492007Gasol<strong>in</strong>e CFlex-Gasol<strong>in</strong>e CFlex-Ethanol0.330.480.470.080.100.110.080.050.070.0020.0030.01419218517711.2811.698.082.572.482.49
Ethanol as a Fuel167Phase L-5, were recently released by Anfavea xii . In general, <strong>the</strong>se <strong>in</strong>dicate values that are more favorable forethanol operation. It should be noted that <strong>the</strong> observed differences are small, <strong>in</strong> absolute terms, and <strong>the</strong>vehicles easily meet current emission limits.To illustrate <strong>the</strong> comparative evolution <strong>of</strong> consumption ethanol and gasol<strong>in</strong>e vehicles, two sets <strong>of</strong> real dataobta<strong>in</strong>ed from <strong>the</strong> Reports <strong>of</strong> Production Emission Values will be discussed.Figure 1 presents semiannual average fuel consumption results from 1998 to 2003 for typical vehiclesequipped with an eng<strong>in</strong>e designed specifically for Type C gasol<strong>in</strong>e or ethanol, and <strong>the</strong>n started us<strong>in</strong>g flextechnology beg<strong>in</strong>n<strong>in</strong>g <strong>in</strong> 2003. The error bars <strong>in</strong>dicate a 95% average confidence <strong>in</strong>terval. Large confidence<strong>in</strong>tervals are associated with a reduced number <strong>of</strong> vehicles tested <strong>in</strong> <strong>the</strong> six-month period and, <strong>the</strong>refore,a low production <strong>of</strong> that model. The available data <strong>in</strong>dicate that automakers have preferentially tested flexmodels with gasol<strong>in</strong>e. This fact <strong>in</strong>creases <strong>the</strong> uncerta<strong>in</strong>ty <strong>of</strong> average values for operations us<strong>in</strong>g ethanol. Itis important to mention that vehicles <strong>of</strong> <strong>the</strong> same model and submitted to same emissions cycle can presentconsumption variations <strong>of</strong> up to 15%, while <strong>the</strong> standard deviation <strong>of</strong> <strong>the</strong> consumption distribution isaround 3% <strong>of</strong> <strong>the</strong> average value.Table 3Average factors <strong>of</strong> flex-fuel vehicle emissions compared to limit valuesModel Fuel CO g/km HC g/km NOx g/km Limit fraction RCHO g/km2003Weighted LimitGasol<strong>in</strong>e CEthanol2.00.500.510.300.050.150.600.040.14100%16%33%0.0300.0040.0202004Weighted LimitGasol<strong>in</strong>e CEthanol2.00.390.460.300.080.140.600.050.14100%18%31%0.0300.0030.0142005Weighted LimitGasol<strong>in</strong>e CEthanol2.00.450.390.240.110.140.460.050.10100%26%33%0.0300.0030.0142006Weighted LimitGasol<strong>in</strong>e CEthanol2.00.480.470.200.100.110.360.050.07100%29%33%0.0300.0030.0142007Weighted LimitGasol<strong>in</strong>e CEthanol2.00.480.470.160.100.110.250.050.07100%36%40%0.0300.0030.014
168 Ethanol and Bioelectricity <strong>Sugarcane</strong> <strong>in</strong> <strong>the</strong> <strong>Future</strong> <strong>of</strong> <strong>the</strong> <strong>Energy</strong> <strong>Matrix</strong>Consider<strong>in</strong>g <strong>the</strong> set <strong>of</strong> results <strong>of</strong> <strong>the</strong> versions dedicated to ethanol and gasol<strong>in</strong>e, <strong>the</strong> average energy bonusfor ethanol models was 2.2±0.5%. This advantage disappears <strong>in</strong> <strong>the</strong> comparative performance <strong>of</strong> <strong>the</strong> firstflex-fuel vehicles, which ma<strong>in</strong>ta<strong>in</strong>ed <strong>the</strong> compression ratio used <strong>in</strong> <strong>the</strong> gasol<strong>in</strong>e version almost unalteredand where ethanol consumption <strong>in</strong>creases 3.6±1.0% and gasol<strong>in</strong>e <strong>in</strong>creases 1.4±0.4%. Therefore, <strong>in</strong> thiscase, <strong>the</strong> flex-fuel vehicle led to a loss <strong>in</strong> energy output <strong>in</strong> operations with ethanol and gasol<strong>in</strong>e. In <strong>the</strong> secondgeneration <strong>of</strong> flex-fuel vehicles, with higher compression ratios and an improved eng<strong>in</strong>e managementsystem, <strong>the</strong> <strong>in</strong>itial energy output with ethanol was practically rega<strong>in</strong>ed, but <strong>the</strong>re was an <strong>in</strong>crease <strong>in</strong> energyoutput for operations with gasol<strong>in</strong>e. The energy advantage for ethanol <strong>the</strong>refore rema<strong>in</strong>ed <strong>in</strong>existent.Figura 2 refers to a production model with a one-liter eng<strong>in</strong>e. It shows <strong>the</strong> average consumption results forspecific ethanol and gasol<strong>in</strong>e versions until <strong>the</strong> first semester <strong>of</strong> 2005, <strong>the</strong>n average results <strong>of</strong> two generations<strong>of</strong> flex-fuel motors. Similar to <strong>the</strong> previous case, <strong>the</strong>re is an energy advantage for ethanol between <strong>the</strong>dedicated versions, which <strong>in</strong> this case averages 4.3±0.4%. We can also see that <strong>the</strong> more recent modelsclearly present lower consumption for ethanol as well as gasol<strong>in</strong>e. In <strong>the</strong> first generation <strong>of</strong> flex-fuel ve-Figure 1Fuel consumption for a typical 1.6 liter model Urban cycle – Consumption <strong>in</strong> liters/100 km16151413121110981997 1998 1999 2000 2001 2002 2003 2004 2005 2006 2007 2008 2009n Ethanoln Gasol<strong>in</strong>en Flex-E (version 1)n Flex-G (version 1)n Flex-E (version 2) n Flex-G (version 2) Flex-E (version 3) n Flex-G (version 3)
Ethanol as a Fuel169hicles, with compression ratios similar to gasol<strong>in</strong>e eng<strong>in</strong>es, <strong>the</strong> energy advantage <strong>of</strong> ethanol was reduced by0.6±0.8%, because <strong>of</strong> <strong>the</strong> <strong>in</strong>crease <strong>in</strong> ethanol consumption. Despite reduced ethanol consumption <strong>in</strong> <strong>the</strong>more recent generation where <strong>the</strong> eng<strong>in</strong>e compression ratios are similar to vehicles dedicated to ethanol, <strong>the</strong>consumption <strong>of</strong> gasol<strong>in</strong>e was also reduced, leav<strong>in</strong>g <strong>the</strong> energy advantage <strong>of</strong> ethanol <strong>in</strong> average 1.5±0.8%.For flex-fuel vehicles (that even <strong>in</strong> 2008 ma<strong>in</strong>ta<strong>in</strong>ed <strong>the</strong> same compression ratio as gasol<strong>in</strong>e eng<strong>in</strong>es), wecan see an <strong>in</strong>crease <strong>in</strong> energy consumption <strong>of</strong> approximately 2% <strong>in</strong> urban cycle, when us<strong>in</strong>g ethanol.Recapp<strong>in</strong>g <strong>the</strong> general situation observed, based on <strong>the</strong> RVEP reports – after <strong>the</strong> <strong>in</strong>troduction <strong>of</strong> ProconvePhase L-3, when three-way catalyzers became mandatory with a stoichiometric calibration <strong>of</strong> <strong>the</strong> fuelblend, <strong>the</strong>re was an energy output ga<strong>in</strong> <strong>of</strong> approximately 4% for vehicles dedicated exclusively to ethanol <strong>in</strong>comparison with those dedicated to Type C gasol<strong>in</strong>e. This was for operation <strong>in</strong> an urban cycle that <strong>in</strong>cludesa phase <strong>of</strong> cold start and motor heat<strong>in</strong>g. With <strong>the</strong> <strong>in</strong>troduction <strong>of</strong> first generation flex-fuel technology(ma<strong>in</strong>ta<strong>in</strong><strong>in</strong>g compression ratios <strong>of</strong> gasol<strong>in</strong>e eng<strong>in</strong>es) <strong>the</strong> energy output advantage <strong>of</strong> ethanol was practi-Figure 2Fuel consumption for 1.0 liter model Urban cycle – consumption <strong>in</strong> liters/100 km12111098761998 1999 2000 2001 2002 2003 2004 2005 2006 2007 2008n Ethanol n Gasol<strong>in</strong>e n Flex-ethanol n Flex-gasol<strong>in</strong>e n Flex-E (2008) n Flex-G (2008)
170 Ethanol and Bioelectricity <strong>Sugarcane</strong> <strong>in</strong> <strong>the</strong> <strong>Future</strong> <strong>of</strong> <strong>the</strong> <strong>Energy</strong> <strong>Matrix</strong>cally zero. There was even a small <strong>in</strong>crease <strong>in</strong> consumption when us<strong>in</strong>g gasol<strong>in</strong>e. For some vehicles that hadbeen available only <strong>in</strong> gasol<strong>in</strong>e versions, <strong>the</strong> <strong>in</strong>troduction <strong>of</strong> <strong>the</strong> first-generation flex-fuel version, <strong>in</strong> general,implied a small <strong>in</strong>crease <strong>in</strong> gasol<strong>in</strong>e consumption, <strong>of</strong> <strong>the</strong> order <strong>of</strong> 1%, while energy consumption wi<strong>the</strong>thanol was approximately 2% higher. With <strong>the</strong> follow<strong>in</strong>g generations <strong>of</strong> flex-fuel technology, employ<strong>in</strong>gcompression ratios closer to ethanol eng<strong>in</strong>es, a signification reduction <strong>in</strong> consumption was observed whenrunn<strong>in</strong>g on ethanol. There were also reductions <strong>in</strong> gasol<strong>in</strong>e consumption, so that <strong>the</strong> energy ga<strong>in</strong> wi<strong>the</strong>thanol rema<strong>in</strong>ed between zero and 2%.2.2.2. Brazilian Vehicle Label<strong>in</strong>g ProgramAs mentioned earlier, ano<strong>the</strong>r important source <strong>of</strong> current data on flex-fuel vehicle consumption is <strong>the</strong> BrazilianVehicle Label<strong>in</strong>g Program xiii , coord<strong>in</strong>ated and regulated by Inmetro (Brazil’s National Institute <strong>of</strong> Metrology,Standardization and Industrial Quality) with voluntary participation <strong>of</strong> <strong>the</strong> ma<strong>in</strong> automakers <strong>in</strong> <strong>the</strong>country. The program, established at <strong>the</strong> end <strong>of</strong> 2008, published urban and highway cycle fuel consumptionresults for vehicle models submitted by <strong>the</strong> automakers, us<strong>in</strong>g Norm ABNT NBR 7024: 2006 “Light Motor Vehicle– Fuel Consumption Measurement – Test Method”. Annex 1 publishes <strong>the</strong> first results <strong>of</strong> <strong>the</strong> Program,while Annex 2 presents complimentary data on vehicle motorization (collected <strong>in</strong> specialized magaz<strong>in</strong>es) andvariation <strong>of</strong> energy consumption between ethanol and gasol<strong>in</strong>e.Look<strong>in</strong>g at <strong>the</strong> <strong>in</strong>formation about vehicle motorization, we can see that automakers have different strategiesregard<strong>in</strong>g flex-fuel vehicles. Chevrolet and Volkswagen are us<strong>in</strong>g high compression ratios, correspond<strong>in</strong>g towhat has come to be called <strong>the</strong> “third generation”, while Fiat and Honda <strong>in</strong> most <strong>of</strong> <strong>the</strong>ir models are ma<strong>in</strong>ta<strong>in</strong><strong>in</strong>g<strong>the</strong> compression ratios <strong>of</strong> gasol<strong>in</strong>e eng<strong>in</strong>es. Exceptions to this pattern are Fiat’s Mille Way Economyand Honda’s Civic which are us<strong>in</strong>g <strong>in</strong>termediate compression ratios. The relation between <strong>the</strong> energy consumption<strong>of</strong> ethanol and gasol<strong>in</strong>e varies significantly between different models. On average, however, itis unfavorable for ethanol by about 2%. The results presented show that, even <strong>in</strong> 1.0 liter models <strong>of</strong> <strong>the</strong>so-called third generation, <strong>in</strong> general, <strong>the</strong>re is no energy advantage for ethanol. It is important to highlightthat, for now, <strong>the</strong> Vehicle Label<strong>in</strong>g Program is voluntary and based on values declared by automakers, basedon regulatory tests <strong>of</strong> models. These data differ significantly (by 5% to 10%) from <strong>the</strong> average results <strong>in</strong> <strong>the</strong>Reports <strong>of</strong> Production Emission Values.Accord<strong>in</strong>g to <strong>the</strong> Vehicle Label<strong>in</strong>g Program, it is acceptable for any vehicle randomly selected from <strong>the</strong>automaker’s stock to present fuel consumption values up to 10% higher than those declared. Should <strong>the</strong>difference be between 10% and 20%, two o<strong>the</strong>r units shall be selected, and if <strong>the</strong> average <strong>of</strong> <strong>the</strong> three differsfrom <strong>the</strong> declared value by less than 10%, <strong>the</strong> result will be considered as acceptable. We should note,<strong>the</strong>refore, that <strong>the</strong> declared values <strong>in</strong>clude not only aspects <strong>of</strong> average consumption distribution, but ma<strong>in</strong>ly<strong>of</strong> <strong>the</strong> standard deviation.It is <strong>in</strong>terest<strong>in</strong>g to compare <strong>the</strong> consumption results <strong>of</strong> 1985 ethanol-only models with 2009 flex-fuel modelsoperat<strong>in</strong>g on ethanol. Despite <strong>the</strong> power/weight ratio hav<strong>in</strong>g <strong>in</strong>creased by 10% and vehicle pollution be<strong>in</strong>g
Ethanol as a Fuel171reduced 20-fold, we can see that for vehicles <strong>of</strong> <strong>the</strong> same weight, consumption was reduced by approximately20% <strong>in</strong> <strong>the</strong> urban cycle and around 5% <strong>in</strong> <strong>the</strong> highway cycle. These facts show that <strong>the</strong>re was an evolution<strong>in</strong> <strong>the</strong> energy efficiency <strong>of</strong> ethanol-powered vehicles <strong>in</strong> <strong>the</strong> past 24 years, but that it was approximately15% less than <strong>the</strong> evolution <strong>of</strong> gasol<strong>in</strong>e vehicles. Also, <strong>the</strong> <strong>in</strong>corporation <strong>of</strong> electronic systems employ<strong>in</strong>gmapped ignition and multipo<strong>in</strong>t fuel <strong>in</strong>jection with mixture control via feedback, have made possible a moresignificant ga<strong>in</strong> <strong>in</strong> <strong>the</strong> urban cycle ra<strong>the</strong>r than <strong>the</strong> highway cycle – remember<strong>in</strong>g that <strong>in</strong> 1985, eng<strong>in</strong>es carworked with lean mixtures dur<strong>in</strong>g <strong>the</strong> highway cycle.2.2.3. Specialized magaz<strong>in</strong>esSeveral specialized vehicle magaz<strong>in</strong>es conduct <strong>the</strong>ir own evaluations <strong>of</strong> fuel consumption <strong>of</strong> modelslaunched by <strong>the</strong> automakers. These publications apply <strong>the</strong>ir own usage cycles and test procedures that to acerta<strong>in</strong> extent represent <strong>the</strong> average use <strong>of</strong> vehicles. Table 4 shows results from Autoesporte xiv magaz<strong>in</strong>e forcommon models, so <strong>of</strong>fer<strong>in</strong>g a comparison with <strong>the</strong> values published by <strong>the</strong> Vehicle Label<strong>in</strong>g Program.Table 4Comparison <strong>of</strong> data: Autoesporte Magaz<strong>in</strong>e and <strong>the</strong> Vehicle Label<strong>in</strong>g ProgramModelKm/LiterUrban Cycle Highway cycle Autoesporte CycleVariation <strong>of</strong> energy consumptionEthanol / Gasol<strong>in</strong>eEthanol Gasol<strong>in</strong>e Ethanol Gasol<strong>in</strong>e Ethanol Gasol<strong>in</strong>e Urban Road AutoesporteCelta 1.0L 10.0 14.5 12.8 17.8 11.2 14.4 0.5% -3.6% -9.8%Mille 1.0Economy10.8 15.7 13.2 19.2 12.7 14.4 0.7% 0.8% -20.5%Palio 1.4L 8.8 13.0 10.8 16.0 10.0 13.2 2.4% 2.7% -7.4%Corsa 1.4L 8.6 13.0 11.7 18.0 11.4 14.6 4.8% 6.6% -10.2%Gol 1.0 9.5 13.9 13.5 19.9 12.6 14.4 1.4% 2.2% -19.9%Gol 1.6 9.1 13.4 13.2 19.3 9.0 12.2 2.0% 1.3% -4.9%Polo 1.6 9.5 13.8 14.9 21.2 8.7 11.3 0.7% -1.4% -8.9%Civic 1.8Automatic8.2 12.0 12.8 18.6 9.1 11.6 1.4% 0.7% -10.6%
172 Ethanol and Bioelectricity <strong>Sugarcane</strong> <strong>in</strong> <strong>the</strong> <strong>Future</strong> <strong>of</strong> <strong>the</strong> <strong>Energy</strong> <strong>Matrix</strong>Annex 1 Results <strong>of</strong> <strong>the</strong> Brazilian Vehicle Label<strong>in</strong>g Program – 2009Marque Model Version Eng<strong>in</strong>eTransmissionNo. <strong>of</strong> gearsManual (M)Automatic (A)Ar Cond.Yes (Y)No (N)Steer<strong>in</strong>gHydraulic (H)Manual (M)Electric (E)Electric-Hydraulic (EH)FuelEthanol (E)Gasol<strong>in</strong>e (G)Flex (F)Ethanol (km/l)Km/LUrban cycle Highway cycleGasol<strong>in</strong>e(km/l)Ethanol (km/l) Gasol<strong>in</strong>e (km/l)2009ClassificationChevrolet Celta 2P Life, Spirit and Super 1.0 L M5 N M F 10.0 14.5 12.8 17.8 CChevrolet Celta 4P Life, Spirit and Super 1.0 L M5 N M F 10.0 14.5 12.8 17.8 CChevrolet Celta 4P Life, Spirit and Super 1.4 L M5 N M F 9.6 14.2 12.8 19.1 CFIAT Mille Way Economy 1.0 Flex 1.0 8V Fire M5 N M F 10.8 15.7 13.2 19.2 AFIAT Palio 2P Novo ELX 1.4 Flex 1.4 8V Fire HP M5 S H F 8.8 13.0 10.8 16.0 EFIAT Palio 4P Novo ELX 1.4 Flex 1.4 8V Fire HP M5 S H F 8.8 13.0 10.8 16.0 EFIAT Palio 2P Novo 1.8R Flex 1.8 8V M5 S H F 7.7 11.2 10.1 15.0 EFIAT Palio 4P Novo 1.8R Flex 1.8 8V M5 S H F 7.7 11.2 10.1 15.0 EKIA Picanto EX3, LX3 1.0 M5 S E G 16.2 21.0 AKIA Picanto EX3, LX3 1.0 A4 S E G 15.8 20.8 AChevrolet Classic Life, Spirit and Super 1.0 L M5 S H F 8.7 13.0 12.0 18.0 DChevrolet Corsa Joy, Maxx and Premium 1.4 L M5 S H F 8.6 13.0 11.7 18.0 DChevrolet Prisma Joy and Maxx 1.0 L M5 N M F 9.7 14.4 12.8 18.4 BChevrolet Prisma Joy and Maxx 1.4 L M5 S H F 9.0 13.4 12.4 18.6 CFIAT Idea ELX 1.4 Flex 1.4 8V Fire M5 S H F 8.1 11.8 10.8 15.7 EFIAT Punto 1.4 Flex 1.4 8V Fire HP M5 N H F 8.9 13.2 11.2 17.0 CFIAT Siena Novo HLX 1.8 Flex 1.8 8V M5 S H F 7.8 11.7 10.3 15.6 EHONDA Fit LX, LXL 1.4L – 16V M5 S E F 9.8 14.8 12.3 18.6 AHONDA Fit LX, LXL 1.4L – 16V A5 S E F 9.2 14.0 11.8 18.2 BHONDA Fit EX, EXL 1.5L – 16V M5 S E F 9.2 13.7 11.6 17.3 CHONDA Fit EX, EXL 1.5L – 16V A5 S E F 9.0 13.5 12.0 17.6 CVOLKSWAGEN Gol 1.0L 1.0 M5 S H F 9.5 13.9 13.5 19.9 AVOLKSWAGEN Gol 1.6L, 1.6 power 1.6 M5 S H F 9.1 13.4 13.2 19.3 BVOLKSWAGEN Polo BlueMotion 1.6 M5 S E-H F 9.5 13.8 14.9 21.2 AHONDA Civic LXS 1.8L – 16V M5 S H F 8.3 12.3 11.8 17.5HONDA Civic LXS, EXS 1.8L – 16V A5 S H F 8.2 12.0 12.8 18.6VOLKSWAGEN Voyage 1.0L 1.0 M5 S H F 9.5 13.9 13.5 19.9VOLKSWAGEN Voyage 1.6L, 1.6 Trend, 1.6 Comf. 1.6 M5 S H F 9.1 13.4 13.2 19.3FIAT L<strong>in</strong>ea T-JET 1.4 16V TURBO 1.4 16V T-JET M5 S H G 11.5 14.3KIA Carnival EX2, LX2 3.8 A5 S H G 7.8 10.6FIAT Strada Nova Trekk<strong>in</strong>g 1.4 Flex 1.4 8V Fire HP M5 N H F 8.9 13.2 10.5 15.7InmetroClassificationArea (m 2 )< 6.56.5 to 7.07.0 to 8.0> 8.0
Ethanol as a Fuel173Annex 2 Results <strong>of</strong> <strong>the</strong> Brazilian Vehicle Label<strong>in</strong>g Program – 2009Marque ModelCyl<strong>in</strong>dersDiameterPistonsCourse CompressionrateMaximumpowerEthanol /Gasol<strong>in</strong>eRotation atmaximumpowerPistonvelocity atmaximumpowerMaximumtorqueethanol /gasol<strong>in</strong>eRotation atmaximumtorqueVehicleweightFuel tankMaximumpowerPower /weight<strong>Energy</strong> consumption <strong>of</strong> AEHC/ Type C gasol<strong>in</strong>e(mm) (mm) (CV) (rpm) (m/s) (m.kgf) (rpm) (kg) (litro) (CV) (kW/ton) Urban cycle Highway cycleChevrolet Celta 2P 71,1 62,9 12,6 78/77 6400 13,4 9.7/9.5 5200 860 54 78,0 66,7 0,5% -3,6%Chevrolet Celta 4P 71,1 62,9 12,6 78/77 6400 13,4 9.7/9.5 5200 890 54 78,0 64,5 0,5% -3,6%Chevrolet Celta 4P 77,6 73,4 12,4 105/99 6000 14,7 13.4/13.2 2800 890 54 105,0 86,8 2,5% 3,4%Fiat Mille Way Econ. 70 64,5 11,6 65/66 6000 12,9 9.2/9.1 2500 830 50 66,0 58,5 0,7% 0,8%Fiat Palio 2P ELX 72 84 10,35 86/85 5750 16,1 12.5/12.4 3500 981 48 86,0 64,5 2,4% 2,7%Fiat Palio 4P ELX 72 84 10,35 86/85 5750 16,1 12.5/12.4 3500 981 48 86,0 64,5 2,4% 2,7%Fiat Palio 2P 1.8R 82 85 10,5 114/112 5500 15,6 18.5/17.8 2800 1025 48 114,0 81,8 0,8% 2,9%Fiat Palio 4P 1.8R 82 85 10,5 114/112 5500 15,6 18.5/17.8 2800 1025 48 114,0 81,8 0,8% 2,9%Kia Picanto 67 77 10,1 64 5500 14,1 9,4 2800 840 35 64,0 56,1Kia Picanto 67 77 10,1 64 5500 14,1 9,4 2800 840 35 64,0 56,1Chevrolet Classic 71,1 62,9 12,6 78/77 6400 13,4 9.7/9.5 5200 920 54 78,0 62,4 3,6% 3,9%Chevrolet Corsa 77,6 73,4 12,4 105/99 6000 14,7 13.4/13.2 2800 1045 44 105,0 73,9 4,8% 6,6%Chevrolet Prisma 71,1 62,9 12,6 78/77 6400 13,4 9.7/9.5 5200 921 54 78,0 62,3 2,9% -0,4%Chevrolet Prisma 77,6 73,4 12,4 105/99 6000 14,7 13.4/13.2 2800 921 54 105,0 83,9 3,2% 3,9%Fiat Idea 72 84 10,35 86/85 5750 16,1 12.5/12.4 3500 1180 48 86,0 53,6 1,0% 0,7%Fiat Punto 72 84 10,35 86/85 5750 16,1 12.5/12.4 3500 1090 60 86,0 58,1 2,8% 5,2%Fiat Siena 82 85 10,5 114/112 5500 15,6 18.5/17.8 2800 1080 48 114,0 77,7 3,9% 5,0%Honda Fit 73 80 10,5 101/100 6000 16,0 13/13 4800 1116 42 101,0 66,6 4,7% 4,8%Honda Fit 73 80 10,5 101/100 6000 16,0 13/13 4800 1116 42 101,0 66,6 5,5% 6,9%Honda Fit 73 89,4 10,4 116/115 6000 17,9 14.8/14.8 4800 1141 42 116,0 74,8 3,2% 3,4%Honda Fit 73 89,4 10,4 116/115 6000 17,9 14.8/14.8 4800 1141 42 116,0 74,8 3,9% 1,6%Volkswagen Gol 67,1 70,6 13 76/72 6250 14,7 10.6/9.7 3850 934 55 76,0 59,9 1,4% 2,2%Volkswagen Gol 76,5 86,9 12,1 104/101 5250 15,2 15.6/15.4 2500 944 55 104,0 81,1 2,0% 1,3%Volkswagen Polo 76,5 86,9 12,1 104/101 5250 15,2 15.6/15.4 2500 1079 45 104,0 70,9 0,7% -1,4%Honda Civic 81 87,3 11,5 140/138 6200 18,0 17.7/17.5 4300/5000 1260 50 140,0 81,8 2,7% 2,8%Honda Civic 81 87,3 11,5 140/138 6200 18,0 17.7/17.5 4300/5000 1260 50 140,0 81,8 1,4% 0,7%Volkswagen Voyage 67,1 70,6 13 76/72 6250 14,7 10.6/9.7 3850 970 55 76,0 57,7 1,4% 2,2%Volkswagen Voyage 76,5 86,9 12,1 104/101 5250 15,2 15.6/15.4 2500 1021 55 104,0 75,0 2,0% 1,3%Fiat L<strong>in</strong>ea 72 84 9,8 152 5500 15,4 21,1 2250/4500 1305 60 152,0 85,7Kia Carnival 96 87 10,4 242 6000 17,4 35 3500 80 242,0Fiat Strada 72 84 10,35 86/85 5750 16,1 12.5/12.4 3500 1051 58 86,0 60,2 2,8% 3,6%
174 Ethanol and Bioelectricity <strong>Sugarcane</strong> <strong>in</strong> <strong>the</strong> <strong>Future</strong> <strong>of</strong> <strong>the</strong> <strong>Energy</strong> <strong>Matrix</strong>Although consumption results published by Autoesporte show a certa<strong>in</strong> correlation with <strong>the</strong> results from <strong>the</strong>Vehicle Label<strong>in</strong>g Program, <strong>the</strong>re is a significant discrepancy <strong>in</strong> <strong>the</strong> differences <strong>in</strong> energy consumption betweenethanol and gasol<strong>in</strong>e <strong>in</strong> correspond<strong>in</strong>g cycles. While <strong>the</strong> cycles <strong>of</strong> <strong>the</strong> standardized and laboratory tests revealenergy consumption for ethanol that was on average 1.5% higher than gasol<strong>in</strong>e, <strong>in</strong> <strong>the</strong> tests conducted by <strong>the</strong>specialized magaz<strong>in</strong>e, <strong>in</strong> conditions more representative <strong>of</strong> normal use it was 11% lower than gasol<strong>in</strong>e.It is worth not<strong>in</strong>g that <strong>the</strong> difference <strong>in</strong> energy density between <strong>the</strong> Type C gasol<strong>in</strong>e sold <strong>in</strong> fill<strong>in</strong>g stationsand that used <strong>in</strong> standardized consumption and emissions tests was taken <strong>in</strong>to account <strong>in</strong> <strong>the</strong> calculation <strong>of</strong>energy consumption. The average reduction <strong>in</strong> energy consumption <strong>of</strong> ethanol <strong>in</strong> relation to gasol<strong>in</strong>e was7.5% if we consider <strong>the</strong> results <strong>of</strong> all flex-fuel vehicle models tested and published by <strong>the</strong> magaz<strong>in</strong>e, <strong>in</strong>clud<strong>in</strong>gfirst generation vehicles. Similarly reduced results are obta<strong>in</strong>ed if we analyze data from <strong>the</strong> Folha de S.Paulo newspaper or <strong>the</strong> Carsale.uol website, both <strong>of</strong> which are based on street and road tests conductedby <strong>the</strong> Mauá Institute <strong>of</strong> Technology. This suggests that even though <strong>the</strong> field tests may lack <strong>the</strong> rigor <strong>of</strong>ABNT NBR: 7024, <strong>the</strong>y po<strong>in</strong>t to some lack <strong>of</strong> representativeness <strong>in</strong> <strong>the</strong> standardized test<strong>in</strong>g. Two possibleexplanations for <strong>the</strong>se differences between ethanol and gasol<strong>in</strong>e energy consumption <strong>in</strong> <strong>the</strong> cycles are: <strong>the</strong>difference <strong>in</strong> <strong>the</strong> length <strong>of</strong> <strong>the</strong> cycles, and consequently <strong>the</strong> different weight <strong>of</strong> cold starts and cold-phaseoperation; and <strong>the</strong> non-use, dur<strong>in</strong>g <strong>the</strong> normalized cycle, <strong>of</strong> <strong>the</strong> greater torque <strong>of</strong> eng<strong>in</strong>es operat<strong>in</strong>g wi<strong>the</strong>thanol to reduce gear change rotations.Summariz<strong>in</strong>g all <strong>the</strong> <strong>of</strong>ficial results for vehicle consumption s<strong>in</strong>ce <strong>the</strong> mid-1980s, based on exist<strong>in</strong>g standardization,we can say that ethanol vehicles have undergone significant development <strong>in</strong> <strong>the</strong> urban cycle (20%)and less significant <strong>in</strong> <strong>the</strong> highway cycle (5%), while ga<strong>in</strong><strong>in</strong>g a 10% <strong>in</strong>crease <strong>in</strong> <strong>the</strong> power to weight ratio <strong>of</strong><strong>the</strong> vehicle and an enormous reduction <strong>in</strong> pollutant emission per kilometer. This reduction is estimated at:CO – 36 times; HC – 15 times; NOx – 17 times; and RCHO – 11 times. Never<strong>the</strong>less, <strong>the</strong>se ga<strong>in</strong>s were considerablylower than those obta<strong>in</strong>ed by gasol<strong>in</strong>e-powered vehicles, which started <strong>the</strong> period with high levels<strong>of</strong> consumption and pollutant emission.In <strong>the</strong> past 24 years, <strong>the</strong>refore, <strong>the</strong> orig<strong>in</strong>al advantages <strong>of</strong> ethanol eng<strong>in</strong>es <strong>in</strong> 1985 – energy efficiency 15%greater and pollutant emission 30% lower than gasol<strong>in</strong>e eng<strong>in</strong>es – were annulled or became disadvantages.<strong>Energy</strong> consumption <strong>of</strong> new ethanol vehicles is on average 2% higher than for correspond<strong>in</strong>g gasol<strong>in</strong>e models.Besides that, <strong>the</strong> average emission <strong>of</strong> CO, HC and NOx pollutants after <strong>the</strong> catalyzer <strong>in</strong> new vehicles, notyet run <strong>in</strong>, is approximately 10% greater with ethanol than gasol<strong>in</strong>e, while aldehyde emissions are 4.6 timesgreater than with gasol<strong>in</strong>e. It should be noted that results for CO, HC and NOx emissions published by Anfaveafor 2009 models, tak<strong>in</strong>g <strong>in</strong>to account <strong>the</strong> <strong>of</strong>ficial results <strong>of</strong> test<strong>in</strong>g <strong>of</strong> models and <strong>the</strong> effect <strong>of</strong> 80,000km durability for catalyzers, are <strong>in</strong> general favorable towards ethanol.The practical results <strong>of</strong> vehicle consumption, as tested and published by specialized automobile magaz<strong>in</strong>es,po<strong>in</strong>t to significantly greater energy efficiency when us<strong>in</strong>g ethanol ra<strong>the</strong>r than gasol<strong>in</strong>e. This suggests <strong>the</strong> needto ask if <strong>the</strong> standardized test is <strong>in</strong>deed representative <strong>of</strong> “average use” <strong>in</strong> Brazil and what should be done tomake it so. One aspect that could be <strong>in</strong>corporated, with<strong>in</strong> <strong>the</strong> context <strong>of</strong> ABNT NBR: 7024, would be permissionfor gear shift rotations to be different <strong>in</strong> ethanol and gasol<strong>in</strong>e operations with <strong>the</strong> same flex-fuel vehicle.
Ethanol as a Fuel1752.3. <strong>Future</strong> possibilitiesConceptually speak<strong>in</strong>g, <strong>the</strong> limit to development <strong>of</strong> a flex-fuel eng<strong>in</strong>e is <strong>the</strong> one that guarantees that foreach specific blend with which <strong>the</strong> eng<strong>in</strong>e can operate, <strong>the</strong>re will be <strong>the</strong> same performance, consumption,pollutant emission and durability that would be achieved with a hypo<strong>the</strong>tical eng<strong>in</strong>e that had beenoptimized for each specific blend. However, adopt<strong>in</strong>g a more pragmatic view, <strong>the</strong> evolution <strong>of</strong> flex-fueltechnology is determ<strong>in</strong>ed by technical and economic considerations that depend on how much consumersare will<strong>in</strong>g to pay when purchas<strong>in</strong>g a certa<strong>in</strong> model, to obta<strong>in</strong> <strong>the</strong> benefits <strong>of</strong> fuel sav<strong>in</strong>gs, difference <strong>in</strong> performanceor pollutant emission dur<strong>in</strong>g <strong>the</strong> useful life <strong>of</strong> <strong>the</strong> vehicle. In Brazil, models aimed at <strong>the</strong> bottomend <strong>of</strong> <strong>the</strong> market enjoy production volumes that can support <strong>in</strong>tensive eng<strong>in</strong>eer<strong>in</strong>g development, but <strong>the</strong>yare also <strong>the</strong> market segment where market pressure imposes restrictions on any price <strong>in</strong>crease that wouldbe caused by <strong>the</strong> addition <strong>of</strong> parts or components. Below, we discuss technologies that, if used, wouldpromote <strong>the</strong> evolution <strong>of</strong> flex-fuel vehicles towards a conceptual “optimum”, but without consider<strong>in</strong>g <strong>the</strong>economic feasibility <strong>of</strong> <strong>the</strong>ir implementation.Given that <strong>the</strong> development <strong>of</strong> <strong>the</strong> basic eng<strong>in</strong>e designs generally takes place outside <strong>of</strong> Brazil, and is basedon gasol<strong>in</strong>e eng<strong>in</strong>es, and <strong>the</strong>se are <strong>the</strong>n adapted <strong>in</strong>to flex-fuel eng<strong>in</strong>es, <strong>the</strong> follow<strong>in</strong>g discussions start from<strong>the</strong> perspective <strong>of</strong> mak<strong>in</strong>g flex-fuel vehicles more suitable for ethanol.The factor that most complicates <strong>the</strong> use <strong>of</strong> ethanol <strong>in</strong> spark ignition eng<strong>in</strong>es, and which is <strong>in</strong> most urgentneed <strong>of</strong> improvement, is <strong>the</strong> question <strong>of</strong> cold start and cold operation. The limited volatility <strong>of</strong> ethanol atlow temperatures makes it difficult to comply with emission limits stipulated <strong>in</strong> <strong>the</strong> more recent phases <strong>of</strong>Proconve, while at <strong>the</strong> same time reduc<strong>in</strong>g ethanol mileage when compared to gasol<strong>in</strong>e. We have a step <strong>in</strong><strong>the</strong> right direction with <strong>the</strong> solution <strong>of</strong> electrically heat<strong>in</strong>g <strong>the</strong> fuel and improv<strong>in</strong>g its vaporization by us<strong>in</strong>g<strong>in</strong>jectors that have holes <strong>of</strong> a smaller area (a greater number <strong>of</strong> holes or an <strong>in</strong>crease <strong>in</strong> <strong>in</strong>jector pressure) toavoid <strong>the</strong> <strong>in</strong>jection <strong>of</strong> gasol<strong>in</strong>e dur<strong>in</strong>g cold start. This system was <strong>in</strong>troduced by Volkswagen <strong>in</strong> its fourthgeneration flex-fuel vehicles, with <strong>the</strong> Polo E-Flex. Innovations expected for <strong>the</strong> next generation <strong>of</strong> flex-fuelvehicles <strong>in</strong>clude <strong>the</strong> use <strong>of</strong> oxygen sensors that start respond<strong>in</strong>g at lower temperatures, as well as catalyticconverters <strong>in</strong>stalled closer to <strong>the</strong> exhaust valves so that <strong>the</strong>y heat up faster. O<strong>the</strong>r <strong>in</strong>novative technologicalsolutions may appear to reduce <strong>the</strong> heat<strong>in</strong>g time <strong>of</strong> <strong>the</strong> combustion chamber and to fur<strong>the</strong>r speed up <strong>the</strong>start <strong>of</strong> operation <strong>of</strong> <strong>the</strong> catalyzer.Ano<strong>the</strong>r important characteristic that differentiates ethanol from gasol<strong>in</strong>e, and that should be better exploited<strong>in</strong> flex-fuel vehicles, is its greater resistance to auto-combustion. This higher octane rat<strong>in</strong>g makes it possibleto <strong>in</strong>crease <strong>the</strong> eng<strong>in</strong>e compression ratio and obta<strong>in</strong> greater <strong>the</strong>rmal output. The use <strong>of</strong> systems that allowfor vary<strong>in</strong>g <strong>the</strong> open<strong>in</strong>g and clos<strong>in</strong>g angles <strong>of</strong> <strong>the</strong> <strong>in</strong>take valves would make it possible to vary <strong>the</strong> eng<strong>in</strong>e’seffective compression ratio, so mak<strong>in</strong>g better use <strong>of</strong> <strong>the</strong> auto-combustion limit <strong>of</strong> <strong>the</strong> specific fuel be<strong>in</strong>g used.The use <strong>of</strong> smaller eng<strong>in</strong>es burn<strong>in</strong>g more fuel <strong>in</strong> applications typically handled by larger eng<strong>in</strong>es could be anexcellent way to take advantage <strong>of</strong> ethanol’s high-octane rat<strong>in</strong>g and latent heat <strong>of</strong> vaporization. Direct <strong>in</strong>jection<strong>of</strong> ethanol <strong>in</strong>to <strong>the</strong> combustion chamber, besides facilitat<strong>in</strong>g cold start as mentioned earlier, would allowus to make <strong>in</strong>telligent use <strong>of</strong> ethanol’s resistance to auto-combustion. This could be simply via <strong>the</strong> <strong>in</strong>jector <strong>in</strong>
176 Ethanol and Bioelectricity <strong>Sugarcane</strong> <strong>in</strong> <strong>the</strong> <strong>Future</strong> <strong>of</strong> <strong>the</strong> <strong>Energy</strong> <strong>Matrix</strong><strong>the</strong> combustion chamber, or comb<strong>in</strong>ed with an <strong>in</strong>jector at <strong>the</strong> entry port <strong>of</strong> each cyl<strong>in</strong>der (Cohn et al., 2008).Specialists estimate that <strong>the</strong> adoption <strong>of</strong> this concept could br<strong>in</strong>g consumption sav<strong>in</strong>gs <strong>of</strong> 20% to 30%. The<strong>in</strong>troduction <strong>of</strong> <strong>in</strong>take manifolds with heat<strong>in</strong>g controlled accord<strong>in</strong>g to <strong>the</strong> proportion <strong>of</strong> ethanol <strong>in</strong> <strong>the</strong> fuel,toge<strong>the</strong>r with control <strong>of</strong> <strong>the</strong> water temperature <strong>in</strong> <strong>the</strong> eng<strong>in</strong>e, are likely to become more common <strong>in</strong> futuregenerations <strong>of</strong> flex-fuel vehicles as a way to make better use <strong>of</strong> ethanol’s vaporization characteristics.Ano<strong>the</strong>r aspect that requires attention <strong>in</strong> <strong>the</strong> search to reduce fuel consumption <strong>in</strong> flex-fuel eng<strong>in</strong>es is <strong>the</strong>use <strong>of</strong> more dilute mixtures <strong>in</strong> <strong>the</strong> combustion chamber through <strong>the</strong> use <strong>of</strong> exhaust gas recirculation (EGR)valves. This will make better use <strong>of</strong> ethanol’s flame-propagation properties, without alter<strong>in</strong>g <strong>the</strong> stoichiometricmixture necessary for <strong>the</strong> proper function<strong>in</strong>g <strong>of</strong> <strong>the</strong> three-way catalyzers.3. Flex-fuel motorcycles3.1 Technology and conceptsThe two-wheel market has grown rapidly <strong>in</strong> Brazil, and is dom<strong>in</strong>ated by smaller motorcycles (100 cc to 250 cc)runn<strong>in</strong>g on Type C gasol<strong>in</strong>e. Data from <strong>the</strong> National Traffic Department (Denatran) and <strong>the</strong> Brazilian Association<strong>of</strong> Manufacturers <strong>of</strong> Motorcycles, Mopeds, Scooters, Bicycles and Similar Vehicles (Abraciclo), <strong>in</strong>dicatesthat 1,925,514 new motorcycles (<strong>in</strong>clud<strong>in</strong>g scooters and mopeds) were registered <strong>in</strong> <strong>the</strong> country <strong>in</strong> 2008. Thiswas an <strong>in</strong>crease <strong>of</strong> 12.7% over 2007 and took <strong>the</strong> national two-wheel fleet to 13,084,148. Assum<strong>in</strong>g averageconsumption <strong>of</strong> 27 km/l, annual average mileage <strong>of</strong> 9,000 km and a 25% blend <strong>of</strong> anhydrous ethanol <strong>in</strong> TypeC gasol<strong>in</strong>e, this fleet <strong>the</strong>refore consumed approximately 1.1 billion liters <strong>of</strong> ethanol <strong>in</strong> 2008. However, this scenari<strong>of</strong>or ethanol consumption could change rapidly with <strong>the</strong> <strong>in</strong>troduction <strong>of</strong> flex-fuel eng<strong>in</strong>es, as happened <strong>in</strong><strong>the</strong> four-wheel segment. Six years after VW’s Gol Total Flex automobile was launched, Honda <strong>in</strong> March 2009launched <strong>the</strong> CG 150 Titan Mix, a flex-fuel version <strong>of</strong> <strong>the</strong>ir most popular motorbike, <strong>the</strong> CG 150 Titan, whichsold 442,000 units <strong>in</strong> 2008 (23% <strong>of</strong> total two-wheel sales <strong>in</strong> <strong>the</strong> country).The Titan Mix version captured 12.3% <strong>of</strong> total national two-wheel sales <strong>in</strong> its first four months, with 66,700units sold from March to June 2009. The success <strong>of</strong> <strong>the</strong> world’s first flex-fuel motorcycle was to be expected,because it <strong>of</strong>fers <strong>the</strong> rider freedom to choose which fuel – gasol<strong>in</strong>e or ethanol – he uses accord<strong>in</strong>g to his ownrequirements, with economic considerations paramount. Data from field research conducted by UNICA <strong>in</strong> 2008with over 500 motorcycle users showed that approximately 15% <strong>of</strong> <strong>the</strong>m had already used or were currentlyus<strong>in</strong>g just ethanol <strong>in</strong> <strong>the</strong>ir vehicles. The group surveyed comprised ma<strong>in</strong>ly motorcycle couriers and people regularlyus<strong>in</strong>g motorcycles for <strong>the</strong>ir daily transportation. This group proved to be very sensitive to fuel price, a factthat was lead<strong>in</strong>g a significant number to make amateur conversions so that <strong>the</strong>y could run just on ethanol.Small motorbike eng<strong>in</strong>es are normally very simple – s<strong>in</strong>gle-cyl<strong>in</strong>der, four-stroke, air-cooled, with valve commandon <strong>the</strong> cyl<strong>in</strong>der head with <strong>the</strong> rocker arm and fuel supplied through a basic carburetor. This favorsamateur conversions for ethanol use, effected by chang<strong>in</strong>g <strong>the</strong> orig<strong>in</strong>al carburetor jet for one with a largercaliber, so allow<strong>in</strong>g higher volumes <strong>of</strong> ethanol <strong>in</strong> <strong>the</strong> eng<strong>in</strong>e, and adjustment to tick-over and air <strong>in</strong>take set-
Ethanol as a Fuel177t<strong>in</strong>gs. However, <strong>the</strong>se conversions frequently result <strong>in</strong> combustion failures, loss <strong>of</strong> performance, <strong>in</strong>efficientfuel use, <strong>in</strong>creased pollutant emissions and premature wear <strong>of</strong> <strong>the</strong> carburetor and o<strong>the</strong>r components thatare not appropriate for <strong>the</strong> use <strong>of</strong> hydrous ethanol.The flex-fuel motorcycle responds to market demands and avoids <strong>the</strong> need for this type <strong>of</strong> conversion, <strong>of</strong>fer<strong>in</strong>gsatisfactory usage results. It represents a technological advance on some <strong>of</strong> <strong>the</strong> solutions developed<strong>in</strong> 1982 for <strong>the</strong> ethanol-powered CG 125 motorbike that was produced <strong>in</strong> Brazil. The tank’s <strong>in</strong>ternal nozzlehas a flame-prevention screen to avoid fire spread<strong>in</strong>g from outside to <strong>in</strong>side <strong>the</strong> tank; <strong>the</strong> secondary fuelfilter has a higher retention capacity and so avoids rapid clogg<strong>in</strong>g <strong>of</strong> <strong>the</strong> pump; <strong>the</strong> start-up system wasadjusted to meet <strong>the</strong> needs <strong>of</strong> cold start us<strong>in</strong>g ethanol; and <strong>the</strong> <strong>in</strong>ternal treatment <strong>of</strong> <strong>the</strong> tank, fuel pumpand fuel gauge potentiometer were changed to be compatible with ethanol use.Unlike its ethanol predecessor, which had a secondary gasol<strong>in</strong>e tank for cold start at any temperature, <strong>the</strong>flex-fuel version requires that <strong>the</strong> motorcycle tank (16.1 liters) conta<strong>in</strong> about 20% <strong>of</strong> gasol<strong>in</strong>e to ensure coldstart at ambient temperatures below 15o C. The motorcycle has an alert lamp mechanism on its dashboardto help <strong>the</strong> rider with respect to cold start.While <strong>the</strong> Titan Mix flex-fuel system is conceptually similar to that adopted <strong>in</strong> four-wheel flex-fuel vehicles,it is simpler, coord<strong>in</strong>ated by an eng<strong>in</strong>e electronic control module (ECM). This is connected to sensors thatmonitor eng<strong>in</strong>e performance and convey <strong>in</strong>formation on <strong>the</strong> fuel blend be<strong>in</strong>g used. The sensors register <strong>the</strong>pressure <strong>in</strong> <strong>the</strong> <strong>in</strong>take manifold, <strong>the</strong> position <strong>of</strong> <strong>the</strong> throttle, <strong>the</strong> <strong>in</strong>take air temperature, <strong>the</strong> temperature <strong>of</strong><strong>the</strong> lubricat<strong>in</strong>g oil and <strong>the</strong> oxygen content <strong>in</strong> <strong>the</strong> eng<strong>in</strong>e exhaust gas. Based on <strong>the</strong> data provided by <strong>the</strong>sesensors, <strong>the</strong> ECM selects one <strong>of</strong> <strong>the</strong> follow<strong>in</strong>g operat<strong>in</strong>g programs:Program 1: Tank fueled with gasol<strong>in</strong>e;Program 2: Tank conta<strong>in</strong>s gasol<strong>in</strong>e and ethanol <strong>in</strong> equal proportions;Program 3: Tank conta<strong>in</strong>s a greater quantity <strong>of</strong> ethanol;Program 4: Tank only fueled with ethanol.Table 5Pollutant emission <strong>of</strong> <strong>the</strong> CG 150 Titan Mix flex-fuel motorcyclePollutantPromot 3 emissionlimit (g/km)Emissions (g/km)Difference <strong>in</strong> emissions and limits<strong>of</strong> Promot 3 (%)Gasol<strong>in</strong>e Ethanol Gasol<strong>in</strong>e EthanolCO 2.0 0.658 0.444 -67.1% -77.8%HC 0.80 0.146 0.143 -81.8% -82.1%NOx 0.15 0.068 0.102 -54.7% -32.0%
178 Ethanol and Bioelectricity <strong>Sugarcane</strong> <strong>in</strong> <strong>the</strong> <strong>Future</strong> <strong>of</strong> <strong>the</strong> <strong>Energy</strong> <strong>Matrix</strong>The oxygen sensor is located <strong>in</strong> <strong>the</strong> eng<strong>in</strong>e exhaust manifold, and is <strong>the</strong> ma<strong>in</strong> item responsible for <strong>the</strong> operation<strong>of</strong> this system. Based on <strong>the</strong> selected program, <strong>the</strong> ECM transmits this <strong>in</strong>formation to <strong>the</strong> <strong>in</strong>jectornozzle, which has eight holes, while <strong>the</strong> conventional gasol<strong>in</strong>e version has six. This supplies <strong>the</strong> appropriatequantity <strong>of</strong> fuel for combustion and regulates <strong>the</strong> ignition tim<strong>in</strong>g – advanc<strong>in</strong>g it <strong>in</strong> <strong>the</strong> case <strong>of</strong> ethanol andretard<strong>in</strong>g it for gasol<strong>in</strong>e.The CG 150 Titan flex-fuel motorbike is equipped with a catalytic converter to reduce pollutant gas emissions.As can be seen <strong>in</strong> Table 5, it easily meets emission limits established by <strong>the</strong> third phase <strong>of</strong> Brazil’sPromot (Air Pollution Control Program for Motorcycles and Similar Vehicles) which is equivalent to <strong>the</strong> currentphase <strong>of</strong> European legislation.Given that Promot does not establish limits for aldehyde emissions, this pollutant is still not regulated. However,extrapolat<strong>in</strong>g from observations <strong>of</strong> four-wheel flex-fuel vehicles, equipped with electronic <strong>in</strong>jectionand catalytic converters, aldehyde emissions must be low: 0.03 g/km or less.Adopt<strong>in</strong>g <strong>the</strong> strategy <strong>of</strong> not alter<strong>in</strong>g <strong>the</strong> 9.5:1 compression ratio used <strong>in</strong> <strong>the</strong> gasol<strong>in</strong>e eng<strong>in</strong>e, <strong>the</strong> flex-fuelversion <strong>of</strong>fers slight <strong>in</strong>crease <strong>in</strong> power and torque when us<strong>in</strong>g ethanol. While <strong>the</strong> motorcycle develops 1.32kgf.m <strong>of</strong> torque at 6,500 RPM and 14.2 CV <strong>of</strong> power at 8,500 RPM when runn<strong>in</strong>g on gasol<strong>in</strong>e, <strong>the</strong>se values <strong>in</strong>creaseto 1.45 kgf.m and 14.3 CV, respectively, when us<strong>in</strong>g ethanol. With respect to fuel consumption, Hondaand specialized magaz<strong>in</strong>es <strong>in</strong>form that with ethanol it is possible to reach 27 to 29 km/liter (3.7 to 3.4 litersper 100 km), while gasol<strong>in</strong>e consumption varies from 35 to 39 km/l (2.9 to 2.6 1/100 km). This correspondsto consumption approximately 30% greater with ethanol, which implies an energy bonus <strong>of</strong> around 7%.In addition to Honda, system makers such as Delphi and Magneti Marelli have announced <strong>the</strong> development<strong>of</strong> flex-fuel technology for motorcycles. Consider<strong>in</strong>g <strong>the</strong> good market response to Honda’s <strong>in</strong>itiative,it is likely that flex-fuel technology can enjoy <strong>the</strong> same success <strong>in</strong> <strong>the</strong> two-wheel market as it has withfour-wheeled vehicles. Given that we are talk<strong>in</strong>g about a low-cost vehicle and an <strong>in</strong>novative concept, <strong>the</strong>nbesides supply<strong>in</strong>g <strong>the</strong> domestic market this could represent an <strong>in</strong>terest<strong>in</strong>g opportunity for export to severalcountries, with potential to encourage ethanol consumption <strong>in</strong> o<strong>the</strong>r markets.3.2. Evolution <strong>of</strong> <strong>the</strong> applicationAs <strong>in</strong> all cases where technological <strong>in</strong>novations are adopted <strong>in</strong> a new application, <strong>the</strong>re has to be a learn<strong>in</strong>gcurve before <strong>the</strong> technology reaches maturity. In <strong>the</strong> case <strong>of</strong> flex-fuel motorcycles it is still too early to saywhat directions <strong>the</strong> technology might take. However, it is clear that some <strong>of</strong> <strong>the</strong> <strong>in</strong>novations adopted <strong>in</strong>four-wheel vehicles could also be applicable to motorcycles. Examples <strong>of</strong> <strong>in</strong>cremental improvements thatcould be applied quickly <strong>in</strong>clude <strong>in</strong>creas<strong>in</strong>g <strong>the</strong> compression ratio and ref<strong>in</strong><strong>in</strong>g eng<strong>in</strong>e operation maps tooptimize fuel <strong>in</strong>jection and ignition.
Ethanol as a Fuel1794. Diesel substitution4.1 Initial considerationsWhen it comes to <strong>the</strong> use <strong>of</strong> petroleum derivatives <strong>in</strong> <strong>in</strong>ternal combustion eng<strong>in</strong>es, <strong>the</strong> competitive advantages<strong>of</strong> compression ignition (Diesel Cycle) eng<strong>in</strong>es for heavy-duty applications and operations requir<strong>in</strong>ggreater power are well established; as are <strong>the</strong> advantages <strong>of</strong> spark ignition (Otto Cycle) eng<strong>in</strong>es <strong>in</strong> applicationsrequir<strong>in</strong>g lower power and less <strong>in</strong>tensive use. Given that <strong>the</strong> cost <strong>of</strong> diesel and gasol<strong>in</strong>e per unit <strong>of</strong>energy are about <strong>the</strong> same, <strong>the</strong>se differences are due ma<strong>in</strong>ly to <strong>the</strong> greater energy efficiency <strong>of</strong> diesel eng<strong>in</strong>es(about 20% compared to Otto Cycle eng<strong>in</strong>es for vehicular applications), set aga<strong>in</strong>st <strong>the</strong> lower manufactur<strong>in</strong>gcosts <strong>of</strong> Otto Cycle eng<strong>in</strong>es for <strong>the</strong> same range <strong>of</strong> power.With respect to <strong>the</strong> emission <strong>of</strong> local air pollutants, while a diesel eng<strong>in</strong>e emits a lower mass <strong>of</strong> pollutantsper unit <strong>of</strong> work done, <strong>the</strong> systems for post-combustion treatment <strong>of</strong> exhaust gases make applications withspark ignition eng<strong>in</strong>es less pollut<strong>in</strong>g per unit <strong>of</strong> work done than those with compression ignition eng<strong>in</strong>es. Inparticular, much <strong>of</strong> <strong>the</strong> pollution <strong>in</strong> large urban centers is attributed to <strong>the</strong> emission <strong>of</strong> nitrogen oxides andparticulate matter from vehicles with diesel eng<strong>in</strong>es. In contrast, <strong>the</strong> emission <strong>of</strong> greenhouse gases per unit<strong>of</strong> work done is lower for compression ignition eng<strong>in</strong>es than for spark ignition eng<strong>in</strong>es, due to <strong>the</strong> greaterefficiency <strong>of</strong> <strong>the</strong> former when both are runn<strong>in</strong>g on <strong>the</strong> petroleum derivatives for which <strong>the</strong>y were designed.On <strong>the</strong> o<strong>the</strong>r hand, as already mentioned, <strong>the</strong> physical and chemical properties <strong>of</strong> ethanol, particularly <strong>the</strong>volatility and greater resistance to auto-combustion, make it an ideal fuel for spark ignition eng<strong>in</strong>es, <strong>in</strong> <strong>the</strong>same way that vegetable oils and <strong>the</strong>ir derivatives such as biodiesel are more suitable for compression ignitioneng<strong>in</strong>es. It is worth not<strong>in</strong>g that when Otto Cycle eng<strong>in</strong>es are optimized for ethanol, <strong>the</strong>ir energy efficiencyis higher than when optimized for gasol<strong>in</strong>e. In <strong>the</strong> case <strong>of</strong> Diesel Cycle eng<strong>in</strong>es, <strong>the</strong> energy efficiencyvaries little when <strong>the</strong>y are optimized for different fuels, although depend<strong>in</strong>g on <strong>the</strong> fuel <strong>the</strong>re may be considerabledifficulties <strong>in</strong> adapt<strong>in</strong>g <strong>the</strong> eng<strong>in</strong>e. For ethanol, significant changes are needed, while for biodieselalmost noth<strong>in</strong>g needs to be done.Therefore, if we imag<strong>in</strong>e a global market for liquid eng<strong>in</strong>e fuels that is <strong>in</strong> reasonable equilibrium and dom<strong>in</strong>atedby gasol<strong>in</strong>e and diesel, it would make more sense to use ethanol as a gasol<strong>in</strong>e substitute and extracta higher percentage <strong>of</strong> diesel oil from petroleum to use <strong>in</strong> compression ignition eng<strong>in</strong>es. Given that <strong>in</strong> mostcountries, taxes on gasol<strong>in</strong>e (used mostly <strong>in</strong> <strong>in</strong>dividual transport) are higher than taxes on diesel (used mostly<strong>in</strong> public and freight transportation), we can conclude that <strong>the</strong> global market <strong>of</strong>fers little scope for us<strong>in</strong>gethanol <strong>in</strong> applications currently dom<strong>in</strong>ated by diesel.However, domestic markets are far from perfect or <strong>in</strong> equilibrium, and ethanol has an excellent property thatis fundamental <strong>in</strong> greenhouse gas mitigation policies – it significantly reduces carbon emissions. This createsopportunities to use ethanol to replace diesel, ei<strong>the</strong>r partially or totally.
180 Ethanol and Bioelectricity <strong>Sugarcane</strong> <strong>in</strong> <strong>the</strong> <strong>Future</strong> <strong>of</strong> <strong>the</strong> <strong>Energy</strong> <strong>Matrix</strong>In Brazil, and especially <strong>in</strong> <strong>the</strong> State <strong>of</strong> São Paulo, <strong>the</strong> price relationship between ethanol, gasol<strong>in</strong>e and dieselis such that this possibility cannot be ruled out. From an energy standpo<strong>in</strong>t, it takes 1.72 liters <strong>of</strong> hydrousethanol or 1.22 liters <strong>of</strong> Type C gasol<strong>in</strong>e to replace 1 liter <strong>of</strong> diesel. Thus, assum<strong>in</strong>g that <strong>in</strong> <strong>the</strong> medium term<strong>the</strong> price <strong>of</strong> diesel will be ma<strong>in</strong>ta<strong>in</strong>ed <strong>in</strong> <strong>the</strong> range <strong>of</strong> 85% to 90% <strong>of</strong> <strong>the</strong> price <strong>of</strong> Type C gasol<strong>in</strong>e, <strong>the</strong>n whenever<strong>the</strong> pump price <strong>of</strong> ethanol drops below 49% to 52% <strong>of</strong> <strong>the</strong> gasol<strong>in</strong>e price, <strong>the</strong>re is economic – but notnecessarily technical – potential for consumers to use ethanol <strong>in</strong>stead <strong>of</strong> diesel. Recently, this limit has beenexceeded, which re<strong>in</strong>forces <strong>the</strong> <strong>in</strong>terest <strong>in</strong> substitution. It is worth mention<strong>in</strong>g that <strong>the</strong> price relation betweenhydrous ethanol and Type C gasol<strong>in</strong>e that make it economically attractive to use ethanol <strong>in</strong> a flex-fuel vehicleis 70%. This clearly demonstrates how far <strong>the</strong> market has been from equilibrium.When we consider <strong>the</strong> pre-tax sell<strong>in</strong>g price <strong>of</strong> hydrous ethanol and <strong>the</strong> purchase price <strong>of</strong> diesel by ethanolproducers, <strong>the</strong> opportunity for substitution becomes clearer. It appears to be economically advantageouswhen <strong>the</strong> ethanol/gasol<strong>in</strong>e price ratio at fill<strong>in</strong>g stations falls below <strong>the</strong> 77% - 81% range, for <strong>the</strong> same reasonsthat we saw for <strong>the</strong> diesel/Type C gasol<strong>in</strong>e price. These limits are around 65% even when ethanol is used<strong>in</strong> spark ignition eng<strong>in</strong>es, which have lower energy efficiency than compression-ignition eng<strong>in</strong>es. This showsthat <strong>the</strong>re is great economic potential for <strong>the</strong> replacement <strong>of</strong> diesel by ethanol <strong>in</strong> <strong>the</strong> sugar and ethanolsector, and this potential could possibly be even higher than that for <strong>the</strong> substitution <strong>of</strong> Type C gasol<strong>in</strong>e byethanol <strong>in</strong> flex-fuel vehicles.With<strong>in</strong> this reality <strong>of</strong> prices, we can clearly see <strong>the</strong> need to develop alternative techniques for ethanol useas a diesel replacement. In June 2009, average prices <strong>of</strong> fuels per unit <strong>of</strong> energy at distributors <strong>in</strong> São Paulowere: hydrous ethanol, R$44/GJ xv ; diesel, R$52/GJ; and biodiesel, R$70/GJ xvi . The high <strong>in</strong>centive for biodieselillustrates <strong>the</strong> importance that has been given to achiev<strong>in</strong>g a renewable substitute for diesel, which <strong>in</strong> thiscase can be used <strong>in</strong> <strong>the</strong> exist<strong>in</strong>g fleet.Three typical applications for us<strong>in</strong>g ethanol <strong>in</strong> diesel eng<strong>in</strong>es were seen as most promis<strong>in</strong>g. They are:. buses, m<strong>in</strong>ibuses and vans for urban passenger transport;. small trucks and urban delivery vans;. agricultural mach<strong>in</strong>es and vehicles transport<strong>in</strong>g cargo <strong>in</strong> <strong>the</strong> sugar and ethanol <strong>in</strong>dustry.4.2. Buses, m<strong>in</strong>ibuses and vans for urban passenger transportThe first application <strong>of</strong>fers <strong>the</strong> advantage <strong>of</strong> hav<strong>in</strong>g its use restricted to captive fleets, with <strong>the</strong> addedbenefit <strong>of</strong> reduc<strong>in</strong>g <strong>the</strong> emission <strong>of</strong> local pollutants and noise <strong>in</strong> urban environments. It is <strong>the</strong>refore potentiallysuitable for be<strong>in</strong>g <strong>the</strong> object <strong>of</strong> tax <strong>in</strong>centives or legal requirements that facilitate its adoption. In thiscontext, São Paulo’s Municipal Law 14.933/2009, which establishes <strong>the</strong> city’s Climate Change Policy, hasamongst its goals a reduction <strong>of</strong> at least 10% a year <strong>in</strong> fossil fuel use <strong>in</strong> all public transportation operat<strong>in</strong>gunder public contract <strong>in</strong> <strong>the</strong> city, so that by 2018 only use renewable fuels are used.
Ethanol as a Fuel1814.3. Small trucks and urban delivery vansThe second application presents advantages similar to those mentioned above, <strong>in</strong> terms <strong>of</strong> captive fleetsand <strong>the</strong> reduction <strong>of</strong> pollution and noise <strong>in</strong> <strong>the</strong> urban environment. However, it is essentially a private activity,which makes action by public authorities more difficult. One technical advantage is <strong>the</strong> fact that <strong>the</strong>irdiesel eng<strong>in</strong>es are smaller and can <strong>the</strong>refore be more easily replaced by Otto Cycle eng<strong>in</strong>es with economicadvantages, as outl<strong>in</strong>ed <strong>in</strong> <strong>the</strong> <strong>in</strong>itial considerations.4.4. Agricultural mach<strong>in</strong>ery and vehicles for transport<strong>in</strong>g cargo<strong>in</strong> <strong>the</strong> sugar and ethanol <strong>in</strong>dustryThe third application demonstrates undeniable economic viability. It thus <strong>of</strong>fers some marg<strong>in</strong> for develop<strong>in</strong>gtechnical solutions that are optimized for ethanol, and which could subsequently be used <strong>in</strong> o<strong>the</strong>r applications.4.5. Alternative technologies and potential development4.5.1 Transformation <strong>of</strong> heavy diesel eng<strong>in</strong>es <strong>in</strong>to Otto Cycle eng<strong>in</strong>esThe option that <strong>of</strong>fers least technological risk for substitut<strong>in</strong>g diesel with ethanol is <strong>the</strong> replacement <strong>of</strong>ignition compression eng<strong>in</strong>es with spark ignition eng<strong>in</strong>es. Although this solution was widely adopted <strong>in</strong><strong>the</strong> 1980s, above all <strong>in</strong> <strong>the</strong> sugar and ethanol sector, <strong>the</strong>re is currently no commercial supply <strong>in</strong> <strong>the</strong> Brazilianmarket <strong>of</strong> Otto Cycle eng<strong>in</strong>es large enough to be used <strong>in</strong> typical diesel eng<strong>in</strong>es applications.The solution implies transform<strong>in</strong>g orig<strong>in</strong>al diesel eng<strong>in</strong>es <strong>in</strong>to ethanol-powered Otto Cycle eng<strong>in</strong>es, and isrelatively cheap. The follow<strong>in</strong>g modifications are required: alteration <strong>of</strong> <strong>the</strong> pistons to reduce compressionratio to levels compatible with ethanol; replacement <strong>of</strong> <strong>the</strong> diesel high-pressure <strong>in</strong>jection system for an ignitionsystem where spark plugs are <strong>in</strong>stalled <strong>in</strong> <strong>the</strong> <strong>in</strong>jector nozzle hous<strong>in</strong>gs; adaptation <strong>of</strong> an Otto Cyclelow pressure <strong>in</strong>jection system, with <strong>the</strong> <strong>in</strong>jectors <strong>in</strong> <strong>the</strong> <strong>in</strong>take manifold <strong>in</strong>stalled next to <strong>the</strong> cyl<strong>in</strong>der <strong>in</strong>takes;<strong>in</strong>stallation <strong>of</strong> a throttle valve to control <strong>the</strong> air <strong>in</strong>take flow; <strong>in</strong>stallation <strong>of</strong> sensors for oxygen, combustion,and absolute <strong>in</strong>take pressure; use <strong>of</strong> an Electronic Control Unit (ECU) programmed accord<strong>in</strong>g to <strong>the</strong> fuel andignition; and advance <strong>of</strong> eng<strong>in</strong>e ignition tim<strong>in</strong>g. Given that <strong>the</strong> exhaust temperatures <strong>in</strong> Otto Cycle eng<strong>in</strong>esare higher than <strong>in</strong> diesel eng<strong>in</strong>es, changes to <strong>the</strong> exhaust valves and <strong>the</strong> valve seat<strong>in</strong>gs may also be needed.The possibility <strong>of</strong> us<strong>in</strong>g stoichiometric mixture and a three-way catalytic converter ensure meet<strong>in</strong>g strict pollutantemission limits, while <strong>the</strong> lower noise <strong>of</strong> <strong>the</strong> Otto Cycle eng<strong>in</strong>e is an advantage <strong>in</strong> many applications.The disadvantage <strong>of</strong> this alternative is <strong>the</strong> <strong>in</strong>crease <strong>in</strong> energy consumption due to <strong>the</strong> lower efficiency <strong>of</strong>Otto Cycle eng<strong>in</strong>es compared to diesel. This disadvantage <strong>in</strong>creases for eng<strong>in</strong>es with larger piston diam-
182 Ethanol and Bioelectricity <strong>Sugarcane</strong> <strong>in</strong> <strong>the</strong> <strong>Future</strong> <strong>of</strong> <strong>the</strong> <strong>Energy</strong> <strong>Matrix</strong>eters, <strong>in</strong> applications where <strong>the</strong>re are large variations <strong>in</strong> load and rotation and ones with a high degree <strong>of</strong>turbo–compression, and can vary from about 15% to 40% depend<strong>in</strong>g on use. Applications <strong>in</strong> large urbanbuses operat<strong>in</strong>g on routes with low average speed are likely to approach <strong>the</strong> higher limit. Applications suchas farm mach<strong>in</strong>ery that do not require three-way catalytic converters can use a leaner air/fuel mixture andreduce <strong>the</strong> disadvantage by about 7%.MWM International and FPT are develop<strong>in</strong>g solutions <strong>of</strong> this type for motor <strong>in</strong> <strong>the</strong> 60kW and 200kWranges, respectively. Expectations are that <strong>the</strong>se eng<strong>in</strong>es will cost less than <strong>the</strong> orig<strong>in</strong>als, thanks to <strong>the</strong>elim<strong>in</strong>ation <strong>of</strong> high-pressure <strong>in</strong>jection systems and because emission controls <strong>in</strong> <strong>the</strong> next phase <strong>of</strong> Conamawill be much more complex for diesel eng<strong>in</strong>es than for spark ignition eng<strong>in</strong>es xvii .New options are be<strong>in</strong>g researched, ma<strong>in</strong>ly overseas, for example low temperature combustion processes(Homogeneous Charge Compression Ignition and Controlled Auto Ignition – HCCI and CAI), direct <strong>in</strong>jection<strong>in</strong>to <strong>the</strong> chamber, and water <strong>in</strong>jection, among o<strong>the</strong>rs. These may eventually help reduce <strong>the</strong> energy cost <strong>of</strong>chang<strong>in</strong>g <strong>the</strong> cycle.4.5.2 Ethanol with an additive <strong>in</strong> diesel eng<strong>in</strong>esAno<strong>the</strong>r alternative that avoids sacrific<strong>in</strong>g <strong>the</strong> greater energy efficiency and robustness <strong>of</strong> compressionignition eng<strong>in</strong>es is to use ethanol directly <strong>in</strong> Diesel Cycle motors. To do this, hydrous ethanol must receivean additive to ga<strong>in</strong> <strong>the</strong> necessary lubricity that ensures <strong>the</strong> durability <strong>of</strong> <strong>the</strong> fuel <strong>in</strong>jection system and ensureself-combustion <strong>of</strong> <strong>the</strong> fuel <strong>in</strong>jected <strong>in</strong>to <strong>the</strong> eng<strong>in</strong>e’s combustion chamber.This option was tried a lot <strong>in</strong> Brazil dur<strong>in</strong>g <strong>the</strong> 1980s, us<strong>in</strong>g ignition stimulants based on organic nitratesand lubricants based on castor oil. Scania and Mercedes Benz suggested alternatives. The Swedish companyconducted field tests with buses and trucks that were sold <strong>in</strong> Brazil at <strong>the</strong> time, and later carried onthis development <strong>in</strong> Sweden. From 1990 to 2007, Scania sold 600 urban buses that operate <strong>in</strong> Stockholmand o<strong>the</strong>r cities <strong>in</strong> Sweden us<strong>in</strong>g hydrous ethanol and an additive <strong>of</strong> <strong>the</strong> ethylene glycol type. The eng<strong>in</strong>eshave a special Bosch <strong>in</strong>jection system and <strong>in</strong>itially had a 24:1 compression ratio. xviiiThe low level <strong>of</strong> pollutant emission has allowed <strong>the</strong>se vehicles to cont<strong>in</strong>ued meet<strong>in</strong>g European environmentalrequirements. Third-generation eng<strong>in</strong>es with 28:1 compression ratios easily meet Euro V legislation requirementsand EEV (Environmentally Enhanced Vehicle) legislation, which is more restrictive than Euro V.Demonstrations and tests <strong>of</strong> this technology were conducted with<strong>in</strong> a European Union <strong>in</strong>itiative called <strong>the</strong>BEST Project (Bio-Ethanol for Susta<strong>in</strong>able Transport). Coord<strong>in</strong>ated by <strong>the</strong> city <strong>of</strong> Stockholm, BEST <strong>in</strong>volvedn<strong>in</strong>e cities <strong>in</strong>clud<strong>in</strong>g São Paulo <strong>in</strong> several countries. <strong>Energy</strong> consumption <strong>of</strong> ethanol on <strong>the</strong> demonstrationbus was shown to be equivalent to a diesel-powered control vehicle.The current cost <strong>of</strong> <strong>the</strong> additive and <strong>the</strong> need to use a modified eng<strong>in</strong>e are <strong>the</strong> ma<strong>in</strong> disadvantages <strong>of</strong> <strong>the</strong>
Ethanol as a Fuel183technology. However, given that it is already be<strong>in</strong>g used <strong>in</strong> urban buses, <strong>the</strong>re is a great opportunity tomake it viable via <strong>the</strong> previously mentioned Law No. 14.933/2009.4.5.3 Vaporized ethanol <strong>in</strong> diesel eng<strong>in</strong>esThe use <strong>of</strong> ethanol as a partial substitute for diesel can be achieved by <strong>in</strong>ject<strong>in</strong>g ethanol via <strong>the</strong> <strong>in</strong>take air <strong>of</strong>a diesel eng<strong>in</strong>e, as if it were an Otto Cycle eng<strong>in</strong>e, while at <strong>the</strong> same time reduc<strong>in</strong>g <strong>the</strong> quantity <strong>of</strong> diesel oil<strong>in</strong>jected <strong>in</strong>to <strong>the</strong> combustion chamber. This option has <strong>the</strong> advantage <strong>of</strong> be<strong>in</strong>g reversible, but presents sometechnical difficulties that limit <strong>the</strong> proportion <strong>of</strong> diesel that can be substituted. In situations where an eng<strong>in</strong>eis operat<strong>in</strong>g at low load, and combustion <strong>the</strong>refore uses only a small fraction <strong>of</strong> <strong>the</strong> air drawn <strong>in</strong>, part <strong>of</strong> <strong>the</strong>ethanol is not burned and is expelled from <strong>the</strong> chamber via <strong>the</strong> exhaust valve. In high load situations thatimply high pressures and temperatures with<strong>in</strong> <strong>the</strong> combustion chamber, ethanol is subject to detonation,because diesel eng<strong>in</strong>e compression ratios are very high for ethanol. It is <strong>the</strong>refore essential to have precisecontrol over <strong>the</strong> amount <strong>of</strong> ethanol <strong>in</strong>jected for each condition <strong>of</strong> eng<strong>in</strong>e load and speed, and to coord<strong>in</strong>atethis with <strong>the</strong> amount <strong>of</strong> diesel.Both Bosch and Delphi, which supply fuel <strong>in</strong>jection and control systems for Otto Cycle and Diesel Cycle eng<strong>in</strong>es,have been work<strong>in</strong>g on develop<strong>in</strong>g this alternative for eng<strong>in</strong>e makers. Both companies use two fueltanks and two separate <strong>in</strong>jection systems that only <strong>in</strong>teract electronically, mean<strong>in</strong>g that <strong>the</strong>re is no need todevelop complex new physical systems.The percentage <strong>of</strong> diesel that can be efficiently substituted depends on <strong>the</strong> <strong>in</strong>dividual cyl<strong>in</strong>der capacity <strong>of</strong> <strong>the</strong>eng<strong>in</strong>e and <strong>the</strong> <strong>in</strong>tensity <strong>of</strong> turbo-charg<strong>in</strong>g used <strong>in</strong> <strong>the</strong> application. Dynamometer bench tests conducted byBosch with a 2.8 liter, four-cyl<strong>in</strong>der turbo-charged eng<strong>in</strong>e showed a substitution rate rang<strong>in</strong>g between 12%and 57%, depend<strong>in</strong>g on <strong>the</strong> operat<strong>in</strong>g po<strong>in</strong>t xix .The use <strong>of</strong> detonation sensors and possibly a throttle valve <strong>in</strong> <strong>the</strong> <strong>in</strong>take manifold can <strong>in</strong>crease <strong>the</strong> substitutionrates for this option.4.5.4 Blends <strong>of</strong> ethanol, diesel and co-solventsAno<strong>the</strong>r possibility for <strong>the</strong> partial replacement <strong>of</strong> diesel is <strong>the</strong> preparation <strong>of</strong> diesel-ethanol blends, us<strong>in</strong>g aco-solvent or emulsify<strong>in</strong>g agent to counter <strong>the</strong> low miscibility <strong>of</strong> ethanol <strong>in</strong> diesel. Field and laboratory testshave shown that <strong>the</strong> orig<strong>in</strong>al <strong>in</strong>jection systems <strong>of</strong> diesel eng<strong>in</strong>es are quite sensitive to <strong>the</strong> presence <strong>of</strong> ethanol,lead<strong>in</strong>g to wear or pitt<strong>in</strong>g <strong>in</strong> some components. Depend<strong>in</strong>g on <strong>the</strong> eng<strong>in</strong>e configuration, <strong>the</strong> seriousproblem <strong>of</strong> vapor lock can also occur, cutt<strong>in</strong>g fuel supply to <strong>the</strong> eng<strong>in</strong>e. S<strong>in</strong>ce ethanol is miscible <strong>in</strong> biodiesel,which <strong>in</strong> general has few limitations as a fuel for diesel eng<strong>in</strong>e, a mixture <strong>of</strong> <strong>the</strong> two bi<strong>of</strong>uels can be tried,us<strong>in</strong>g <strong>the</strong> lubricat<strong>in</strong>g properties <strong>of</strong> biodiesel and <strong>the</strong> clean combustion properties <strong>of</strong> ethanol. However, <strong>the</strong>elevation <strong>of</strong> vapor pressure <strong>of</strong> <strong>the</strong> fuel caused by <strong>the</strong> ethanol blend can lead to cavitation <strong>in</strong> <strong>the</strong> <strong>in</strong>jection
18 4 Ethanol and Bioelectricity <strong>Sugarcane</strong> <strong>in</strong> <strong>the</strong> <strong>Future</strong> <strong>of</strong> <strong>the</strong> <strong>Energy</strong> <strong>Matrix</strong>system. As mentioned earlier, <strong>the</strong> cost <strong>of</strong> biodiesel per unit <strong>of</strong> energy is far superior to that <strong>of</strong> diesel, whichlimits <strong>the</strong> scope <strong>of</strong> this alternative.5. Public policies to accelerate <strong>the</strong> development <strong>of</strong> fuel ethanol applications<strong>in</strong> vehicles and eng<strong>in</strong>esThe success <strong>of</strong> Brazilian ethanol as a renewable substitute for gasol<strong>in</strong>e vehicle fuel is a source <strong>of</strong> great prideand creates expectations that <strong>the</strong> country could enjoy a possible new role <strong>in</strong> <strong>the</strong> <strong>in</strong>ternational context <strong>of</strong>greenhouse gas emission reduction. However, when we compare <strong>the</strong> detailed evolution <strong>of</strong> energy andenvironmental efficiency <strong>in</strong> <strong>the</strong> use <strong>of</strong> ethanol and gasol<strong>in</strong>e as vehicle fuels over <strong>the</strong> past 30 years, we cansee that <strong>the</strong>re is much room for improvement.In this context, <strong>the</strong>re is a need for public policies that re<strong>in</strong>force <strong>the</strong> establishment <strong>of</strong> domestic technologiccompetence focused on us<strong>in</strong>g ethanol as a vehicle fuel, so prevent<strong>in</strong>g barriers to its use from neutraliz<strong>in</strong>g<strong>the</strong> efficiency ga<strong>in</strong>s <strong>in</strong> ethanol production.5.1. Challenges to <strong>the</strong> development <strong>of</strong> eng<strong>in</strong>e technology <strong>in</strong> BrazilAs we saw <strong>in</strong> <strong>the</strong> section on ethanol-powered passenger vehicles, dur<strong>in</strong>g <strong>the</strong> first half <strong>of</strong> <strong>the</strong> 1980s <strong>the</strong>sevehicles enjoyed significant advantages over gasol<strong>in</strong>e-powered cars, both <strong>in</strong> terms <strong>of</strong> energy efficiency andlocal pollutant emissions. Today, however, <strong>the</strong>se advantages have been practically zeroed or have evenbecome m<strong>in</strong>or disadvantages.This turn <strong>of</strong> events is not difficult to understand, when we recall that <strong>the</strong> automotive <strong>in</strong>dustry is composed<strong>of</strong> mult<strong>in</strong>ational companies and that renewable fuels represent only a small fraction <strong>of</strong> fuels consumedglobally by <strong>the</strong> transportation sector. It is natural, <strong>the</strong>refore, that technological developments aimed atreduc<strong>in</strong>g fuel consumption and pollutant emission <strong>in</strong> <strong>the</strong> past 30 years were aimed essentially at petroleumderivatives. The relative importance <strong>of</strong> Brazil <strong>in</strong> <strong>the</strong> global automobile market was small and <strong>the</strong> use <strong>of</strong>ethanol as vehicle fuel was seen as just a local solution. With <strong>the</strong> adoption by <strong>the</strong> United States <strong>of</strong> a programfor ethanol production and its use as <strong>the</strong> country’s ma<strong>in</strong> gasol<strong>in</strong>e substitute, eng<strong>in</strong>eer<strong>in</strong>g for ethanolapplications has ga<strong>in</strong>ed new momentum.Renewable fuels today represent 19% (by energy content) <strong>of</strong> fuels used <strong>in</strong> <strong>the</strong> Brazilian transport sector.Brazil aims to become an <strong>in</strong>ternational leader and to serve as example for o<strong>the</strong>r countries <strong>in</strong> <strong>the</strong> productionand use <strong>of</strong> renewable fuels. Brazilian eng<strong>in</strong>eer<strong>in</strong>g <strong>the</strong>refore faces two challenges. The first is to adapt forethanol <strong>the</strong> various technologies that have been developed for petroleum derivatives. The second is to pursuetechnological development based on <strong>the</strong> specific properties <strong>of</strong> ethanol to make it a more competitivefuel, so help<strong>in</strong>g prevent new legislation that could <strong>the</strong> use <strong>of</strong> ethanol <strong>in</strong> global markets.
Ethanol as a Fuel185Given that Brazil today accounts for 4% <strong>of</strong> global new vehicles sales and that Brazilian auto eng<strong>in</strong>eer<strong>in</strong>grepresents an even smaller fraction <strong>of</strong> <strong>the</strong> global sector, it is a huge challenge and one that needs <strong>the</strong> support<strong>of</strong> public policies to be overcome.5.2. Common policies for <strong>the</strong> development <strong>of</strong> <strong>the</strong> various alternativesTo develop world class competence <strong>in</strong> Brazil, dedicated to <strong>the</strong> use <strong>of</strong> ethanol as a vehicle fuel, <strong>the</strong> countryneeds to establish public policies that act at three different levels: <strong>the</strong> tra<strong>in</strong><strong>in</strong>g <strong>of</strong> technical competence(pr<strong>in</strong>cipally human resources) for research and development; stimulus for and streng<strong>the</strong>n<strong>in</strong>g <strong>of</strong> domesticauto eng<strong>in</strong>eer<strong>in</strong>g; and <strong>in</strong>centives for <strong>the</strong> f<strong>in</strong>al consumer to attribute value to <strong>the</strong> energy efficiency and environmentalsusta<strong>in</strong>ability that ethanol seeks to achieve. This last area <strong>of</strong> action should be specific to eachethanol application.5.2.1. Tra<strong>in</strong><strong>in</strong>g <strong>of</strong> researchersBasic research <strong>in</strong>to new combustion processes <strong>in</strong> eng<strong>in</strong>es and new fuels takes place <strong>in</strong> universities andtechnology <strong>in</strong>stitutes located <strong>in</strong> countries that are leaders <strong>in</strong> <strong>the</strong> automobile <strong>in</strong>dustry. These centers tra<strong>in</strong>eng<strong>in</strong>eers who will be dedicated to <strong>the</strong> research and development <strong>of</strong> new eng<strong>in</strong>es that ensure <strong>the</strong> technologicalevolution <strong>of</strong> <strong>the</strong> sector.If Brazil is to lead development for us<strong>in</strong>g ethanol as an <strong>in</strong>ternal combustion eng<strong>in</strong>e fuel it is essential toencourage research groups <strong>in</strong> universities and <strong>in</strong>stitutes that can tra<strong>in</strong> competent researchers <strong>in</strong> <strong>the</strong> field.Possible topics to be developed <strong>in</strong>clude: combustion k<strong>in</strong>etics <strong>of</strong> ethanol eng<strong>in</strong>es; visualization and simulation<strong>of</strong> combustion <strong>in</strong> eng<strong>in</strong>es; development and control <strong>of</strong> HCCI and CAI processes; and special catalyzersfor <strong>the</strong> products <strong>of</strong> ethanol combustion; among o<strong>the</strong>rs. Tra<strong>in</strong><strong>in</strong>g researchers and, ma<strong>in</strong>ly, <strong>the</strong> structur<strong>in</strong>g<strong>of</strong> a combustion eng<strong>in</strong>e research program should be <strong>the</strong> object <strong>of</strong> a public policy focused on a partnershipbetween research <strong>in</strong>stitutes, universities and <strong>the</strong> auto <strong>in</strong>dustry. Given that f<strong>in</strong>ancial resources are limited, itis important to concentrate efforts on more specialized and better equipped <strong>in</strong>stitutes to avoid <strong>the</strong> dispersion<strong>of</strong> <strong>the</strong>se resources <strong>in</strong>to projects with little or no practical return.5.2.2. Support for <strong>the</strong> development <strong>of</strong> motor eng<strong>in</strong>eer<strong>in</strong>gAutomakers and <strong>the</strong>ir ma<strong>in</strong> suppliers <strong>in</strong> Brazil are global companies that seek to <strong>in</strong>corporate specific regionalfactors <strong>in</strong>to <strong>the</strong>ir strategies. For this reason, several <strong>of</strong> <strong>the</strong>se companies have established <strong>the</strong>ir renewablefuels development centers with<strong>in</strong> <strong>the</strong>ir Brazilian subsidiaries – a fact that should be taken advantage <strong>of</strong> andencouraged by means <strong>of</strong> public policies that aim at streng<strong>the</strong>n<strong>in</strong>g automobile eng<strong>in</strong>eer<strong>in</strong>g specifically <strong>in</strong> <strong>the</strong>use <strong>of</strong> ethanol. Even though basic eng<strong>in</strong>e units, eng<strong>in</strong>e control systems and catalyzers are developed abroad
186 Ethanol and Bioelectricity <strong>Sugarcane</strong> <strong>in</strong> <strong>the</strong> <strong>Future</strong> <strong>of</strong> <strong>the</strong> <strong>Energy</strong> <strong>Matrix</strong>for gasol<strong>in</strong>e eng<strong>in</strong>es, <strong>the</strong>ir adaption for ethanol generally takes place <strong>in</strong> Brazil. A significant part <strong>of</strong> <strong>the</strong> developmentsthat are applied to flex-fuel eng<strong>in</strong>es are <strong>the</strong> work <strong>of</strong> parts and systems suppliers to <strong>the</strong> OEMs.Public policies that encourage f<strong>in</strong>anc<strong>in</strong>g for <strong>the</strong> development <strong>of</strong> ethanol eng<strong>in</strong>e components and systems,similar to <strong>the</strong> Funtec program run by <strong>the</strong> Brazilian Development Bank (BNDES), would help attract o<strong>the</strong>rcompetence centers <strong>in</strong> <strong>the</strong> ethanol field to <strong>the</strong> country. Projects should <strong>in</strong>volve various players <strong>in</strong> <strong>the</strong> supplycha<strong>in</strong> toge<strong>the</strong>r with research <strong>in</strong>stitutes or universities, <strong>in</strong> order to build up domestic know-how. The focuscould be on items such as catalyzers, piston r<strong>in</strong>gs, fuel pumps, <strong>in</strong>jection nozzles, cold start systems and <strong>the</strong>like, specifically for ethanol.5.3. Specific aspects5.3.1. Flex-fuel vehiclesThe Vehicle Label<strong>in</strong>g Program, currently coord<strong>in</strong>ated by Inmetro, is a way to promote healthy competitionbetween automakers by giv<strong>in</strong>g public recognition to – and so <strong>in</strong>form<strong>in</strong>g consumers about – <strong>the</strong> vehicleswith <strong>the</strong> greatest energy efficiency. However, this program does not differentiate between renewable andfossil fuels – a fact that could end up favor<strong>in</strong>g imported vehicles that have been optimized for gasol<strong>in</strong>e.However, under <strong>the</strong> current rules <strong>of</strong> <strong>the</strong> program, if an OEM launches an ethanol-powered model, this willenjoy an advantage <strong>of</strong> around 3% due to ethanol’s higher octane rat<strong>in</strong>g, and this could possibly reward <strong>the</strong>vehicle with a higher classification.A economy classification program for ethanol, ignor<strong>in</strong>g gasol<strong>in</strong>e results, with <strong>the</strong> possible participation <strong>of</strong>organizations such as <strong>the</strong> IPT and Cetesb, and with wide publication <strong>of</strong> <strong>the</strong> results, would emphasize <strong>the</strong>aspects <strong>of</strong> optimization that it is desired to promote.There should be <strong>in</strong>centives for OEMs and f<strong>in</strong>al consumers <strong>in</strong> order to promote <strong>the</strong> desired energy efficiencyand environmental susta<strong>in</strong>ability. One <strong>in</strong>centive that could be adopted, and that has shown to be effective<strong>in</strong> o<strong>the</strong>r countries, is selective tax relief based on <strong>the</strong> level <strong>of</strong> fuel economy and emission reduction.A public policy to promote fleet renewal would be effective <strong>in</strong> reduc<strong>in</strong>g emissions <strong>of</strong> greenhouse gases andlocal pollutants, and would br<strong>in</strong>g <strong>in</strong>direct benefits by <strong>in</strong>creas<strong>in</strong>g energy efficiency <strong>in</strong> ethanol use, becausenew generations <strong>of</strong> flex-fuel vehicles would be developed. It is worth mention<strong>in</strong>g that with CO 2valued atUS$20 per tonne, <strong>the</strong> average annual reduction <strong>in</strong> CO 2emissions for each flex-fuel vehicle <strong>in</strong> Brazil couldjustify an IPVA (annual road license tax) 1% lower for flex-fuel vehicles compared to <strong>the</strong>ir gasol<strong>in</strong>e equivalent,assum<strong>in</strong>g <strong>the</strong> flex-fuel vehicle runs on ethanol 65% <strong>of</strong> <strong>the</strong> time.Public policies to encourage <strong>the</strong> export <strong>of</strong> flex-fuel technology would re<strong>in</strong>force <strong>the</strong> development <strong>of</strong> Brazilianmotor eng<strong>in</strong>eer<strong>in</strong>g, and this would help improve <strong>the</strong> use <strong>of</strong> ethanol as a fuel. Export<strong>in</strong>g flex-fuel vehicles
Ethanol as a Fuel187to develop<strong>in</strong>g countries that import petroleum and derivatives could help open new markets for ethanolexports and/or help <strong>in</strong> transform<strong>in</strong>g ethanol <strong>in</strong>to a commodity.5.3.2. Flex-fuel motorcyclesA public policy focus<strong>in</strong>g on renew<strong>in</strong>g <strong>the</strong> motorcycle fleet, with replacement by flex-fuel motorcycles,would br<strong>in</strong>g direct benefits <strong>in</strong> terms <strong>of</strong> reduction <strong>of</strong> greenhouse gas emissions, plus <strong>in</strong>direct benefitsthrough <strong>the</strong> development <strong>of</strong> technology to use ethanol <strong>in</strong> smaller eng<strong>in</strong>es. The same logic that applies toIPVA reduction for flex-fuel four-wheel vehicles could be applied to flex-fuel motorcycles, as well as a publicpolicy to encourage exports.5.3.3. Diesel substitutionThere should be encouragement for environmental legislation aimed at reduc<strong>in</strong>g CO 2emissions to <strong>in</strong>cludeclauses relative to <strong>the</strong> transportation sector, both collective and <strong>in</strong>dividual. Even conservative values for <strong>the</strong>CO 2emissions avoided by transportation vehicles that do not use fossil fuels can justify tax reductions <strong>of</strong>5% to 10% on <strong>the</strong> IPI and ICMS taxes levied on new vehicles. O<strong>the</strong>r options for support could <strong>in</strong>clude directsubsidies for a fixed period and <strong>the</strong> purchase <strong>of</strong> old vehicles to remove <strong>the</strong>m from circulation.Given that substitut<strong>in</strong>g ethanol for diesel is much more economically attractive <strong>in</strong> <strong>the</strong> sugar and ethanol<strong>in</strong>dustry than <strong>in</strong> any o<strong>the</strong>r sector <strong>of</strong> <strong>the</strong> economy, <strong>the</strong> credibility to promote this alternative <strong>in</strong> o<strong>the</strong>r marketscan be harmed if <strong>the</strong> sugar and ethanol sector does not set an example.As a move to facilitate <strong>the</strong> development <strong>of</strong> technological alternatives that will <strong>in</strong>itially be applied <strong>in</strong> <strong>the</strong>sugar and ethanol sector, we suggested that <strong>the</strong> sector should use its comb<strong>in</strong>ed purchas<strong>in</strong>g power <strong>in</strong> a coord<strong>in</strong>atedmanner to encourage suppliers to develop projects <strong>in</strong>volv<strong>in</strong>g agricultural mach<strong>in</strong>ery and trucks.
188 Ethanol and Bioelectricity <strong>Sugarcane</strong> <strong>in</strong> <strong>the</strong> <strong>Future</strong> <strong>of</strong> <strong>the</strong> <strong>Energy</strong> <strong>Matrix</strong>6. Bibliography. Castro A. C. et al. Flexible ethanol Otto eng<strong>in</strong>e management system. Warrendale, PA: Society <strong>of</strong> AutomotiveEng<strong>in</strong>eers, SAE Technical Paper no. 942400, 1994.. Castro F.L.J. et al. Alcohol Eng<strong>in</strong>es Conversion Shops: Operational Experience <strong>of</strong> <strong>the</strong> Technological Research Center –CAT/IPT – Proceed<strong>in</strong>gs Fifth International Alcohol Fuel Technology Symposium – Auckland, New Zealand, 1982.. Cohn et al. Fuel management system for variable ethanol octane enhancement <strong>of</strong> gasol<strong>in</strong>e eng<strong>in</strong>es. United StatesPatent Nr: 7,314,033 B2; January 1, 2008. Conti, É. W. Sistema Motronic Flex Fuel- Sem<strong>in</strong>ário IPT “Alternativas para o uso flexível do álcool como combustível”,March 2000.. Neto Messen A.T. et al. Miscibilidade de Álcool Etílico, Gasol<strong>in</strong>a e Água. Anais do VII SIMEA – Associação Brasileirade Engenharia Automotiva (AEA). São Paulo, 1993.. Pefley R.K et al. A Feedback Controlled Fuel Injection System Can Accommodate Any Alcohol-Gasol<strong>in</strong>e Blend – IVInternational Symposium on Alcohol Fuels Technology. Guarujá, Brazil, 1980.
Ethanol as a Fuel189Explanatory NotesiBrazilian law does not establish <strong>the</strong> octane level <strong>of</strong> Type A gasol<strong>in</strong>e, but for Type C gasol<strong>in</strong>e <strong>the</strong> octane level is based on <strong>the</strong> Anti-Knock Index(AKI – Índice Antidetonante, IAD), with <strong>the</strong> follow<strong>in</strong>g m<strong>in</strong>imum values: gasol<strong>in</strong>e: AKI 87; premium gasol<strong>in</strong>e: AKI 91; “Podium” gasol<strong>in</strong>e: AKI 95.In comparison, ethanol has AKI 99.5 (calculation <strong>of</strong> AKI values for ethanol – RON and MON – from Owen, K. and Coley, T., Automotive FuelsReference Book, pp. 591, second edition, Society <strong>of</strong> Automotive Eng<strong>in</strong>eers, 1995.iiReduc<strong>in</strong>g <strong>the</strong> amount <strong>of</strong> fuel <strong>in</strong> relation to <strong>the</strong> <strong>the</strong>oretical quantity <strong>of</strong> air for complete combustion.iiiSTI/MIC, Fuel Economy Program for Light Vehicles with Otto Cycle Eng<strong>in</strong>es, Brasilia, 1983.ivReport on Air Quality <strong>in</strong> <strong>the</strong> State <strong>of</strong> São Paulo, 2007. State Government <strong>of</strong> Sao Paulo - Department <strong>of</strong> <strong>the</strong> Environment - Cetesb, 2008.vClean Air Act Amendments (CAAA) <strong>of</strong> 1990, <strong>the</strong> <strong>Energy</strong> Policy Act (EPAct) <strong>of</strong> 1992 and <strong>the</strong> Clean Fuel Fleet Program (CFFP) 1998.viMonnerat Jr., P. et al. – “S<strong>of</strong>tware Flex-fuel sensor (SFS). Logical sensor applied to motor control us<strong>in</strong>g variable percentages <strong>of</strong> ethanol.”Warrendale, PA: Society <strong>of</strong> Automotive Eng<strong>in</strong>eers, SAE Technical Paper no. 2000-01-3218, 2000.viiJOSEPH Jr., H. – “New Advances <strong>in</strong> Flex-fuel Technology.” Panel at Ethanol Summit 2009, São Paulo, June 2009.viiiIn accordance with Conama Resolution No. 299 <strong>of</strong> October, 2001.ixReport on Air Quality <strong>in</strong> <strong>the</strong> State <strong>of</strong> São Paulo, 2007. State Government <strong>of</strong> São Paulo - Secretariat <strong>of</strong> <strong>the</strong> Environment - Cetesb, 2008.x“Regulation on Conformity Assessment for Light Passenger Vehicles and Light Commercial Vehicles with Otto Cycle Eng<strong>in</strong>es” - Annex toInmetro Decree No. 391/2008.xiSystem that treats exhaust gases. Also known as a catalyzer.xiihttp://www.Anfavea.com.br/emissoes.html.xiiiInmetro Instruction No. 391 - 04/11/2008 – “Regulation on Assessment <strong>of</strong> Conformity <strong>of</strong> Passenger Vehicles and Light Commercial Vehicleswith Otto Cycle Eng<strong>in</strong>es”.xiv“Autoesporte Rank<strong>in</strong>g: Average Consumption” – Autoesporte, 03/17/2009xvSurvey <strong>of</strong> Prices by <strong>the</strong> ANP - June 2009.xviResults <strong>of</strong> <strong>the</strong> 14th Biodiesel Auction (05/29/2009) - ANP.xviiEbel<strong>in</strong>g, G. – MWM International; Medeiros J.I. FPT – Panel presentation entitled “Ethanol: New option for Diesel Eng<strong>in</strong>es” – Ethanol Summit2009, São Paulo, June 2009.xviiiMoreira, JR – “The BEST Project and <strong>the</strong> expansion <strong>of</strong> <strong>the</strong> ethanol <strong>in</strong>dustry <strong>in</strong> Brazil” - Presentation at panel entitled “Ethanol: New option forDiesel Eng<strong>in</strong>es” - Ethanol Summit 2009, São Paulo, June 2009.xixSalles, E and Zambotti, A – “An experimental study <strong>of</strong> diesel-ethanol electronically controlled combustion”. Simea, 2009, São Paulo.
190 Ethanol and Bioelectricity <strong>Sugarcane</strong> <strong>in</strong> <strong>the</strong> <strong>Future</strong> <strong>of</strong> <strong>the</strong> <strong>Energy</strong> <strong>Matrix</strong>07
Ethanol and Bioelectricity <strong>Sugarcane</strong> <strong>in</strong> <strong>the</strong> <strong>Future</strong> <strong>of</strong> <strong>the</strong> <strong>Energy</strong> <strong>Matrix</strong>191International Bi<strong>of</strong>uelsPoliciesAdriano PiresRafael Schechtman
192 Ethanol and Bioelectricity <strong>Sugarcane</strong> <strong>in</strong> <strong>the</strong> <strong>Future</strong> <strong>of</strong> <strong>the</strong> <strong>Energy</strong> <strong>Matrix</strong>Global bi<strong>of</strong>uels production is grow<strong>in</strong>g, reach<strong>in</strong>g approximately 80 billion liters <strong>in</strong> 2008, <strong>of</strong>which 67 billion was ethanol. Supply <strong>in</strong>creased by 18.6% per year between 2000 and 2008for ethanol, and 37.3% for biodiesel. This is a market where <strong>the</strong> most important producers<strong>of</strong> ethanol are <strong>the</strong> United States (34 billion liters <strong>in</strong> 2008) and Brazil (27 billion liters); <strong>the</strong> twocountries toge<strong>the</strong>r account<strong>in</strong>g for about 80% <strong>of</strong> world production.Despite <strong>the</strong> <strong>in</strong>crease <strong>in</strong> production, experience <strong>in</strong> several countries shows that <strong>in</strong> general <strong>the</strong>use <strong>of</strong> bi<strong>of</strong>uels is not yet competitive with petroleum products, and depends on public policies.These policies do not tend to succeed where petroleum derivatives are subsidized or where <strong>the</strong>tax burden does not <strong>in</strong>clude <strong>the</strong> costs <strong>of</strong> <strong>the</strong> externalities <strong>of</strong> fossil fuel production and use.All countries (except Brazil, <strong>in</strong> <strong>the</strong> case <strong>of</strong> ethanol) have policies to encourage bi<strong>of</strong>uels consumption.These are justified by a number <strong>of</strong> factors, <strong>in</strong>clud<strong>in</strong>g greater energy security, reduction<strong>of</strong> environmental impacts and <strong>the</strong> creation <strong>of</strong> new markets for agricultural products.Three ma<strong>in</strong> <strong>in</strong>struments exist to promote <strong>the</strong> use <strong>of</strong> bi<strong>of</strong>uels: command and control mechanisms(regulatory standards, <strong>in</strong>clud<strong>in</strong>g mandatory consumption); economic measures (f<strong>in</strong>ancial<strong>in</strong>centives, differential taxation, tradable certificates); and import restrictions.
International Bi<strong>of</strong>uels Policies193The United States, for example, applies both regulatory standards and f<strong>in</strong>ancial <strong>in</strong>centives,establish<strong>in</strong>g mandatory volumes for renewable fuels. It is important that regulations take<strong>in</strong>to account <strong>the</strong> rate <strong>of</strong> emissions reduction attributable to replac<strong>in</strong>g fossil fuel with bi<strong>of</strong>uel.Today, a 10% blend <strong>of</strong> ethanol <strong>in</strong> gasol<strong>in</strong>e is mandatory <strong>in</strong> some U.S. states. In addition, <strong>the</strong>reare tax <strong>in</strong>centives to promote <strong>the</strong> use <strong>of</strong> U.S. corn-based ethanol and tariff barriers to importsfrom Brazil.The European Union uses much more biodiesel and accounts for two thirds <strong>of</strong> world production<strong>of</strong> this fuel, which receives strong <strong>in</strong>centives. In <strong>the</strong> medium term, given <strong>the</strong> restrictionson domestic supply, <strong>the</strong> EU is likely to import larger quantities <strong>of</strong> ethanol to meet grow<strong>in</strong>gconsumption. Today, Brazilian ethanol faces tax barriers to enter <strong>the</strong> EU.This study also analyzes bi<strong>of</strong>uels policies <strong>in</strong> Sweden, Brita<strong>in</strong> and Germany. In Sweden, whereethanol use is promoted compulsorily, half <strong>of</strong> new light vehicle models were <strong>of</strong>fered <strong>in</strong> flexversions <strong>in</strong> 2008. The UK, which until 2010 promoted biodiesel and ethanol via tax <strong>in</strong>centives,will <strong>in</strong>troduce <strong>in</strong>creas<strong>in</strong>g mandatory quotas for bi<strong>of</strong>uel sales. And Germany, which <strong>in</strong>2008 produced 17% <strong>of</strong> <strong>the</strong> world’s biodiesel from canola, ended tax breaks for <strong>the</strong> majority<strong>of</strong> cases, preferr<strong>in</strong>g to impose quotas.
194 Ethanol and Bioelectricity <strong>Sugarcane</strong> <strong>in</strong> <strong>the</strong> <strong>Future</strong> <strong>of</strong> <strong>the</strong> <strong>Energy</strong> <strong>Matrix</strong>IntroductionThe global bi<strong>of</strong>uels market grew at surpris<strong>in</strong>g rates dur<strong>in</strong>g <strong>the</strong> last decade. As can be seen <strong>in</strong> Graph 1,between 2000 and 2008, <strong>the</strong> annual growth <strong>of</strong> ethanol production averaged 18.6%, while for biodieselgrowth averaged 37.3%.As shown <strong>in</strong> Table 1, 67 billion liters <strong>of</strong> ethanol and 12 billion liters <strong>of</strong> biodiesel were produced <strong>in</strong> 2008, avolume equivalent to approximately 920,000 barrels/day <strong>of</strong> petroleum, or 1.1% <strong>of</strong> <strong>the</strong> global production <strong>of</strong>fossil fuels. The United States leads <strong>the</strong> global production <strong>of</strong> ethanol, followed by Brazil. Toge<strong>the</strong>r, <strong>the</strong>secountries were responsible for nearly 90% <strong>of</strong> global ethanol production. Germany was <strong>the</strong> largest producer<strong>of</strong> biodiesel, with its 2.2 billion liter output represent<strong>in</strong>g 17% <strong>of</strong> global production. Production <strong>of</strong> biodieselhas been dom<strong>in</strong>ated by member-states <strong>of</strong> <strong>the</strong> European Union (EU), which toge<strong>the</strong>r produced 8 billionliters, or two-thirds <strong>of</strong> global production.The performance <strong>of</strong> <strong>the</strong> bi<strong>of</strong>uels market reflects both <strong>the</strong> implementation <strong>of</strong> policies <strong>in</strong> several countriesto promote its production and use, and its improv<strong>in</strong>g competitiveness compared to fossil fuels. This stemsfrom fall<strong>in</strong>g production costs, due to technology ga<strong>in</strong>s, as well as <strong>the</strong> ris<strong>in</strong>g petroleum price until 2008.Even so, production costs for bi<strong>of</strong>uels are greater than those for petroleum derivatives. Bi<strong>of</strong>uels are notcompetitive with fossil fuels at market prices, except <strong>in</strong> a few cases such as Brazilian ethanol. Hence, <strong>the</strong>majority <strong>of</strong> promotional policies are justified on <strong>the</strong> grounds that bi<strong>of</strong>uels br<strong>in</strong>g non-market benefits.Graph 1Annual growth <strong>of</strong> global ethanol and biodiesel production In billions <strong>of</strong> liters7060504030201001990 1991 1992 1993 1994 1995 1996 1997Biodiesel1998 1999 2000 2001 2002 2003 2004 2005 2006 2007 2008EthanolSource: Prepared by <strong>the</strong> authors from Fulton, L. et al. (2004) for 1990–2000 data; EIA (2009a) for 2001–2007; and REN21 (2009) for 2008.
International Bi<strong>of</strong>uels Policies195These benefits <strong>in</strong>clude:a Increase <strong>in</strong> national security <strong>of</strong> energy supplyPetroleum has f<strong>in</strong>ite reserves and highly volatile prices. Seek<strong>in</strong>g to m<strong>in</strong>imize dependence on this fuel is<strong>the</strong>refore crucial for many countries. Bi<strong>of</strong>uels have great potential for directly substitut<strong>in</strong>g petroleum derivatives<strong>in</strong> <strong>the</strong> short term and without great <strong>in</strong>vestments <strong>in</strong> <strong>in</strong>frastructure or technological changes <strong>in</strong> vehiclemotors. Ethanol can be used when mixed with gasol<strong>in</strong>e <strong>in</strong> proportions <strong>of</strong> up to 15% i without significantalterations to vehicle eng<strong>in</strong>es, and <strong>in</strong> greater proportions <strong>in</strong> modified vehicles. Modern diesel eng<strong>in</strong>es canrun on mixtures <strong>of</strong> up to 100% biodiesel, while older models accept up to 20% biodiesel with small modifications.Unlike o<strong>the</strong>r candidates to substitute petroleum derivatives, such as natural gas (CNG), hydrogenand electricity, <strong>the</strong> bi<strong>of</strong>uels distribution and retail cha<strong>in</strong> can more easily use <strong>the</strong> exist<strong>in</strong>g <strong>in</strong>frastructure foroil derivatives. In addition, bi<strong>of</strong>uels can be produced domestically; if imported, <strong>the</strong>y can come from diverseregions that do not manifest <strong>the</strong> <strong>in</strong>stabilities that currently plague several oil produc<strong>in</strong>g countries.b Reduction <strong>of</strong> global and local environmental impactsThe substitution <strong>of</strong> oil derivatives by bi<strong>of</strong>uels is positive for local air quality. Biodiesel emissions, for example,conta<strong>in</strong> less carbon monoxide, sulfur oxides and particulate matter than diesel emissions. Bi<strong>of</strong>uelsare less toxic than fossil fuels and <strong>the</strong>ir production processes are less aggressive to <strong>the</strong> environment, whilewaste material from <strong>the</strong>ir production can be recycled and even used to generate electricity, as <strong>in</strong> <strong>the</strong> case<strong>of</strong> Brazilian sugarcane ethanol.Global production <strong>of</strong> ethanol and biodiesel <strong>in</strong> 2008 In billions <strong>of</strong> litersTable 1Ethanol Biodiesel TotalUnited States 34.0 2.0 36.0Brazil 27.0 1.2 28.2France 1.2 1.6 2.8Germany 0.5 2.2 2.7Ch<strong>in</strong>a 1.9 0.1 2.0Argent<strong>in</strong>a 0.0 1.2 1.2Canada 0.9 0.1 1.0Spa<strong>in</strong> 0.4 0.3 0.7Thailand 0.3 0.4 0.7O<strong>the</strong>rs 0.5 2.7 3.2Global Total 67.0 12.0 79.0Source: Prepared by <strong>the</strong> authors from REN21 (2009).
196 Ethanol and Bioelectricity <strong>Sugarcane</strong> <strong>in</strong> <strong>the</strong> <strong>Future</strong> <strong>of</strong> <strong>the</strong> <strong>Energy</strong> <strong>Matrix</strong>Because <strong>the</strong>y produce less greenhouse gas (GHG) emissions than gasol<strong>in</strong>e and diesel, ethanol and biodieselare important options for mitigat<strong>in</strong>g climate change. This is particularly true for countries that need toreduce <strong>the</strong>ir emissions to comply with <strong>the</strong> Kyoto Protocol. Accord<strong>in</strong>g to a 2008 study by <strong>the</strong> OECD look<strong>in</strong>gat lifecycle emissions ii <strong>of</strong> GHG from various bi<strong>of</strong>uels produced by different technological paths, sugarcaneethanol emits, on average, 85% less GHG than gasol<strong>in</strong>e (see Graph 2). This can exceed 100% if <strong>the</strong> use <strong>of</strong>byproducts <strong>of</strong> <strong>the</strong> sugar-ethanol <strong>in</strong>dustry is considered, for example <strong>the</strong> generation <strong>of</strong> bioelectricity. Wheatethanol <strong>of</strong>fers more modest results, reduc<strong>in</strong>g emissions between 30% and 50%, while corn ethanol providesan average reduction <strong>of</strong> 20%.Studies show differ<strong>in</strong>g results for biodiesel produced with exist<strong>in</strong>g technologies <strong>in</strong> Europe, us<strong>in</strong>g canolavegetable oil. However, <strong>the</strong> OECD study <strong>in</strong>dicates probable emission reduction values <strong>of</strong> between 40% and55%. Accord<strong>in</strong>g to <strong>the</strong> OECD, research data on Dendê biodiesel is scarce. Some cases po<strong>in</strong>t to reductions<strong>of</strong> up to 80%, although <strong>in</strong> o<strong>the</strong>r cases where <strong>the</strong> crop has been grown <strong>in</strong> areas where tropical forest wasburned down, <strong>the</strong>re may be an <strong>in</strong>crease <strong>of</strong> emissions.Graph 2Less greenhouse effect Reduction <strong>in</strong> (%)Reduction <strong>of</strong> net greenhouse gas emissions for technology paths for bi<strong>of</strong>uels production compared to gasol<strong>in</strong>eand diesel (with no change <strong>in</strong> land use)120Lignocellulose100<strong>Sugarcane</strong>WheatCanolaDendê80Lignocellulose60Corn40200-20EthanolBiodieselSource: REN21 (2009).
International Bi<strong>of</strong>uels Policies197For <strong>the</strong> second-generation technology paths, <strong>the</strong> production <strong>of</strong> both ethanol and biodiesel from biomasslignocellulose can lead to emission reductions greater than 100%. However, <strong>the</strong>se paths are not yet commerciallyavailable.c Creation <strong>of</strong> new markets for agricultural productsBi<strong>of</strong>uels production creates new demands <strong>in</strong> agriculture and br<strong>in</strong>gs benefits to rural areas by improv<strong>in</strong>gproduct prices and <strong>in</strong>creas<strong>in</strong>g regional <strong>in</strong>come. O<strong>the</strong>r benefits <strong>in</strong>clude <strong>the</strong> development <strong>of</strong> new agriculturaland production technologies and <strong>the</strong> possibility <strong>of</strong> export<strong>in</strong>g new items, for example new technologiesand renewable products. There is, however, great concern that crops dest<strong>in</strong>ed for bi<strong>of</strong>uels production mayoccupy or dislocate areas dest<strong>in</strong>ed for food production. These crops may even be diverted to bi<strong>of</strong>uel production.This is particularly true when fiscal <strong>in</strong>centives for bi<strong>of</strong>uels distort <strong>the</strong> relative market prices.d Stimulus for regional and national developmentBi<strong>of</strong>uels production can also promote economic activity, development and job creation, especially <strong>in</strong> ruralareas that are generally less developed than urban areas. O<strong>the</strong>r benefits can also be created for <strong>the</strong> country,such as <strong>the</strong> technological development <strong>of</strong> agricultural sectors and bi<strong>of</strong>uel production. Also, <strong>the</strong> country canexpand its range <strong>of</strong> export options, add<strong>in</strong>g new technologies and renewable fuels.This study analyzes <strong>in</strong>ternational policy experiences for promotion and use <strong>of</strong> bi<strong>of</strong>uels <strong>in</strong> an attempt to identify<strong>the</strong> barriers and opportunities for export<strong>in</strong>g Brazilian ethanol. In item 1, we analyze automotive fossilfuel prices <strong>in</strong> several countries with <strong>the</strong> aim <strong>of</strong> identify<strong>in</strong>g space with<strong>in</strong> pric<strong>in</strong>g policies to adopt f<strong>in</strong>ancial<strong>in</strong>centives for bi<strong>of</strong>uels. Item 2 evaluates policies to promote production and consumption <strong>in</strong> selected countries,seek<strong>in</strong>g to identify <strong>the</strong> dimensions <strong>of</strong> <strong>the</strong> ethanol market <strong>in</strong> <strong>the</strong>se countries and <strong>the</strong> barriers to Brazilianethanol. F<strong>in</strong>ally, item 3 summarizes and complements <strong>the</strong> ma<strong>in</strong> considerations and results <strong>of</strong> this paper.1 Analysis <strong>of</strong> <strong>in</strong>ternational automotive fuel pricesAn analysis <strong>of</strong> <strong>the</strong> <strong>in</strong>ternal pric<strong>in</strong>g policies <strong>of</strong> automotive fossil fuels used <strong>in</strong> different countries is essentialfor an understand<strong>in</strong>g <strong>of</strong> <strong>the</strong> impact <strong>of</strong> policies aimed at promot<strong>in</strong>g bi<strong>of</strong>uels.Consumer prices for petroleum derivatives <strong>in</strong>clude several cost factors, pr<strong>of</strong>it marg<strong>in</strong>s and taxes <strong>in</strong>curredalong <strong>the</strong> supply cha<strong>in</strong> from <strong>the</strong> wells to <strong>the</strong> gas stations. These <strong>in</strong>clude <strong>the</strong> costs <strong>of</strong> petroleum prospection,production, transportation and ref<strong>in</strong><strong>in</strong>g, <strong>the</strong>n <strong>the</strong> cost <strong>of</strong> distribution and retail sale <strong>of</strong> derivatives, pluscompanies´ pr<strong>of</strong>it marg<strong>in</strong>s and taxes <strong>in</strong> both <strong>the</strong> oil produc<strong>in</strong>g and derivative consum<strong>in</strong>g countries.
198 Ethanol and Bioelectricity <strong>Sugarcane</strong> <strong>in</strong> <strong>the</strong> <strong>Future</strong> <strong>of</strong> <strong>the</strong> <strong>Energy</strong> <strong>Matrix</strong>In general, <strong>in</strong>ternational gasol<strong>in</strong>e and diesel prices follow <strong>the</strong> price <strong>of</strong> a barrel <strong>of</strong> petroleum. With <strong>the</strong> elevation<strong>of</strong> petroleum prices until <strong>the</strong> middle <strong>of</strong> 2008 and its subsequent decl<strong>in</strong>e, it would be logical thatconsumer prices followed a similar pattern, at least to a certa<strong>in</strong> extent. However, it can be seen that <strong>in</strong> somecountries <strong>the</strong> prices did not follow <strong>the</strong> variation <strong>of</strong> <strong>the</strong> <strong>in</strong>ternational price <strong>of</strong> petroleum. The explanation forthis lies <strong>in</strong> <strong>the</strong> different policies <strong>of</strong> countries to set domestic prices and taxes.Three basic mechanisms are used <strong>in</strong> policies to establish domestic prices: (i) ad hoc decisions; (ii) automaticadjustments determ<strong>in</strong>ed by formulas; and (iii) market prices. The first mechanism is what occurs whenprices are adjusted by <strong>the</strong> government or by oil companies that are directly or <strong>in</strong>directly controlled by <strong>the</strong>government, as a function <strong>of</strong> political or macroeconomic concerns. Readjustments are usually made at irregular<strong>in</strong>tervals <strong>of</strong> time, us<strong>in</strong>g non-transparent criteria, and this leads to prices that move out <strong>of</strong> step with<strong>in</strong>ternational ones. Ch<strong>in</strong>a, India and Indonesia are examples <strong>of</strong> countries that use such a mechanism. UnderBrazilian law, gasol<strong>in</strong>e and diesel prices are free, but <strong>in</strong> <strong>the</strong> last few years diesel and gasol<strong>in</strong>e price adjustmentsmade by Petrobras have used this mechanism, ei<strong>the</strong>r for political <strong>in</strong>terests <strong>of</strong> <strong>the</strong> government or for<strong>the</strong> economic <strong>in</strong>terest <strong>of</strong> <strong>the</strong> government-controlled corporation.The second mechanism – used for example <strong>in</strong> Malaysia and Vietnam – is based on formulas that are predef<strong>in</strong>edby <strong>the</strong> government or <strong>the</strong> national petrol company. These formulas readjust prices automatically,at pre-def<strong>in</strong>ed periodic <strong>in</strong>tervals, based on <strong>the</strong> behavior <strong>of</strong> <strong>in</strong>ternational prices. Compared with an ad hocsystem, readjustment by this mechanism has <strong>the</strong> advantage that domestic prices follow <strong>the</strong> <strong>in</strong>ternationalmarket, albeit with some delay, <strong>in</strong> addition to be<strong>in</strong>g transparent and predictable.F<strong>in</strong>ally, under <strong>the</strong> third mechanism, adopted <strong>in</strong> <strong>the</strong> majority <strong>of</strong> countries that are members <strong>of</strong> <strong>the</strong> Organizationfor Economic Cooperation and Development (OECD) iii , prices are a consequence <strong>of</strong> <strong>the</strong> <strong>in</strong>terplay <strong>of</strong>market forces. In <strong>the</strong>se countries, <strong>the</strong> role <strong>of</strong> <strong>the</strong> government is restricted to tax<strong>in</strong>g fossil fuels.Generally speak<strong>in</strong>g, two types <strong>of</strong> taxes are levied on automotive fuels <strong>in</strong> consum<strong>in</strong>g countries: specifictributes for fuels (excise taxes or duties, and transportation taxes), for example Brazil’s federal fuel levyknown as <strong>the</strong> CIDE (literally, <strong>the</strong> Contribution <strong>of</strong> Intervention <strong>in</strong> <strong>the</strong> Economic Doma<strong>in</strong>); and value addedtaxes (VAT), which also apply to <strong>the</strong> sale <strong>of</strong> o<strong>the</strong>r products – <strong>the</strong> Brazilian ICMS state-level tax is an example.The specific taxes have fixed values and apply to volumes sold, while VAT is fixed as a percentage <strong>of</strong> <strong>the</strong>f<strong>in</strong>al price <strong>of</strong> fuels, and <strong>the</strong>refore impacts <strong>the</strong> sell<strong>in</strong>g price. There are also taxes on <strong>the</strong> ownership and use<strong>of</strong> vehicles, such as Brazil’s IPVA, and <strong>the</strong> congestion taxes that are used <strong>in</strong> some European countries, but<strong>the</strong>se do not affect <strong>the</strong> f<strong>in</strong>al price <strong>of</strong> fuels.In a comparison between fuel prices – with and without taxation – <strong>in</strong> OECD countries, <strong>the</strong> Institut Françaisdes Relations Internationales (IFRI) showed that tax-free prices do not reveal significant variations, giventhat oil derivatives are commodities (Davoust, R., 2008). The IFRI thus demonstrated that <strong>the</strong> differencesbetween consumer prices are caused ma<strong>in</strong>ly by national tax policies, while differences <strong>in</strong> costs and marg<strong>in</strong>shave little <strong>in</strong>fluence compared to taxes.
International Bi<strong>of</strong>uels Policies199This same conclusion was reached by GTZ (now GIZ) <strong>in</strong> a series <strong>of</strong> studies <strong>of</strong> consumer prices and tax levelsfor diesel and gasol<strong>in</strong>e <strong>in</strong> several countries s<strong>in</strong>ce 1991 (GTZ, 2009). Based on <strong>the</strong> level <strong>of</strong> tax <strong>in</strong> f<strong>in</strong>al consumerprices for gasol<strong>in</strong>e and diesel, GTZ (GTZ, 2009) grouped countries <strong>in</strong> four categories, as shown <strong>in</strong>Graph 3 and Graph 4 iv :Category 1 – countries with high tax <strong>in</strong>centives v : These are countries where consumer prices for derivativesare below <strong>the</strong> <strong>in</strong>ternational oil price. In o<strong>the</strong>r words, product prices do not cover <strong>the</strong> opportunity cost <strong>of</strong>oil and <strong>the</strong> costs <strong>of</strong> derivatives production. In general <strong>the</strong>se are oil-produc<strong>in</strong>g countries where <strong>the</strong> cost <strong>of</strong>derivatives production is subsidized by <strong>the</strong> national oil <strong>in</strong>dustry and fuel prices are used to control <strong>in</strong>flationand avoid public dissatisfaction. Examples <strong>in</strong>clude Venezuela, Libya and Saudi Arabia. Bi<strong>of</strong>uels penetration<strong>in</strong> such countries is practically impossible. Given <strong>the</strong>ir abundant low-cost oil, only non-market objectivessuch as local and global environmental questions could motivate any bi<strong>of</strong>uel promotion policy.Category 2 – countries with tax <strong>in</strong>centives: These are countries where diesel and gasol<strong>in</strong>e consumer pricesare above <strong>in</strong>ternational oil prices but below <strong>the</strong> sell<strong>in</strong>g price <strong>in</strong> <strong>the</strong> United States vi , which is a country thatpractices market prices for derivatives with a m<strong>in</strong>imum <strong>of</strong> tax. Fuel prices <strong>in</strong> <strong>the</strong>se countries cover <strong>the</strong> rawmaterial costs but receive tax <strong>in</strong>centives to cover o<strong>the</strong>r costs <strong>in</strong> <strong>the</strong> supply cha<strong>in</strong>. As shown <strong>in</strong> Graph 3 andGraph 4, <strong>in</strong> some <strong>of</strong> <strong>the</strong>se countries gasol<strong>in</strong>e and diesel prices are below market prices practiced <strong>in</strong> <strong>the</strong> Gulf<strong>of</strong> Mexico. As <strong>in</strong> Category 1, this group also <strong>in</strong>cludes oil-produc<strong>in</strong>g countries where significant tax <strong>in</strong>centiveswould be necessary for bi<strong>of</strong>uels promotion, which would only be justified by non-market objectives.Category 3 –countries with high taxation vii : These are countries where prices lie between <strong>the</strong> U.S. and thosepracticed <strong>in</strong> Spa<strong>in</strong>, which <strong>in</strong> November 2008 had <strong>the</strong> lowest derivatives prices <strong>of</strong> countries <strong>in</strong> <strong>the</strong> EU-15 viii .In addition to Spa<strong>in</strong>’s own taxes, fuel prices <strong>in</strong> that country are impacted by <strong>the</strong> mandatory m<strong>in</strong>imum values<strong>of</strong> VAT and <strong>the</strong> specific taxes on fuels that apply to every EU member. Taxation <strong>in</strong> countries with<strong>in</strong> thiscategory exceeds US$0.10/liter and has o<strong>the</strong>r purposes <strong>in</strong> addition to road construction and ma<strong>in</strong>tenance.In some countries <strong>in</strong> <strong>the</strong> category, fuel prices are not a result <strong>of</strong> market forces; ra<strong>the</strong>r <strong>the</strong>y are establishedad hoc by <strong>the</strong> government or an oil company controlled by <strong>the</strong> government. In this case, derivatives salesgenerate more <strong>in</strong>come than is required to cover production and distribution costs. Appropriation <strong>of</strong> this<strong>in</strong>come by <strong>the</strong> government has <strong>the</strong> same role as taxation. Concession <strong>of</strong> tax <strong>in</strong>centives would be necessaryfor bi<strong>of</strong>uels to be viable <strong>in</strong> <strong>the</strong>se countries.Category 4 –countries with very high taxation: These are countries where prices are above <strong>the</strong> level <strong>in</strong>Spa<strong>in</strong>. In <strong>the</strong>se countries, fuel taxation has many objectives such as construct<strong>in</strong>g and ma<strong>in</strong>ta<strong>in</strong><strong>in</strong>g roads,generat<strong>in</strong>g <strong>in</strong>come, encourag<strong>in</strong>g efficiency <strong>in</strong> <strong>the</strong> transportation sector and <strong>in</strong>ternaliz<strong>in</strong>g <strong>the</strong> environmentalcosts <strong>of</strong> <strong>the</strong> production and use <strong>of</strong> fuels and vehicles. These countries <strong>of</strong>fer high potential for <strong>the</strong> <strong>in</strong>troduction<strong>of</strong> bi<strong>of</strong>uels without requir<strong>in</strong>g elevated tax <strong>in</strong>centives.The last survey <strong>of</strong> gasol<strong>in</strong>e and diesel prices <strong>in</strong> 172 countries undertaken by GTZ <strong>in</strong> November <strong>of</strong> 2008 (GTZ,2009) <strong>in</strong>dicated that, <strong>in</strong> <strong>the</strong> case <strong>of</strong> gasol<strong>in</strong>e, eight countries fell <strong>in</strong>to category 1; 12 <strong>in</strong>to category 2; 86 <strong>in</strong>to
200 Ethanol and Bioelectricity <strong>Sugarcane</strong> <strong>in</strong> <strong>the</strong> <strong>Future</strong> <strong>of</strong> <strong>the</strong> <strong>Energy</strong> <strong>Matrix</strong>Graph 3 Comparison <strong>of</strong> consumer prices for gasol<strong>in</strong>e US cents/liter; November 2008Ch<strong>in</strong>a, Hong KongNorwayItalyF<strong>in</strong>landGermanyFranceUnited K<strong>in</strong>gdomPeruJapanSwedenIsraelSwitzerlandBrazilSpa<strong>in</strong>UruguayParaguayIcelandIndiaColombiaCh<strong>in</strong>aChilePhillip<strong>in</strong>esRussian FederationThailandSouth AfricaArgent<strong>in</strong>aCanadaMexicoAustraliaBoliviaJordanUSAEcuadorIndonesiaArab Em.OmanKuwaitSaudi ArabiaLibyaIranVenezuelaHigh Subsidies Subsidies High Taxation Extremely High TaxationInternationalprice <strong>of</strong> oilPrice <strong>of</strong>gasol<strong>in</strong>e <strong>in</strong><strong>the</strong> U.S. GulfPrice <strong>of</strong>gasol<strong>in</strong>e <strong>in</strong> <strong>the</strong>United StatesPrice <strong>of</strong>gasol<strong>in</strong>e <strong>in</strong>Spa<strong>in</strong>0 20 40 60 80 100 120 140 160 180 200Source: Prepared by <strong>the</strong> authors from GTZ (2009).
International Bi<strong>of</strong>uels Policies201Comparison <strong>of</strong> consumer prices for diesel US cents/liter; November 2008Graph 4IsraelUnited K<strong>in</strong>gdomNorwayItalyGermanySwitzerlandSwedenFranceF<strong>in</strong>landIcelandJapanSpa<strong>in</strong>UruguayCh<strong>in</strong>a, Hong KongBrazilCh<strong>in</strong>aPeruParaguaySouth AfricaChileAustraliaCanadaRussian FederationPhillip<strong>in</strong>esUSAColombiaIndiaThailandArab Em.JordanArgent<strong>in</strong>aMexicoBoliviaIndonesiaOmanEcuadorKuwaitLibyaSaudi ArabiaIranVenezuelaHigh Subsidies Subsidies High Taxation Extremely High TaxationInternationalprice <strong>of</strong>petroleumPrice <strong>of</strong>gasol<strong>in</strong>e <strong>in</strong><strong>the</strong> U.S. GulfPrice <strong>of</strong>diesel <strong>in</strong> <strong>the</strong>United StatesPrice <strong>of</strong>diesel <strong>in</strong>Spa<strong>in</strong>0 15 30 45 60 75 90 105 120 135 150 165Source: Prepared by <strong>the</strong> authors from GTZ (2009).
202 Ethanol and Bioelectricity <strong>Sugarcane</strong> <strong>in</strong> <strong>the</strong> <strong>Future</strong> <strong>of</strong> <strong>the</strong> <strong>Energy</strong> <strong>Matrix</strong>category 3; and 66 <strong>in</strong>to category 4. Diesel, on <strong>the</strong> o<strong>the</strong>r hand, saw 12 countries <strong>in</strong> category 1; 30 <strong>in</strong> category2; 81 <strong>in</strong> category 3; and 49 <strong>in</strong> category 4. In that month, Brazil fell <strong>in</strong>to category 4 for gasol<strong>in</strong>e and category3 for diesel. It must be remembered, however, that <strong>the</strong> GTZ survey was conducted after <strong>the</strong> beg<strong>in</strong>n<strong>in</strong>g <strong>of</strong> <strong>the</strong>global economic crisis, when free-market prices <strong>of</strong> <strong>the</strong>se derivatives were <strong>in</strong> free fall around <strong>the</strong> world, butPetrobras had not made any adjustment to domestic prices.2 Analysis <strong>of</strong> <strong>in</strong>ternational policies for bi<strong>of</strong>uels promotionMany countries have <strong>in</strong> recent decades found that us<strong>in</strong>g bi<strong>of</strong>uels for automotive purposes represents acontribution to <strong>the</strong> solution <strong>of</strong> important issues, such as: (i) <strong>in</strong>creas<strong>in</strong>g energy efficiency and flexibility, anddiversify<strong>in</strong>g available energy sources; (ii) improv<strong>in</strong>g <strong>the</strong> country’s ability to rapidly respond to emergencysituations that affect fuel supply, such as price shocks or temporary <strong>in</strong>terruption <strong>of</strong> supply for security reasons;(iii) promot<strong>in</strong>g <strong>the</strong> use <strong>of</strong> energy sources that are renewable and less harmful to <strong>the</strong> environment,especially with respect to GHG emissions; and (iv) exploit<strong>in</strong>g <strong>the</strong> country’s comparative advantages, promot<strong>in</strong>gdevelopment and <strong>the</strong> exportation <strong>of</strong> new technologies and products.Governments have adopted three ma<strong>in</strong> <strong>in</strong>struments to promote <strong>the</strong> use <strong>of</strong> bi<strong>of</strong>uels: <strong>in</strong>struments <strong>of</strong> commandand control; economic <strong>in</strong>struments; and import restrictions. Instruments <strong>of</strong> command and controlhave been applied s<strong>in</strong>ce <strong>the</strong> 1980s, and are regulatory standards that imply, for example, a requirementfor bi<strong>of</strong>uel mixtures or <strong>the</strong> production <strong>of</strong> vehicles for its use. This category also <strong>in</strong>cludes vehicle emissionstandards, fuel specifications and m<strong>in</strong>imum efficiency standards for vehicles.Economic <strong>in</strong>struments <strong>in</strong>clude f<strong>in</strong>ancial <strong>in</strong>centives, special tax structures and negotiable certificates forbi<strong>of</strong>uel mixtures. F<strong>in</strong>ancial <strong>in</strong>centives and special tax structures have been used <strong>in</strong> several countries s<strong>in</strong>ce<strong>the</strong> beg<strong>in</strong>n<strong>in</strong>g <strong>of</strong> <strong>the</strong> 1990s as a way to achieve environmental goals. They can take <strong>the</strong> form <strong>of</strong> tax credits,government tax <strong>in</strong>centives or loans with special conditions, and <strong>the</strong>ir purpose is to reduce <strong>the</strong> cost <strong>of</strong>produc<strong>in</strong>g alternative fuels and acquir<strong>in</strong>g vehicles that run on <strong>the</strong>m. In general, f<strong>in</strong>ancial <strong>in</strong>centives andregulatory standards are applied toge<strong>the</strong>r.Special tax structures are conceived to place a greater tax burden on fossil fuels. They are usually applied viapolicy changes that create or <strong>in</strong>crease taxes on pollutant sources and agents, accord<strong>in</strong>g to <strong>the</strong> externalitiesthat <strong>the</strong>se produce. Environmental taxes differ from f<strong>in</strong>ancial <strong>in</strong>centives <strong>in</strong> two ways. First <strong>of</strong> all, <strong>the</strong>y do notimply cost for <strong>the</strong> government; on <strong>the</strong> contrary, <strong>the</strong>y generate funds that can be used to reduce o<strong>the</strong>r taxesor to f<strong>in</strong>ance environmental and social programs. The second difference relates to <strong>the</strong> signal sent to consumersabout <strong>the</strong> externalities <strong>in</strong>volved <strong>in</strong> vehicle use, which are <strong>in</strong>ternalized by <strong>the</strong> tax. Faced with higherprices, <strong>the</strong> consumer adjusts his demand or chooses to use less pollutant technologies or fuels.The use <strong>of</strong> certificates has been adopted <strong>in</strong> environmental programs <strong>in</strong> <strong>the</strong> United States and Europeancountries, toge<strong>the</strong>r with regulatory standards. These standards require, for example, that electricity distributorsor generators or, alternatively, consumers <strong>the</strong>mselves, use a m<strong>in</strong>imum percentage <strong>of</strong> renewable
International Bi<strong>of</strong>uels Policies203fuels to meet <strong>the</strong> demand <strong>of</strong> electricity. The imposition <strong>of</strong> standards is accompanied by <strong>the</strong> <strong>in</strong>troduction<strong>of</strong> negotiable certificates that are supplied to <strong>the</strong> agents accord<strong>in</strong>g to <strong>the</strong>ir fulfillment <strong>of</strong> <strong>the</strong> requiredstandards. This means that agents who can acquire renewable energy more cheaply can sell <strong>the</strong>ir surpluscertificates to o<strong>the</strong>rs that face higher costs <strong>in</strong> meet<strong>in</strong>g <strong>the</strong>ir targets.Import restrictions are geared to protect<strong>in</strong>g domestic bi<strong>of</strong>uel producers, <strong>in</strong> particular via <strong>the</strong> <strong>in</strong>troduction<strong>of</strong> import tariffs or restrictions on <strong>the</strong> concession <strong>of</strong> f<strong>in</strong>ancial <strong>in</strong>centives for imported products. This barrierhas low economic efficiency because it imposes greater costs on <strong>the</strong> consumer by creat<strong>in</strong>g a market reserveand limit<strong>in</strong>g competition among suppliers. The fact is that if <strong>the</strong>re were no restrictions on <strong>in</strong>ternationalcommerce, <strong>the</strong>re would be a faster fall <strong>in</strong> bi<strong>of</strong>uel costs and economic efficiency would <strong>in</strong>crease, so help<strong>in</strong>gspeed up <strong>the</strong> reduction <strong>of</strong> fossil fuel use.In <strong>the</strong> follow<strong>in</strong>g pages, we discuss <strong>the</strong> application <strong>of</strong> <strong>the</strong>se policies <strong>in</strong> <strong>the</strong> United States and <strong>the</strong> EuropeanUnion. The United States was chosen because <strong>of</strong> <strong>the</strong> size <strong>of</strong> its market for vehicle fuel, both fossil and renewable,especially <strong>in</strong> <strong>the</strong> case <strong>of</strong> ethanol. The country also represents a good example <strong>of</strong> <strong>the</strong> application<strong>of</strong> regulatory standards and f<strong>in</strong>ancial <strong>in</strong>centives to promote <strong>the</strong> production and use <strong>of</strong> bi<strong>of</strong>uel.Policies <strong>in</strong> effect <strong>in</strong> <strong>the</strong> European Union are discussed via <strong>the</strong> analysis <strong>of</strong> <strong>the</strong> situation <strong>in</strong> three memberstates: Sweden, <strong>the</strong> United K<strong>in</strong>gdom and Germany. While Sweden does not have a large fuel marketcompared to <strong>the</strong> o<strong>the</strong>r countries analyzed, it has one <strong>of</strong> <strong>the</strong> most ambitious bi<strong>of</strong>uel promotion policies,especially for ethanol. Thanks to its relatively small fuel market – toge<strong>the</strong>r with its high level <strong>of</strong> economicand social development, and <strong>the</strong> environmental awareness <strong>of</strong> its population – this country has <strong>in</strong>troduced<strong>in</strong>novative policies to reduce, if not elim<strong>in</strong>ate, <strong>the</strong> use <strong>of</strong> fossil fuels.The United K<strong>in</strong>gdom, on <strong>the</strong> o<strong>the</strong>r hand, is a relevant example <strong>of</strong> <strong>the</strong> use <strong>of</strong> a bi<strong>of</strong>uels program supportedby <strong>the</strong> <strong>in</strong>troduction <strong>of</strong> blend certificates.Germany was selected because <strong>of</strong> its <strong>in</strong>centive policies for biodiesel. These place Germany first amongbiodiesel producers and consumers. The country’s programs <strong>in</strong>itially provided heavy subsidies for biodieseluse, but have now entered a new phase with <strong>the</strong> use <strong>of</strong> regulatory standards and economic <strong>in</strong>struments.F<strong>in</strong>ally, we discuss <strong>the</strong> history <strong>of</strong> Brazilian policies for ethanol promotion and <strong>in</strong>dicate <strong>the</strong> necessary requirementsfor implant<strong>in</strong>g a new national bi<strong>of</strong>uel policy.2.1 Bi<strong>of</strong>uel policies <strong>in</strong> <strong>the</strong> United StatesThe United States has s<strong>in</strong>ce 2005 occupied first place <strong>in</strong> <strong>the</strong> global production <strong>of</strong> ethanol, followed by Brazil.American ethanol is produced almost entirely from corn and is consumed domestically, above all as anoxygenator mixed with gasol<strong>in</strong>e <strong>in</strong> proportions up to 10%. In 2009, ethanol consumption <strong>in</strong> <strong>the</strong> U.S. was40.7 billion liters, represent<strong>in</strong>g almost 8.5% <strong>of</strong> <strong>the</strong> fuel market for Otto cycle vehicles.
204 Ethanol and Bioelectricity <strong>Sugarcane</strong> <strong>in</strong> <strong>the</strong> <strong>Future</strong> <strong>of</strong> <strong>the</strong> <strong>Energy</strong> <strong>Matrix</strong>The United States is a good example <strong>of</strong> <strong>the</strong> comb<strong>in</strong>ed application <strong>of</strong> regulatory standards and f<strong>in</strong>ancial<strong>in</strong>centives to promote bi<strong>of</strong>uels. The 2005 <strong>Energy</strong> Policy Act (EPAct 2005) constitutes extensive legislationon energy, and establishes <strong>in</strong> Section 1501 a mandate for ref<strong>in</strong>eries, blenders, distributors and importers toadd renewable fuels to gasol<strong>in</strong>e. The Renewable Fuel Standard (RFS1) provided that <strong>the</strong> use <strong>of</strong> renewablefuels – which began <strong>in</strong> 2006, at four billion gallons or approximately 15 billion liters annually – should progressto 7.5 billion gallons by 2012. The regulation and implementation <strong>of</strong> this mandate is <strong>the</strong> responsibility<strong>of</strong> <strong>the</strong> Environmental Protection Agency (EPA), which must also def<strong>in</strong>e <strong>the</strong> percentage renewable fuel blend<strong>in</strong> gasol<strong>in</strong>e, based on <strong>the</strong> gasol<strong>in</strong>e demand <strong>in</strong> <strong>the</strong> country each year.In December <strong>of</strong> 2007, <strong>the</strong> U.S. Congress passed <strong>the</strong> <strong>Energy</strong> Independence and Security Act (EISA), creat<strong>in</strong>ga new program which became known as RFS2. Once aga<strong>in</strong>, <strong>the</strong> EPA was given <strong>the</strong> responsibility <strong>of</strong> regulat<strong>in</strong>g<strong>the</strong> alterations. On May 26 th , 2009, <strong>the</strong> agency submitted for public hear<strong>in</strong>g a document entitledRegulation <strong>of</strong> Fuels and Fuel Additives: Changes to Renewable Fuel Standard Program. The hear<strong>in</strong>g deadl<strong>in</strong>ewas September 25 th 2009, but <strong>the</strong> EPA only <strong>of</strong>ficially published <strong>the</strong> f<strong>in</strong>al version <strong>of</strong> <strong>the</strong> RFS2 regulation onMarch 26 th , 2010, over two years after Congress created RFS2. This delay was caused by <strong>the</strong> great controversygenerated about how to calculate emissions associated with bi<strong>of</strong>uels production.One important change <strong>in</strong>troduced by RFS2 was <strong>the</strong> <strong>in</strong>crease <strong>in</strong> mandatory volumes <strong>of</strong> renewable fuels. Asshown <strong>in</strong> Graph 5, <strong>the</strong> new program extended <strong>the</strong> timel<strong>in</strong>e for <strong>in</strong>creas<strong>in</strong>g <strong>the</strong> use <strong>of</strong> renewable fuels toreach 136 billion liters <strong>in</strong> 2022. RFS2 also establishes that a grow<strong>in</strong>g proportion <strong>of</strong> <strong>the</strong> annual volume <strong>of</strong>renewable fuels consumed must be advanced bi<strong>of</strong>uels, and <strong>the</strong>y must <strong>in</strong>clude m<strong>in</strong>imum volumes <strong>of</strong> cellulosicbi<strong>of</strong>uel and biodiesel produced from biomass. Although <strong>the</strong>re is a significant <strong>in</strong>crease <strong>in</strong> renewablefuel volumes, RFS2 allows for <strong>the</strong> possible substitution <strong>of</strong> all types <strong>of</strong> fuels <strong>in</strong> all types <strong>of</strong> vehicles <strong>in</strong>clud<strong>in</strong>glocomotives, vessels and aircrafts, as well as fuels used <strong>in</strong> stand-alone eng<strong>in</strong>es, whereas RFS1 provided onlyfor <strong>the</strong> substitution <strong>of</strong> gasol<strong>in</strong>e.In order to be classified as a renewable fuel, advanced bi<strong>of</strong>uel, cellulosic bi<strong>of</strong>uel or biomass bi<strong>of</strong>uel, and<strong>the</strong>reby qualify for <strong>in</strong>clusion <strong>in</strong> <strong>the</strong> respective annual volumes, <strong>the</strong> fuels must achieve m<strong>in</strong>imum percentagelifecycle reductions <strong>of</strong> GHG emissions compared to <strong>the</strong> gasol<strong>in</strong>e and diesel used <strong>in</strong> <strong>the</strong> United States <strong>in</strong>2005. Accord<strong>in</strong>g to EISA, renewable fuels produced <strong>in</strong> mills whose construction was started after December19 th , 2007 must achieve m<strong>in</strong>imum emission reductions <strong>of</strong> 20%, while advanced bi<strong>of</strong>uels and biodieselmust reach 50% and cellulosic ethanol 60%.To determ<strong>in</strong>e <strong>the</strong> emission reductions generated by bi<strong>of</strong>uels, <strong>the</strong> EPA relies on its own analysis and also <strong>the</strong>best available scientific models. It has <strong>in</strong>corporated many changes to <strong>the</strong> model <strong>in</strong>itially proposed, based onpublic comments and <strong>the</strong> formal revision process undertaken by <strong>the</strong> agency. EPA analyses consider emissionsthroughout a fuel’s lifecycle. This <strong>in</strong>cludes emissions caused by direct and <strong>in</strong>direct land use change(ILUC) <strong>in</strong> o<strong>the</strong>r countries that are caused by <strong>the</strong> production <strong>of</strong> renewable fuels <strong>in</strong> <strong>the</strong> United States. Becausea fuel’s lifecycle GHG emissions occur over <strong>the</strong> course <strong>of</strong> time, <strong>the</strong> EPA presented two proposals to takeaccount <strong>of</strong> <strong>the</strong> temporal nature <strong>of</strong> emissions: analysis for a 30-year horizon, without weight<strong>in</strong>g presentand future emissions; and an analysis for a 100-year horizon, <strong>in</strong> which future emissions are discounted at
International Bi<strong>of</strong>uels Policies205an annual rate <strong>of</strong> 2%. In <strong>the</strong> end, however, <strong>the</strong> EPA decided to only use <strong>the</strong> 30-year horizon, without anydiscount.F<strong>in</strong>al regulations for RFS2 were announced <strong>in</strong> February 2010 and <strong>the</strong> EPA designated sugarcane ethanol asan advanced bi<strong>of</strong>uel, capable <strong>of</strong> reduc<strong>in</strong>g greenhouse gas emissions by at least 50% compared to gasol<strong>in</strong>e.The EPA also confirmed that Brazilian ethanol achieves GHG emission reductions that exceed <strong>the</strong> m<strong>in</strong>imumrequirements for all categories. The EPA’s calculation shows an average reduction <strong>of</strong> 61% when comparedto gasol<strong>in</strong>e, us<strong>in</strong>g a 30-year period to compensate emissions related to <strong>in</strong>direct effects <strong>of</strong> land use (ILUC).Corn ethanol reduces emissions by 21% us<strong>in</strong>g best <strong>in</strong>dustry practices (i.e. electricity generated with naturalgas), but <strong>the</strong> American average is still well below that, as shown <strong>in</strong> Graph 6.The status achieved by Brazilian sugarcane ethanol undoubtedly opens w<strong>in</strong>dows <strong>of</strong> opportunity for thisbi<strong>of</strong>uel, given <strong>the</strong> uncerta<strong>in</strong>ties that surround <strong>the</strong> ability <strong>of</strong> <strong>the</strong> United States to produce advanced bi<strong>of</strong>uelon a commercial scale <strong>in</strong> <strong>the</strong> short term.This means that <strong>the</strong> criteria for emission reductions established by <strong>the</strong> EPA to classify bi<strong>of</strong>uels, if ma<strong>in</strong>ta<strong>in</strong>ed,open a w<strong>in</strong>dow <strong>of</strong> opportunity for Brazilian ethanol, given that <strong>the</strong> deficit <strong>of</strong> American ethanolwould lend weight to <strong>the</strong> argument <strong>of</strong> those people – <strong>in</strong>clud<strong>in</strong>g many <strong>in</strong> several U.S. states – who defend<strong>the</strong> reduction or even elim<strong>in</strong>ation <strong>of</strong> <strong>the</strong> current import taxes on <strong>the</strong> Brazilian product.Graph 536Comparison between required volumes <strong>of</strong> renewable fuels <strong>in</strong> RFS and <strong>in</strong> RFS2In billions gallons*3228242016128402006 2007 2008 2009 2010 2011 2012 2013 2014 2015 2016 2017 2018 2019 2020 2021 2022n RFS n RFS2 conventional renewable fuel n RFS2 m<strong>in</strong>imum volume <strong>of</strong> advanced bi<strong>of</strong>uelsSource: Prepared by <strong>the</strong> authors from EPA (2009) and RFA (2009a).*one gallon = 3.791 liters
206 Ethanol and Bioelectricity <strong>Sugarcane</strong> <strong>in</strong> <strong>the</strong> <strong>Future</strong> <strong>of</strong> <strong>the</strong> <strong>Energy</strong> <strong>Matrix</strong>In addition to RFS2, U.S. federal and state laws deal<strong>in</strong>g with air quality and fuel specifications also haveplayed a determ<strong>in</strong>ant role <strong>in</strong> <strong>the</strong> country’s use <strong>of</strong> ethanol. At <strong>the</strong> federal level, <strong>the</strong> 1990 Clean Air Act (CAA1990) mandated <strong>the</strong> use <strong>of</strong> oxygenated gasol<strong>in</strong>e (reformulated gasol<strong>in</strong>e) <strong>in</strong> some regions <strong>of</strong> <strong>the</strong> country,aim<strong>in</strong>g to reduce emissions <strong>of</strong> carbon monoxide. Gasol<strong>in</strong>e suppliers <strong>in</strong>itially opted for <strong>the</strong> addition <strong>of</strong> methyltert-butyl-e<strong>the</strong>r (MTBE) to gasol<strong>in</strong>e as an oxygenator because it is cheaper than U.S. ethanol, until evidenceshowed that MTBE poses a risk <strong>of</strong> groundwater contam<strong>in</strong>ation and is carc<strong>in</strong>ogenic. Several U.S. states<strong>the</strong>refore banned its use, lead<strong>in</strong>g to a rapid acceleration <strong>in</strong> <strong>the</strong> use <strong>of</strong> ethanol as a substitute.Thanks to environmental legislation, <strong>the</strong> addition <strong>of</strong> 10% ethanol <strong>in</strong> gasol<strong>in</strong>e (E10) has now become mandatory<strong>in</strong> several U.S. states ix , and is optional <strong>in</strong> all o<strong>the</strong>rs. The blend <strong>of</strong> up to 10% is found at regular fuel<strong>in</strong>gstations. A voluntary 85% ethanol blend (E85) is also used, but is found <strong>in</strong> a few stations, <strong>in</strong> part becausevery few vehicles have <strong>the</strong> compatible technology to use it. On <strong>the</strong> o<strong>the</strong>r hand, <strong>the</strong> biodiesel blend withdiesel <strong>in</strong> proportions from 2% to 100% is optional <strong>in</strong> all states.To support <strong>the</strong> mandatory measures established under U.S. law, federal programs provide tax credits t<strong>of</strong>uel blenders and bi<strong>of</strong>uel producers, as summarized <strong>in</strong> Table 2. Incentive values are significant. Accord<strong>in</strong>gto Koplow (2009), tax <strong>in</strong>centives applicable to conventional ethanol could add up to US$0.60 to US$0.79per gallon <strong>in</strong> April 2009, while <strong>the</strong> amount for cellulosic ethanol was US$2.26 to US$2.46/gallon. As forGraph 6Lower greenhouse gas emissionsAverage reduction <strong>of</strong> greenhouse gas emissions <strong>in</strong> <strong>the</strong> lifecycle <strong>of</strong> corn ethanol and sugarcane ethanol, <strong>in</strong>clud<strong>in</strong>gemissions from direct and <strong>in</strong>direct land-use change (LUC and ILUC), with 0% discount and a 30-year horizon0-10%-20%-21%-30%-40%-50%-60%-61%-59%-70%-80%-90%-91%-89%-100%Corn ethanol,us<strong>in</strong>g electricitygenerated fromnatural gas<strong>Sugarcane</strong>ethanol, withoutstraw collection,dehydrated, <strong>in</strong>Brazil<strong>Sugarcane</strong>ethanol, withoutstraw collection,dehydrated, <strong>in</strong><strong>the</strong> Caribbean<strong>Sugarcane</strong>ethanol, withstraw collection,dehydrated, <strong>in</strong>Brazil (withoutILUC)<strong>Sugarcane</strong>ethanol, withstraw collection,dehydrated, <strong>in</strong><strong>the</strong> Caribbean(without ILUC)Source: U.S. Environmental Protection Agency (March 2010), prepared by <strong>the</strong> authors.
International Bi<strong>of</strong>uels Policies207biodiesel, <strong>the</strong> sum <strong>of</strong> tax <strong>in</strong>centives could reach US$2.22 to US$2.65 per gallon. By way <strong>of</strong> comparison,<strong>the</strong> average price <strong>of</strong> U.S. gasol<strong>in</strong>e <strong>in</strong> April 2009 was US$2.049 per gallon and diesel US$2.225 per gallon,<strong>in</strong>clud<strong>in</strong>g federal and state taxes that on average totaled US$0.47 to US$0.514 per gallon.Although <strong>the</strong> <strong>in</strong>centive given to gasol<strong>in</strong>e blenders (VEETC) does not discrim<strong>in</strong>ate <strong>the</strong> source <strong>of</strong> ethanol,<strong>the</strong> U.S. product is favored by <strong>the</strong> application <strong>of</strong> customs taxes on imports. An ad valorem tariff <strong>of</strong> 2.5%is levied on imported ethanol, which is low when compared to <strong>the</strong> rates prevail<strong>in</strong>g <strong>in</strong> o<strong>the</strong>r countries, but<strong>in</strong> addition <strong>the</strong>re is an extraord<strong>in</strong>ary tax <strong>of</strong> US$0.54 per gallon, which exceeds by 20% <strong>the</strong> US$0.45 pergallon VEETC credit. Only <strong>the</strong> ethanol from countries that have concluded bilateral trade agreements with<strong>the</strong> United States is excluded from this tax; such countries <strong>in</strong>clude members <strong>of</strong> <strong>the</strong> North American FreeTrade Agreement (NAFTA) and those <strong>in</strong>cluded <strong>in</strong> trade preference programs created by Congress, such as<strong>the</strong> Caribbean Bas<strong>in</strong> Initiative and <strong>the</strong> Andean Trade Preference. Ethanol imported from Brazil does not fit<strong>in</strong>to any <strong>of</strong> <strong>the</strong>se situations, and is <strong>the</strong>refore fully taxed.In April <strong>of</strong> 2009, <strong>the</strong> <strong>Energy</strong> Information Agency <strong>of</strong> <strong>the</strong> United States published <strong>the</strong> Updated Annual <strong>Energy</strong>Outlook 2009 x (Updated AEO 09). The document provides a reference scenario for <strong>the</strong> country’s energysector, tak<strong>in</strong>g <strong>in</strong>to account <strong>the</strong> new global economic situation, toge<strong>the</strong>r with <strong>the</strong> effects that <strong>the</strong> AmericanRecovery and Re<strong>in</strong>vestment Act <strong>of</strong> 2009 (ARRA 09) may have on <strong>the</strong> U.S. economy and its energy market.Enacted <strong>in</strong> February <strong>of</strong> 2009, ARRA 09 <strong>in</strong>cludes a package <strong>of</strong> measures from <strong>the</strong> U.S. government to stimulate<strong>the</strong> U.S. economy and m<strong>in</strong>imize <strong>the</strong> effects <strong>of</strong> <strong>the</strong> crisis. Among <strong>the</strong> various measures are several aimedat <strong>in</strong>creas<strong>in</strong>g energy efficiency, reduc<strong>in</strong>g carbon emissions and <strong>in</strong>creas<strong>in</strong>g domestic energy production.Examples <strong>in</strong>clude improvements <strong>in</strong> build<strong>in</strong>gs heat<strong>in</strong>g systems, sett<strong>in</strong>g m<strong>in</strong>imum consumption standards formanufacturers and importers <strong>of</strong> motor vehicles, encourag<strong>in</strong>g <strong>the</strong> acquisition <strong>of</strong> electric and hybrid vehicles,<strong>the</strong> use <strong>of</strong> renewable fuels and <strong>the</strong> use <strong>of</strong> light diesel vehicles. On <strong>the</strong> supply side, ARRA 2009 aims to <strong>in</strong>creasedomestic production <strong>of</strong> petroleum and natural gas, both onshore and <strong>of</strong>fshore.Accord<strong>in</strong>g to <strong>the</strong> updated projections <strong>of</strong> <strong>the</strong> AEO 2009, presented <strong>in</strong> Table 3, <strong>the</strong>re would be a drop <strong>in</strong>gasol<strong>in</strong>e consumption <strong>in</strong> <strong>the</strong> United States <strong>in</strong> 2009 due to <strong>the</strong> global economic crisis. The growth trajectorywould resume <strong>in</strong> 2010 and 2011, with <strong>the</strong> return <strong>of</strong> economic growth. In 2012, however, <strong>the</strong> measuresconta<strong>in</strong>ed <strong>in</strong> ARRA 09 could impact <strong>the</strong> transportation sector, result<strong>in</strong>g <strong>in</strong> a drop <strong>in</strong> gasol<strong>in</strong>e consumptionwhich rema<strong>in</strong>s through <strong>the</strong> end <strong>of</strong> <strong>the</strong> analysis horizon. Ethanol consumption <strong>in</strong> <strong>the</strong> country, however, receivesa positive impact from ARRA 09, caused by <strong>the</strong> <strong>in</strong>crease <strong>in</strong> <strong>the</strong> volumetric percentage <strong>of</strong> <strong>the</strong> ethanolblend <strong>in</strong> gasol<strong>in</strong>e, which grew from 7% <strong>in</strong> 2008 to 10% <strong>in</strong> 2010, rema<strong>in</strong><strong>in</strong>g at that level until 2030.The measures conta<strong>in</strong>ed <strong>in</strong> ARRA 09 also have a positive impact on domestic production <strong>of</strong> ethanol. The<strong>in</strong>crease <strong>in</strong> production <strong>of</strong> this bi<strong>of</strong>uel will reverse <strong>the</strong> present deficit, which is met by imports, and generatean exportable surplus. This surplus will prevail through 2015, when domestic production aga<strong>in</strong> becomes<strong>in</strong>sufficient to meet demand, caus<strong>in</strong>g a new cycle <strong>of</strong> ethanol imports that <strong>in</strong>crease <strong>in</strong> <strong>the</strong> period 2015 –2030 and reach 7.8 million m3, or 16% <strong>of</strong> ethanol demand, <strong>in</strong> 2022.
208 Ethanol and Bioelectricity <strong>Sugarcane</strong> <strong>in</strong> <strong>the</strong> <strong>Future</strong> <strong>of</strong> <strong>the</strong> <strong>Energy</strong> <strong>Matrix</strong>Table 2Ma<strong>in</strong> federal <strong>in</strong>centives for bi<strong>of</strong>uels <strong>in</strong> <strong>the</strong> United StatesIncentives Commentary ValueVolumetric Ethanol Excise TaxCredit (VEETC).Promulgated by <strong>the</strong> America JobsAct (2004).Replaced <strong>the</strong> partial exemption <strong>of</strong>automotive fuels established <strong>in</strong> <strong>the</strong><strong>Energy</strong> Tax Act <strong>of</strong> 1978.Credit for blenders when pay<strong>in</strong>g <strong>the</strong>excise tax on fuels.Calculated on <strong>the</strong> volume <strong>of</strong> ethanol <strong>of</strong>any orig<strong>in</strong>, <strong>in</strong>clud<strong>in</strong>g imported, mixedto gasol<strong>in</strong>e.There are no restrictions as to <strong>the</strong> size<strong>of</strong> <strong>the</strong> factory, market prices or socialor environmental impacts for <strong>the</strong>production <strong>of</strong> methanol.US$0.45 per gallon s<strong>in</strong>ce January 1st,2009 (it was US$0.51 per gallon until<strong>the</strong>n).Values <strong>in</strong> <strong>in</strong>troductory programsvaried between US$0.40 andUS$0.60 per gallon from 1978 to2004.Volumetric Biodiesel Excise Tax Credit(VBETC).Promulgated by <strong>the</strong> America JobsCreation Act (2004).Most recent modifications <strong>in</strong>cluded <strong>in</strong><strong>the</strong> Emergency Economic StabilizationAct <strong>of</strong> 2008 (EESA).Credit for blenders when pay<strong>in</strong>g <strong>the</strong>excise tax on fuels.Excludes biodiesel that is not producedor sold <strong>in</strong> <strong>the</strong> United States, orproduced by co-process<strong>in</strong>g <strong>in</strong> ref<strong>in</strong>eries.Includes biodiesel produced by anyprocess and not only by e<strong>the</strong>rification<strong>of</strong> vegetable and animal oils, except byco-process<strong>in</strong>g <strong>in</strong> petroleum ref<strong>in</strong><strong>in</strong>g.US$1.00 per gallon for every source.Orig<strong>in</strong>ally, US$1.00 per gallon forvegetable and animal grease andUS$0.50 for recycled oils.Renewable Biodiesel Tax Credit.Promulgated by <strong>the</strong> American JobsCreation Act (2004).Credit for <strong>the</strong> producer on <strong>the</strong> payment<strong>of</strong> <strong>in</strong>come tax.Orig<strong>in</strong>ally, a tax credit parallel to <strong>the</strong>VBTEC for producers who, for whateverreason, could not reclaim <strong>the</strong> specifictax credit for fuels.In April 2007, its application wasextended to <strong>in</strong>clude biodiesel producedby <strong>the</strong>rmal depolymerization, which wasnot covered by <strong>the</strong> VBTEC.US$1.00 per gallon for every source.Orig<strong>in</strong>ally, US$1.00 per gallon forvegetable oils and animal grease andUS$0.50 per gallon for recycled oils.Small Producer Tax Credit.Initially authorized by <strong>the</strong> OmnibusBudget Reconciliation Act (1990).The <strong>Energy</strong> Policy Act (2005) doubled<strong>the</strong> annual production capacity <strong>of</strong>plants eligible for fiscal <strong>in</strong>centive from30 million to 60 million gallons.Credit for <strong>the</strong> producer on <strong>the</strong> payment<strong>of</strong> <strong>in</strong>come tax.Any type <strong>of</strong> ethanol and biodiesel.Applicable only to factories with annualcapacity <strong>of</strong> up to 60 million gallons.US$0.10 per gallon for <strong>the</strong> first15 million gallons per year.Producers <strong>of</strong> cellulose ethanol canclaim credit on all 60 million gallons.Production Tax Credit for CellulosicEthanol.Authorized by <strong>the</strong> 2008 Farm Bill.Applicable only to <strong>the</strong> production <strong>of</strong>cellulosic ethanol.US$1.01 per gallon, discount<strong>in</strong>gVEETC if <strong>the</strong> production is dest<strong>in</strong>edto a gasol<strong>in</strong>e blend and <strong>the</strong> SmallProducer Tax Credit <strong>in</strong> case <strong>of</strong> smallproducers.Source: Prepared by <strong>the</strong> authors from DOE (2009), RFA (2009b) and Koplow (2009).
International Bi<strong>of</strong>uels Policies209This scenario, if it occurs, represents an opportunity for Brazilian ethanol exports, <strong>in</strong> particular if one considersthat <strong>the</strong> EIA study does not take <strong>in</strong>to consideration <strong>the</strong> susta<strong>in</strong>ability criteria established by RFS2, which restrict<strong>the</strong> use <strong>of</strong> much <strong>of</strong> <strong>the</strong> ethanol currently produced <strong>in</strong> <strong>the</strong> United States.2.2 Bi<strong>of</strong>uel policies <strong>in</strong> <strong>the</strong> European UnionThe group <strong>of</strong> member states <strong>in</strong> <strong>the</strong> European Union (EU) constitutes <strong>the</strong> world’s greatest producer andconsumer <strong>of</strong> biodiesel. The trade bloc began us<strong>in</strong>g biodiesel <strong>in</strong> <strong>the</strong> 1990s, <strong>in</strong> <strong>the</strong> transportation sector,motivated by <strong>the</strong> rise <strong>in</strong> oil prices. Biodiesel production later made great progress driven by <strong>the</strong> Blair HouseAgreement xi <strong>of</strong> 1992 and by strong fiscal <strong>in</strong>centives, pr<strong>in</strong>cipally <strong>in</strong> Germany.In 2003, as a response to concerns about climate change and energy security, <strong>the</strong> EU approved Directive2003/30 xii . This laid out non-compulsory goals for fossil fuel substitution by bi<strong>of</strong>uels to be pursued by <strong>the</strong>member states through 2010. As shown <strong>in</strong> Table 4, while bi<strong>of</strong>uel participation has grown rapidly <strong>in</strong> <strong>the</strong>EU, it was not enough for <strong>the</strong> bloc to achieve <strong>the</strong> goals def<strong>in</strong>ed <strong>in</strong> <strong>the</strong> guidel<strong>in</strong>es. This happened ma<strong>in</strong>lybecause <strong>the</strong> goals were non-compulsory, with each state be<strong>in</strong>g responsible for decid<strong>in</strong>g which measures itwould adopt to meet those goals.Faced with <strong>the</strong> EU’s poor performance <strong>in</strong> combat<strong>in</strong>g GHG emissions, not just <strong>in</strong> transportation but <strong>in</strong> o<strong>the</strong>rsectors <strong>of</strong> <strong>the</strong> economy, on April 6 th , 2009 <strong>the</strong> European Union Council approved <strong>the</strong> <strong>Energy</strong> and ClimateChange Package (CCP), conta<strong>in</strong><strong>in</strong>g a new strategy to deal with <strong>the</strong> issue <strong>of</strong> energy and climate change.The section <strong>of</strong> this package that sets policy for renewable energy is called The Renewable <strong>Energy</strong> Directive(RED); it was published on June 5th, 2009 and came <strong>in</strong>to effect 20 days later. RED policies must be implementedby EU member states <strong>in</strong> an 18-month period follow<strong>in</strong>g its publication – <strong>in</strong> o<strong>the</strong>r words, by November2010 – when <strong>the</strong>y should be <strong>in</strong>corporated <strong>in</strong> member states’ domestic legislation. Member states werealso required to submit <strong>the</strong>ir national action plans by June 2010.The CCP establishes <strong>the</strong> so-called “20/20/20” landmarks to be achieved by 2020:i A 20% reduction <strong>in</strong> GHG emissions compared to 1990 levels.ii A 20% improvement <strong>in</strong> energy efficiency compared to current projections for 2020.iii A 20% participation <strong>of</strong> renewable energy <strong>in</strong> <strong>the</strong> EU’s energy consumption matrix. It is mandatory forevery member state that part <strong>of</strong> this renewable energy participation be obta<strong>in</strong>ed through <strong>the</strong> m<strong>in</strong>imumlevel <strong>of</strong> 10% renewable energy consumption <strong>in</strong> transportation.It is important to note that, while <strong>the</strong> 20% participation <strong>of</strong> renewable energy <strong>in</strong> total energy consumptionis an overall target for <strong>the</strong> EU, different objectives were set for each member state <strong>in</strong> light <strong>of</strong> <strong>the</strong>ir currenteconomic situation and potential for economic growth. Hence, some states should reach goals higher than20%, while o<strong>the</strong>rs may reach lower targets. The goal for renewable energy participation <strong>in</strong> Sweden, for
210 Ethanol and Bioelectricity <strong>Sugarcane</strong> <strong>in</strong> <strong>the</strong> <strong>Future</strong> <strong>of</strong> <strong>the</strong> <strong>Energy</strong> <strong>Matrix</strong>Table 3Ethanol and gasol<strong>in</strong>e <strong>in</strong> <strong>the</strong> United StatesConsumption <strong>of</strong> gasol<strong>in</strong>e; consumption, production and importation <strong>of</strong> ethanol <strong>in</strong> <strong>the</strong> United States; <strong>in</strong> millions <strong>of</strong> m³,accord<strong>in</strong>g to EIA projectionsYearConsumption<strong>of</strong> gasol<strong>in</strong>ewith ethanolConsumption<strong>of</strong> ethanolmixed withgasol<strong>in</strong>ePercentage<strong>of</strong> ethanol <strong>in</strong>gasol<strong>in</strong>eConsumption<strong>of</strong> ethanol asE85Domesticproduction <strong>of</strong>EthanolNet import<strong>in</strong>g<strong>of</strong> Ethanol2006 537.0 21.1 4% 0.0 18.5 2.72007 538.9 25.9 5% 0.0 24.7 1.32008 520.2 36.0 7% 0.0 34.9 1.22009 514.1 39.6 8% 0.0 39.9 -0.32010 547.4 49.0 9% 0.1 49.7 -0.62011 560.8 55.1 10% 0.1 56.2 -0.92012 559.4 55.0 10% 0.1 55.2 -0.12013 555.6 54.7 10% 0.1 54.8 -0.12014 550.2 54.1 10% 0.1 54.3 -0.12015 542.1 53.4 10% 2.3 55.5 0.12016 533.1 52.5 10% 5.4 57.8 0.22017 525.9 51.8 10% 7.3 58.9 0.22018 516.9 50.8 10% 11.5 61.0 1.32019 510.9 50.1 10% 16.1 63.3 2.92020 502.9 49.6 10% 22.1 69.2 2.52021 497.3 49.7 10% 25.8 73.5 2.02022 486.8 48.1 10% 35.2 79.4 3.92023 487.1 48.2 10% 35.0 81.3 1.82024 489.2 48.9 10% 33.5 80.6 1.82025 488.7 48.4 10% 35.0 80.7 2.7Tabela20263488.9 48.0 10% 36.2 81.3 2.92027 482.1 47.9 10% 44.3 87.8 4.42028 481.8 47.8 10% 46.3 88.8 5.32029 476.6 49.5 10% 50.3 92.0 7.82030 478.1 48.2 10% 51.7 93.4 6.5Source: Prepared by <strong>the</strong> authors from EIA (2009b).
International Bi<strong>of</strong>uels Policies211example, is 49%, while <strong>in</strong> Malta it is just 10%. The goals <strong>in</strong> Germany, France, <strong>the</strong> United K<strong>in</strong>gdom and Italy,<strong>the</strong> largest European economies, are 18%, 23%, 15% and 17%, respectively.The special attention given by <strong>the</strong> CCP to transportation is due to projections <strong>in</strong>dicat<strong>in</strong>g that <strong>the</strong> sectorwill be responsible for <strong>the</strong> greatest share <strong>of</strong> growth <strong>in</strong> energy consumption. It thus requires <strong>the</strong> greatestdiscipl<strong>in</strong>e.One important topic with<strong>in</strong> RED refers to <strong>the</strong> susta<strong>in</strong>ability criteria <strong>of</strong> bi<strong>of</strong>uels that are used to reach <strong>the</strong>10% goal. The three ma<strong>in</strong> criteria are:i From <strong>the</strong> autumn <strong>of</strong> 2010 onwards, lifecycle GHG emissions <strong>of</strong> bi<strong>of</strong>uels should be at least 35% lower thanthose <strong>of</strong> <strong>the</strong> fossil fuels <strong>the</strong>y replace. GHG emissions reduction should be at least 50% from 2017 onwards,<strong>in</strong>creas<strong>in</strong>g to 60% when bi<strong>of</strong>uels are produced <strong>in</strong> new <strong>in</strong>stallations.II Bi<strong>of</strong>uels should not be produced from raw materials obta<strong>in</strong>ed <strong>in</strong> areas <strong>of</strong> high biodiversity, such as primaryforests and areas with native vegetation.III Agriculture raw materials produced <strong>in</strong> <strong>the</strong> EU should be produced accord<strong>in</strong>g to correct agricultural andenvironmental practices established by <strong>the</strong> EU’s Common Agricultural Policy (CAP) xiii .Transportation fuel consumption <strong>in</strong> <strong>the</strong> European Union In thousands <strong>of</strong> TPETable 4Fuel 2006 r 2007 r 2008 e 2009 p 2010 pTotal bi<strong>of</strong>uels 5,910 7,940 9,320 10,340 12,650Biodiesel 4,110 5,900 7,160 8,170 9,980Pure vegetal oil 920 660 370 100 100Ethanol 880 1,380 1,790 2,070 2,560Conversion biomass – liquid (BtL) - - - 2 8Total fossil fuel 293,531 295,667 297,900 300,160 302,470Diesel 183,702 189,596 192,250 194,940 197,670Gasol<strong>in</strong>e 109,829 106,071 105,650 105,220 104,800Total fuels 299,440 303,610 307,220 310,510 315,120Bi<strong>of</strong>uels participation 1.97% 2.62% 3.03% 3.33% 4.00%Target <strong>in</strong> Directive 2003/2030 2.75% 3.50% 4.25% 5.00% 5.75%Notes: r- revised; e- estimated; p- projected. Source: Prepared by <strong>the</strong> authors from Flach, B. (2009).
212 Ethanol and Bioelectricity <strong>Sugarcane</strong> <strong>in</strong> <strong>the</strong> <strong>Future</strong> <strong>of</strong> <strong>the</strong> <strong>Energy</strong> <strong>Matrix</strong>Given <strong>the</strong> technological preference for diesel motors <strong>in</strong> <strong>the</strong> EU and <strong>the</strong> longstand<strong>in</strong>g tradition <strong>in</strong> <strong>the</strong> production<strong>of</strong> biodiesel, ethanol accounted for just 19% <strong>of</strong> bi<strong>of</strong>uel consumption with<strong>in</strong> <strong>the</strong> bloc <strong>in</strong> 2008. Asshown <strong>in</strong> Table 5, ethanol consumption <strong>in</strong> <strong>the</strong> EU <strong>in</strong> 2008 was approximately 3.71 million m³, <strong>of</strong> which3.55 million m³ was dest<strong>in</strong>ed for <strong>the</strong> transportation sector and <strong>the</strong> rema<strong>in</strong>der to stock formation. Countrieswith <strong>the</strong> greatest consumption <strong>of</strong> ethanol were France (1.1 million m³), Germany (0.75 million m³), andSweden (0.43 million m³). In fourth place were <strong>the</strong> United K<strong>in</strong>gdom and <strong>the</strong> Benelux bloc, with 0.28 millionm³ each. As shown <strong>in</strong> Table 5, consumption <strong>in</strong> <strong>the</strong> EU is projected to grow by an average <strong>of</strong> 16% per yearbetween 2008 and 2010.Ethanol production <strong>in</strong> <strong>the</strong> EU totaled 2.66 million m³ <strong>in</strong> 2008, with <strong>the</strong> ma<strong>in</strong> producers be<strong>in</strong>g France (0.80million), Germany (0.58 million), Spa<strong>in</strong> (0.30 million) and Poland (0.22 million). The ma<strong>in</strong> raw material used<strong>in</strong> <strong>the</strong> production <strong>of</strong> ethanol was wheat (3.2 million tonnes), followed by sugar (1.0 million tonnes), corn(1.6 million tonnes) and barley and rye (0.5 million tonnes). Accord<strong>in</strong>g to <strong>the</strong> estimates presented <strong>in</strong> Table 5,ethanol production <strong>in</strong> <strong>the</strong> bloc should grow, on average, by 20% per year between 2008 and 2010.In 2008, <strong>the</strong> EU’s deficit between ethanol consumption and production required imports total<strong>in</strong>g 1.1 millionm³. Ma<strong>in</strong> importers were <strong>the</strong> United K<strong>in</strong>gdom, Sweden and <strong>the</strong> Benelux counties, acquir<strong>in</strong>g <strong>the</strong> fuelfrom Brazil, Argent<strong>in</strong>a, Costa Rica, Venezuela, Peru and Guatemala. Even though production grew by morethan consumption between 2008 and 2010, ethanol imports will still be necessary and are projected togrow by 7% per year, on average, reach<strong>in</strong>g 1.27 million m³, or 25% <strong>of</strong> <strong>the</strong> product’s consumption, by <strong>the</strong>end <strong>of</strong> <strong>the</strong> period.It can be forecast that, <strong>in</strong> <strong>the</strong> medium term, <strong>the</strong> EU is likely to import grow<strong>in</strong>g quantities <strong>of</strong> ethanol due totwo factors: (i) growth <strong>in</strong> demand to meet <strong>the</strong> goals for renewable fuel use imposed by CCP; and (ii) limitationson domestic supply, given <strong>the</strong> bi<strong>of</strong>uels susta<strong>in</strong>ability criteria imposed by <strong>the</strong> RED. These criteria areunlikely to be met by <strong>the</strong> ethanol produced from <strong>the</strong> raw materials used <strong>in</strong> <strong>the</strong> EU. This creates a w<strong>in</strong>dow<strong>of</strong> opportunity for Brazilian ethanol exports, at least until technologies for production <strong>of</strong> cellulosic ethanolreach maturity.Table 5 Supply and demand <strong>of</strong> ethanol <strong>in</strong> <strong>the</strong> European Union In thousands <strong>of</strong> m³2006 r 2007 r 2008 e 2009 p 2010 p Average annual growthInstalled capacity 2,220 3,800 5,960 6,720 8,870 41.4%Production 1,635 1,840 2,660 3,040 3,800 23.5%Exports 38 44 51 57 63 13.5%Imports 230 1,000 1,105 1,115 1,270 53.3%Consumption 1,825 2,795 3,715 4,100 5,010 28.7%Notes: r - revised; e - estimated; p - projected. Source: Prepared by <strong>the</strong> authors from Flach, B. (2009).
International Bi<strong>of</strong>uels Policies213However, Brazilian ethanol currently faces tax barriers to enter <strong>the</strong> EU. The bloc establishes two import taxrates for ethanol: €0.192 per liter for non-denatured ethanol and €0.102/liter for denatured ethanol. Thesetaxes, however, do not apply to countries <strong>in</strong>cluded <strong>in</strong> <strong>the</strong> “Everyth<strong>in</strong>g But Arms” <strong>in</strong>itiative for Least DevelopedCountries nor to those African, Caribbean and Pacific nations covered by <strong>the</strong> Cotonou Agreement,which are exempt from any taxation. The Brazilian product <strong>the</strong>refore faces <strong>the</strong> higher <strong>of</strong> <strong>the</strong> two taxes,given that Brazil exports ma<strong>in</strong>ly non-denatured ethanol and <strong>the</strong> majority <strong>of</strong> EU member-states allow onlythis type <strong>of</strong> ethanol to be blended with gasol<strong>in</strong>e.Concern about bi<strong>of</strong>uel imports to meet goals for GHG emission reductions <strong>in</strong> <strong>the</strong> transportation sectorhas been expressed by <strong>the</strong> European Commission (EC) <strong>in</strong> a series <strong>of</strong> policy documents. In <strong>the</strong> documents“An EU Strategy for Bi<strong>of</strong>uels” (EC, 2006) and “Renewable <strong>Energy</strong> Road Map” (EC, 2007), <strong>the</strong> Commissionproposes a search for <strong>the</strong> “appropriate development <strong>of</strong> both domestic production as well as <strong>the</strong> <strong>in</strong>crease forimportation opportunities”. In <strong>the</strong> latter document, <strong>the</strong> EC declares that “if it becomes clear that <strong>the</strong> EU’ssupply <strong>of</strong> susta<strong>in</strong>able bi<strong>of</strong>uels becomes restricted, <strong>the</strong> EU must be prepared to exam<strong>in</strong>e if greater accessto <strong>the</strong> market should be an option to aid development <strong>of</strong> <strong>the</strong> market”. Accord<strong>in</strong>g to <strong>the</strong>se documents, <strong>the</strong>Doha Development Round and <strong>the</strong> free trade agreement between <strong>the</strong> EU and Mercosul will have impacton <strong>the</strong> additional open<strong>in</strong>g up <strong>of</strong> <strong>the</strong> ethanol market. (Flach, B., 2009).However, some factors may reduce <strong>the</strong> forecast importation <strong>in</strong>to <strong>the</strong> European market. The preference thatEU consumers have shown <strong>in</strong> <strong>the</strong> last two decades for diesel vehicles <strong>in</strong>dicates an obstacle to <strong>the</strong> growth<strong>of</strong> gasol<strong>in</strong>e consumption, which would stimulate an <strong>in</strong>crease <strong>in</strong> ethanol consumed <strong>in</strong> <strong>the</strong> bloc. There isalso competition from <strong>the</strong> grow<strong>in</strong>g bi<strong>of</strong>uel production <strong>in</strong> countries favored by EU custom tax exemptionprograms.Taxes on automotive fuels <strong>in</strong> Sweden <strong>in</strong> 2009Table 6Fuel Consumption tax (SEK/l) CO 2(SEK/l) SO2 (SEK/l) VAT (%)Conventional Gasol<strong>in</strong>e 3.08 2.44 0 25Diesel 1.33 3.01 0 25Ethanol and biodiesel 0 0 0 0Notes: SEK 1 = US$ 0.14, average exchange rate <strong>in</strong> August 2009. Source: Prepared by <strong>the</strong> authors from Dahlbacka, B. (2009).
214 Ethanol and Bioelectricity <strong>Sugarcane</strong> <strong>in</strong> <strong>the</strong> <strong>Future</strong> <strong>of</strong> <strong>the</strong> <strong>Energy</strong> <strong>Matrix</strong>2.3 Bi<strong>of</strong>uel policies <strong>in</strong> SwedenSweden was one <strong>of</strong> <strong>the</strong> first countries <strong>in</strong> <strong>the</strong> EU to adopt economic <strong>in</strong>struments <strong>in</strong> its environmental policies.As far back as 1991, <strong>the</strong> country <strong>in</strong>troduced environmental taxes on all types <strong>of</strong> energy, <strong>in</strong>clud<strong>in</strong>g automotivefuels. As shown <strong>in</strong> Table 6, <strong>in</strong> addition to VAT Sweden targets gasol<strong>in</strong>e with a specific consumptiontax and a CO 2emissions tax. Diesel faced yet ano<strong>the</strong>r tax on SO 2emissions but this became <strong>in</strong>operativewhen <strong>the</strong> country began us<strong>in</strong>g diesel with ultra-low sulfur content (below five ppm). At <strong>the</strong> same time,ethanol and biodiesel enjoy total tax exemption, without which <strong>the</strong>ir prices would not be competitive.Ethanol is used <strong>in</strong> Sweden as a compulsory additive to gasol<strong>in</strong>e <strong>in</strong> an E5 blend. There is also an optionalE85, which <strong>in</strong> w<strong>in</strong>ter months can be reduced to E75. Ethanol can also replace diesel <strong>in</strong> <strong>the</strong> form <strong>of</strong> optionalED95 xiv . Biodiesel has been allowed s<strong>in</strong>ce 2006 <strong>in</strong> a diesel blend up to 5%.Sweden is Europe’s greatest promoter <strong>of</strong> <strong>the</strong> use <strong>of</strong> E85 and flex-fueled vehicles. In <strong>the</strong> last few years, <strong>the</strong>government has granted <strong>in</strong>centives for <strong>the</strong> acquisition <strong>of</strong> flex-fuel vehicles, <strong>in</strong>clud<strong>in</strong>g a purchase bonus <strong>of</strong>SEK10,000 (approximately US$1,400), discounted <strong>in</strong>surance, lower licens<strong>in</strong>g fees, free park<strong>in</strong>g places <strong>in</strong>most major cities and exemption from <strong>the</strong> traffic congestion tax charged <strong>in</strong> Stockholm xv .In 2008, 50% <strong>of</strong> new light vehicle models were <strong>of</strong>fered <strong>in</strong> flex-fuel versions and 25% <strong>of</strong> vehicle sales were flexfuel.The Swedish government expects that <strong>the</strong> flex-fuel fleet will reach 300,000 units by <strong>the</strong> end <strong>of</strong> 2010, andthat E85 will represent 10% <strong>of</strong> <strong>the</strong> country’s automotive fuel market by 2012 (Christiansen, R.C., 2009).In addition to <strong>the</strong> tax <strong>in</strong>centives for ethanol, <strong>the</strong> country’s flex-fuel fleet is served by an <strong>in</strong>frastructure <strong>of</strong>approximately 1,400 stations <strong>of</strong>fer<strong>in</strong>g E85, with that number predicted grow to 2,000 by <strong>the</strong> end <strong>of</strong> 2009.The Swedish government has already spent €69 million (US$91 million) sett<strong>in</strong>g up this <strong>in</strong>frastructure (Christiansen,R.C., 2009).Even with tax exemption, <strong>the</strong> <strong>in</strong>sufficient production volume and <strong>the</strong> high cost <strong>of</strong> European ethanol haveunderm<strong>in</strong>ed its competitiveness compared to traditional fuels. To supply <strong>the</strong> market and reduce <strong>the</strong> cost <strong>of</strong><strong>the</strong> product, <strong>the</strong> European Commission has s<strong>in</strong>ce 2008 been authoriz<strong>in</strong>g Sekab to import Brazilian ethanolwith a reduced import tax. To make this possible, Brazilian ethanol used <strong>in</strong> <strong>the</strong> E85 blend is classed as achemical, so attract<strong>in</strong>g a lower import tax. However, this concession is be<strong>in</strong>g renewed yearly, and <strong>the</strong> fearthat it could be cancelled at any moment creates <strong>in</strong>security for car buyers. This fear is aggravated by <strong>the</strong>fact that European ethanol producers oppose <strong>the</strong> concession given to Sweden. If European producers succeed<strong>in</strong> end<strong>in</strong>g <strong>the</strong> tax reduction for Brazilian ethanol, plac<strong>in</strong>g it back <strong>in</strong> <strong>the</strong> agricultural product category,ethanol would cease to be competitive <strong>in</strong> Sweden and consumers would go back to us<strong>in</strong>g gasol<strong>in</strong>e anddiesel, or would at least reduce <strong>the</strong>ir consumption <strong>of</strong> bi<strong>of</strong>uels.Sweden is look<strong>in</strong>g for alternatives to import<strong>in</strong>g ethanol from Brazil. One option is support<strong>in</strong>g ethanolproduction projects <strong>in</strong> countries that benefit from tax-free entry <strong>in</strong>to <strong>the</strong> EU through <strong>the</strong> “Everyth<strong>in</strong>g ButArms” <strong>in</strong>itiative for Least Developed Countries and <strong>the</strong> Cotonou Agreement with African, Caribbean and
International Bi<strong>of</strong>uels Policies215Pacific countries. An experiment is tak<strong>in</strong>g place <strong>in</strong> Ghana, where a 150,000 m³ capacity plant will be builtby Brazil’s Constran S ∕A group. The Brazilian Development Bank (BNDES) will concede partial f<strong>in</strong>anc<strong>in</strong>g <strong>of</strong>US$260 million, out <strong>of</strong> <strong>the</strong> project’s total US$306 million <strong>in</strong>vestment (<strong>Energy</strong> Daily, 2008).2.4 Bi<strong>of</strong>uel policies <strong>in</strong> <strong>the</strong> United K<strong>in</strong>gdomThe United K<strong>in</strong>gdom started promot<strong>in</strong>g biodiesel <strong>in</strong> 2002, to be consumed pure or <strong>in</strong> a diesel blend.Biodiesel was granted a reduction <strong>of</strong> £0.20 per liter (US$0.30 per liter) <strong>in</strong> <strong>the</strong> specific automotive fuel tax(£0.5035 per liter <strong>in</strong> 2008). Tak<strong>in</strong>g <strong>in</strong>to account <strong>the</strong> 15% VAT, <strong>the</strong> reduction implies an advantage for <strong>the</strong>consumer <strong>of</strong> almost £0.24 per liter. In 2005, <strong>the</strong> reduction was extended to ethanol used <strong>in</strong> E85 or blendedwith gasol<strong>in</strong>e <strong>in</strong> any proportion.In 2008 <strong>the</strong> government announced that this reduction would end <strong>in</strong> April 2010, as <strong>of</strong> when bi<strong>of</strong>uels willbe taxed like o<strong>the</strong>r automotive fuels. Replac<strong>in</strong>g <strong>the</strong> tax reduction policy, <strong>the</strong> Renewable Transport FuelObligation (RTFO) Order 2007 constitutes one <strong>of</strong> <strong>the</strong> UK’s ma<strong>in</strong> policies for reduc<strong>in</strong>g GHG emission <strong>in</strong> <strong>the</strong>transportation sector. RTFO took effect on April 15 th 2008, and seeks to reduce by 2.6 to 3.0 million tonnesper year <strong>the</strong> carbon gas emission <strong>of</strong> <strong>the</strong> transportation sector.Inspired by a similar program that promotes <strong>the</strong> use <strong>of</strong> renewable sources <strong>in</strong> UK electricity generation,RTFO requires <strong>the</strong> larger agents (those supply<strong>in</strong>g more than 450,000 liters <strong>of</strong> fossil fuels per year) to sella m<strong>in</strong>imum quota <strong>of</strong> ethanol and biodiesel. Dur<strong>in</strong>g <strong>the</strong> first year when RTFO was <strong>in</strong> force, from April 15 th2008 to April 14 th 2009, <strong>the</strong> mandatory quota was set at 2.5%, ris<strong>in</strong>g to 3.25% between 2009 and 2010,3.5% between 2010 and 2011, 4.0% between 2011 and 2012, 4.5% between 2012 and 2013, and 5.0%between 2013 and 2014 xvi .Companies participat<strong>in</strong>g <strong>in</strong> <strong>the</strong> program were separated <strong>in</strong>to two groups: those that supply more than450,000 liters <strong>of</strong> fossil fuels per year, and are <strong>the</strong>refore required to participate by register<strong>in</strong>g <strong>in</strong> RTFO; andthose that supply volumes below this yearly limit, or which supply only bi<strong>of</strong>uels. These can participate voluntarilyby register<strong>in</strong>g with <strong>the</strong> RTFO.The Renewable Fuels Agency (RFA) was created to manage <strong>the</strong> RTFO. It supplies companies registered with<strong>the</strong> RTFO, ei<strong>the</strong>r compulsorily or voluntarily, with Renewable Transport Fuel Certificates (RTFC) correspond<strong>in</strong>gto <strong>the</strong> volume <strong>of</strong> bi<strong>of</strong>uel <strong>the</strong>y sold, substantiated by <strong>the</strong> payment <strong>of</strong> <strong>the</strong> relevant specific fuel tax. Companiesare allowed to negotiate certificates between <strong>the</strong>mselves.
216 Ethanol and Bioelectricity <strong>Sugarcane</strong> <strong>in</strong> <strong>the</strong> <strong>Future</strong> <strong>of</strong> <strong>the</strong> <strong>Energy</strong> <strong>Matrix</strong>Each annual period runs from April 15 th <strong>of</strong> one year to April 14th <strong>of</strong> <strong>the</strong> next. At <strong>the</strong> end <strong>of</strong> each period,companies must prove to <strong>the</strong> RFA that <strong>the</strong>y possess a number <strong>of</strong> certificates correspond<strong>in</strong>g to <strong>the</strong> mandatoryquota <strong>of</strong> that period. Companies that do not prove ownership <strong>of</strong> <strong>the</strong>se certificates will have twooptions: (i) pay a f<strong>in</strong>e (a buy-out penalty); or (ii) ) acquire RTFCs from o<strong>the</strong>r companies. Collected f<strong>in</strong>es will goto a buy-out fund. Companies that are obliged to participate <strong>in</strong> <strong>the</strong> RTFO and have excess certificates can sell<strong>the</strong>se to <strong>the</strong> RFA, while companies that participate voluntarily will be able to sell <strong>the</strong> agency all <strong>the</strong>ir certificates.The RFA buys <strong>the</strong>se certificates at a price that depends on <strong>the</strong> amount accumulated <strong>in</strong> <strong>the</strong> buy-out fund. Thevalue <strong>of</strong> <strong>the</strong> buy-out penalty was set at £0.15 per liter <strong>of</strong> non-supplied bi<strong>of</strong>uel, <strong>in</strong>creas<strong>in</strong>g to £0.30 start<strong>in</strong>gApril 15 th 2010.To replace <strong>the</strong> tax <strong>in</strong>centive <strong>of</strong> £0.20/liter (ext<strong>in</strong>ct as <strong>of</strong> 2010), <strong>the</strong> UK government plans to set up a system tocompensate bi<strong>of</strong>uels accord<strong>in</strong>g to <strong>the</strong> carbon emissions avoided <strong>in</strong> <strong>the</strong>ir production and use. Start<strong>in</strong>g April 15 th2011, this system would reward only those bi<strong>of</strong>uels that are produced from raw materials that meet susta<strong>in</strong>abilitystandards deemed appropriate.2.5 Bi<strong>of</strong>uel policies <strong>in</strong> GermanyGermany is currently <strong>the</strong> world’s largest producer and consumer <strong>of</strong> biodiesel. In 2007, it had <strong>in</strong>stalled capacityto produce 4.2 million tonnes a year, ma<strong>in</strong>ly from canola oil, and was responsible for 17% <strong>of</strong> globalproduction. However, <strong>in</strong> that same year Germany produced just 0.54 million m³ <strong>of</strong> ethanol, a t<strong>in</strong>y fraction<strong>of</strong> <strong>the</strong> worldwide production <strong>of</strong> 52 million m³.The country began us<strong>in</strong>g biodiesel <strong>in</strong> 1991, when <strong>the</strong> first production plant was built <strong>in</strong> Aschach, Austria.Because biodiesel was so much more expensive than diesel, its sale became feasible only with a favorabletax structure that exempted it from taxes on fossil fuels, such as <strong>the</strong> eco-tax (Ökosteuer) that is applicableto all energy sources, and <strong>the</strong> specific tax on m<strong>in</strong>eral oils (M<strong>in</strong>eralölsteuer).Initially, biodiesel was sold only <strong>in</strong> its pure form (B100). Fill<strong>in</strong>g station pumps had two nozzles, one fordiesel and one for biodiesel, so allow<strong>in</strong>g <strong>the</strong> consumer to decide his own mixture. This strategy could beimplemented immediately thanks to <strong>the</strong> co<strong>in</strong>cidental prohibition <strong>in</strong> <strong>the</strong> country <strong>of</strong> leaded gasol<strong>in</strong>e sales,which freed up <strong>the</strong> distribution and retail <strong>in</strong>frastructure <strong>of</strong> <strong>the</strong> banned gasol<strong>in</strong>e for use by <strong>the</strong> new fuel,so avoid<strong>in</strong>g major <strong>in</strong>vestments. In addition to B100, biodiesel mixtures with percentages between 2% and20% are common <strong>in</strong> Germany, while ethanol is blended <strong>in</strong>to gasol<strong>in</strong>e <strong>in</strong> a 5% proportion. E85, on <strong>the</strong> o<strong>the</strong>rhand, has a very small market, with just 30 fill<strong>in</strong>g stations <strong>of</strong>fer<strong>in</strong>g it <strong>in</strong> 2007.The government began encourag<strong>in</strong>g <strong>the</strong> use <strong>of</strong> biodiesel <strong>in</strong> 1999, <strong>in</strong>creas<strong>in</strong>g <strong>the</strong> specific tax on fossil fuels.Petroleum prices began to rise <strong>in</strong> <strong>the</strong> same period, mak<strong>in</strong>g biodiesel more and more competitive. This ledto a consumption boom, with biodiesel sales grow<strong>in</strong>g by an average <strong>of</strong> 24% per year between 2000 and2003. In 2002 <strong>the</strong>re were 1,500 fill<strong>in</strong>g stations sell<strong>in</strong>g B100, about 10% <strong>of</strong> <strong>the</strong> country’s fuel outlets. Biodieselsales <strong>in</strong> 2003 totaled 755,000 m³, represent<strong>in</strong>g 2.3% <strong>of</strong> total fossil diesel consumption <strong>in</strong> Germany,
International Bi<strong>of</strong>uels Policies217<strong>the</strong>n about 33 million m³ (Wittke, F. and Zies<strong>in</strong>g, H., 2004). In 2005, biodiesel could be found at 1,900 retailoutlets and it enjoyed 3.75% participation compared to total diesel sales; almost twice <strong>the</strong> level required<strong>in</strong> Directive 2003/30. German biodiesel consumption <strong>in</strong> 2007 was 3.9 million m³, represent<strong>in</strong>g 35% <strong>of</strong>worldwide biodiesel consumption and almost 10% <strong>of</strong> diesel consumption <strong>in</strong> <strong>the</strong> country (Federal M<strong>in</strong>istry<strong>of</strong> Economics and Technology, 2009).With <strong>the</strong> rapid growth <strong>in</strong> consumption, fiscal exemption granted to bi<strong>of</strong>uels xvii reached approximately US$3billion <strong>in</strong> 2006 (Godoy, J., 2007) and began weigh<strong>in</strong>g on <strong>the</strong> country’s budget. To remedy this situation,Germany <strong>in</strong>troduced new bi<strong>of</strong>uels legislation <strong>in</strong> <strong>the</strong> shape <strong>of</strong> <strong>the</strong> <strong>Energy</strong> Taxation Law and <strong>the</strong> Bi<strong>of</strong>uelsQuota Law, which took effect <strong>in</strong> August 2006 and January 2007 respectively. Under <strong>the</strong> new legislation,bi<strong>of</strong>uels face <strong>the</strong> same specific taxes as fossil fuels, with <strong>the</strong> exemptions replaced by discounts to berequested from <strong>the</strong> government after sale. As shown <strong>in</strong> Table 7, <strong>the</strong> discounts given to bi<strong>of</strong>uels used <strong>in</strong>blends were abolished <strong>in</strong> 2007 xviii , while discounts for pure bi<strong>of</strong>uels except E85 were progressively reduced,with <strong>the</strong>ir ext<strong>in</strong>ction predicted for 2015. E85 cont<strong>in</strong>ues to benefit from total exemption, as do secondgenerationbiodiesel and ethanol.To compensate for <strong>the</strong> higher taxes, <strong>the</strong> Bi<strong>of</strong>uels Quota Law imposed mandatory bi<strong>of</strong>uels sales quotas onfuel suppliers. These quotas are related to <strong>the</strong> total sales <strong>of</strong> petroleum derivatives, with <strong>in</strong>dividual subquotasfor sales <strong>of</strong> gasol<strong>in</strong>e and diesel. Table 8 shows <strong>the</strong> bi<strong>of</strong>uels quotas and sub-quotas that must be metby 2015. The quotas and sub-quotas are based on <strong>the</strong> energy content <strong>of</strong> <strong>the</strong> fuels, ra<strong>the</strong>r than volume.Quotas can be met by sell<strong>in</strong>g bi<strong>of</strong>uels pure or <strong>in</strong> blends <strong>of</strong> petroleum derivatives, and compliance requirementsfor <strong>the</strong>se obligations can be transferred from one supplier to ano<strong>the</strong>r by means <strong>of</strong> a formal contract. However,lack <strong>of</strong> compliance renders <strong>the</strong> supplier liable to a f<strong>in</strong>e based on <strong>the</strong> amount <strong>of</strong> energy he failed to supply tomeet his quota, and on <strong>the</strong> marg<strong>in</strong>al cost <strong>of</strong> produc<strong>in</strong>g one unit <strong>of</strong> energy from biodiesel or ethanol xix .Introduction <strong>of</strong> <strong>the</strong> new legislation had two adverse impacts on <strong>the</strong> German bi<strong>of</strong>uels <strong>in</strong>dustry (Mabee, W.E.et al., 2009). The first was a drop <strong>in</strong> national production. After reach<strong>in</strong>g a peak <strong>of</strong> 3.56 billion liters <strong>in</strong> 2007,biodiesel production fell by 12% <strong>in</strong> 2008, to 3.18 billion. In March <strong>of</strong> 2008, biodiesel production plants had85% <strong>of</strong> unused capacity, and half <strong>the</strong> companies <strong>in</strong> <strong>the</strong> sector ei<strong>the</strong>r suspended operations or went bankrupt;with 14% <strong>of</strong> fill<strong>in</strong>g stations stopp<strong>in</strong>g sell<strong>in</strong>g <strong>the</strong> fuel. The situation improved only slightly <strong>in</strong> <strong>the</strong> summers <strong>of</strong>2008 and 2009 as fuel prices <strong>in</strong>creased, but still rema<strong>in</strong>ed well below <strong>the</strong> production peak <strong>of</strong> 2007.The second impact was an <strong>in</strong>crease <strong>in</strong> bi<strong>of</strong>uels imports. Up to 2005, domestic production was close todomestic consumption. This balance changed start<strong>in</strong>g 2006, with imports <strong>in</strong>creas<strong>in</strong>g to supply 66% <strong>of</strong> <strong>the</strong>bi<strong>of</strong>uel required to meet <strong>the</strong> quota legislation.The situation led <strong>the</strong> government to send <strong>the</strong> German parliament <strong>the</strong> Amendment for Promotion <strong>of</strong> Bi<strong>of</strong>uels<strong>in</strong> October <strong>of</strong> 2008. Parliament approved this amendment <strong>the</strong> follow<strong>in</strong>g April, and it was await<strong>in</strong>gpublish<strong>in</strong>g <strong>in</strong> <strong>the</strong> Federal Gazette to take effect. In addition to alter<strong>in</strong>g exist<strong>in</strong>g legislation for biodiesel taxand quotas (see Table 7 and Table 8), <strong>the</strong> amendment also required <strong>the</strong> government to ensure that susta<strong>in</strong>-
218 Ethanol and Bioelectricity <strong>Sugarcane</strong> <strong>in</strong> <strong>the</strong> <strong>Future</strong> <strong>of</strong> <strong>the</strong> <strong>Energy</strong> <strong>Matrix</strong>Table 7Discounts <strong>of</strong> specific taxes for bi<strong>of</strong>uels <strong>in</strong> GermanyIn Euro cents per literYear Ethanol ETBE Biodiesel Vegetal oilBi<strong>of</strong>uels(2 nd generation) (3)E85 (1) Blend Blend B100 Blend Puro Blend BTL (4) Ethanolcellulose2004 65.05 65.05 65,05 47.04 47.04 47.04 47.042005 65.05 65.05 65,05 47.04 47.04 47.04 47.042006 (2) 65.05 0.00 0 38.04 32.04 47.04 47.042007 65.05 0.00 0 38.04 0.00 47.04 0.00 47.04 65.052008 65.05 0.00 0 33.64 0.00 38.89 0.00 47.04 65.052009 65.05 0.00 0 27.34/ 30.34(5) 0.00 30.49 0.00 47.04 65.052010 65.05 0.00 0 21.04/ 24.04(5) 0.00 22.09 0.00 47.04 65.052011 65.05 0.00 0 14.74/ 17.74(5) 0.00 14.74 0.00 47.04 65.052012 65.05 0.00 0 2.14/ 5.14(5) 0.00 2.14 0.00 47.04 65.052013 65.05 0.00 0 2.14 0.00 2.14 0.00 47.04 65.052014 65.05 0.00 0 2.14 0.00 2.14 0.00 47.04 65.052015 65.05 0.00 0 2.00 0.00 2 0 47.04 65.05Notes: (1) E85 exempted until 2015.(2)Tax altered start<strong>in</strong>g August 1st 2006.(3)Situation <strong>of</strong> second-generation bi<strong>of</strong>uels will be exam<strong>in</strong>ed annually.(4)Biomass conversion to liquid.(5)New values fixed by <strong>the</strong> Amendment for <strong>the</strong> Promotion <strong>of</strong> Bi<strong>of</strong>uels <strong>in</strong> 2009.Source: Prepared by <strong>the</strong> authors from Mabee, W. E., et al. (2009).Table 8<strong>Energy</strong> percentages <strong>of</strong> bi<strong>of</strong>uel blend quotas <strong>in</strong> GermanyYear Gasol<strong>in</strong>e + Diesel Gasol<strong>in</strong>e Diesel2007 n.a. 1.2% 4.4%2008 n.a. 2.0% 4.4%2009 6.25% / 5.25% (*) 2.8% 4.4%2010 6.75% / 6.25% (*) 3.6% 4.4%2011 7.00% / 6.25% (*) 3.6% 4.4%2012 7.25% / 6.25% (*) 3.6% 4.4%2013 7.50% / 6.25% (*) 3.6% 4.4%2014 7.75% / 6.25% (*) 3.6% 4.4%Quotas required for climate protection*:2015 / 2016 3% reduction <strong>in</strong> GHG emissions us<strong>in</strong>g bi<strong>of</strong>uels2017 / 2019 4.5% reduction <strong>in</strong> GHG emissions us<strong>in</strong>g bi<strong>of</strong>uels2020 7% reduction <strong>in</strong> GHG emissions us<strong>in</strong>g bi<strong>of</strong>uelsNote: (*) New values fixed by <strong>the</strong> Amendment for Bi<strong>of</strong>uel Promotion <strong>in</strong> 2009; n.a. – not applicable.Source: Prepared by <strong>the</strong> authors from Mabee, W. et al. (2009).
International Bi<strong>of</strong>uels Policies219able standards are observed <strong>in</strong> <strong>the</strong> production, distribution and use <strong>of</strong> bi<strong>of</strong>uels. The amendment <strong>in</strong>troducedsignificant changes <strong>in</strong> <strong>the</strong> pr<strong>in</strong>ciples govern<strong>in</strong>g bi<strong>of</strong>uels promotion beg<strong>in</strong>n<strong>in</strong>g <strong>in</strong> 2015, establish<strong>in</strong>g that <strong>the</strong>use <strong>of</strong> bi<strong>of</strong>uels would no longer be based on mandatory quotas but would serve to reduce GHG emissionscaused by <strong>the</strong> use <strong>of</strong> fossil fuels <strong>in</strong> transportation. With this amendment <strong>in</strong> force, <strong>the</strong> use <strong>of</strong> bi<strong>of</strong>uels is likelyto grow more slowly than previously predicted.3 F<strong>in</strong>al considerationsThe worldwide production and use <strong>of</strong> bi<strong>of</strong>uels has grown rapidly <strong>in</strong> recent years, motivated by concernabout climate change and by questions <strong>of</strong> energy security and safety that become relevant <strong>in</strong> <strong>the</strong> context<strong>of</strong> potential petroleum depletion. The United States and Brazil are <strong>the</strong> world’s largest producers <strong>of</strong> ethanol,while biodiesel production is dom<strong>in</strong>ated by EU countries, <strong>in</strong> particular Germany. While GHG emissionreduction is a more or less common objective <strong>of</strong> all <strong>the</strong>se policies, o<strong>the</strong>r reasons for promot<strong>in</strong>g <strong>the</strong> productionand use <strong>of</strong> bi<strong>of</strong>uels <strong>in</strong>clude energy security, reduced fossil fuel consumption, local environmentalimpacts, rural development and <strong>in</strong>creas<strong>in</strong>g potential exports.In most countries, however, bi<strong>of</strong>uels are not very competitive, economically speak<strong>in</strong>g, compared to petroleumderivatives. Even with <strong>the</strong> recent rise <strong>in</strong> <strong>the</strong> price <strong>of</strong> oil and its derivatives, many bi<strong>of</strong>uels are still notvery competitive, given that <strong>the</strong> prices for agricultural commodities and <strong>the</strong> <strong>in</strong>puts used <strong>in</strong> <strong>the</strong>ir productionhave also risen sharply. Consequently, with <strong>the</strong> exception <strong>of</strong> a few countries, <strong>the</strong> production and use <strong>of</strong>bi<strong>of</strong>uels, and <strong>in</strong>deed <strong>of</strong> most new alternative energy sources, depend on public policies.The success <strong>of</strong> <strong>the</strong>se policies is related to <strong>the</strong> exist<strong>in</strong>g price structure <strong>in</strong> each country. Policies are unlikelyto succeed when promoted <strong>in</strong> countries where petroleum derivatives prices are subsidized or carry a taxburden that does not cover <strong>the</strong> costs <strong>of</strong> externalities <strong>in</strong> <strong>the</strong> production and use <strong>of</strong> fossil fuels. Similarly, <strong>in</strong>countries where fuel prices are established ad hoc, <strong>the</strong> lack <strong>of</strong> price predictability erodes <strong>the</strong> viability <strong>of</strong>required <strong>in</strong>vestments for agricultural production and <strong>the</strong> <strong>in</strong>stallation <strong>of</strong> <strong>in</strong>frastructure for <strong>the</strong> distribution,retail sale and use <strong>of</strong> bi<strong>of</strong>uels, unless substantial fiscal <strong>in</strong>centives or mandatory measures are <strong>in</strong>troduced.While public policies aimed at bi<strong>of</strong>uels promotion can have several formats, <strong>the</strong>y are based on three <strong>in</strong>struments:(i) f<strong>in</strong>ancial support <strong>in</strong> <strong>the</strong> form <strong>of</strong> tax exemption or reduction, or <strong>the</strong> concession <strong>of</strong> direct fiscal<strong>in</strong>centives for agents <strong>in</strong> <strong>the</strong> supply cha<strong>in</strong> or for bi<strong>of</strong>uel consumers; (ii) mandatory quotas that require am<strong>in</strong>imum participation <strong>of</strong> bi<strong>of</strong>uels <strong>in</strong> <strong>the</strong> automotive fuel matrix; and (iii) commercial restrictions <strong>in</strong> <strong>the</strong>form <strong>of</strong> custom taxes on bi<strong>of</strong>uel imports to protect domestic production.Measures <strong>of</strong> f<strong>in</strong>ancial support impact <strong>the</strong> public budget, ei<strong>the</strong>r through <strong>in</strong>come loss due to fiscal waiversor additional expense through fiscal <strong>in</strong>centives. These <strong>the</strong>refore represent a transfer from taxpayers to <strong>the</strong>producers or users <strong>of</strong> bi<strong>of</strong>uels. The United States is an example <strong>of</strong> a country that subsidizes producers andblenders, whereas Sweden grants tax exemption to bi<strong>of</strong>uels. The United K<strong>in</strong>gdom abandoned fiscal waivers,while Germany has been progressively reduc<strong>in</strong>g this practice.
220 Ethanol and Bioelectricity <strong>Sugarcane</strong> <strong>in</strong> <strong>the</strong> <strong>Future</strong> <strong>of</strong> <strong>the</strong> <strong>Energy</strong> <strong>Matrix</strong>Mandatory quotas can be accompanied by f<strong>in</strong>es on fuel suppliers who fail to comply with requirements, orblend certificates that can be traded between suppliers that exceed <strong>the</strong>ir quotas and o<strong>the</strong>rs that fail to reach<strong>the</strong>m. These measures do not impact <strong>the</strong> public budget, but imply greater costs for users who transfer <strong>in</strong>cometo agents <strong>in</strong> <strong>the</strong> bi<strong>of</strong>uels supply cha<strong>in</strong>. The United States, <strong>the</strong> United K<strong>in</strong>gdom and Germany all apply mandatoryquotas <strong>in</strong> <strong>the</strong>ir bi<strong>of</strong>uels promotion policies. In <strong>the</strong> United K<strong>in</strong>gdom, <strong>the</strong> adoption <strong>of</strong> quotas is accompaniedby certificate emissions, while <strong>in</strong> Germany <strong>the</strong> obligation can be transferred to o<strong>the</strong>r suppliers.Restrictions imposed on bi<strong>of</strong>uel importation protect domestic production aga<strong>in</strong>st foreign producers who aremore efficient or who enjoy comparative advantages that reduce production costs. These measures limit <strong>the</strong>prospects for development <strong>of</strong> more competitive suppliers <strong>in</strong> o<strong>the</strong>r countries and impose a transfer from consumersto domestic producers. The United States and EU countries impose custom duties on bi<strong>of</strong>uels imports.However, <strong>the</strong> analyses presented <strong>in</strong> this study suggest that <strong>the</strong> future demand for ethanol <strong>in</strong> <strong>the</strong>se countries isunlikely to be met without importation. This is even more <strong>the</strong> case when tak<strong>in</strong>g <strong>in</strong>to account that <strong>the</strong> susta<strong>in</strong>abilitycriteria established by <strong>the</strong> United States and <strong>the</strong> EU <strong>in</strong> <strong>the</strong>ir energy policies for fossil fuel substitutionrestrict <strong>the</strong> use <strong>of</strong> certa<strong>in</strong> technological production paths exist<strong>in</strong>g <strong>in</strong> <strong>the</strong>se countries.The prospect for <strong>in</strong>ternationaliz<strong>in</strong>g <strong>the</strong> use <strong>of</strong> bi<strong>of</strong>uels creates opportunities not only for export<strong>in</strong>g raw material,but also technology. For Brazil to ma<strong>in</strong>ta<strong>in</strong> its leadership <strong>in</strong> <strong>the</strong> ethanol market, it is vital to open upimport<strong>in</strong>g markets, grant <strong>in</strong>centives for <strong>in</strong>vestment <strong>in</strong> research and development, seek technological <strong>in</strong>novationthat secures competitive production, create new uses for <strong>the</strong> product, and encourage <strong>the</strong> market forbyproducts.
International Bi<strong>of</strong>uels Policies221
222 Ethanol and Bioelectricity <strong>Sugarcane</strong> <strong>in</strong> <strong>the</strong> <strong>Future</strong> <strong>of</strong> <strong>the</strong> <strong>Energy</strong> <strong>Matrix</strong>Bibiography. Christiansen, R. C. (2009), Sweden’s Drive for E85. Ethanol Producer Magaz<strong>in</strong>e. Accessed on 28 August 2009, at: http://www.ethanolproducer.com/article.jsp?article_id=5737.. Dahlbacka, B. (2009), Bi<strong>of</strong>uels Annual: Sweden. Global Agricultural Information Network. Accessed on 10 July 2009, at:http://ga<strong>in</strong>.fas.usda.gov/Recent%20GAIN%20Publications/Bi<strong>of</strong>uels%20Annual_Stockholm_Sweden_6-24-2009.pdf.. Davoust, R. (2008), Gasol<strong>in</strong>e and Diesel Prices and Taxes <strong>in</strong> Industrialized Countries. Institut Français des RelationsInternationales. Accessed on 7 July 2009, at: www.ifri.org/files/Energie/Davoustang.pdf.. DOE (2009), Department <strong>of</strong> <strong>Energy</strong>, State & Federal Incentives & Laws. Accessed on 9 July 2009, at: http://www.afdc.energy.gov/afdc/progs/fed_summary.php/afdc/US/0.. EC (2006), Commission <strong>of</strong> <strong>the</strong> European Communities, An EU Strategy for Bi<strong>of</strong>uels. Accessed on 17 September 2009, at:http://eur-lex.europa.eu/LexUriServ/LexUriServ.do?uri=COM:2006:0034:FIN:EN:PDF.. EC (2007), Commission <strong>of</strong> <strong>the</strong> European Communities, Renewable <strong>Energy</strong> Road Map. Accessed on 17 September 2009,at: http://ec.europa.eu/energy/energy_policy/doc/03_renewable_energy_roadmap_en.pdf.. EIA (2009a), <strong>Energy</strong> Information Adm<strong>in</strong>istration, “International <strong>Energy</strong> Statistics”. Accessed on 23 July 2009, at: http://tonto.eia.doe.gov/cfapps/ipdbproject/ied<strong>in</strong>dex3.cfm?tid=79&pid=81&aid=2&cid=ww,&syid=2000&eyid=2007&unit=TBPD.. EIA (2009b), <strong>Energy</strong> Information Adm<strong>in</strong>istration, Updated Annual <strong>Energy</strong> Outlook 2009. Accessed on 14 September2009, at: http://www.eia.doe.gov/oiaf/servicerpt/stimulus/pdf/sroiaf(2009)03.pdf.. <strong>Energy</strong> Daily (2008), Ghana to produce ethanol for export to Sweden. Accessed on 21 August 2009, at: http://www.energy-daily.com/reports/Ghana_to_produce_ethanol_for_export_to_Sweden_999.html.. EPA (2009), United States Environmental Protection Agency, EPA Proposes New Regulations for <strong>the</strong> NationalRenewable Fuel Standard Program for 2010 and Beyond. Accessed on 31 August 2009, at: http://www.epa.gov/otaq/renewablefuels/420f09023.pdf.. Federal M<strong>in</strong>istry <strong>of</strong> Economics and Technology (2009), Renewables made <strong>in</strong> Germany, bi<strong>of</strong>uels <strong>in</strong> Germany. Accessed on24 July 2009, at: http://www.renewables-made-<strong>in</strong>-germany.com/en/biokraftst<strong>of</strong>fe/.. Flach, B. (2009), EU-27 Bi<strong>of</strong>uels Annual. Global Agricultural Information Network. Accessed on 10 July 2009, at: http://ga<strong>in</strong>.fas.usda.gov/Recent%20GAIN%20Publications/General%20Report_The%20Hague_Ne<strong>the</strong>rlands-Germany%20EU-27_6-15-2009.pdf.. Fulton, L. et al. (2004), Bi<strong>of</strong>uels for Transport: An International Perspective. International <strong>Energy</strong> Agency. Accessed on23 July 2009, at: http://www.iea.org/textbase/nppdf/free/2004/bi<strong>of</strong>uels2004.pdf.. Godoy, J. (2007), German Biodiesel Forced to Compete. InterPress Service. Accessed on 31 August 2009, at: http://ipsnews.net/news.asp?idnews=40634.. GTZ (2009), German Technical Cooperation, International Fuel Prices 2009. Accessed on 7 July 2009, at: http://www.gtz.de/de/dokumente/en-<strong>in</strong>t-fuel-prices-6th-edition-gtz2009-corrected.pdf.. Koplow, D. (2009), A Boon to Bad Bi<strong>of</strong>uels. Friends <strong>of</strong> <strong>the</strong> Earth. Accessed on 8 July 2009, at: http://www.foe.org/sites/default/files/FOE%20VEETC%20Evaluation%20FINAL.pdf.. Mabee, W. E. et al. (2009), Update on implementation agendas 2009. Union zur Förderung Von Oel- und Prote<strong>in</strong>pflanzene. V. (UFOP). Accessed on 17 August 2009, at: http://www.ufop.de/downloads/Task39(1).pdf.. OECD (2008), Organization for Economic Co-operation and Development, Economic Assessment <strong>of</strong> Bi<strong>of</strong>uel SupportPolicies. Accessed on 19 June 2009, at: http://www.wilsoncenter.org/news/docs/brazil.oecd.bi<strong>of</strong>uel.support.policy.pdf.
International Bi<strong>of</strong>uels Policies223. Open Congress (2009), H.R.2454 – American Clean <strong>Energy</strong> And Security Act <strong>of</strong> 2009. Accessed on 25 August 2009, at:http://www.opencongress.org/bill/111-h2454/show.. Owen J. e Rich, C. (2009), EPA Issues Proposed Renewable Fuels Standard Implement<strong>in</strong>g Regulations; Adm<strong>in</strong>istrationMakes Stimulus Funds Available for Bi<strong>of</strong>uels. Van Ness Feldman. Accessed on 31 August 2009, at: http://www.vnf.com/news-policyupdates-359.html.. REN21 (2009), Renewable <strong>Energy</strong> Policy Network for <strong>the</strong> 21st Century, Renewables Global Status Report 2009 Update.Accessed on 21 August 2009, at: http://www.ren21.net/pdf/RE_GSR_2009_Update.pdf.. RFA (2009a), Renewable Fuels Association, Federal Regulations: Renewable Fuels Standard. Accessed on 21 August 2009,at: http://www.ethanolrfa.org/policy/regulations/federal/standard/.. RFA (2009b), Renewable Fuels Association, Cellulosic Ethanol. Accessed on 7 July 2009, at: http://www.ethanolrfa.org/resource/cellulosic/.. UNICA (2009a), Brazilian <strong>Sugarcane</strong> Industry Association, Carta da UNICA enviada a EPA. Accessed on 24 August 2009,at: http://www.unica.com.br/multimedia/publicacao/.. UNICA (2009b), Brazilian <strong>Sugarcane</strong> Industry Association, Nosso etanol é sustentável. Accessed on 31 August 2009, at:http://www.unica.com.br/clipp<strong>in</strong>g/show.asp?cppCode=A6FE3748-E56A-40C1-AB2F-5D61E188E829.. Wittke, F. e Zies<strong>in</strong>g, H., (2004), Economic Bullet<strong>in</strong> 3/2004. Deutsches Institut für Wirtschaftsforschung - DIW Berl<strong>in</strong>.Accessed on 23 July 2009, at: http://www.diw.de/english/economic_bullet<strong>in</strong>_03/2004/33639.html#pgfId-515558.
224 Ethanol and Bioelectricity <strong>Sugarcane</strong> <strong>in</strong> <strong>the</strong> <strong>Future</strong> <strong>of</strong> <strong>the</strong> <strong>Energy</strong> <strong>Matrix</strong>Explanatory NotesiSome studies question <strong>the</strong> technical viability <strong>of</strong> us<strong>in</strong>g gasol<strong>in</strong>e blended with more than 10% <strong>of</strong> ethanol without modify<strong>in</strong>g vehicle systems.Among <strong>the</strong> contentious issues are <strong>the</strong> <strong>in</strong>crease <strong>in</strong> emissions <strong>of</strong> nitrogen oxide and aldehydes, and <strong>the</strong> <strong>in</strong>crease <strong>in</strong> consumption, along with <strong>the</strong>reduction <strong>in</strong> <strong>the</strong> durability <strong>of</strong> vehicle components such as catalytic converters. UNICA questioned <strong>the</strong>se f<strong>in</strong>d<strong>in</strong>gs <strong>in</strong> a letter sent to <strong>the</strong> U.S.Environmental Protection Agency (UNICA, 2009a).iiThe lifecycle analysis <strong>of</strong> fuels calculates greenhouse gas emissions orig<strong>in</strong>at<strong>in</strong>g from <strong>the</strong> prospection, production, distribution, and f<strong>in</strong>al use <strong>of</strong>fuels. In <strong>the</strong> case <strong>of</strong> bi<strong>of</strong>uels, it also <strong>in</strong>cludes emissions result<strong>in</strong>g from <strong>the</strong> direct or <strong>in</strong>direct alteration to land-use <strong>in</strong> o<strong>the</strong>r countries as a result<strong>of</strong> <strong>the</strong> production <strong>of</strong> renewable fuels.iiiOECD member countries <strong>in</strong>clude Australia, Canada, <strong>the</strong> United States, South Korea, Mexico, Japan, New Zealand, Turkey and 22 Europeancountries.ivThe graphs are presented to illustrate <strong>the</strong> classification <strong>of</strong> countries accord<strong>in</strong>g to <strong>the</strong> level <strong>of</strong> fiscal <strong>in</strong>centives and taxation. Depend<strong>in</strong>g on <strong>the</strong>reference period for <strong>the</strong> prices, <strong>the</strong> relative positions <strong>of</strong> <strong>the</strong> countries may change, <strong>in</strong>clud<strong>in</strong>g <strong>the</strong>ir position with<strong>in</strong> <strong>the</strong> categories.vFor purposes <strong>of</strong> this paper, a fuel is considered to be subsidized when its consumer price is lower than a reference (benchmark) price thatrepresents an estimate <strong>of</strong> an “economic price” calculated us<strong>in</strong>g commercial fundamentals.viThe retail prices <strong>of</strong> fuels shown for <strong>the</strong> United States <strong>in</strong>clude <strong>in</strong>dustry costs and pr<strong>of</strong>its marg<strong>in</strong>s, value added tax, and a specific fuel tax <strong>of</strong>approximately US$0.10 per liter that goes towards <strong>the</strong> ma<strong>in</strong>tenance and build<strong>in</strong>g <strong>of</strong> roads. Because it does not <strong>in</strong>clude o<strong>the</strong>r forms <strong>of</strong> specifictaxation, <strong>the</strong> US price is adopted as a reference for <strong>the</strong> m<strong>in</strong>imum price <strong>of</strong> derivatives without fiscal <strong>in</strong>centives.viiFor purposes <strong>of</strong> this paper, we consider a fuel to be taxed when its consumer price is higher than its reference (benchmark) price whichrepresents an estimated “economic price” calculated accord<strong>in</strong>g to commercial fundamentals.viiiThe EU-15 comprises <strong>the</strong> <strong>in</strong>itial member countries <strong>of</strong> <strong>the</strong> EU, who jo<strong>in</strong>ed before <strong>the</strong> accession <strong>of</strong> 10 new countries on May 1, 2004.ixFlorida, Hawaii, Iowa, Kansas, Louisiana, M<strong>in</strong>nesota, Missouri, Montana, Oregon and Wash<strong>in</strong>gton.xAn Updated Annual <strong>Energy</strong> Outlook 2009 Reference Case Reflect<strong>in</strong>g Provisions <strong>of</strong> <strong>the</strong> American Recovery and Re<strong>in</strong>vestment Act and RecentChanges <strong>in</strong> <strong>the</strong> Economic Outlook (EIA, 2009b).xiThe Blair House Agreement <strong>of</strong> 1992 allowed <strong>the</strong> EU to produce oil seeds for non-food purposes up to <strong>the</strong> equivalent to one million tonnes <strong>of</strong> soy.xiiThe <strong>of</strong>ficial name <strong>of</strong> <strong>the</strong> Directive on <strong>the</strong> Promotion <strong>of</strong> <strong>the</strong> Use <strong>of</strong> Bi<strong>of</strong>uels and O<strong>the</strong>r Renewable Fuels for Transport.xiiiThe CAP is a system <strong>of</strong> a fiscal <strong>in</strong>centives and agricultural programs <strong>in</strong> <strong>the</strong> EU, which <strong>in</strong> 2006 consumed 48% <strong>of</strong> <strong>the</strong> EU’s €49.8 billionbudget. The CAP takes a three-pronged approach: i) <strong>the</strong> unification <strong>of</strong> markets for <strong>the</strong> free movement <strong>of</strong> agricultural products with<strong>in</strong> <strong>the</strong>EU; (ii) f<strong>in</strong>ancial solidarity with regards to all <strong>the</strong> costs <strong>of</strong> CAP, which are f<strong>in</strong>anced by a communal treasury supported by import tariffs andcontributions from European countries; and iii) community preference, so that EU products enjoy preferential treatment over imports.xivDeveloped by Sekap (Svensk Etanolkemi AB), one <strong>of</strong> <strong>the</strong> largest producers, importers, and vendors <strong>of</strong> ethanol <strong>in</strong> Europe, ED95 is an ethanolblend with a 5% ignition additive that is used <strong>in</strong> buses and trucks with adapted diesel eng<strong>in</strong>es.xvThe congestion tariff <strong>in</strong> Stockholm is applied to vehicles enter<strong>in</strong>g and exit<strong>in</strong>g <strong>the</strong> city.xviThe Renewable Transport Fuel Obligation Order 2007 orig<strong>in</strong>ally stipulated an <strong>in</strong>crease <strong>in</strong> <strong>the</strong> obligation from 2.5% <strong>in</strong> 2008-09 to 3.75% <strong>in</strong>2009-10, and to 5% <strong>in</strong> 2010-11. These percentages were changed by <strong>the</strong> Renewable Transport Fuel Obligation (Amendment) Order 2009,which came <strong>in</strong>to operation on April 15, 2009.xviiIn March 2009, specific tariffs on fossil fuels <strong>in</strong> Germany were €0.4704/liter for low-sulfur diesel and €0.6545/liter for unleaded gasol<strong>in</strong>e. Inaddition to <strong>the</strong>se tributes, <strong>the</strong>re was also 19% VAT on <strong>the</strong> f<strong>in</strong>al price <strong>of</strong> all fuels, fossil or not. The sum <strong>of</strong> <strong>the</strong> taxes on fossil fuels averages€1.03 per liter for diesel and €1.22 per liter for gasol<strong>in</strong>e.xviiiThe difference <strong>of</strong> €0.02 between <strong>the</strong> tax for vegetable oil and diesel serves to compensate for <strong>the</strong> lower caloric value <strong>of</strong> vegetable oil.xixIn December 2006, <strong>the</strong>se values were €16/GJ for biodiesel and €38/J for ethanol.
International Bi<strong>of</strong>uels Policies225
226 Ethanol and Bioelectricity <strong>Sugarcane</strong> <strong>in</strong> <strong>the</strong> <strong>Future</strong> <strong>of</strong> <strong>the</strong> <strong>Energy</strong> <strong>Matrix</strong>08
Ethanol and Bioelectricity <strong>Sugarcane</strong> <strong>in</strong> <strong>the</strong> <strong>Future</strong> <strong>of</strong> <strong>the</strong> <strong>Energy</strong> <strong>Matrix</strong>227Ethanol Market andCompetitionElizabeth Far<strong>in</strong>aClaudia ViegasPaula PeredaCarol<strong>in</strong>a Garcia
228 Ethanol and Bioelectricity <strong>Sugarcane</strong> <strong>in</strong> <strong>the</strong> <strong>Future</strong> <strong>of</strong> <strong>the</strong> <strong>Energy</strong> <strong>Matrix</strong>To a greater or lesser extent, fuel production and distribution has historically been regulated<strong>in</strong> every country <strong>in</strong> <strong>the</strong> world. The availability <strong>of</strong> energy is strategic for any economy, and <strong>the</strong>reliance on non-renewable sources represents challenges that are not trivial for public policy.Despite <strong>the</strong>ir seasonality and <strong>the</strong> possibility <strong>of</strong> harvest failures, renewable sources help tomitigate <strong>the</strong> problems caused by dependence on fossil fuels.In Brazil, ethanol production takes place with<strong>in</strong> a relatively dispersed market. In this context,<strong>the</strong> question that must be asked is: does this ensure an adequate supply <strong>of</strong> ethanol? Theanswer depends, <strong>in</strong> part, on <strong>the</strong> policies adopted for petroleum derivatives, and <strong>in</strong> <strong>the</strong> case<strong>of</strong> Brazil, this <strong>in</strong> turn depends on Petrobras’ pric<strong>in</strong>g policy for derivatives. However, s<strong>in</strong>ce itis clearly shown that hydrous ethanol consumers are more price-sensitive than those <strong>of</strong> TypeC gasol<strong>in</strong>e, we can conclude that <strong>in</strong> terms <strong>of</strong> public policies for ethanol, <strong>the</strong> price variable isadequate for regulat<strong>in</strong>g <strong>the</strong> market.
Ethanol Market and Competition229With respect to anhydrous ethanol, <strong>the</strong> variation <strong>of</strong> <strong>the</strong> mandatory blend – which must liebetween 20% to 25% – has so far been an efficient way to reduce price volatility <strong>in</strong> <strong>the</strong> TypeC gasol<strong>in</strong>e market <strong>in</strong> times <strong>of</strong> scarcity. Changes <strong>in</strong> <strong>the</strong> blend percentage are justified onlyby harvest failures that endanger <strong>the</strong> supply <strong>of</strong> anhydrous ethanol for blend<strong>in</strong>g <strong>in</strong>to Type Cgasol<strong>in</strong>e. This policy should not be used to address seasonal variations, because unjustifiedchanges <strong>in</strong>crease bus<strong>in</strong>ess risk and <strong>the</strong> susta<strong>in</strong>ability <strong>of</strong> ethanol production.Among various priority measures, this paper defends <strong>the</strong> follow<strong>in</strong>g: establishment <strong>of</strong> technicalcriteria to monitor <strong>the</strong> market with <strong>the</strong> aim <strong>of</strong> identify<strong>in</strong>g harvest failures; allow<strong>in</strong>g agentsa wider range <strong>of</strong> action to <strong>in</strong>crease liquidity <strong>in</strong> <strong>the</strong> market; and <strong>in</strong>tensification <strong>of</strong> mechanismsfor ma<strong>in</strong>ta<strong>in</strong><strong>in</strong>g private stocks <strong>of</strong> ethanol.Improv<strong>in</strong>g <strong>the</strong> operation <strong>of</strong> <strong>the</strong> market with a m<strong>in</strong>imum <strong>of</strong> <strong>in</strong>tervention is <strong>the</strong> most efficientway to correctly stimulate <strong>the</strong> susta<strong>in</strong>able expansion <strong>of</strong> production.
230 Ethanol and Bioelectricity <strong>Sugarcane</strong> <strong>in</strong> <strong>the</strong> <strong>Future</strong> <strong>of</strong> <strong>the</strong> <strong>Energy</strong> <strong>Matrix</strong>1 IntroductionIt is essential to understand <strong>the</strong> supply cha<strong>in</strong> for anhydrous and hydrous ethanol if we are to exam<strong>in</strong>ecompetition patterns observed throughout all levels <strong>of</strong> <strong>the</strong> liquid fuels sector <strong>in</strong> Brazil, toge<strong>the</strong>r with <strong>the</strong>consequences for domestic market supply and for public policy.Figure 1 illustrates <strong>the</strong> flows with<strong>in</strong> <strong>the</strong> entire agri-<strong>in</strong>dustrial system <strong>of</strong> <strong>the</strong> sugarcane bus<strong>in</strong>ess. This presentstudy focuses on <strong>the</strong> ethanol production subsystem, even though <strong>the</strong> <strong>in</strong>ter-relationship with <strong>the</strong> sugarsubsystem is essential to understand<strong>in</strong>g <strong>the</strong> dynamics <strong>of</strong> <strong>the</strong> former.With <strong>the</strong> aim <strong>of</strong> discuss<strong>in</strong>g <strong>the</strong> possible outl<strong>in</strong>es <strong>of</strong> a public policy for <strong>the</strong> ethanol market, this article isstructured as follows:Section 2 presents general aspects <strong>of</strong> <strong>the</strong> bi<strong>of</strong>uels market <strong>in</strong> Brazil, highlight<strong>in</strong>g <strong>the</strong> relationships betweensugar and ethanol, gasol<strong>in</strong>e and hydrous ethanol, and anhydrous and hydrous ethanol. In section 3, <strong>the</strong>ethanol supply cha<strong>in</strong> is studied, exam<strong>in</strong><strong>in</strong>g <strong>the</strong> competitive environment and concentration <strong>in</strong> differentsegments <strong>in</strong> <strong>the</strong> supply cha<strong>in</strong>. Section 4 is dedicated to estimat<strong>in</strong>g <strong>the</strong> domestic demand <strong>of</strong> hydrous ethanoland Type C gasol<strong>in</strong>e. Section 5 looks at <strong>the</strong> impacts <strong>of</strong> variations <strong>in</strong> <strong>the</strong> price <strong>of</strong> anhydrous ethanol onvariations <strong>in</strong> <strong>the</strong> gasol<strong>in</strong>e price and calculates by how much production has to fall to constitute a situation<strong>of</strong> risk for anhydrous ethanol supply.In conclusion, this paper discusses <strong>the</strong> role and <strong>the</strong> outl<strong>in</strong>es <strong>of</strong> a public policy that would encourage renewableenergy production, <strong>in</strong> particular sugarcane ethanol, and guarantees regular supply <strong>of</strong> <strong>the</strong> market.Graph 1Production, exports and domestic sales <strong>of</strong> ethanol In billions liters3025201510502000 2001 2002 2003 2004 2005 2006 2007 2008Ethanol production Domestic sales by distributors Volume exportedSource: UNICA. ANP. Prepared by <strong>the</strong> authors.
Ethanol Market and Competition2312 General characteristics <strong>of</strong> <strong>the</strong> Brazilian bi<strong>of</strong>uels marketBrazilian ethanol production has been boosted by growth <strong>in</strong> domestic consumption, most notably with <strong>the</strong>arrival <strong>of</strong> flex-fuel vehicles <strong>in</strong> 2003 – see Graph 1. Until 2003, <strong>the</strong> market was susta<strong>in</strong>ed by a mandatoryblend <strong>of</strong> anhydrous ethanol <strong>in</strong> gasol<strong>in</strong>e and by an ag<strong>in</strong>g fleet <strong>of</strong> ethanol-powered vehicles. Th<strong>in</strong>gs changed<strong>in</strong> 2004, as shown <strong>in</strong> Table 1. In 2004, flex-fuel vehicles represented 2% <strong>of</strong> <strong>the</strong> fleet; <strong>in</strong> 2008 <strong>the</strong>y wereequivalent to 31%. The result was rapid growth <strong>in</strong> <strong>the</strong> demand for hydrous ethanol, which overtook TypeC gasol<strong>in</strong>e sales <strong>in</strong> 2009.2.1 Relation between sugar and ethanolThe sugar and ethanol markets compete for <strong>the</strong> same raw material <strong>in</strong>put, namely planted and crushed sugarcane.From <strong>the</strong> supply side, <strong>the</strong>refore, <strong>the</strong>y could be considered as compet<strong>in</strong>g products. This relationshipis beneficial for <strong>the</strong> producer, who can count on alternatives <strong>in</strong> <strong>the</strong> event <strong>of</strong> demand/supply shocks for <strong>the</strong>product. It acts as a reducer <strong>of</strong> bus<strong>in</strong>ess risk, given that <strong>the</strong>se products are <strong>in</strong>dependent on <strong>the</strong> demandside, that is, <strong>the</strong>y are <strong>in</strong>dependent from <strong>the</strong> consumer’s po<strong>in</strong>t <strong>of</strong> view.Sugar and ethanol production reacts to relative prices and technical characteristics. Sugar mills with attacheddistilleries can direct cane juice from crush<strong>in</strong>g to <strong>the</strong> production <strong>of</strong> sugar or ethanol, depend<strong>in</strong>g on<strong>the</strong> relative pr<strong>of</strong>itability <strong>of</strong> <strong>the</strong> two products. The decision also depends on ra<strong>in</strong>fall. Dur<strong>in</strong>g ra<strong>in</strong>y periods,<strong>the</strong> sugar content <strong>of</strong> <strong>the</strong> cane is low and it is preferable to produce as much ethanol as possible, reduc<strong>in</strong>gsugar production to a necessary m<strong>in</strong>imum, with <strong>the</strong> opposite happen<strong>in</strong>g dur<strong>in</strong>g dry periods. However,production plants have a pre-determ<strong>in</strong>ed volume <strong>of</strong> cane to crush dur<strong>in</strong>g <strong>the</strong> harvest and limited capacityTable 1Light vehicle fleet In unitsYear Flex-fuel Gasol<strong>in</strong>e Ethanol Total2000 12,171,156 3,088,471 15,259,6272001 13,259,902 2,704,089 15,963,9852002 14,201,202 2,353,114 16,554,3162003 48,142 14,972,939 1,990,045 17,011,1262004 331,762 15,560,064 1,698,340 17,590,1662005 1,182,052 15,807,570 1,389,977 18,379,5992006 2,596,846 15,534,130 1,122,169 19,253,1452007 4,568,256 15,106,423 899,183 20,573,8622008 6,843,750 14,554,392 711,428 22,109,570Source: Anfavea/UNICA.
232 Ethanol and Bioelectricity <strong>Sugarcane</strong> <strong>in</strong> <strong>the</strong> <strong>Future</strong> <strong>of</strong> <strong>the</strong> <strong>Energy</strong> <strong>Matrix</strong>Figure 1Agri-<strong>in</strong>dustrial <strong>Sugarcane</strong> SystemFertilizers, pesticides andnutrients<strong>Sugarcane</strong> productionOwn productionThird-party suppliersIndustrial equipmentAgricultural mach<strong>in</strong>eryChemical productsCivil constructionAutoparts andma<strong>in</strong>tenance servicesDealers and cooperativesFuel oil and lubricantsDiesel oil and lubricantSack<strong>in</strong>g, bagsAssembly andma<strong>in</strong>tenance servicesTruck tractors,semi trailers, trucksLaboratory materialand PPEImplementsPPESource: Prepared by Neves, Tromb<strong>in</strong>, Consoli, 2009.
Ethanol Market and Competition233Mills and distilleriesBeverage andcosmetic <strong>in</strong>dustriesEthanolDistributorFill<strong>in</strong>g stationBioelectricityBioplasticDistributorSpecial consumerFree consumerF<strong>in</strong>al ConsumerCarbon creditRetailSugarWholesalerFood <strong>in</strong>dustry and o<strong>the</strong>rsYeast and addictivesAnimal feed <strong>in</strong>dustry
234 Ethanol and Bioelectricity <strong>Sugarcane</strong> <strong>in</strong> <strong>the</strong> <strong>Future</strong> <strong>of</strong> <strong>the</strong> <strong>Energy</strong> <strong>Matrix</strong>to produce sugar and ethanol. There are <strong>the</strong>refore operational constra<strong>in</strong>ts to <strong>the</strong> productive process thatrequire comb<strong>in</strong>ed mill-distilleries to produce both sugar and ethanol, with <strong>the</strong> marg<strong>in</strong> <strong>of</strong> substitution <strong>of</strong><strong>the</strong>se products vary<strong>in</strong>g from 5% to 10% (Zanão, 2009). The production <strong>of</strong> a typical Brazilian mill-distilleryis shown <strong>in</strong> Figure 2.Ano<strong>the</strong>r factor that <strong>in</strong>fluences <strong>the</strong> production decision <strong>of</strong> mill-distilleries is <strong>the</strong> cost <strong>of</strong> stock<strong>in</strong>g ethanol,which due to <strong>the</strong> specific characteristics <strong>of</strong> <strong>the</strong> product is extremely high. Investments <strong>in</strong> storage assetsare specific to <strong>the</strong> production volume <strong>of</strong> ethanol and could represent an economic limitation for switch<strong>in</strong>gbetween sugar and ethanol to respond to changes <strong>in</strong> <strong>the</strong> relative price.Xavier (2008) classifies ethanol storage <strong>in</strong>frastructure <strong>in</strong> Brazil <strong>in</strong> two major categories: <strong>the</strong> first compris<strong>in</strong>gfuel tanks that belong to <strong>the</strong> distilleries; and <strong>the</strong> second compris<strong>in</strong>g tanks operated by distributors, Transpetroterm<strong>in</strong>als, ethanol collection centers and, to a lesser extent, port term<strong>in</strong>als. The same author estimatesthat a typical distillery has sufficient tankage to store 50% <strong>of</strong> its total production for one harvest.With respect to <strong>the</strong> static capacity for ethanol storage <strong>in</strong> Brazil, Zanão (2009) reports that distilleries canstore approximately 11.6 billion liters. With<strong>in</strong> this total tankage, 5.3 billion liters or 45% is for anhydrousethanol, while 6.3 billion liters or 55% is for hydrous ethanol. Distilleries <strong>in</strong> <strong>the</strong> state <strong>of</strong> São Paulo accountedfor 56.2% <strong>of</strong> total national storage capacity dur<strong>in</strong>g <strong>the</strong> 2007/2008 harvest.Figure 2Production <strong>of</strong> a typical Brazilian comb<strong>in</strong>ed sugar mill and ethanol distillery1.3 million tonnes <strong>of</strong> sugarcane/year, <strong>in</strong> 2008 i57 kg <strong>of</strong> sugar 0.0000 TPEFood1 ton <strong>of</strong> sugarcane0.160 TEP50.6 litres <strong>of</strong> ethanol 0.0238 TPE140kg <strong>of</strong>dried bagasseFuel17%Fuel0.0098 TPE21% <strong>of</strong> <strong>the</strong>energy fromsugarcane is used140kg dry trash0.0000 TPEBurned <strong>in</strong> <strong>the</strong> sugarcane plantationAverage vapor consumption <strong>in</strong> <strong>the</strong> production plant: 530 kg/t <strong>of</strong> sugarcaneSource: : Center <strong>of</strong> <strong>Sugarcane</strong> Technology, from Simtec 2008 (International Symposium and Technology Show for Sugar andEthanol Agribus<strong>in</strong>ess)
Ethanol Market and Competition2352.2 Relationship between gasol<strong>in</strong>e and hydrous ethanolBrazil’s Proálcool (national ethanol promotion program) was created <strong>in</strong> <strong>the</strong> 1970s as a response to <strong>the</strong> two oilcrises that pushed up <strong>in</strong>ternational prices. The program created a basis for fuel ethanol to return <strong>the</strong> nationalenergy matrix, <strong>in</strong>clud<strong>in</strong>g <strong>the</strong> <strong>in</strong>troduction <strong>of</strong> ethanol used by itself as a fuel. Even with <strong>the</strong> high oil prices <strong>of</strong><strong>the</strong> period, hydrous ethanol depended on subsidies to be competitive with gasol<strong>in</strong>e. Petrobras played an importantrole <strong>in</strong> creat<strong>in</strong>g and develop<strong>in</strong>g <strong>the</strong> fuel ethanol market, given that it made possible <strong>the</strong> distribution<strong>of</strong> ethanol through <strong>the</strong> same retail channels as gasol<strong>in</strong>e and diesel distribution.The development <strong>of</strong> <strong>the</strong> Brazilian ethanol fuel market also reveals how sensitive technological developmentcan be to changes <strong>in</strong> <strong>the</strong> market <strong>of</strong> <strong>the</strong> substituted product <strong>in</strong> <strong>the</strong> short and medium term. After <strong>the</strong> <strong>in</strong>itialboost given by Proálcool, technological development lost momentum due to decl<strong>in</strong><strong>in</strong>g oil prices and hydrousethanol’s “loss <strong>of</strong> reputation” as a gasol<strong>in</strong>e substitute. At this time, fuel substitution effectively occurred at <strong>the</strong>moment when <strong>the</strong> vehicle was purchased or converted. In o<strong>the</strong>r words, <strong>the</strong> consumer migrated totally from<strong>the</strong> market, ceas<strong>in</strong>g to consume Type C gasol<strong>in</strong>e any more. Hydrous ethanol’s loss <strong>of</strong> competitiveness and itslack <strong>of</strong> availability at fill<strong>in</strong>g stations left consumers with no o<strong>the</strong>r option, and this affected <strong>the</strong> reputation <strong>of</strong><strong>the</strong> Proálcool program. The result was that <strong>the</strong> hydrous ethanol fleet virtually ceased to exist.The advent <strong>of</strong> flex-fuel vehicles <strong>in</strong> 2003 transformed <strong>the</strong> fuels market <strong>in</strong> Brazil. The possibility <strong>of</strong> fill<strong>in</strong>g up wi<strong>the</strong>thanol, Type C gasol<strong>in</strong>e or any proportion <strong>of</strong> <strong>the</strong> two types <strong>of</strong> fuel prompted <strong>the</strong> return <strong>of</strong> hydrous ethanolas a potential competitor for Type C gasol<strong>in</strong>e. In that year, 48,000 flex-fuel vehicles were sold. Sales reached2.3 million <strong>in</strong> 2008, demonstrat<strong>in</strong>g not only <strong>the</strong> favorable conditions but also <strong>the</strong> strong participation <strong>of</strong> <strong>the</strong>auto <strong>in</strong>dustry ii .Today, ethanol is competitive with petroleum derivatives with<strong>in</strong> a certa<strong>in</strong> price range, dictated by <strong>the</strong> relativeenergy efficiency <strong>of</strong> <strong>the</strong> fuels. Graph 2 compares <strong>the</strong> history <strong>of</strong> <strong>the</strong> average <strong>in</strong>dex price for a barrel <strong>of</strong> petroleum(WTI) negotiated on <strong>the</strong> New York Mercantile Exchange (NYMEX) with <strong>the</strong> <strong>in</strong>dex price for Brazilian TypeA gasol<strong>in</strong>e (zero ethanol content) and <strong>the</strong> <strong>in</strong>dex consumer price for Type C gasol<strong>in</strong>e. The graph shows <strong>the</strong> gapbetween <strong>the</strong> <strong>in</strong>dexes, highlight<strong>in</strong>g <strong>the</strong> stability <strong>of</strong> Type A and Type C gasol<strong>in</strong>e prices.2.3 Relationship between anhydrous and hydrous ethanolVehicles <strong>in</strong> Brazil use two different types <strong>of</strong> fuel ethanol, hydrous and anhydrous, where <strong>the</strong> latter is blendedwith Type A gasol<strong>in</strong>e by distributors to produce <strong>the</strong> Type C gasol<strong>in</strong>e available at fill<strong>in</strong>g stations. Currently,<strong>the</strong> amount <strong>of</strong> anhydrous ethanol added to Type A gasol<strong>in</strong>e to make Type C gasol<strong>in</strong>e varies between 20%to 25% <strong>in</strong> volume (fixed by <strong>the</strong> M<strong>in</strong>istry <strong>of</strong> Agriculture via Decree No. 3.966/2001, issued under Law no.10.696/2003).S<strong>in</strong>ce anhydrous ethanol is derived from hydrous ethanol iii , its production costs are higher that those for <strong>the</strong>hydrous version. Graph 3 compares anhydrous and hydrous ethanol prices received by producers <strong>in</strong> <strong>the</strong> state
236 Ethanol and Bioelectricity <strong>Sugarcane</strong> <strong>in</strong> <strong>the</strong> <strong>Future</strong> <strong>of</strong> <strong>the</strong> <strong>Energy</strong> <strong>Matrix</strong><strong>of</strong> São Paulo, exclud<strong>in</strong>g shipp<strong>in</strong>g and taxes. The vertical arrows on <strong>the</strong> graph <strong>in</strong>dicate <strong>the</strong> effective start<strong>in</strong>gdates for M<strong>in</strong>istry <strong>of</strong> Agriculture decrees adjust<strong>in</strong>g <strong>the</strong> percentage blend <strong>of</strong> anhydrous ethanol with Type Agasol<strong>in</strong>e, to make Type C gasol<strong>in</strong>e. The respective details are <strong>in</strong> Table 2.S<strong>in</strong>ce <strong>the</strong> 1999/2000 harvest, production <strong>of</strong> anhydrous ethanol has surpassed that <strong>of</strong> hydrous ethanol only<strong>in</strong> <strong>the</strong> period between <strong>the</strong> 2000/2001 and 2004/2005 harvests. From <strong>the</strong> 2003/2004 harvest through <strong>the</strong>2008/2009 harvest, hydrous ethanol production grew at an average rate <strong>of</strong> 21% per year. Graph 4 shows <strong>the</strong>growth trend for ethanol production, reflect<strong>in</strong>g <strong>the</strong> reduction <strong>in</strong> <strong>the</strong> ethanol-powered vehicle fleet at <strong>the</strong> start<strong>of</strong> <strong>the</strong> millennium and <strong>the</strong> advent <strong>of</strong> flex-fuel vehicles as <strong>of</strong> 2003.3 The ethanol supply cha<strong>in</strong>This section analyzes <strong>the</strong> relationship between <strong>the</strong> markets for ethanol, sugar and petroleum derivatives,and <strong>the</strong> impact <strong>of</strong> <strong>the</strong> productive structure on <strong>the</strong> dynamics <strong>of</strong> <strong>the</strong> sector.3.1 The competitive environmentThe role <strong>of</strong> public policy and <strong>the</strong> design <strong>of</strong> market <strong>in</strong>tervention mechanisms depend crucially on <strong>the</strong> competitiveprocess observed <strong>in</strong> each segment <strong>of</strong> <strong>the</strong> supply cha<strong>in</strong>, and <strong>the</strong>ir vertical relationships. With<strong>in</strong> this generalperspective, <strong>the</strong> present section exam<strong>in</strong>es <strong>the</strong> structure and competition pattern <strong>in</strong> <strong>the</strong> ethanol supply cha<strong>in</strong>,Graph 2Comparison <strong>of</strong> price trends for petroleum, Type A gasol<strong>in</strong>e, and Type C gasol<strong>in</strong>e8007006005004003002001000 jan02may sep jan may sep jan may sep jan may sep jan may sep jan may sep jan may sep02 02 03 03 03 04 04 04 05 05 05 06 06 06 07 07 07 08 08 08 jan09 may09Petroleum price <strong>in</strong>dex Type C gasol<strong>in</strong>e price <strong>in</strong>dex Type A gasol<strong>in</strong>e price <strong>in</strong>dexSource: ANP, Bloomberg. Prepared by <strong>the</strong> authors.
Ethanol Market and Competition237pay<strong>in</strong>g particular attention to price-formation mechanisms. The ma<strong>in</strong> focus is on <strong>the</strong> sugar and ethanol productionsegment, and downstream segments – liquid fuel distributors and retailers.There were 423 sugar and ethanol plants registered with <strong>the</strong> M<strong>in</strong>istry <strong>of</strong> Agriculture (MAPA) <strong>in</strong> Brazil as <strong>of</strong>August 2009. Of <strong>the</strong>se 248 were mixed units (produc<strong>in</strong>g both sugar and ethanol), 159 were distilleries (produc<strong>in</strong>gjust ethanol) and 16 produced just sugar iv .An important factor <strong>in</strong> <strong>the</strong> competitive environment <strong>of</strong> Brazilian mills is <strong>the</strong> heterogeneity <strong>of</strong> sizes. In <strong>the</strong>Center-South region 58% <strong>of</strong> <strong>the</strong> companies crushed less than two million tonnes <strong>of</strong> cane <strong>in</strong> <strong>the</strong> 2009/2008harvest, represent<strong>in</strong>g only 31% <strong>of</strong> cane crush<strong>in</strong>g <strong>in</strong> <strong>the</strong> region.Table 2Changes to <strong>the</strong> anhydrous ethanol blend <strong>in</strong> gasol<strong>in</strong>eFrom January 2003 to June 2009MAPA Instruction Nº Date published Percentage fixed Operational date17 22/01/03 20% 01/02/03554 27/05/03 25% 01/06/0351 22/02/06 20% 01/03/06278 10/11/06 23% 20/11/06143 27/06/07 25% 01/07/07Source: M<strong>in</strong>istry <strong>of</strong> Agriculture; prepared by <strong>the</strong> authors.Graph 3Price trend <strong>of</strong> anhydrous and hydrous ethanol v1.420% 25% 20% 23% 25%1.21.00.80.60.40.20.0jan03jun03nov03apr04sep04feb05jul05Net price <strong>of</strong> hydrous ethanoldec05may06oct06mar07aug07jan08jun08Net price <strong>of</strong> anhydrous ethanolnov08apr09Source: UNICA, prepared by <strong>the</strong> authors.
238 Ethanol and Bioelectricity <strong>Sugarcane</strong> <strong>in</strong> <strong>the</strong> <strong>Future</strong> <strong>of</strong> <strong>the</strong> <strong>Energy</strong> <strong>Matrix</strong>With respect to ethanol, 60% <strong>of</strong> distilleries produced less than 100 million liters <strong>of</strong> ethanol each and toge<strong>the</strong>raccounted for 31% <strong>of</strong> total production, while just 8% <strong>of</strong> mills produced 25% <strong>of</strong> all <strong>the</strong> ethanol <strong>in</strong> <strong>the</strong> Center-South region.Accord<strong>in</strong>g to <strong>the</strong> Syndicate <strong>of</strong> <strong>the</strong> Ethanol Production Industry <strong>in</strong> <strong>the</strong> State <strong>of</strong> M<strong>in</strong>as Gerais (Siamig) vi , 13 <strong>of</strong> <strong>the</strong>15 largest production plants <strong>in</strong> <strong>the</strong> country are <strong>in</strong> São Paulo, with <strong>the</strong> o<strong>the</strong>r two located one <strong>in</strong> Mato Grossoand one <strong>in</strong> M<strong>in</strong>as Gerais. The difference between <strong>the</strong> first and <strong>the</strong> last <strong>in</strong> this rank<strong>in</strong>g was approximately threemillion tonnes <strong>in</strong> <strong>the</strong> 2007/2008 harvest, reveal<strong>in</strong>g <strong>the</strong> difference <strong>in</strong> scale <strong>of</strong> <strong>the</strong> lead<strong>in</strong>g companies. Of <strong>the</strong>se15 companies, two exceed six million tonnes.Also accord<strong>in</strong>g to <strong>the</strong> Siamig report, concentration is a recent phenomenon <strong>in</strong> <strong>the</strong> Brazilian sugar and ethanolsector. There have been more than 60 mergers and acquisitions s<strong>in</strong>ce 2004, produc<strong>in</strong>g <strong>the</strong> large groups <strong>in</strong> <strong>the</strong>sector. However, concentration is still low. No producer accounts for more than 10% <strong>of</strong> domestic production<strong>in</strong> terms <strong>of</strong> crushed sugarcane.<strong>Sugarcane</strong> process<strong>in</strong>g <strong>in</strong>volves mov<strong>in</strong>g large volumes <strong>of</strong> low-value cargo. For this reason, mills and distilleriesare located close to sugarcane plantations and freight usually <strong>in</strong>volves road tra<strong>in</strong>s <strong>of</strong> special sugar-cane trailers,known <strong>in</strong> Brazil as “trem<strong>in</strong>hões” (Xavier, 2008).In <strong>the</strong> ethanol-production segment, “distribution” <strong>in</strong>cludes responsibility for <strong>the</strong> acquisition, storage, transport,market<strong>in</strong>g and quality control <strong>of</strong> <strong>the</strong> fuel (Xavier, 2008). Accord<strong>in</strong>g to <strong>the</strong> ANP, Brazil has 508 fueldistribution depots, 36,730 fill<strong>in</strong>g stations and 459 companies authorized to transport and effect retail sale<strong>of</strong> fuel (such companies are known <strong>in</strong> Brazil as Carrier Dealer Retailers (TRR <strong>in</strong> <strong>the</strong> Portuguese acronym) vii . Theflowchart <strong>in</strong> Figure 3 summarizes <strong>the</strong> fuel distribution cha<strong>in</strong>.Graph 4Growth <strong>of</strong> Brazilian ethanol production In billions <strong>of</strong> litres viii2015105090/91 92/93 94/95 96/97 98/99 00/01 02/03 04/05 06/07 08/09Anhydrous ethanolHydrous ethanolSource: UNICA, ANP. Prepared by <strong>the</strong> authors.
Ethanol Market and Competition239Fuel distribution depots are ma<strong>in</strong>ly located <strong>in</strong> regions close to ports and consumer markets. Products aretransferred and stored <strong>in</strong> distribution depots, where tanker trucks fill up and <strong>the</strong> products are shipped to <strong>the</strong>f<strong>in</strong>al clients <strong>of</strong> <strong>the</strong> company – fill<strong>in</strong>g stations, large consumers and wholesalers (Rodrigues and Saliby, 1998).Deregulation <strong>of</strong> <strong>the</strong> sector favored <strong>the</strong> entry <strong>in</strong>to <strong>the</strong> market <strong>of</strong> new distributors and encouraged <strong>the</strong> use<strong>of</strong> logistics as a competitive differential <strong>in</strong> <strong>the</strong> Brazilian fuels market (Maligo, 2005). Distributors, whoemerged on <strong>the</strong> scene after deregulation, became known <strong>in</strong> <strong>the</strong> sector as “newcomers” (emergentes <strong>in</strong>Portuguese). As discussed below, <strong>the</strong> newcomers are located pr<strong>in</strong>cipally <strong>in</strong> São Paulo, accord<strong>in</strong>g to <strong>the</strong> ANP,and have become very important <strong>in</strong> <strong>the</strong> distribution <strong>of</strong> hydrous ethanol.Of <strong>the</strong> 36,730 fill<strong>in</strong>g stations exist<strong>in</strong>g <strong>in</strong> <strong>the</strong> country, 43% are <strong>in</strong>dependent, not tied to a specific brand – seeGraph 5. These <strong>in</strong>dependent stations can be supplied by any distributor, while tied fill<strong>in</strong>g stations can besupplied only by a distributor <strong>of</strong> <strong>the</strong>ir own brand.Currently, <strong>the</strong> pump price for hydrous ethanol can be divided <strong>in</strong>to four components. First is <strong>the</strong> cost <strong>of</strong> produc<strong>in</strong>ghydrous ethanol, which represents <strong>the</strong> price at which it is sold by producers to fuel distributors, net<strong>of</strong> taxes and shipp<strong>in</strong>g. The second refers to taxes. There are two taxes on ethanol: ICMS, a state tax; andPIS/C<strong>of</strong><strong>in</strong>s, a federal tax. Both are paid by producers and distributors. In <strong>the</strong> state <strong>of</strong> São Paulo, ICMS was25% on top <strong>of</strong> <strong>the</strong> sale price for producers and distributors <strong>in</strong> 2003, <strong>the</strong>n s<strong>in</strong>ce January 2004 it has been12%. PIS/C<strong>of</strong><strong>in</strong>s on hydrous ethanol was 3.65% for producers and 8.2% for distributors between January2003 and September 2008, <strong>the</strong>n s<strong>in</strong>ce October 2008 mills have paid R$48 per thousand liters, while distributorspay R$78 ix . The third component <strong>of</strong> <strong>the</strong> hydrous ethanol pump price is logistics, compris<strong>in</strong>g freightfrom <strong>the</strong> distillery to <strong>the</strong> distribution depot, and subsequent delivery to <strong>the</strong> fill<strong>in</strong>g station. The fourth andlast item relates to <strong>the</strong> marg<strong>in</strong>s <strong>of</strong> distributors and fill<strong>in</strong>g stations x .Fuel distribution cha<strong>in</strong>, 2009Figure 3Distribution depots(508)Retailers(36,730)Retail dealer/carriers(459)Large consumersTruckersSmall bus<strong>in</strong>ess consumers,Rural producersSource: ANP. Prepared by <strong>the</strong> authors.
24 0 Ethanol and Bioelectricity <strong>Sugarcane</strong> <strong>in</strong> <strong>the</strong> <strong>Future</strong> <strong>of</strong> <strong>the</strong> <strong>Energy</strong> <strong>Matrix</strong>Graph 6 illustrates <strong>the</strong> change <strong>in</strong> <strong>the</strong> composition <strong>of</strong> hydrous ethanol pump prices <strong>in</strong> <strong>the</strong> state <strong>of</strong> São Paulo,show<strong>in</strong>g <strong>the</strong> compression <strong>of</strong> producers’ marg<strong>in</strong>s – a situation that has worsened s<strong>in</strong>ce 2007. However, datafor 2009 <strong>in</strong>cludes just <strong>the</strong> period from January to September, when production is greater and prices are lower.It is <strong>the</strong>refore possible that <strong>the</strong> price paid to <strong>the</strong> producer is underestimated.While all values have been normalized so that <strong>the</strong> pump price is equal to one, <strong>in</strong> some years <strong>the</strong> column <strong>in</strong><strong>the</strong> graph exceeds one. In 2003 and 2004 this was due to a negative marg<strong>in</strong> for distributors, and <strong>in</strong> 2008and 2009 to a negative marg<strong>in</strong> for producers. Thus, if we add toge<strong>the</strong>r all <strong>the</strong> values that make up <strong>the</strong> price,<strong>in</strong>clud<strong>in</strong>g <strong>the</strong> negative marg<strong>in</strong>s, <strong>the</strong> price at <strong>the</strong> pump will be equal to one xi .3.2 Concentration <strong>in</strong> <strong>the</strong> supply cha<strong>in</strong>The behavior <strong>of</strong> ethanol supply is also <strong>in</strong>fluenced by <strong>the</strong> structure <strong>of</strong> <strong>the</strong> market, to <strong>the</strong> extent that this reflects<strong>the</strong> relative price barga<strong>in</strong><strong>in</strong>g conditions between ethanol producers and purchasers (distributors).Concentration is a basic characteristic <strong>of</strong> market structure and can be measured by tools such as <strong>the</strong>Herf<strong>in</strong>dahl-Hirschman Index (HHI) and <strong>the</strong> Concentration Ratio (CR K). The studies that most contributedto this topic were Rocha et al (2007), Mori and Moraes (2007) and Mattoso (2008). This literature permits<strong>the</strong> conclusion that <strong>the</strong> ethanol production sector was, until recently, characterized by low concentration,but <strong>in</strong> recent years <strong>the</strong>re has been a strong trend towards mergers and acquisitions.Graph 5Distribution depots <strong>in</strong> Brazil, by brand xii In percentage, situation at 31/12/2008Independent43.3%BR17.1%Ipiranga16.2%Shell5.5%Esso4.0%Alesat3.8%O<strong>the</strong>rs10.1%0% 10% 20% 30%40% 50%Source: ANP.
Ethanol Market and Competition241Table 3 shows <strong>the</strong> results <strong>of</strong> three concentration <strong>in</strong>dexes – HHI xiii , Equivalent Number and CR5 – for fueldistributors <strong>in</strong> Brazil for 2008, tak<strong>in</strong>g Brazil as <strong>the</strong> reference market.Despite <strong>the</strong> substantial participation <strong>in</strong> <strong>the</strong> market <strong>of</strong> <strong>the</strong> five largest, <strong>the</strong> HHI is below 1,800 for distribution<strong>of</strong> hydrous ethanol and Type C gasol<strong>in</strong>e, <strong>in</strong>dicat<strong>in</strong>g low concentration. The markets for fuel oil, aviationgasol<strong>in</strong>e and aviation kerosene are extremely concentrated.Graph 6Breakdown <strong>of</strong> <strong>the</strong> hydrous ethanol pump price, <strong>in</strong> São Paulo1.210.80.60.40.20-0.22003 2004 2005 2006 2007 2008 2009*Fill<strong>in</strong>g station marg<strong>in</strong>Tax substitutionTax on <strong>the</strong> distributor Tax on <strong>the</strong> distillerEstimated producer marg<strong>in</strong>Estimated production cost Freight costs + distributor marg<strong>in</strong>* The data for 2009 refers to <strong>the</strong> period January-September. While <strong>the</strong> values were normalized to make <strong>the</strong> pump price one, <strong>in</strong> some cases <strong>the</strong>value on <strong>the</strong> graph exceeds one due to <strong>the</strong> negative marg<strong>in</strong> received by <strong>the</strong> distributors or <strong>the</strong> producers, so “compensat<strong>in</strong>g” for <strong>the</strong> value aboveone at <strong>the</strong> pump. Source: Agroconsult, Cepea/UNICA, ANP. Prepared by <strong>the</strong> authors.
242 Ethanol and Bioelectricity <strong>Sugarcane</strong> <strong>in</strong> <strong>the</strong> <strong>Future</strong> <strong>of</strong> <strong>the</strong> <strong>Energy</strong> <strong>Matrix</strong>As we know, HHI varies with <strong>the</strong> participation <strong>of</strong> each company <strong>in</strong> <strong>the</strong> market and also with <strong>the</strong> disparitybetween <strong>the</strong>m. The Equivalent Number corresponds to <strong>the</strong> number <strong>of</strong> companies <strong>of</strong> equal size that wouldgenerate <strong>the</strong> same HHI. This number is relatively high for both ethanol and Type C gasol<strong>in</strong>e. A dozen companies<strong>of</strong> equal size compet<strong>in</strong>g <strong>in</strong> <strong>the</strong> market could generate strong competition via <strong>the</strong> purchase <strong>of</strong> rawmaterials or sales to fill<strong>in</strong>g stations.It is worth not<strong>in</strong>g that <strong>the</strong>se <strong>in</strong>dexes can be skewed by excessive aggregation <strong>of</strong> data. Given that this datais not available disaggregated; we opted to calculate <strong>the</strong> HHI by state, us<strong>in</strong>g data from S<strong>in</strong>dicom and <strong>the</strong>ANP for hydrous ethanol and Type C gasol<strong>in</strong>e.When calculated by state, HHI cont<strong>in</strong>ued to show a low degree <strong>of</strong> concentration <strong>in</strong> 2008 <strong>in</strong> <strong>the</strong> states <strong>of</strong>São Paulo, M<strong>in</strong>as Gerais, Rio de Janeiro, Santa Catar<strong>in</strong>a, Paraná and Mato Grosso (HHI
Ethanol market and competition243The former got <strong>the</strong> fill<strong>in</strong>g stations and fuel and lubricant distribution <strong>in</strong> <strong>the</strong> South and Sou<strong>the</strong>ast regions xv ,while <strong>the</strong> latter got <strong>the</strong> same operations <strong>in</strong> <strong>the</strong> North, Nor<strong>the</strong>ast and Midwest regions xvi . Ultrapar (Ipiranga)subsequently bought Texaco’s fuel distribution operations xvii .The HHI for Type C gasol<strong>in</strong>e is slightly higher than that for ethanol. Once aga<strong>in</strong>, <strong>the</strong> <strong>in</strong>dex is below 1,800 <strong>in</strong><strong>the</strong> state <strong>of</strong> São Paulo, as it is <strong>in</strong> Mato Grosso, M<strong>in</strong>as Gerais and Bahia. Consider<strong>in</strong>g only S<strong>in</strong>dicom distributors,<strong>the</strong> <strong>in</strong>dex is higher and above 1,800 <strong>in</strong> every state.In <strong>the</strong> distilleries sector, we calculated <strong>the</strong> HHI, equivalent number and CR5 for <strong>the</strong> production <strong>of</strong> distilleries<strong>in</strong> <strong>the</strong> state <strong>of</strong> São Paulo <strong>in</strong> <strong>the</strong> 2008/2009 harvest, exam<strong>in</strong><strong>in</strong>g not <strong>in</strong>dividual plants but <strong>the</strong> economicgroups to which <strong>the</strong>y belong (economic concentration). The calculation is restricted to <strong>the</strong> state <strong>of</strong> SãoPaulo because <strong>of</strong> <strong>the</strong> availability <strong>of</strong> <strong>in</strong>formation. However, given <strong>the</strong> major share <strong>of</strong> this state with<strong>in</strong> <strong>the</strong>national ethanol market, <strong>the</strong> <strong>in</strong>dex is relevant for this analysis. Of <strong>the</strong> 317 distilleries located <strong>in</strong> <strong>the</strong> Center-South region, 182 are <strong>in</strong> <strong>the</strong> state <strong>of</strong> São Paulo. Ethanol production <strong>in</strong> São Paulo state and <strong>the</strong> Center-Southregion represent respectively 60.8% and 91.3% <strong>of</strong> <strong>the</strong> national total xviii .The results shown <strong>in</strong> Table 4 <strong>in</strong>dicate a fragmented sector, with 108 economic groups controll<strong>in</strong>g 182distilleries. Despite approximately 60 mergers and acquisitions s<strong>in</strong>ce 2004 xix , <strong>the</strong> sector still cannot be describedas concentrated. The equivalent number <strong>of</strong> companies shows that this same HHI value correspondsto a market with low concentration, with a relatively high number <strong>of</strong> companies. Moreover, <strong>the</strong> comb<strong>in</strong>edmarket share <strong>of</strong> <strong>the</strong> five largest distill<strong>in</strong>g groups also po<strong>in</strong>ts to low concentration.Tabela 5 shows HHI, equivalent number and CR5 data for distilleries by unit <strong>of</strong> production (technical concentration),<strong>in</strong> <strong>the</strong> period between <strong>the</strong> 2004/2005 and 2008/2009 harvest. Calculations were based on <strong>the</strong>production rank<strong>in</strong>g <strong>of</strong> mills <strong>in</strong> <strong>the</strong> state <strong>of</strong> São Paulo, as provided by UNICA.Table 4Pulverized sectorHHI, equivalent number and CR5 for distillery production <strong>in</strong> São Paulo by economic groups, 2008/2009 harvestProduct HHI Equivalent number CR5 (%)<strong>Sugarcane</strong> 311 32 27Sugar 428 23 32Anhydrous ethanol 429 23 36Hydrous ethanol 246 41 24Total ethanol 270 37 25Source: UNICA. Prepared by <strong>the</strong> authors.
24 4 Ethanol and Bioelectricity <strong>Sugarcane</strong> <strong>in</strong> <strong>the</strong> <strong>Future</strong> <strong>of</strong> <strong>the</strong> <strong>Energy</strong> <strong>Matrix</strong>Tabela 5 reveals a sector with very low concentration, as <strong>in</strong>dicated by <strong>the</strong> low values for HHI and CR5, and<strong>the</strong> high equivalent number. There is also a slight trend to dispersal, if we consider total ethanol production,reflect<strong>in</strong>g <strong>the</strong> growth <strong>of</strong> <strong>the</strong> relative volume <strong>of</strong> hydrous ethanol and <strong>the</strong> entry <strong>of</strong> new mills.HHI, <strong>the</strong> equivalent number and CR5 were also calculated by <strong>in</strong>dividual distillery for <strong>the</strong> 2008/2009 harvest<strong>in</strong> <strong>the</strong> Center-South region. Results are <strong>in</strong> Table 6. As can be seen, <strong>the</strong> HHI results were approximately 40%lower than those found <strong>in</strong> <strong>the</strong> state <strong>of</strong> São Paulo dur<strong>in</strong>g <strong>the</strong> same period, po<strong>in</strong>t<strong>in</strong>g to even greater dispersal<strong>of</strong> <strong>the</strong> sector when look<strong>in</strong>g at <strong>the</strong> Center-South region. The <strong>in</strong>crease <strong>in</strong> <strong>the</strong> equivalent number <strong>of</strong> companiesand reduction <strong>of</strong> CR5 also confirm <strong>the</strong> lower concentration <strong>of</strong> <strong>the</strong> Center-South region when compared to <strong>the</strong>state <strong>of</strong> São Paulo.We <strong>the</strong>refore have an upstream segment with low economic concentration, where HHI is below 430 whenlook<strong>in</strong>g at economic groups and below 116 when consider<strong>in</strong>g <strong>in</strong>dividual mills. The upstream segment islegally required to sell its production via distributors, a segment where concentration is higher, but never<strong>the</strong>lessbelow levels considered worrisome <strong>in</strong> <strong>the</strong> ma<strong>in</strong> consumer states.As is well known, concentration by itself does not determ<strong>in</strong>e <strong>the</strong> level <strong>of</strong> competition and market power,although it is an important element. O<strong>the</strong>r factors such as rivalry, market entry and countervail<strong>in</strong>g powermust be taken <strong>in</strong>to account. Fur<strong>the</strong>rmore, low concentration hampers but does not elim<strong>in</strong>ate <strong>the</strong> possibleformation <strong>of</strong> cartels, while <strong>in</strong> <strong>the</strong> fuel retail segment <strong>the</strong> Brazilian Competition Policy System (BCPS)has identified and condemned several groups <strong>of</strong> fill<strong>in</strong>g station for price-fix<strong>in</strong>g. Condemnations have beenachieved <strong>in</strong> <strong>the</strong> cities <strong>of</strong> Florianópolis (SC), Goiânia (GO), Lages (SC), Belo Horizonte (MG) and Recife (PE).Allegations <strong>of</strong> fill<strong>in</strong>g station cartels are so frequent that <strong>the</strong> Secretariat <strong>of</strong> Economic Law <strong>of</strong> <strong>the</strong> M<strong>in</strong>istry<strong>of</strong> Justice (SDE) has, as part <strong>of</strong> its functions with respect to competition law, published a booklet deal<strong>in</strong>gexclusively with gasol<strong>in</strong>e retail<strong>in</strong>g. Of <strong>the</strong> 298 cartel <strong>in</strong>vestigations under way at <strong>the</strong> SDE, 152 are relatedto fuel retail<strong>in</strong>g.Table 5Sector with low concentrationTrend <strong>of</strong> HHI, equivalent number (n) and CR5 (%) <strong>of</strong> distilleries <strong>in</strong> São Paulo, from 2004/2005 to 2008/2009 harvest years2004/2005 2005/2006 2006/2007 2007/2008 2008/2009Product HHI n CR5 HHI n CR5 HHI n CR5 HHI n CR5 HHI n CR5<strong>Sugarcane</strong> 112 89 12,1 109 92 12,0 104 96 11,3 94 106 10,1 87 115 9,8Sugar 126 79 13,0 124 81 12,4 113 88 11,5 112 89 11,2 109 92 11,3Anhydrousethanol145 69 14.8 149 67 15,1 153 65 14,8 169 59 17,5 159 63 16,5Hydrous ethanol 147 68 13,0 140 71 14,5 119 84 12,6 97 103 10,2 94 106 9,9Total ethanol 118 85 12,7 114 88 12,1 108 93 11,8 93 108 10,1 87 115 9,6Source: UNICA. Prepared by <strong>the</strong> authors.
Ethanol Market and Competition245Market power is limited by <strong>the</strong> behavior <strong>of</strong> demand. The more sensitive demand is to price variations, lesswill be <strong>the</strong> ability <strong>of</strong> a company to <strong>in</strong>crease prices to boost pr<strong>of</strong>it. The follow<strong>in</strong>g item is dedicated to <strong>the</strong>study <strong>of</strong> ethanol demand.4 Analysis <strong>of</strong> domestic demand for hydrous ethanol and Type C gasol<strong>in</strong>eThe ma<strong>in</strong> characteristic <strong>of</strong> <strong>the</strong> Brazilian consumer market for fuel is <strong>the</strong> competition at <strong>the</strong> pump between hydrousethanol and Type C gasol<strong>in</strong>e for flex-fuel vehicles. Competition between <strong>the</strong> two fuels is related to <strong>the</strong>irsensitivity <strong>of</strong> demand given variations <strong>in</strong> <strong>the</strong> relative price.The fact that ethanol has <strong>in</strong>creased its participation and importance <strong>in</strong> <strong>the</strong> Brazilian energy matrix has promptedseveral studies focus<strong>in</strong>g on <strong>the</strong> sector xx . Examples <strong>in</strong>clude: Bentzen (1994), Eltony and Al-Mutairi (1995), DeNegri (1998), Alves and Bueno (2003), Roppa (2005) and Nappo (2007).The literature suggests that gasol<strong>in</strong>e demand is not sensitive to variations <strong>in</strong> <strong>in</strong>come or fuel price (Marjotta-Maistro, 2002; Iootty and Roppa, 2006; Nappo, 2007). For ethanol, <strong>the</strong> price elasticity is positive for supply,while <strong>the</strong> price elasticity for demand shows divergent results <strong>in</strong> <strong>the</strong> studies <strong>of</strong> Oliveira et al (2008) and Silvério(2007). Moreover, both studies <strong>in</strong>dicate that <strong>the</strong> demand for Type C gasol<strong>in</strong>e became more elastic beg<strong>in</strong>n<strong>in</strong>g <strong>in</strong>2003, when flex-fuel vehicles were <strong>in</strong>troduced <strong>in</strong>to <strong>the</strong> Brazilian market. This shows that hydrous ethanol hasbecome a less-imperfect substitute for Type C gasol<strong>in</strong>e. The evidence also shows that <strong>the</strong> price <strong>of</strong> gasol<strong>in</strong>e isnot <strong>in</strong>fluenced by <strong>the</strong> price <strong>of</strong> ethanol, while <strong>the</strong> <strong>in</strong>verse is true.Pursu<strong>in</strong>g ano<strong>the</strong>r l<strong>in</strong>e <strong>of</strong> <strong>in</strong>vestigation, Lucilio (202) looked at price transmission between <strong>the</strong> ma<strong>in</strong> products <strong>in</strong><strong>the</strong> sugar and ethanol sector between 1998 and 2002. The results show that <strong>the</strong> price <strong>of</strong> anhydrous ethanoldoes not expla<strong>in</strong> <strong>the</strong> price <strong>of</strong> <strong>in</strong>dustrial and exported crystal sugar. The article by Lamounier et al (2006) studies<strong>the</strong> trade-<strong>of</strong>f between sugar and ethanol production <strong>in</strong> <strong>the</strong> mills, <strong>in</strong>dicat<strong>in</strong>g that sugar and ethanol pricesaffected <strong>the</strong> production ratio only <strong>in</strong> some states and certa<strong>in</strong> harvests. In addition, Alves and Bacchi (2004)estimate <strong>the</strong> export supply <strong>of</strong> Brazilian sugar. The authors’ results <strong>in</strong>dicate that <strong>in</strong>creases <strong>in</strong> export prices andexchange rate depreciation significantly <strong>in</strong>crease Brazilian exports.Table 6Lower concentration <strong>in</strong> <strong>the</strong> Center-South regionHHI, equivalent number and CR5 for <strong>in</strong>dividual distilleries <strong>the</strong> Center-South, 2008/2009 harvestProduct HHI n CR5 (%)<strong>Sugarcane</strong> 53 187 6,7Sugar 75 133 7,1Anhydrous ethanol 105 95 8,9Hydrous ethanol 54 185 5,5Total ethanol 52 192 6,7Source: UNICA. Prepared by <strong>the</strong> authors.
246 Ethanol and Bioelectricity <strong>Sugarcane</strong> <strong>in</strong> <strong>the</strong> <strong>Future</strong> <strong>of</strong> <strong>the</strong> <strong>Energy</strong> <strong>Matrix</strong>In summary, <strong>the</strong>se studies do not provide evidence <strong>of</strong> demand sensitivity for gasol<strong>in</strong>e faced with changes <strong>in</strong> <strong>the</strong>ethanol price; nei<strong>the</strong>r do more complete analyses <strong>of</strong> <strong>the</strong> relationship between ethanol demand and fuel prices. Itmust be noted that <strong>the</strong>se studies do not <strong>in</strong>clude recent periods when hydrous ethanol has been ga<strong>in</strong><strong>in</strong>g strengthas a direct competitor for gasol<strong>in</strong>e. One <strong>of</strong> <strong>the</strong> ma<strong>in</strong> questions debated <strong>in</strong> <strong>the</strong> above-mentioned studies is <strong>the</strong><strong>in</strong>clusion <strong>of</strong> <strong>in</strong>formation about sugar and petroleum markets and o<strong>the</strong>r macroeconomic <strong>in</strong>formation <strong>in</strong> <strong>the</strong> supplymodel for ethanol. Accord<strong>in</strong>g to <strong>the</strong> literature, <strong>the</strong>se variables are relevant <strong>in</strong> <strong>the</strong> decisions taken by mills.The follow<strong>in</strong>g items analyze <strong>the</strong> demand for hydrous ethanol and Type C gasol<strong>in</strong>e. They take as a start<strong>in</strong>gpo<strong>in</strong>t <strong>the</strong> hypo<strong>the</strong>sis that hydrous ethanol can be characterized as a normal good: one with negativeprice elasticity (demand sensibility to prices) and that responds significantly to variations <strong>in</strong> Type C gasol<strong>in</strong>eprices, given that this is its ma<strong>in</strong> competitor.4.1 Domestic demand <strong>of</strong> hydrous ethanolThe analysis <strong>of</strong> <strong>the</strong> relations <strong>of</strong> demand for hydrous ethanol makes possible <strong>the</strong> calculation <strong>of</strong> <strong>the</strong> priceelasticity <strong>of</strong> demand and <strong>the</strong> identification <strong>of</strong> <strong>the</strong> effects <strong>of</strong> <strong>the</strong> pr<strong>in</strong>cipal factors that <strong>in</strong>fluenced domesticdemand, such as: <strong>the</strong> prices <strong>of</strong> substitutes, <strong>in</strong>come, length <strong>of</strong> loans for f<strong>in</strong>anc<strong>in</strong>g vehicles, and real <strong>in</strong>terestrates, among o<strong>the</strong>rs. The database that was used for this analysis is <strong>in</strong> <strong>the</strong> form <strong>of</strong> a time series, from July2001 to August 2009. The data was organized based on <strong>in</strong>formation from ANP, UNICA, IBGE, BCB andBloomberg as described <strong>in</strong> Annex 1.The method used for <strong>the</strong> estimates <strong>of</strong> demand equations is based on co<strong>in</strong>tegration analysis. The aim <strong>of</strong> thismodel<strong>in</strong>g is to verify <strong>the</strong> existence <strong>of</strong> short-term and long-term relationships between liquid fuel prices <strong>in</strong>Brazil and sales <strong>of</strong> <strong>the</strong> product.The demand equation for ethanol to be tested for <strong>the</strong> data for Brazil and São Paulo can be written as follows:where:is <strong>the</strong> volume <strong>of</strong> hydrous ethanol demanded per vehicle (total fleet) <strong>in</strong> period t,Brazil and <strong>the</strong> state <strong>of</strong> São Paulo;is <strong>the</strong> price <strong>of</strong> hydrous ethanol dur<strong>in</strong>g period t;is <strong>the</strong> price <strong>of</strong> Type C gasol<strong>in</strong>e dur<strong>in</strong>g period t;is a vector <strong>of</strong> variables that <strong>in</strong>fluence <strong>the</strong> demand for hydrous ethanol dur<strong>in</strong>g <strong>the</strong> period t(average real <strong>in</strong>come <strong>of</strong> workers and unemployment rate, among o<strong>the</strong>rs) and temporaldummy variables (annual and monthly);is <strong>the</strong> erro term <strong>of</strong> <strong>the</strong> equation;
Ethanol market and competition247is <strong>the</strong> short term adjustment coefficient;are <strong>the</strong> parameters <strong>of</strong> <strong>the</strong> co<strong>in</strong>tegration vector, which <strong>in</strong>dicate <strong>the</strong> long-term relationshipbetween variables;are parameter vectors to be estimated.Accord<strong>in</strong>g to Enders (1985), <strong>the</strong> def<strong>in</strong>ition <strong>of</strong> co<strong>in</strong>tegration is related to three important po<strong>in</strong>ts: <strong>the</strong> same order<strong>of</strong> <strong>in</strong>tegration <strong>of</strong> all co<strong>in</strong>tegrated variables; stationary l<strong>in</strong>ear comb<strong>in</strong>ation <strong>of</strong> non-stationary variables; and <strong>the</strong>number <strong>of</strong> exist<strong>in</strong>g co<strong>in</strong>tegration vectors is equal to <strong>the</strong> quantity <strong>of</strong> variables <strong>of</strong> <strong>the</strong> model m<strong>in</strong>us one.The results <strong>of</strong> <strong>the</strong> unit root tests for <strong>the</strong> relevant variables <strong>of</strong> <strong>the</strong> model <strong>in</strong>dicate that <strong>the</strong> variables <strong>of</strong> <strong>in</strong>terestare non-stationary <strong>in</strong> <strong>the</strong> first order xxi . The next stage consisted <strong>of</strong> co<strong>in</strong>tegration test<strong>in</strong>g among variables,us<strong>in</strong>g <strong>the</strong> Johansen Procedure (1988), with <strong>the</strong> f<strong>in</strong>al results for <strong>the</strong> estimated coefficients by <strong>the</strong> VEC summarizedbelow xxii :Results for <strong>the</strong> whole sample (Brazil):Results for <strong>the</strong> state <strong>of</strong> São Paulo:The results obta<strong>in</strong>ed demonstrate <strong>the</strong> high relative sensitivity <strong>of</strong> ethanol demand to <strong>the</strong> prices <strong>of</strong> ethanoland gasol<strong>in</strong>e. In o<strong>the</strong>r words, <strong>the</strong> long-term elasticities found by <strong>the</strong> co<strong>in</strong>tegration method are superior, <strong>in</strong>module, to <strong>the</strong> unit, and have <strong>the</strong> correct signs (negative for ethanol and positive for gasol<strong>in</strong>e) xxiii . Note thatelasticities for São Paulo were significantly higher than those for Brazil, which <strong>in</strong>dicates that consumers <strong>in</strong>São Paulo are more sensitive to price than <strong>the</strong> average Brazilian consumers <strong>of</strong> fuel. This sensitivity reflects<strong>the</strong> composition <strong>of</strong> <strong>the</strong> fleet, which conta<strong>in</strong>s an <strong>in</strong>creas<strong>in</strong>g percentage <strong>of</strong> flex-fuel vehicles.Adjustment coefficients are expected to exhibit signs opposite to <strong>the</strong> signs <strong>of</strong> <strong>the</strong> components <strong>of</strong> <strong>the</strong>co<strong>in</strong>tegration vector to conclude that an adjustment to equilibrium happens <strong>in</strong> <strong>the</strong> short term. The adjustmentcoefficient was significant and negative for both equations. Tak<strong>in</strong>g as an example <strong>the</strong> model for Brazil,and start<strong>in</strong>g from a po<strong>in</strong>t where <strong>the</strong> variables are <strong>in</strong> a long-term relation, <strong>the</strong>n an <strong>in</strong>crease <strong>in</strong> gasol<strong>in</strong>eprice turns <strong>the</strong> error term negative. Given <strong>the</strong> negative adjustment coefficient, <strong>the</strong> change <strong>of</strong> this variableis positive, so that <strong>the</strong>re is an <strong>in</strong>crease <strong>in</strong> <strong>the</strong> demand for ethanol <strong>in</strong> <strong>the</strong> follow<strong>in</strong>g month, t, towards <strong>the</strong>restoration <strong>of</strong> <strong>the</strong> long-term relation. The speed with which this adjustment occurs is -0.78 <strong>in</strong> <strong>the</strong> modelfor Brazil and -0.75 for São Paulo. Therefore, if <strong>the</strong>re is an unexpected <strong>in</strong>crease (positive shock) <strong>of</strong> 1% <strong>in</strong><strong>the</strong> demand for ethanol <strong>in</strong> t-1, <strong>the</strong>n <strong>the</strong>re will be a reduction <strong>in</strong> demand <strong>of</strong> 0.75% (0.78%). In o<strong>the</strong>r words,approximately 75% (78%) <strong>of</strong> <strong>the</strong> shock is transmitted to <strong>the</strong> follow<strong>in</strong>g period xxiv .
24 8 Ethanol and Bioelectricity <strong>Sugarcane</strong> <strong>in</strong> <strong>the</strong> <strong>Future</strong> <strong>of</strong> <strong>the</strong> <strong>Energy</strong> <strong>Matrix</strong>In summary, it is believed that <strong>the</strong> results obta<strong>in</strong>ed <strong>in</strong> this study appear to be more price-sensitive, whencompared to <strong>the</strong> reviewed literature, due to period <strong>of</strong> analysis, which <strong>in</strong>cludes <strong>the</strong> years where ethanolga<strong>in</strong>ed importance by virtue <strong>of</strong> <strong>the</strong> success <strong>of</strong> flex-fuel vehicles <strong>in</strong> <strong>the</strong> market.4.2 Domestic demand for Type C gasol<strong>in</strong>eThe analysis <strong>of</strong> <strong>the</strong> relations <strong>of</strong> gasol<strong>in</strong>e demand makes it possible to calculate <strong>the</strong> price elasticity <strong>of</strong> demand.The estimates <strong>of</strong> <strong>the</strong>se measurements <strong>of</strong> consumer sensitivity to acquire gasol<strong>in</strong>e are important to compare with<strong>the</strong> measurements found for hydrous ethanol. The assumption to be verified <strong>in</strong> this empirical analysis is that“<strong>the</strong> demand for ethanol is more sensitive to gasol<strong>in</strong>e prices than <strong>the</strong> demand for gasol<strong>in</strong>e is sensitive to ethanolprices.” The database used for this analysis is also <strong>in</strong> a time series format, from July 2001 to August 2009, with<strong>the</strong> sources <strong>of</strong> data <strong>the</strong> same as those used <strong>in</strong> <strong>the</strong> previous subsection.The method used to estimate <strong>the</strong> equations for gasol<strong>in</strong>e demand was also based on co<strong>in</strong>tegration analysis. Thegasol<strong>in</strong>e demand equation to be tested for Brazil data can be written as follows:where:is <strong>the</strong> volume <strong>of</strong> Type C gasol<strong>in</strong>e demanded per vehicle (total fleet) <strong>in</strong> period t, <strong>in</strong> Brazil;is <strong>the</strong> price <strong>of</strong> hydrous ethanol dur<strong>in</strong>g period t;is <strong>the</strong> price <strong>of</strong> Type C gasol<strong>in</strong>e dur<strong>in</strong>g period t;is a vector <strong>of</strong> variables that <strong>in</strong>fluence <strong>the</strong> demand for hydrous ethanol <strong>in</strong> <strong>the</strong> period t(average real <strong>in</strong>come <strong>of</strong> workers and unemployment rate, among o<strong>the</strong>rs) and temporaldummy variables (annual and monthly);is <strong>the</strong> error term <strong>of</strong> <strong>the</strong> equation;is <strong>the</strong> short-term coefficient adjustment;are <strong>the</strong> parameters <strong>of</strong> <strong>the</strong> co<strong>in</strong>tegration vector, which <strong>in</strong>dicate a long-term relationbetween <strong>the</strong> variables;are parameter vectors to be estimated.The results for <strong>the</strong> coefficients estimated by VEC are summarized below, with <strong>the</strong> t statistics reported <strong>in</strong>brackets:* Significant/Not reported.
Ethanol Market and Competition249The results <strong>in</strong>dicate that <strong>the</strong> relative demand for Type C gasol<strong>in</strong>e exhibits sensitivity to ethanol prices and to<strong>the</strong> price <strong>of</strong> gasol<strong>in</strong>e itself. However, unlike <strong>the</strong> f<strong>in</strong>d<strong>in</strong>gs for ethanol demand, <strong>the</strong> price <strong>of</strong> ethanol has only asmall <strong>in</strong>fluence <strong>in</strong> <strong>the</strong> long-term demand for Type C gasol<strong>in</strong>e. Note that <strong>the</strong> signs found were <strong>in</strong> accordancewith <strong>the</strong> <strong>the</strong>ory (positive for ethanol and negative for gasol<strong>in</strong>e) xxv .The estimated adjustment coefficient exhibits <strong>the</strong> opposite sign to that <strong>of</strong> <strong>the</strong> ma<strong>in</strong> component <strong>of</strong> <strong>the</strong> co<strong>in</strong>tegrationvector. It can <strong>the</strong>refore be concluded that <strong>the</strong>re is a short-term adjustment to reach equilibrium. Theadjustment coefficient was significant, negative and greater than one <strong>in</strong> module, <strong>in</strong>dicat<strong>in</strong>g rapid adjustmentto long-term equilibrium. Therefore, for an <strong>in</strong>crease <strong>in</strong> <strong>the</strong> price <strong>of</strong> Type C gasol<strong>in</strong>e, which would make <strong>the</strong>error term positive, <strong>the</strong> change <strong>of</strong> this variable will be negative (given <strong>the</strong> negative adjustment coefficient), sothat <strong>the</strong>re is a strong reduction <strong>in</strong> <strong>the</strong> demand for Type C gasol<strong>in</strong>e <strong>in</strong> <strong>the</strong> follow<strong>in</strong>g month, t, towards restoration<strong>of</strong> equilibrium.4.3 Considerations on <strong>the</strong> market reactions for ethanol and Type C gasol<strong>in</strong>eEstimates suggest that consumers are sensitive to price, both <strong>in</strong> Brazil as a whole and <strong>in</strong> São Paulo, and thatethanol demand responds more to price variation than does <strong>the</strong> demand for Type C gasol<strong>in</strong>e.This analysis for hydrous ethanol and Type C gasol<strong>in</strong>e is complemented below with considerations on anhydrousethanol.5 Considerations on anhydrous ethanolThe focus <strong>of</strong> this section is <strong>the</strong> role <strong>of</strong> anhydrous ethanol <strong>in</strong> determ<strong>in</strong><strong>in</strong>g <strong>the</strong> price <strong>of</strong> Type C gasol<strong>in</strong>e.Moreover, <strong>in</strong> order to improve <strong>the</strong> effectiveness <strong>of</strong> public policies <strong>in</strong> <strong>the</strong> sector – <strong>in</strong> particular <strong>the</strong> change <strong>in</strong><strong>the</strong> mandatory blend <strong>of</strong> anhydrous ethanol <strong>in</strong> Type A gasol<strong>in</strong>e – item 5.2 exam<strong>in</strong>es by how much ethanolproduction would need to fall to endanger <strong>the</strong> supply <strong>of</strong> anhydrous ethanol.Consumer sensitivity to price variationsPrice-elasticity <strong>of</strong> ethanolPrice-elasticity <strong>of</strong> Type C gasol<strong>in</strong>ePrice-elasticity <strong>of</strong> ethanolPrice-elasticity <strong>of</strong> Type C gasol<strong>in</strong>e-1.23 (BR)-1/33 (SP)-1.45 (BR)-1.54 (SP)Ethanol MarketType C gasol<strong>in</strong>e market0.28 (BR)-0.63 (BR)An <strong>in</strong>crease <strong>of</strong> 1% <strong>in</strong> <strong>the</strong> price <strong>of</strong> ethanol negatively affectsBrazilian demand for ethanol by 1.23%An <strong>in</strong>crease <strong>of</strong> 1% <strong>in</strong> <strong>the</strong> price <strong>of</strong> gasol<strong>in</strong>e positively affectsBrazilian demand for ethanol by 1.45%An <strong>in</strong>crease <strong>of</strong> 1% <strong>in</strong> <strong>the</strong> price <strong>of</strong> ethanol positively affects<strong>the</strong> demand for gasol<strong>in</strong>e by 0.28%An <strong>in</strong>crease <strong>of</strong> 1% <strong>in</strong> <strong>the</strong> price <strong>of</strong> gasol<strong>in</strong>e negatively affects<strong>the</strong> demand for gasol<strong>in</strong>e by 0.63%
250 Ethanol and Bioelectricity <strong>Sugarcane</strong> <strong>in</strong> <strong>the</strong> <strong>Future</strong> <strong>of</strong> <strong>the</strong> <strong>Energy</strong> <strong>Matrix</strong>5.1 The role <strong>of</strong> anhydrous ethanol <strong>in</strong> establish<strong>in</strong>g <strong>the</strong> gasol<strong>in</strong>e priceIn <strong>the</strong> fuels sector, 2002 marked <strong>the</strong> beg<strong>in</strong>n<strong>in</strong>g <strong>of</strong> freely established prices for consumers (Marjotta-Maistro,2002). Given <strong>the</strong> structure <strong>of</strong> fuel price formation, <strong>the</strong> aim <strong>of</strong> this section is to analyze how <strong>the</strong> <strong>in</strong>stitutional environmentand <strong>the</strong> changes <strong>in</strong> <strong>the</strong> price <strong>of</strong> one fuel can affect <strong>the</strong> price <strong>of</strong> o<strong>the</strong>rs. In particular, <strong>the</strong> model seeksto assess <strong>the</strong> impact on Type C gasol<strong>in</strong>e price variation <strong>of</strong> <strong>the</strong> anhydrous ethanol price and ord<strong>in</strong>ances <strong>of</strong> <strong>the</strong>M<strong>in</strong>istry <strong>of</strong> Agriculture relat<strong>in</strong>g to fuel blend. The model thus consists <strong>of</strong> estimat<strong>in</strong>g <strong>the</strong> “consumer price <strong>of</strong> TypeC gasol<strong>in</strong>e” variable <strong>in</strong> <strong>the</strong> first difference. To expla<strong>in</strong> price variations, <strong>the</strong> control variables are ma<strong>in</strong>ly those thatshift <strong>the</strong> supply and demand curves <strong>of</strong> <strong>the</strong> product as well as o<strong>the</strong>r variables exogenous to prices that do nothave a direct impact on supply and demand. Technically, <strong>the</strong> use <strong>of</strong> variables <strong>in</strong> first difference allows for correction<strong>of</strong> <strong>the</strong> problem <strong>of</strong> non-stationarity <strong>of</strong> <strong>the</strong>se variables, which could lead <strong>the</strong> model to spurious correlations.The estimated equation can be described as follows:for t=1,...,Tα 0Parameter that measures model <strong>in</strong>tercept;X Matriz <strong>of</strong> k control variables (T x k);β Vector <strong>of</strong> parameters (k x 1) to be estimated;π Parameter that measures <strong>the</strong> effect <strong>of</strong> <strong>the</strong> anhydrous ethanol price on <strong>the</strong> variation <strong>in</strong> gasol<strong>in</strong>e price;θ Vector <strong>of</strong> parameters (p x 1) to be estimated, on <strong>the</strong> p ord<strong>in</strong>ances relat<strong>in</strong>g to fuel blend dur<strong>in</strong>gperiod t.Data covers <strong>the</strong> period from January 2003 to July 2009, and <strong>the</strong> model was estimated us<strong>in</strong>g Least Ord<strong>in</strong>arySquares with correction <strong>of</strong> <strong>the</strong> variance-covariance matrix us<strong>in</strong>g White’s method (White, 1980) xxvi . Stationaritytests <strong>of</strong> <strong>the</strong> variables used <strong>in</strong> <strong>the</strong> model do not <strong>in</strong>dicate a non-stationary standard xxvii . The results <strong>of</strong><strong>the</strong> estimates can be seen <strong>in</strong> Annex 2 xxviii .The results <strong>of</strong> <strong>the</strong> model <strong>in</strong>dicate that <strong>the</strong> fuel blend <strong>of</strong> anhydrous ethanol <strong>in</strong> gasol<strong>in</strong>e reduced, on average,<strong>the</strong> volatility <strong>of</strong> Type C gasol<strong>in</strong>e consumer prices (estimated coefficient for <strong>the</strong> dummies) <strong>in</strong> 2% to 3%,which is a statistically significant impact xxix .The <strong>in</strong>fluence <strong>of</strong> <strong>the</strong> anhydrous ethanol price on <strong>the</strong> volatility <strong>of</strong> Type C gasol<strong>in</strong>e price was captured by <strong>the</strong>variable <strong>of</strong> <strong>the</strong> logarithm <strong>of</strong> <strong>the</strong>se prices for producers, with <strong>the</strong> dummies that measure <strong>the</strong> determ<strong>in</strong>ation <strong>of</strong>each blend percentage dur<strong>in</strong>g <strong>the</strong> period <strong>in</strong> question. The estimated coefficients were statistically significantonly for <strong>the</strong> duration <strong>of</strong> M<strong>in</strong>istry <strong>of</strong> Agriculture decrees numbers 17, 51 and 278. Dur<strong>in</strong>g <strong>the</strong> period <strong>in</strong> which<strong>the</strong> blends determ<strong>in</strong>ed by those decrees were <strong>in</strong> force, <strong>in</strong>creases <strong>in</strong> anhydrous ethanol prices for producers hada positive average effect on <strong>the</strong> variation <strong>of</strong> Type C gasol<strong>in</strong>e prices for consumers. This relationship reflects <strong>the</strong>countercyclical behavior <strong>of</strong> <strong>the</strong> blend policies, which act <strong>in</strong> an environment <strong>of</strong> ris<strong>in</strong>g anhydrous ethanol prices.The periods follow<strong>in</strong>g <strong>the</strong> blend reductions are also periods when <strong>the</strong> price <strong>of</strong> ethanol is more volatile.
Ethanol Market and Competition2515.2 Risk simulation for anhydrous ethanol supplyThis section develops simulations for <strong>the</strong> risk <strong>of</strong> harvest failure threaten<strong>in</strong>g <strong>the</strong> supply <strong>of</strong> anhydrous andhydrous ethanol <strong>in</strong> <strong>the</strong> Brazilian market. In o<strong>the</strong>r words, by how much would <strong>the</strong> harvest need to fall tocreate a credible risk <strong>of</strong> shortage <strong>of</strong> anhydrous ethanol <strong>in</strong> <strong>the</strong> market? This analysis is relevant to <strong>in</strong>form <strong>the</strong>discussion about supply risks <strong>in</strong> relation to policies for <strong>the</strong> blend <strong>of</strong> anhydrous ethanol with Type A gasol<strong>in</strong>e.Fuel blend policy should be used as an <strong>in</strong>strument to regulate quantity ra<strong>the</strong>r than price, so giv<strong>in</strong>g <strong>the</strong>market greater predictability for consumer supply and for fuel producers to take decisions.The follow<strong>in</strong>g steps illustrate <strong>the</strong> stages <strong>in</strong>volved <strong>in</strong> perform<strong>in</strong>g a simulation <strong>of</strong> supply risk.I Calculation <strong>of</strong> current domestic production <strong>of</strong> anhydrous and hydrous ethanol, net <strong>of</strong> exports;II Calculation <strong>of</strong> current domestic consumption <strong>of</strong> hydrous ethanol and Type C gasol<strong>in</strong>e, with consumption<strong>of</strong> anhydrous ethanol assumed to be 25% <strong>of</strong> Type C gasol<strong>in</strong>e consumption;III Estimate <strong>of</strong> <strong>the</strong> Brazilian vehicle fleet by type <strong>of</strong> fuel;IV Construction <strong>of</strong> fuel-use scenarios that could lead to an ethanol shortage <strong>in</strong> <strong>the</strong> market;V Estimate <strong>of</strong> harvest decrease for each scenario based on <strong>in</strong>formation from items I, II and III.Data is for <strong>the</strong> period 2004 – 2008 xxx .Four scenarios xxxi were evaluated, namely:Base-<strong>in</strong>formation referr<strong>in</strong>g to 2004 – 2008:Scenario 1: 100% use <strong>of</strong> Type C gasol<strong>in</strong>e by light flex-fuel vehicles;Scenario 2: 50% use <strong>of</strong> hydrous ethanol by light flex-fuel vehicles;Scenario 3: 70% use <strong>of</strong> hydrous ethanol by light flex-fuel vehicles;Scenario 4: 90% use <strong>of</strong> hydrous ethanol by light flex-fuel vehicles.Scenario 1: Assum<strong>in</strong>g <strong>the</strong> use <strong>of</strong> Type C gasol<strong>in</strong>e by all gasol<strong>in</strong>e and flex-fuel vehicles <strong>in</strong> <strong>the</strong> fleet, andlook<strong>in</strong>g at ethanol production net <strong>of</strong> exports, we can say that <strong>the</strong> percentage production reduction requiredto create a shortage <strong>of</strong> ethanol <strong>in</strong> <strong>the</strong> market would be xxxii :2004 2005 2006 2007 20084.5% 18.49% 21.82% 36.39% 42.13%
252 Ethanol and Bioelectricity <strong>Sugarcane</strong> <strong>in</strong> <strong>the</strong> <strong>Future</strong> <strong>of</strong> <strong>the</strong> <strong>Energy</strong> <strong>Matrix</strong>These results <strong>in</strong>dicate that <strong>in</strong> 2008, with everyth<strong>in</strong>g else rema<strong>in</strong><strong>in</strong>g constant <strong>in</strong> <strong>the</strong> market, <strong>the</strong>re wouldhave had to be a 42.13% harvest failure to create a crisis <strong>in</strong> ethanol supply.Scenarios 2 to 4: These scenarios assume that hydrous ethanol is consumed by, respectively, 50%, 70%and 90% <strong>of</strong> all <strong>the</strong> flex-fuel vehicle fleet, with Type C gasol<strong>in</strong>e consumption restricted to 50%, 30% and10% <strong>of</strong> gasol<strong>in</strong>e-powered vehicles.In this context, consider<strong>in</strong>g ethanol production net <strong>of</strong> exports <strong>in</strong> each <strong>of</strong> <strong>the</strong>se years, <strong>the</strong> percentage harvestfailures required to create a shortage <strong>of</strong> ethanol <strong>in</strong> <strong>the</strong> market are shown <strong>in</strong> Table 7.The risk <strong>of</strong> ethanol shortage <strong>in</strong>creases significantly <strong>in</strong> 2008 as <strong>in</strong>dividuals with flex-fuel vehicles switch <strong>in</strong> mass toconsum<strong>in</strong>g ethanol. The worry<strong>in</strong>g level <strong>of</strong> harvest failure is reduced from 24% to 9.4% as consumption growsfrom 50% to 90% <strong>of</strong> vehicles <strong>in</strong> 2008, with all else rema<strong>in</strong><strong>in</strong>g constant <strong>in</strong> <strong>the</strong> market.We should stress that changes to <strong>the</strong> blend are justified only by harvest failures large enough to put at risk <strong>the</strong>supply <strong>of</strong> anhydrous ethanol to make Type C gasol<strong>in</strong>e. This policy should not be used to address seasonal variations,because unjustified changes <strong>in</strong>crease risk to <strong>the</strong> bus<strong>in</strong>ess and to <strong>the</strong> susta<strong>in</strong>ability <strong>of</strong> ethanol production.To better identify critical moments for shortage <strong>of</strong> anhydrous fuel ethanol it would, for example, to possible toencourage <strong>the</strong> federal government’s <strong>Energy</strong> Research Company (EPE) to construct models for <strong>the</strong> ethanol sectorto identify <strong>the</strong> relationship between supply and demand for <strong>the</strong> fuel, similar to what is done for <strong>the</strong> electricitymarket. In that way, decisions about changes to <strong>the</strong> mandatory blend tend to become less politicized, moretechnical and more transparent.Us<strong>in</strong>g <strong>in</strong>formation about production and consumption for 2004 – 2008, we simulated ranges for <strong>the</strong> size <strong>of</strong>production decrease <strong>in</strong> <strong>the</strong> period that would justify chang<strong>in</strong>g <strong>the</strong> mandatory blend, <strong>in</strong>dicat<strong>in</strong>g that <strong>the</strong> risk <strong>of</strong>ethanol shortage <strong>in</strong>creases as <strong>the</strong> percentage <strong>of</strong> flex-fuel vehicles consum<strong>in</strong>g hydrous ethanol <strong>in</strong>creases. In <strong>the</strong>most extreme scenario for 2008, <strong>in</strong> which 90% <strong>of</strong> all flex-fuel vehicles <strong>in</strong> Brazil are fueled with hydrous ethanol,<strong>the</strong>re would be an ethanol shortage if ethanol production <strong>in</strong> this year were 10% lower than was effectively observed(or 4.9% greater than ethanol production <strong>in</strong> <strong>the</strong> previous year).Table 7Harvest failure for risk <strong>of</strong> ethanol shortageScenario 2 (50% ethanol) Scenario 3 (70% ethanol) Scenario 4 (90% ethanol)2004 10.0% 9.3% 8.7%2005 14.3% 12.1% 10.0%2006 11.4% 7.3% 3.1%2007 22.3% 16.6% 11.0%2008 24.0% 16.7% 9.4%
Ethanol Market and Competition2536 F<strong>in</strong>al considerations: outl<strong>in</strong>es for public policyThe <strong>in</strong>stitutional environment comprises a group <strong>of</strong> formal and <strong>in</strong>formal rules. It shapes bus<strong>in</strong>ess conductand is largely responsible for performance <strong>of</strong> <strong>the</strong> markets. The <strong>in</strong>stitutional environment provides a set <strong>of</strong><strong>in</strong>centives and controls that <strong>in</strong> one way or ano<strong>the</strong>r guide <strong>the</strong> expectations <strong>of</strong> <strong>the</strong> various actors directly<strong>in</strong>volved, <strong>in</strong>clud<strong>in</strong>g sugarcane, sugar and ethanol producers, automakers and consumers, <strong>in</strong>fluenc<strong>in</strong>g <strong>the</strong>operational strategy <strong>of</strong> each <strong>of</strong> <strong>the</strong>se players.The orientation and shape <strong>of</strong> public policies are, <strong>the</strong>refore, essential tools for direct<strong>in</strong>g production. In <strong>the</strong>case <strong>of</strong> ethanol, this becomes even more relevant given <strong>the</strong> strategic importance <strong>of</strong> <strong>the</strong> fuel’s availability toensure <strong>the</strong> supply <strong>of</strong> <strong>the</strong> domestic market. This can be clearly illustrated by <strong>the</strong> crisis that European countrieswent through recently when Russia cut gas supplies, or by <strong>the</strong> breach <strong>of</strong> <strong>in</strong>ternational agreements, or<strong>the</strong> renegotiation <strong>of</strong> prices, as occurred <strong>in</strong> Lat<strong>in</strong> America with <strong>the</strong> political changes <strong>in</strong> Bolívia and Venezuela.No less important have been <strong>the</strong> effects <strong>of</strong> oil price volatility on modern economies.The results <strong>of</strong> this study allow us to identify which problems <strong>in</strong> <strong>the</strong> ethanol supply cha<strong>in</strong> should be a targetfor public policy, given <strong>the</strong> goal <strong>of</strong> <strong>in</strong>creas<strong>in</strong>g ethanol participation <strong>in</strong> <strong>the</strong> Brazilian energy matrix. Based on<strong>the</strong> ma<strong>in</strong> results <strong>of</strong> <strong>the</strong>se tests and empirical evidence, <strong>the</strong>ir relationships and implications, we can highlightpriority actions to improve <strong>the</strong> function<strong>in</strong>g <strong>of</strong> <strong>the</strong> market, so benefit<strong>in</strong>g both producers and consumers.These priority actions are: (a) establish<strong>in</strong>g technical criteria to monitor <strong>the</strong> market <strong>in</strong> order to identify harvestfailures that would prompt changes <strong>in</strong> <strong>the</strong> mandatory blend <strong>of</strong> anhydrous ethanol <strong>in</strong> Type A gasol<strong>in</strong>e,based on technical and transparent criteria; (b) <strong>the</strong> participation <strong>of</strong> a greater number <strong>of</strong> players, so <strong>in</strong>creas<strong>in</strong>gmarket liquidity; and (c) <strong>the</strong> greater use <strong>of</strong> warrantage contracts (<strong>in</strong>ventory credit system).These specific actions do not necessarily depend on legal changes. We have focused on creat<strong>in</strong>g conditionsfor ethanol production to expand via market mechanisms, which are capable <strong>of</strong> provid<strong>in</strong>g adequateremuneration for growth <strong>of</strong> bus<strong>in</strong>esses while encourag<strong>in</strong>g efficiency ga<strong>in</strong>s that, <strong>in</strong> a competitive environment,are shared with consumers through lower prices. In <strong>the</strong> absence <strong>of</strong> market failures, as identified <strong>in</strong>this study, improv<strong>in</strong>g market function<strong>in</strong>g with <strong>the</strong> m<strong>in</strong>imum <strong>of</strong> <strong>in</strong>tervention is <strong>the</strong> most efficient way to giveproper <strong>in</strong>centives for <strong>the</strong> susta<strong>in</strong>able expansion <strong>of</strong> production.
254 Ethanol and Bioelectricity <strong>Sugarcane</strong> <strong>in</strong> <strong>the</strong> <strong>Future</strong> <strong>of</strong> <strong>the</strong> <strong>Energy</strong> <strong>Matrix</strong>Anexo 1Names <strong>of</strong> variables <strong>in</strong> <strong>the</strong> model, with description and sourceVariable Description Sourcelnveh Logarithm <strong>of</strong> hydrous ethanol sales by distributors, <strong>in</strong> liters ANPlnpeh Logarithm <strong>of</strong> <strong>the</strong> average consumer price <strong>of</strong> hydrous ethanol, reais per liter ANPlnpdi Logarithm <strong>of</strong> <strong>the</strong> average consumer price <strong>of</strong> diesel, reais per liter ANPlnpgc Logarithm <strong>of</strong> <strong>the</strong> average consumer price <strong>of</strong> Type C gasol<strong>in</strong>e, reais per liter ANPlnpgnvLogarithm <strong>of</strong> <strong>the</strong> average consumer price <strong>of</strong> vehicular natural gas, reais perliterANPptax Exchange rate at <strong>the</strong> end <strong>of</strong> <strong>the</strong> period, reais/dollar Sisbacen PTAX8lnp_acucarBRL Logarithm <strong>of</strong> <strong>the</strong> <strong>in</strong>ternational price <strong>of</strong> sugar (future contract NYBOT) <strong>in</strong> reais Broadcastlnpib Logarithm <strong>of</strong> state GDP IBGEprazo_medio_veiculosAverage f<strong>in</strong>anc<strong>in</strong>g period for vehicle acquisitions by <strong>in</strong>dividuals withpre-fixed <strong>in</strong>terest rate, <strong>in</strong> daysSisbacen PESP3ln_vflex Registration <strong>of</strong> flex-fuel cars, per state FENABRAVEln_vgasol<strong>in</strong>a Registration <strong>of</strong> gasol<strong>in</strong>e cars, per state FENABRAVEjuros_real Real <strong>in</strong>terest rate – Selic rate, deflated by <strong>the</strong> IPCA <strong>in</strong>flation <strong>in</strong>dex BCB e IBGE<strong>in</strong>adimplencia_pf Percentage default rate, <strong>in</strong>dividuals BCB<strong>in</strong>adimplencia_total Complete default, <strong>in</strong> percentage BCBUfsAnosDummies for states (and <strong>the</strong> federal district)Dummies for years
Ethanol Market and Competition255Annex 2Results <strong>of</strong> <strong>the</strong> estimates: price model for Type C gasol<strong>in</strong>eLeast Ord<strong>in</strong>ary Squares with robust matrix for varianceModel InformationObservations: 77 R2 = 0,770F(26,50) = 28,23 R2 Ajust = 0,651P–value F: 0.00Dependent variable: dif_ln_pgas_cControlsCoefficientlnpreco_alcool_hidr –0.03331dif_<strong>in</strong>_pdiesel 0.43095 **dif_<strong>in</strong>_ppetroleo –0.01120ln_prod_veic_flex_alcool 0.01346 **taxa_desemprego_30d 0.00496 *lei 554_25p –0.02745 **lei 51_20p –0.03135 **lei 278_23p –0.02939 **lei 43_25p –0.02977 **lnpanidro_lei 17_20p 0.15632 **lnpanidro_lei 554_25p 0.02342lnpanidro_lei 51_20p 0.12576 **lnpanidro_lei 278_23p 0.03721 *lnpanidro_lei 43_25p 0.02279ln_cambio 0.03036 **m1 –0.00420m2 –0.00806m3 –0.01208 *m4 –0.01487 **m5 –0.01612 **m6 –0.01111 *m7 –0.01395 **m8 –0.00836m9 –0.00139m10 –0.00427m11 –0.01097 **Constant –0.28408 *** Indicates statistical significance at 10% ** Indicates statistical significance at 15%
256 Ethanol and Bioelectricity <strong>Sugarcane</strong> <strong>in</strong> <strong>the</strong> <strong>Future</strong> <strong>of</strong> <strong>the</strong> <strong>Energy</strong> <strong>Matrix</strong>Bibliography. Alves, D.C.O.; Bueno, R.D.L.S. Short-run, long-run and cross elasticities <strong>of</strong> gasol<strong>in</strong>e demand <strong>in</strong> Brazil. <strong>Energy</strong>.Economics 25 (2), 2003.• Alves, L. R. A. Transmissão de preços entre produtos do setor sucroalcooleiro do Estado de São Paulo. 2002. 107p.Masters <strong>the</strong>sis – Escola Superior de Agricultura “Luiz de Queiroz”, Universidade de São Paulo, Piracicaba, 2002.• Alves, L. R. A.; Bacchi, M. R. P. Oferta de Exportação de Açúcar do Brasil. RER, Rio de Janeiro, vol. 42, no. 1, 2004.• Bentzen, J. An empirical analysis <strong>of</strong> gasol<strong>in</strong>e demand <strong>in</strong> Denmark us<strong>in</strong>g co<strong>in</strong>tegration techniques. <strong>Energy</strong> Economics .16 (2): 139-143, 1994.• Besanko, D. A Economia da Estratégia. Bookman, 2006.• De Negri, J. A. Elasticidade-renda e Elasticidade-preço da demanda de automóveis no Brasil, Rio de Janeiro: IPEA,Discussion Text number 558, 1998.• Eltony, M.N.; Al-Mutairi, N.H. Demand for gasol<strong>in</strong>e <strong>in</strong> Kuwait: an empirical analysis us<strong>in</strong>g co-<strong>in</strong>tegration techniques.<strong>Energy</strong> Economics 17 (3): 249-253, 1995.• EPE (Empresa de Pesquisa Energética). Cadernos de Energia EPE: Perspectiva para o etanol no Brasil. EPE-DPG-RE-016, 2008.• Farrel, M. J. The measurement <strong>of</strong> productive efficiency. Journal <strong>of</strong> <strong>the</strong> Royal Statistical Society (1957).• GREENE, W. H. Econometric Analysis. Prentice Hall, 5th ed. New Jersey, 2003.• Horizontal Merger Guidel<strong>in</strong>es, U.S. Department <strong>of</strong> Justice & Federal Trade Commission, 1992, p. 4.• Iootty, M.; Roppa, B. Mudanças Tecnológicas e Matriz de Combustíveis Veiculares: Exercícios Empíricos sobreElasticidade da Demanda no Brasil. In Matriz Brasileira de Combustíveis, GEE/IE/UFRJ, Project for <strong>the</strong> Nucleus <strong>of</strong>Strategic Affairs <strong>of</strong> <strong>the</strong> Presidency, 2006.• Jolly, L. <strong>Future</strong> Trends <strong>in</strong> World Food Security, WSRO Annual Meet<strong>in</strong>g, 2008.• Lamounier, W. M.; Campos Filho, M. F.; Bressan, A. A. Análise do Trade-<strong>of</strong>f na Produção de Açúcar e Álcool nasUs<strong>in</strong>as da Região Centro-sul do Brasil. XLIV Congresso da Sober, Fortaleza, 2006.• Maligo, C. Modelo para simulação de operação de carregamento de cam<strong>in</strong>hões-tanque em uma base de distribuiçãode combustíveis automotivos. Masters <strong>the</strong>sis, PUC-RJ, Rio de Janeiro, 2005.• Marjotta-Maistro, M. C. Ajustes nos mercados de álcool e gasol<strong>in</strong>a no processo de desregulamentação. 2002. 197p.PhD <strong>the</strong>sis. Escola Superior de Agricultura “Luiz de Queiroz”, Universidade de São Paulo, Piracicaba, 2002.• Mas-Collel, A.; Wh<strong>in</strong>ston, M.; Green, J. Microeconomic <strong>the</strong>ory. Oxford: Oxford UniversityPress, 1995.• Mattoso, E. S. Estratégias de atuação das empresas de etanol no Brasil. 2008. 70 p. Masters <strong>the</strong>sis. Fundação GetúlioVargas, Rio de Janeiro, 2008.• Mori, J. S.; Moraes, M. A. F. D. Características do mercado do álcool anidro e hidratado e suas implicações para omercado de combustíveis. XLV Congresso da Sober, Londr<strong>in</strong>a, 2007.• Neves, M. F.; Tromb<strong>in</strong>, V. G.; Consoli, M. A. Mapeamento e Quantificação do Setor Sucroenergético em 2008. Centrode Pesquisa e Projetos de Market<strong>in</strong>g e Estratégia/USP, 2009.• Oliveira, M. P.; Alencar, J. R.; Souza, G. S. Energia Renovável: uma análise sobre <strong>of</strong>erta e demanda de etanol no Brasil.XLVI Congresso da Sober, Rio Branco, 2008.• Oiye, J. I. Influência do mercado externo de combustíveis fósseis no potencial de desenvolvimento da sucroquímica noBrasil. JPNOR. In: Simpósio Internacional e Mostra de Tecnologia da Agro<strong>in</strong>dústria Sucroalcooleira, Piracicaba, 2008.
Ethanol Market and Competition257• Possas, M. L. Os Conceitos de Mercado Relevante e de Poder de Mercado no Âmbito da Defesa da Concorrência. In:Mario Luiz Possas. (Org.). Ensaios sobre Economia e Direito da Concorrência. 1a ed. São Paulo, SP: Editora S<strong>in</strong>gular,2002, v. 1, p. 75-95.• Relatório Econômico, S<strong>in</strong>dicato da Indústria da Fabricação do Álcool no Estado de M<strong>in</strong>as Gerais, Belo Horizonte, v.6, Jan 2009.• Relatório Econômico, S<strong>in</strong>dicato da Indústria da Fabricação do Álcool no Estado de M<strong>in</strong>as Gerais, Belo Horizonte, v.11, Mar 2009.• Rocha, C. F. L.; Bueno, S. S.; Pires, L. N. D<strong>in</strong>âmica da Concentração de Mercado na Indústria Brasileira, 1996-2003.In: XXXV Encontro Nacional de Economia, 2007, Recife. Anais do XXXV Encontro Nacional de Economia. BeloHorizonte: ANPEC, 2007. v. 1. p. 1-16.• Rodrigues, A. M. e Saliby, E. Aplicação da simulação no dimensionamento de bases de distribuição de combustíveis.Centro de Estudos em Logística do Coppead/UFRJ, 1998.• Roppa, B. F. Evolução do consumo de gasol<strong>in</strong>a no Brasil e suas elasticidades: 1973-2003. Undergraduate <strong>the</strong>sis, UFRJ,2005.• Santos, M. A. S.; Santana, A. C. Concentração e poder de mercado das empresas de artefatos de madeira do Estadodo Pará. XXIII Encontro Nacional de Engenharia de Produção, M<strong>in</strong>as Gerais, 2003.• Shirota, R. Efficiency <strong>in</strong> f<strong>in</strong>ancial <strong>in</strong>termediation: a study <strong>of</strong> <strong>the</strong> Chilean bank<strong>in</strong>g <strong>in</strong>dustry. Ohio University (1995).• Suzigan, W. Aglomerações Industriais: Avaliação e Sugestões de Políticas. In: M<strong>in</strong>istério do Desenvolvimento,Indústria e Comércio Exterior; Instituto Evaldo Lodi. (Org.). Futuro de Indústria: Oportunidades e Desafios - aReflexão da Universidade. Brasília: M<strong>in</strong>istério de Desenvolvimento, Indústria e Comércio Exterior, 2001, p. 49-67.• Triches, D.; Silva, S. S. Análise do desempenho das exportações brasileiras de açúcar e as restrições da União Européiaa partir de 1995. Ipes – Discussion texts no. 31, 2009.• Waack, R. S.; Neves, M. F. Competitividade do Sistema Agro<strong>in</strong>dustrial da Cana-de-Açúcar. In: Decio Zylbersztajn;Elizabeth Maria Mercier Querido Fat<strong>in</strong>a. (Org.). Competitividade do Agribus<strong>in</strong>ess Brasileiro. São Paulo: Ipea/Pensa, .1998, v. 5.• White, H. A Heteroskedasticity-Consistent Covariance <strong>Matrix</strong> Estimator and a DirectTest for Heteroskedasticity.Econometric, 1980, vol. 48, issue 4, pages 817-38.• Wooldridge, J. Econometric Analysis <strong>of</strong> Cross Section and Panel Data. Cambridge, MA: MIT Press, 2002.• Xavier, C. E. O. Localização de tanques de armazenagem de álcool combustível no Brasil: aplicação de um modelomatemático de otimização. Page 175 2008. PhD <strong>the</strong>sis. Escola Superior de Agricultura “Luiz de Queiroz”,Universidade de São Paulo, Piracicaba. 2008.• Zanão, A. G. Caracterização da <strong>in</strong>fra-estrutura de armazenagem de álcool no Brasil e análise da sua concentração naregião Centro-Sul. 2009. Page 72 Masters <strong>the</strong>sis. Escola Superior de Agricultura “Luiz de Queiroz”, Universidade deSão Paulo, Piracicaba. 2009.
258 Ethanol and Bioelectricity <strong>Sugarcane</strong> <strong>in</strong> <strong>the</strong> <strong>Future</strong> <strong>of</strong> <strong>the</strong> <strong>Energy</strong> <strong>Matrix</strong>Explanatory NotesiA tonne equivalent <strong>of</strong> petroleum (TPE) is a unit <strong>of</strong> energy def<strong>in</strong>ed as <strong>the</strong> heat released by combustion <strong>of</strong> one tonne <strong>of</strong> crude oil.iiFigures provided by Anfavea (National Association <strong>of</strong> Automobile Manufacturers).iiiFor <strong>the</strong> production <strong>of</strong> anhydrous ethanol it is necessary to use cyclohexane as a dehydrat<strong>in</strong>g agent. Site: http://www.etanol.ufscar.br/palestras-do-dia-02-de-setembro/o-processo-produtivo-do-etanol. Accessed <strong>in</strong> August 2009.ivAvailable at: http://www.agricultura.gov.br/pls/portal/docs/PAGE/MAPA/SERVICOS/USINAS_DESTILARIAS/USINAS_CADASTRADAS/UPS_04-08-2009_0_1.PDF. Accessed on 06/08/2009.vAnhydrous ethanol was first added to gasol<strong>in</strong>e <strong>in</strong> Brazil <strong>in</strong> <strong>the</strong> 1930s. The restriction on <strong>the</strong> period <strong>of</strong> <strong>the</strong> graph is due to <strong>the</strong> lack <strong>of</strong> a longerprice series. It is important to note that <strong>the</strong> first change <strong>in</strong> <strong>the</strong> blend <strong>of</strong> anhydrous ethanol with gasol<strong>in</strong>e shown <strong>in</strong> <strong>the</strong> chart corresponds to<strong>the</strong> M<strong>in</strong>istry <strong>of</strong> Agriculture decree No. 17 which set <strong>the</strong> percentage at 20%, follow<strong>in</strong>g a period <strong>in</strong> which <strong>the</strong> percentage was 25%, accord<strong>in</strong>g toM<strong>in</strong>istry <strong>of</strong> Agriculture decree No. 266, 21/06/2002.viEconomic Report, Union <strong>of</strong> <strong>the</strong> Ethanol Production Industry <strong>of</strong> M<strong>in</strong>as Gerais, Belo Horizonte, v. 6, 2009.viiDirect sales to rural consumers, small bus<strong>in</strong>ess consumers, motorists and truckers.viiiData for <strong>the</strong> 08/09 harvest were not f<strong>in</strong>alized <strong>in</strong> <strong>the</strong> North-East when we obta<strong>in</strong>ed <strong>the</strong> <strong>in</strong>formation, and refer to <strong>the</strong> position <strong>of</strong> production16 May 2009.ixThese rates refer to <strong>the</strong> period for which we had access to data, from January 2003 to August 2009.xEconomic Report, Union <strong>of</strong> <strong>the</strong> Ethanol Production Industry <strong>of</strong> M<strong>in</strong>as Gerais, Belo Horizonte, v. 11, March 2009.xiOne possible explanation for <strong>the</strong> presence <strong>of</strong> negative marg<strong>in</strong>s is <strong>the</strong> fact that <strong>the</strong> <strong>in</strong>dustry suffers significant tax evasion, which squeezes <strong>the</strong>marg<strong>in</strong>s <strong>of</strong> law-abid<strong>in</strong>g agents.xiiThe category “O<strong>the</strong>r” <strong>in</strong>cludes 106 brands.xiiiHHI = Σ si 2 , which itself is <strong>the</strong> participation <strong>of</strong> firm i <strong>in</strong> <strong>the</strong> relevant market. The <strong>in</strong>dex ranges between 0 and 10,000. The CRK = Σ s 5/S, wheres 5is <strong>the</strong> production <strong>of</strong> <strong>the</strong> five largest and S <strong>the</strong> production value <strong>of</strong> any relevant market. The equivalent number N = 1/HHI.xivAviation gasol<strong>in</strong>e for piston eng<strong>in</strong>es; aviation kerosene for turbo-jets.xvConcentration Act No. 08012.002816/2007-25.xviConcentration Act No. 08012.002820/2007-93.xviiThe purchase <strong>of</strong> Texaco’s fuel distribution operations by Ipiranga was submitted to CADE under AC No. 08012.009025/2008-15, and at <strong>the</strong>time <strong>of</strong> writ<strong>in</strong>g was <strong>in</strong> <strong>the</strong> phase <strong>of</strong> <strong>in</strong>struction.xviii2008/2009 harvest, UNICA.xixKPMG, <strong>in</strong>: Economic Report, Union <strong>of</strong> <strong>the</strong> Ethanol Production Industry <strong>in</strong> M<strong>in</strong>as Gerais, Belo Horizonte, v. 11, March 2009.xxMany <strong>of</strong> <strong>the</strong> scholarly articles <strong>of</strong> demand and supply estimation make use <strong>of</strong> co<strong>in</strong>tegration methods to estimate <strong>the</strong> price and <strong>in</strong>comeelasticities <strong>of</strong> supply and demand, given <strong>the</strong> non-stationary characteristics <strong>of</strong> <strong>the</strong> time series used for <strong>the</strong> estimates.xxiWe used <strong>the</strong> follow<strong>in</strong>g unit root tests: Augmented Dickey-Fuller (ADF), Phillips-Perron (PP) and Kwiatkoviski, Phillips, Schmidt and SAIWA(KPSS). All <strong>the</strong>se tests assume <strong>the</strong> hypo<strong>the</strong>sis <strong>of</strong> a unit root at <strong>the</strong> expense <strong>of</strong> stationarity <strong>of</strong> <strong>the</strong> series, tak<strong>in</strong>g <strong>in</strong>to account <strong>the</strong> presence <strong>of</strong>determ<strong>in</strong>istic terms <strong>in</strong> <strong>the</strong> model specification.xxiiThe t-statistics are reported <strong>in</strong> brackets.xxiiiTo obta<strong>in</strong> <strong>the</strong> equation for <strong>the</strong> long-term relationship between ethanol demand and prices, simply equate <strong>the</strong> equation <strong>in</strong> brackets to zero,<strong>the</strong>reby generat<strong>in</strong>g elasticities <strong>in</strong> <strong>the</strong> correct direction for both products. Example:xxivThe analysis <strong>of</strong> <strong>the</strong> waste, mak<strong>in</strong>g sure that <strong>the</strong>y have approximately normal distribution, is made by conduct<strong>in</strong>g <strong>the</strong> Jarque-Bera test, whosenull hypo<strong>the</strong>sis is tested on <strong>the</strong> normal distribution (symmetry close to zero and kurtosis close to three). The test <strong>in</strong>dicates non-rejection at 5%<strong>of</strong> <strong>the</strong> normality <strong>of</strong> residuals <strong>of</strong> <strong>the</strong> equations.xxvTo obta<strong>in</strong> <strong>the</strong> equation for long-term relationship between ethanol demand and prices, simply match <strong>the</strong> equation <strong>in</strong> brackets to zero,<strong>the</strong>reby generat<strong>in</strong>g elasticities <strong>in</strong> <strong>the</strong> correct direction for both products. Example:xxviWhite (1980).xxviiAugmented Dickey-Fuller (ADF) test and Phillips-Perron (PP) test.xxviiiBesides <strong>the</strong> <strong>in</strong>dependent variables reported <strong>in</strong> <strong>the</strong> Annex, we tested <strong>the</strong> <strong>in</strong>clusion <strong>of</strong> o<strong>the</strong>r variables <strong>in</strong> <strong>the</strong> model, such as: dummies for year,average real <strong>in</strong>come, amount <strong>of</strong> Type A gasol<strong>in</strong>e ref<strong>in</strong>ed, quantity <strong>of</strong> petroleum imported, among o<strong>the</strong>rs. None <strong>of</strong> <strong>the</strong> above-mentionedvariables showed satisfactory jo<strong>in</strong>t significance (for significance levels <strong>of</strong> 5% and 10%), and were thus removed from <strong>the</strong> estimatedequation.xxixThis result appears to converge with <strong>the</strong> current aim <strong>of</strong> policy for fuel blend, which would be to conta<strong>in</strong> <strong>the</strong> volatility <strong>of</strong> prices <strong>of</strong> bothgasol<strong>in</strong>e and anhydrous ethanol. See article <strong>in</strong> <strong>the</strong> Folha de S.Paulo newspaper 09 November 2009 http://www1.folha.uol.com.br/folha/d<strong>in</strong>heiro/ult91u649684.shtml.xxx2008 was <strong>the</strong> latest year with complete <strong>in</strong>formation available <strong>in</strong> this study.xxxiIt was assumed that one liter <strong>of</strong> hydrous ethanol is equivalent to one liter <strong>of</strong> anhydrous ethanol and <strong>the</strong> fuel blend is constant <strong>in</strong> <strong>the</strong> order <strong>of</strong> 25%.xxxiiThe production drop is considered <strong>in</strong> relation to that produced <strong>in</strong> <strong>the</strong> period, and not <strong>the</strong> previous period.
Ethanol market and competition259
260 Ethanol and Bioelectricity <strong>Sugarcane</strong> <strong>in</strong> <strong>the</strong> <strong>Future</strong> <strong>of</strong> <strong>the</strong> <strong>Energy</strong> <strong>Matrix</strong>09
Ethanol and Bioelectricity <strong>Sugarcane</strong> <strong>in</strong> <strong>the</strong> <strong>Future</strong> <strong>of</strong> <strong>the</strong> <strong>Energy</strong> <strong>Matrix</strong>261Ethanol <strong>in</strong> <strong>the</strong>Brazilian <strong>Energy</strong> <strong>Matrix</strong>Sergio Valdir BajayLuiz Augusto Horta NogueiraFrancisco José Rocha de Sousa
262 Ethanol and Bioelectricity <strong>Sugarcane</strong> <strong>in</strong> <strong>the</strong> <strong>Future</strong> <strong>of</strong> <strong>the</strong> <strong>Energy</strong> <strong>Matrix</strong>Brazil has made good progress <strong>in</strong> recent years <strong>in</strong> terms <strong>of</strong> plann<strong>in</strong>g <strong>the</strong> production and use <strong>of</strong>energy. This plann<strong>in</strong>g encompasses various objectives, <strong>in</strong>clud<strong>in</strong>g: supply<strong>in</strong>g demand at relativelylow costs; diversify<strong>in</strong>g energy sources, dim<strong>in</strong>ish<strong>in</strong>g <strong>the</strong> risk <strong>of</strong> energy shortages and reduc<strong>in</strong>g <strong>the</strong>market power <strong>of</strong> some large suppliers; and controll<strong>in</strong>g environmental and social impacts, maximiz<strong>in</strong>gpositive effects.Renewable sources <strong>of</strong> energy may be essential for Brazil to achieve <strong>the</strong> commitments <strong>in</strong>cluded<strong>in</strong> <strong>the</strong>se goals, but for this to happen <strong>the</strong> plann<strong>in</strong>g must be backed up by energy policies andlong-term goals that have yet to be def<strong>in</strong>ed by <strong>the</strong> National <strong>Energy</strong> Policy Council. These goalsmust take <strong>in</strong>to consideration environmental benefits, for example <strong>the</strong> reduction <strong>of</strong> greenhousegas emissions, social benefits such as job creation, technological development, and energy costreductions that can result from <strong>the</strong> use <strong>of</strong> renewable sources.The oil price shocks <strong>of</strong> 1973 and 1979 showed <strong>the</strong> world <strong>the</strong> need to plan, not only for energysupply, but also for energy demand, for example via conservation programs. Multi-sectoral analysess<strong>in</strong>ce <strong>the</strong> 1970s and 1980s have sought to reduce dependency on oil and <strong>in</strong>crease energysecurity. The stabilization <strong>of</strong> oil prices s<strong>in</strong>ce <strong>the</strong> mid-1980s reduced <strong>the</strong> urgency <strong>of</strong> this work, but<strong>the</strong> domestic and <strong>in</strong>ternational environmental impacts <strong>of</strong> <strong>the</strong> energy <strong>in</strong>dustry, for example acidra<strong>in</strong> and <strong>the</strong> greenhouse gas effect, have s<strong>in</strong>ce 1900 rek<strong>in</strong>dled <strong>the</strong> <strong>in</strong>terest <strong>in</strong> renewable energysources. Today, issues <strong>of</strong> energy security, reduced availability and <strong>the</strong> high costs <strong>of</strong> oil are onceaga<strong>in</strong> encourag<strong>in</strong>g <strong>the</strong> diversification <strong>of</strong> energy sources.In Brazil, <strong>the</strong> transportation sector – <strong>in</strong> particular <strong>the</strong> light vehicles segment – was significantlyaffected by <strong>the</strong>se price fluctuations. There were important changes <strong>in</strong> <strong>the</strong> relative participation<strong>of</strong> fuels, with alterations <strong>in</strong> public policies, restrictions <strong>in</strong> supply and technological <strong>in</strong>novation. Theresult was that gasol<strong>in</strong>e consumption fell from 1979 to 1989, rose once aga<strong>in</strong> until 2006, and<strong>the</strong>n stabilized. Anhydrous ethanol moved <strong>in</strong> tandem with gasol<strong>in</strong>e, while hydrous ethanol, on<strong>the</strong> contrary, grew between 1979 and 1989; <strong>the</strong>n fell until 2004; and has risen ever s<strong>in</strong>ce. Naturalgas for vehicles (CNG) was <strong>in</strong>troduced dur<strong>in</strong>g this period and grew rapidly, but its consumption isnow decl<strong>in</strong><strong>in</strong>g. These large and always short-term fluctuations impose elevated costs, and fur<strong>the</strong>remphasize <strong>the</strong> need for plann<strong>in</strong>g.The deregulation <strong>of</strong> <strong>the</strong> sugar-energy <strong>in</strong>dustry <strong>in</strong> Brazil <strong>in</strong> <strong>the</strong> 1990s forced a great improvement<strong>in</strong> efficiency, with production costs fall<strong>in</strong>g. Dur<strong>in</strong>g this period, it became clear that it is possible
Ethanol <strong>in</strong> <strong>the</strong> Brazilian <strong>Energy</strong> <strong>Matrix</strong>263for competition to exist <strong>in</strong> some markets that were previously considered to be natural monopolies.Bi<strong>of</strong>uels became part <strong>of</strong> global agendas and new technologies started to change ourparadigms with respect to <strong>the</strong> generation and use <strong>of</strong> energy, now tak<strong>in</strong>g <strong>in</strong>to account decentralization,cogeneration and new fuels.On <strong>the</strong> o<strong>the</strong>r hand, <strong>the</strong> significant growth <strong>of</strong> Brazilian proven oil reserves has changed <strong>the</strong> scenario.There are plans to expand oil-ref<strong>in</strong><strong>in</strong>g capacity by approximately 1.36 million barrels/dayby 2014 (a 67% <strong>in</strong>crease over 2008), so reduc<strong>in</strong>g crude oil exports and add<strong>in</strong>g value to domesticcrude. This would generate large exportable surpluses <strong>of</strong> gasol<strong>in</strong>e and diesel oil start<strong>in</strong>g <strong>in</strong> 2017.If export market conditions are unfavorable, domestic production <strong>of</strong> fossil fuels could be directedto <strong>the</strong> Brazilian market, so reduc<strong>in</strong>g <strong>the</strong> demand for ethanol. This is ano<strong>the</strong>r factor imply<strong>in</strong>g <strong>the</strong>need for a specific regulatory framework to organize <strong>the</strong> market <strong>in</strong> order to stimulate productive<strong>in</strong>vestments, promote fair competition, and fight economic abuses while assur<strong>in</strong>g a steady flow<strong>of</strong> <strong>in</strong>formation.This regulatory framework should:a) Consolidate and improve current legislation with respect to <strong>the</strong> decision-mak<strong>in</strong>g cha<strong>in</strong> and <strong>the</strong>regulatory conditions and <strong>in</strong>struments for market supervision;b) Clearly def<strong>in</strong>e <strong>the</strong> tax framework for fuels, tak<strong>in</strong>g <strong>in</strong>to account <strong>the</strong>ir positive externalities and<strong>the</strong> structural differences between <strong>the</strong> fossil and renewable fuels markets;c) Promote development <strong>of</strong> domestic ethanol market<strong>in</strong>g, <strong>in</strong>clud<strong>in</strong>g <strong>the</strong> futures market and longtermcontracts; and create mechanisms to promote private stockage;d) Encourage <strong>in</strong>vestments <strong>in</strong> <strong>in</strong>frastructure for ethanol transportation and storage; def<strong>in</strong>e regulatoryframeworks for pipel<strong>in</strong>es dest<strong>in</strong>ed for ethanol and o<strong>the</strong>r bi<strong>of</strong>uels;e) Stimulate <strong>the</strong> establishment with<strong>in</strong> <strong>the</strong> market <strong>of</strong> electricity produced from sugarcane, withadequate pric<strong>in</strong>g mechanisms and support for grid connection and market<strong>in</strong>g.Current conditions are very different from those perta<strong>in</strong><strong>in</strong>g <strong>in</strong> <strong>the</strong> 1970s, when anhydrous ethanolwas structured and regulated to ga<strong>in</strong> a foothold <strong>in</strong> <strong>the</strong> Brazilian market. Today Brazil produceslarge amounts <strong>of</strong> bi<strong>of</strong>uel at hundreds <strong>of</strong> plants. The sector employs hundreds <strong>of</strong> thousands <strong>of</strong>people and generates significant social and environmental benefits. In this new scenario, it is essentialto assure that bi<strong>of</strong>uels enjoy a susta<strong>in</strong>able future <strong>in</strong> Brazil, a country whose energy matrixmust rema<strong>in</strong> based on renewable sources.
26 4 Ethanol and Bioelectricity <strong>Sugarcane</strong> <strong>in</strong> <strong>the</strong> <strong>Future</strong> <strong>of</strong> <strong>the</strong> <strong>Energy</strong> <strong>Matrix</strong>1 IntroductionWith great or lesser degrees <strong>of</strong> success, governments <strong>in</strong> all countries plan <strong>the</strong> growth <strong>of</strong> <strong>the</strong>ir energy systemsand take steps to assure a reliable supply <strong>of</strong> energy at reasonable prices, someth<strong>in</strong>g that is crucial for economicdevelopment and <strong>the</strong> well-be<strong>in</strong>g <strong>of</strong> society. <strong>Energy</strong> plann<strong>in</strong>g can also encompass broader objectives;for example, tak<strong>in</strong>g <strong>in</strong>to consideration <strong>the</strong> strong relationship between <strong>the</strong> supply <strong>of</strong> and demand for energywith social, economic, and environmental factors. The desirable development <strong>of</strong> energy systems should alsoconsider its relationship to <strong>the</strong> promotion <strong>of</strong> productive activities, job creation, and its impact on local andglobal environmental quality, this latter be<strong>in</strong>g <strong>of</strong> <strong>in</strong>creas<strong>in</strong>g importance.Syn<strong>the</strong>siz<strong>in</strong>g this broad range <strong>of</strong> demands, <strong>the</strong> two universal and most important goals for <strong>the</strong> development<strong>of</strong> energy systems can be seen as a reflection on <strong>the</strong> greater <strong>in</strong>terdependence between economies and <strong>the</strong>iracknowledgment <strong>of</strong> global environmental issues. These goals are:i Reduc<strong>in</strong>g <strong>the</strong> cost <strong>of</strong> energy supplied, with implications for productive competiveness, and;ii Maximiz<strong>in</strong>g environmental susta<strong>in</strong>ability, measured primarily <strong>in</strong> terms <strong>of</strong> greenhouse gas emissions.These two factors are present <strong>in</strong> <strong>the</strong> majority <strong>of</strong> analyses on energy supply plann<strong>in</strong>g <strong>in</strong> Brazil. The country hasa great variety <strong>of</strong> energy sources available for energy production. It is well known that, until recently, Brazilianenergy has been relatively “cleaner” while be<strong>in</strong>g produced at <strong>in</strong>ternationally competitive prices. However,<strong>the</strong>se natural advantages have co-existed with several problems dur<strong>in</strong>g <strong>the</strong> last four decades: oil price shocks;frequent and substantial changes <strong>in</strong> transportation fuel policies; electrical energy shortages; and <strong>the</strong> <strong>in</strong>creas<strong>in</strong>gdifficulty <strong>of</strong> expand<strong>in</strong>g hydroelectric generation, especially due to environmental factors.Production <strong>of</strong> fuels and electrical energy is especially relevant for <strong>the</strong> value it adds to natural goods and itsconnections to <strong>the</strong> socio-economic system. This is demonstrated by Brazil’s recent experiences with ethanol,where <strong>the</strong> sectoral energy cha<strong>in</strong> not only achieves <strong>the</strong> basic goal <strong>of</strong> supply<strong>in</strong>g energy at competitive prices<strong>in</strong> a way that is environmentally susta<strong>in</strong>able, but also promotes regional development and creates jobs ata much greater <strong>in</strong>tensity than do conventional energy cha<strong>in</strong>s, for example petroleum. However, <strong>the</strong> downside is that given <strong>the</strong> wide range <strong>of</strong> options, broader plann<strong>in</strong>g is required, with a requirement for greater<strong>in</strong>formation and understand<strong>in</strong>g if we are to develop better systems for energy production and use.It is <strong>in</strong> this context that we seek to evaluate <strong>the</strong> prospects for sugarcane <strong>in</strong> <strong>the</strong> Brazilian energy matrix,which is commonly understood as <strong>the</strong> structure <strong>of</strong> production and use <strong>of</strong> energy <strong>in</strong> <strong>the</strong> country. Given itshigh efficiency <strong>in</strong> <strong>the</strong> absorption <strong>of</strong> solar energy, <strong>the</strong> sugarcane bioenergy cha<strong>in</strong> allows for production <strong>of</strong>transportation fuels and <strong>the</strong> generation <strong>of</strong> electrical energy. As a basic scenario, we assume <strong>the</strong> production<strong>of</strong> one billion tonnes <strong>of</strong> sugarcane <strong>in</strong> 2020, approximately twice <strong>the</strong> current production, occupy<strong>in</strong>g 7.3million hectares for ethanol. This scenario assumes that 70% <strong>of</strong> <strong>the</strong> sugarcane would be used to produce65 million m 3 <strong>of</strong> ethanol, dest<strong>in</strong>ed 77% for <strong>the</strong> domestic market, with <strong>the</strong> generation <strong>of</strong> 74 TWh <strong>of</strong> surpluselectrical energy, represent<strong>in</strong>g 10% <strong>of</strong> predicted national power demand <strong>in</strong> that year.
Ethanol <strong>in</strong> <strong>the</strong> Brazilian <strong>Energy</strong> <strong>Matrix</strong>2652 An assessment <strong>of</strong> fuels and technologiesIn this paper, <strong>the</strong> authors analyze <strong>the</strong> supply cha<strong>in</strong>s <strong>of</strong> <strong>the</strong> ma<strong>in</strong> fuels that comprise Brazil’s energy matrix,<strong>in</strong>clud<strong>in</strong>g <strong>the</strong>rmoelectric generation and <strong>the</strong> use as fuels <strong>of</strong> waste products from <strong>the</strong>se supply cha<strong>in</strong>s. Thefuels exam<strong>in</strong>ed are petroleum and its derivatives, natural gas, m<strong>in</strong>eral coal, uranium, and <strong>the</strong> ma<strong>in</strong> liquidbi<strong>of</strong>uels used <strong>in</strong> Brazil, which are ethanol and biodiesel.2.1 Petroleum and its derivativesPetroleum is a complex mixture <strong>of</strong> hydrocarbons that was formed dur<strong>in</strong>g millions <strong>of</strong> years from organicmaterial under high pressure, <strong>in</strong> sedimentary bas<strong>in</strong>s located on onshore or <strong>of</strong>fshore. Oil is classified ma<strong>in</strong>lyaccord<strong>in</strong>g to its density, viscosity, and sulfur content. Most Brazilian reserves are located <strong>of</strong>fshore withrelatively high densities, viscosities, and sulfur contents, which tends to reduce its quality.Petroleum is rarely consumed directly as a fuel. Usually, it is shipped to ref<strong>in</strong>eries where derivatives areobta<strong>in</strong>ed through various distillation processes and crack<strong>in</strong>g <strong>of</strong> hydrocarbon cha<strong>in</strong>s. Ref<strong>in</strong>eries also reduce<strong>the</strong> amount <strong>of</strong> pollutants present <strong>in</strong> <strong>the</strong> oil, especially sulfur, through chemical processes such as hydrogenation.Some ref<strong>in</strong>eries also produce raw materials such as naphtha and ethylene for <strong>the</strong> petrochemical<strong>in</strong>dustry. Various process<strong>in</strong>g residues such as petroleum coke and ref<strong>in</strong>ery gases are consumed as fuel <strong>in</strong><strong>the</strong> ref<strong>in</strong>eries, or else sold.Petrobras, <strong>the</strong> ma<strong>in</strong> owner and operator <strong>of</strong> Brazilian petroleum ref<strong>in</strong>eries, has <strong>in</strong>vested significantly to expandits ref<strong>in</strong>ery capacity for process<strong>in</strong>g heavy crude oil from recently discovered reserves <strong>in</strong> <strong>the</strong> <strong>of</strong>fshoreCampos bas<strong>in</strong>, <strong>in</strong> <strong>the</strong> state <strong>of</strong> Rio de Janeiro. Recent <strong>in</strong>vestments have also gone toward hydrogenationunits. The company is plann<strong>in</strong>g new ref<strong>in</strong>eries through 2030, some <strong>of</strong> <strong>the</strong>m scheduled to produce premiumgasol<strong>in</strong>e for export, especially for <strong>the</strong> American market, while o<strong>the</strong>r ref<strong>in</strong>eries will <strong>in</strong>crease <strong>the</strong> production<strong>of</strong> raw materials for <strong>the</strong> Brazilian petrochemical <strong>in</strong>dustry.The supply cha<strong>in</strong> <strong>of</strong> petroleum and its derivatives comprises <strong>the</strong> follow<strong>in</strong>g stages: prospect<strong>in</strong>g; production;transport to <strong>the</strong> ref<strong>in</strong>eries; ref<strong>in</strong><strong>in</strong>g; transport <strong>of</strong> derivates to distribution companies or large consumers;distribution; and retail sale to small and medium f<strong>in</strong>al consumers. Long distance transportation <strong>of</strong> petroleumand its derivatives has traditionally been done <strong>in</strong> Brazil by tanker ships and pipel<strong>in</strong>es, whereas distributionis handled by tanker trucks.In addition to its f<strong>in</strong>al uses as a fuel for vehicles and as a source <strong>of</strong> heat production <strong>in</strong> ovens, dryers andboilers, petroleum derivatives are also used <strong>in</strong> Brazil as fuel <strong>in</strong> steam-cycle <strong>the</strong>rmoelectric plants, or <strong>in</strong> dieselunits, or <strong>in</strong> cogeneration plants with <strong>the</strong> simultaneous and sequential production <strong>of</strong> mechanical/electricalpower and <strong>the</strong>rmal energy from <strong>the</strong> same fuel source (Bajay, 2009b).
266 Ethanol and Bioelectricity <strong>Sugarcane</strong> <strong>in</strong> <strong>the</strong> <strong>Future</strong> <strong>of</strong> <strong>the</strong> <strong>Energy</strong> <strong>Matrix</strong>2.2 Natural gasNatural gas is a mixture <strong>of</strong> light hydrocarbons, predom<strong>in</strong>antly methane, <strong>in</strong> gas form. Its orig<strong>in</strong>s and formationare similar to those <strong>of</strong> petroleum, and consequently it too is concentrated <strong>in</strong> sedimentary bas<strong>in</strong>s on land or<strong>of</strong>fshore. When it is found mixed with petroleum, it is called associated gas.The supply cha<strong>in</strong> for natural gas <strong>in</strong> Brazil comprises <strong>the</strong> follow<strong>in</strong>g stages: prospect<strong>in</strong>g, production, transportationto <strong>the</strong> process<strong>in</strong>g units, process<strong>in</strong>g, transportation to <strong>the</strong> city gates or Petrobras’ po<strong>in</strong>ts <strong>of</strong> consumption,and distribution to f<strong>in</strong>al consumers. In some o<strong>the</strong>r countries natural gas is stored <strong>in</strong> caves, m<strong>in</strong>es, or depletedpetroleum fields. In Brazil, <strong>the</strong> only storage available is with<strong>in</strong> <strong>the</strong> transportation and distribution networks<strong>the</strong>mselves. Various o<strong>the</strong>r countries also permit supply directly from producers and importers to large f<strong>in</strong>alconsumers without pass<strong>in</strong>g through <strong>the</strong> distribution network. In Brazil, this has happened only <strong>in</strong> <strong>the</strong> case <strong>of</strong>consumption with<strong>in</strong> Petrobras’ own production units. The heavier components <strong>of</strong> natural gas are separated<strong>in</strong> <strong>the</strong> process<strong>in</strong>g units to produce naphtha or gasol<strong>in</strong>e, leav<strong>in</strong>g beh<strong>in</strong>d virtually only methane to be sold as“dry” natural gas.Ownership <strong>of</strong> natural gas is transferred at <strong>the</strong> city gates, where it is sold by producers or importers, denom<strong>in</strong>ated“carriers” and responsible for transportation, to distribution companies. Activities upstream <strong>of</strong> <strong>the</strong> citygate are similar to <strong>the</strong> oil <strong>in</strong>dustry, if not actually <strong>in</strong>tegrated with <strong>the</strong>se, while downstream activities after <strong>the</strong>city gate are typical <strong>of</strong> a “network <strong>in</strong>dustry” such as electricity distribution.Natural gas can replace several o<strong>the</strong>r fuels with relative ease, provided a supply network is available. Thisapplies <strong>in</strong> particular to petroleum derivatives used <strong>in</strong> ovens, dryers, boilers, <strong>the</strong>rmoelectric or cogenerationplants, and refrigeration units and air condition<strong>in</strong>g. Consumption <strong>of</strong> natural gas exhibits high price-elasticity,especially <strong>in</strong> <strong>in</strong>dustry.The ma<strong>in</strong> Brazilian markets for natural gas are <strong>in</strong>dustry, <strong>the</strong>rmoelectric generation and natural gas for vehicles.The fuel’s restricted availability, <strong>the</strong> still-limited coverage <strong>of</strong> transportation and distribution networks, and ris<strong>in</strong>gprices <strong>in</strong> recent years have restricted <strong>the</strong> use <strong>of</strong> natural gas as an energy source <strong>in</strong> Brazil. Gas is consumed<strong>in</strong> <strong>the</strong>rmoelectric stations <strong>in</strong> plants powered by <strong>in</strong>ternal combustion eng<strong>in</strong>es, Brayton or comb<strong>in</strong>ed cycle stations,and also cogeneration plants that can use any <strong>of</strong> <strong>the</strong>se technologies.2.3 Coal and its derivativesCoal can be broadly classified as steam coal and metallurgical coal. The former is used essentially as a fuel, especially<strong>in</strong> <strong>the</strong>rmoelectric plants, while <strong>the</strong> latter is used ma<strong>in</strong>ly as a reduc<strong>in</strong>g agent (coal coke) for process<strong>in</strong>gprimary materials such as pig iron. The stages <strong>of</strong> <strong>the</strong> steam coal supply cha<strong>in</strong> co<strong>in</strong>cide with <strong>the</strong> <strong>in</strong>itial stages<strong>of</strong> <strong>the</strong> metallurgical coal supply cha<strong>in</strong>: prospection, production, process<strong>in</strong>g (which, if any, usually takes placenear <strong>the</strong> m<strong>in</strong>e-head) and transportation to <strong>the</strong> place <strong>of</strong> f<strong>in</strong>al use as fuel, or conversion <strong>in</strong>to coke.
Ethanol <strong>in</strong> <strong>the</strong> Brazilian <strong>Energy</strong> <strong>Matrix</strong>267The ma<strong>in</strong> use <strong>of</strong> steam coal <strong>in</strong> Brazil is for <strong>the</strong>rmoelectric generation <strong>in</strong> steam-cycle power plants (Bajay,2009b) <strong>in</strong> <strong>the</strong> South <strong>of</strong> <strong>the</strong> country. Some <strong>in</strong>dustrial plants <strong>in</strong> sou<strong>the</strong>rn states use coal <strong>in</strong> furnaces and <strong>in</strong>particular boilers, with <strong>the</strong> ma<strong>in</strong> consumers be<strong>in</strong>g <strong>the</strong> chemical, pulp and paper, food and beverage, ceramics,and cement sectors. The high ash content <strong>of</strong> Brazilian coal, all <strong>of</strong> which is m<strong>in</strong>ed <strong>in</strong> <strong>the</strong> South <strong>of</strong><strong>the</strong> country, and <strong>the</strong> lack <strong>of</strong> adequate rail <strong>in</strong>frastructure, make it very costly to transport this fuel to o<strong>the</strong>rregions. There are currently some plants under design or construction <strong>in</strong> <strong>the</strong> North, Nor<strong>the</strong>ast and Sou<strong>the</strong>ast<strong>of</strong> <strong>the</strong> country that will burn imported coal.Most <strong>of</strong> <strong>the</strong> metallurgical coal consumed <strong>in</strong> Brazil is turned <strong>in</strong>to coke at plants that are <strong>in</strong>tegrated with <strong>the</strong>largest steel plants. Of <strong>the</strong> rema<strong>in</strong>der, most is consumed <strong>in</strong> powdered form as a blast furnace fuel <strong>in</strong> <strong>the</strong>steel <strong>in</strong>dustry, with smaller amounts consumed <strong>in</strong> furnaces <strong>in</strong> <strong>the</strong> m<strong>in</strong><strong>in</strong>g and pelletiz<strong>in</strong>g, nonferrous metals,cement and o<strong>the</strong>r <strong>in</strong>dustrial sectors. Pulverized coal <strong>in</strong>jection <strong>in</strong> blast furnaces permits substitut<strong>in</strong>g part<strong>of</strong> <strong>the</strong> coke needed to produce pig iron with lower-cost coal.Coke plants also produce coke oven gas and tar, <strong>in</strong> addition to coke itself. Coal coke is virtually all consumedas a reduc<strong>in</strong>g agent <strong>in</strong> blast furnaces at steel plants. It is also used as fuel <strong>in</strong> <strong>the</strong>se furnaces, and to a lesserextent <strong>in</strong> ovens <strong>of</strong> o<strong>the</strong>r <strong>in</strong>dustrial sectors <strong>in</strong>clud<strong>in</strong>g non-ferrous metals, iron alloys, m<strong>in</strong><strong>in</strong>g and pelletiz<strong>in</strong>g,and cement. Coke oven gas is used as fuel <strong>in</strong> coke plant process<strong>in</strong>g units, <strong>in</strong> <strong>the</strong> boilers and furnaces <strong>of</strong> steelmills, and for generat<strong>in</strong>g electricity <strong>in</strong> <strong>the</strong>se plants. The o<strong>the</strong>r byproduct <strong>of</strong> coal coke production is tar. Thisis used as a raw material, as fuel <strong>in</strong> steel mills and for generat<strong>in</strong>g electricity <strong>in</strong> <strong>the</strong>se plants.2.4 UraniumThe nuclear fuel cycle consists <strong>of</strong> <strong>the</strong> follow<strong>in</strong>g production stages: m<strong>in</strong><strong>in</strong>g and concentration <strong>of</strong> uranium;conversion <strong>of</strong> concentrate (yellowcake, U 3O 8) <strong>in</strong>to uranium hexafluoride (UF 6); enrichment; production <strong>of</strong>fuel for nuclear power plants; and reprocess<strong>in</strong>g spent fuel, <strong>in</strong> <strong>the</strong> case <strong>of</strong> a closed cycle. Brazil currentlyacts <strong>in</strong> <strong>the</strong> stages <strong>of</strong> m<strong>in</strong><strong>in</strong>g, concentration, enrichment and mak<strong>in</strong>g fuel for nuclear plants, operat<strong>in</strong>g viaa federal government-owned company called Industrias Nucleares do Brasil S.A. (INB), under <strong>the</strong> auspices<strong>of</strong> <strong>the</strong> M<strong>in</strong>istry <strong>of</strong> Science and Technology (MCT). Imported yellowcake is added to that produced <strong>in</strong> Braziland converted to uranium hexafluoride <strong>the</strong>n enriched abroad, sent back to Brazil to be converted <strong>in</strong>to <strong>the</strong>uranium dioxide (UO 2) conta<strong>in</strong>ed <strong>in</strong> <strong>the</strong> locally-made fuel elements used <strong>in</strong> nuclear power plants. Conversionand enrichment will be performed <strong>in</strong> Brazil <strong>in</strong> <strong>the</strong> near future.The global nuclear <strong>in</strong>dustry has for more than five decades developed and improved several technologiesfor nuclear power stations, so that today <strong>the</strong>re are four generations <strong>of</strong> nuclear reactors (Mongelli, 2006).The two nuclear plants operat<strong>in</strong>g <strong>in</strong> Brazil, toge<strong>the</strong>r with a third under construction, are second-generationplants (Bajay, 2009b).
268 Ethanol and Bioelectricity <strong>Sugarcane</strong> <strong>in</strong> <strong>the</strong> <strong>Future</strong> <strong>of</strong> <strong>the</strong> <strong>Energy</strong> <strong>Matrix</strong>2.5 Liquid bi<strong>of</strong>uelsBi<strong>of</strong>uels production represents one <strong>of</strong> <strong>the</strong> paths for us<strong>in</strong>g solar energy via photosyn<strong>the</strong>sis. In general, <strong>the</strong> production<strong>of</strong> bi<strong>of</strong>uels <strong>in</strong>volves an agricultural phase, when biomass is produced, and a subsequent <strong>in</strong>dustrial phase <strong>in</strong>which this biomass is transformed <strong>in</strong>to an energy vector suitable for f<strong>in</strong>al use, typically <strong>in</strong> <strong>in</strong>ternal combustioneng<strong>in</strong>es. The f<strong>in</strong>al cost <strong>of</strong> bi<strong>of</strong>uel, as well as its environmental impact, <strong>the</strong>refore depends on <strong>the</strong>se two phases.Figure 1 illustrates <strong>the</strong> pr<strong>in</strong>cipal technology paths <strong>in</strong> <strong>the</strong> <strong>in</strong>dustrial stage <strong>of</strong> bioenergy production. It <strong>in</strong>cludesknown and consolidated technologies toge<strong>the</strong>r with alternatives that are still under development.Fermentation thus <strong>in</strong>cludes exist<strong>in</strong>g established processes such as <strong>the</strong> production <strong>of</strong> ethanol from sugarand starch, and processes still be<strong>in</strong>g studied, for example us<strong>in</strong>g <strong>the</strong> biochemical conversion <strong>of</strong> cellulose.The analysis <strong>of</strong> this paper focuses on production <strong>of</strong> ethanol from sugarcane bagasse and production <strong>of</strong>electricity from agricultural and <strong>in</strong>dustrial sugarcane waste, toge<strong>the</strong>r with biodiesel production from <strong>the</strong>raw materials that have proved most promis<strong>in</strong>g <strong>in</strong> Brazil.2.5.1 EthanolThe ethanol supply cha<strong>in</strong> <strong>in</strong> Brazil is almost always <strong>in</strong>tegrated with sugar production. It starts with sugarcanecultivation, with productivity <strong>in</strong> <strong>the</strong> Center-South region reach<strong>in</strong>g about 80 tonnes per hectare <strong>in</strong><strong>the</strong> best plantations (Nogueira, 2009). Recent decades have seen remarkable progress <strong>in</strong> <strong>the</strong> agriculturaltechnology used <strong>in</strong> Brazilian mills.As shown <strong>in</strong> Figure 1, <strong>the</strong> <strong>in</strong>dustrial stage uses a process <strong>of</strong> biochemical conversion: fermentation, followedby distillation. This produces anhydrous ethanol that is blended with gasol<strong>in</strong>e for use <strong>in</strong> conventional Ottocycle eng<strong>in</strong>es, and hydrous ethanol to be used <strong>in</strong> eng<strong>in</strong>es that are specifically designed for consumption <strong>of</strong>this fuel. These may be ethanol-only eng<strong>in</strong>es, or flex-fuel eng<strong>in</strong>es that can run on a variable gasol<strong>in</strong>e-ethanolmixture. The raw material can be sugarcane juice, or <strong>in</strong> <strong>the</strong> case <strong>of</strong> plants that produce both ethanol andsugar it can be molasses, or <strong>in</strong>deed mixtures <strong>of</strong> both sugarcane juice and molasses depend<strong>in</strong>g on <strong>the</strong> availabilityand economic factors. <strong>Sugarcane</strong> juice is extracted by crush<strong>in</strong>g or diffusion and pre-concentrated <strong>in</strong>several stages and sterilized before be<strong>in</strong>g forwarded to <strong>the</strong> multi-stage fermentation phase <strong>in</strong> batches or acont<strong>in</strong>uous stream, with <strong>the</strong> yeast be<strong>in</strong>g recycled (<strong>the</strong> Melle Bo<strong>in</strong>ot process). Distillation occurs <strong>in</strong> multiplephases. Anhydrous ethanol requires an additional dehydration step. The best distilleries currently achieveproductivity <strong>of</strong> 85 liters <strong>of</strong> ethanol per tonne <strong>of</strong> sugarcane (Nogueira, 2009).Brazil enjoys high productivity and lower ethanol production costs thanks to high agricultural yields, whichcome from <strong>the</strong> high photosyn<strong>the</strong>tic efficiency <strong>of</strong> sugarcane. However, productivity and cost efficiency arealso a result <strong>of</strong> us<strong>in</strong>g bagasse to generate electricity <strong>in</strong> cogeneration plants, <strong>of</strong>ten supply<strong>in</strong>g not just <strong>the</strong>energy needed for <strong>the</strong> mill’s own production process but also substantial surpluses that are sold to electricitydistribution companies or large consumers.
Ethanol <strong>in</strong> <strong>the</strong> Brazilian <strong>Energy</strong> <strong>Matrix</strong>269Technology paths for bioenergy productionFigure 1CombustãoSteamSteamturb<strong>in</strong>eThermochemical conversionGasificationGasComb<strong>in</strong>edcycles,eng<strong>in</strong>esSyn<strong>the</strong>sisCaCHEATGasPyrolysisliquefactionHTUOilRef<strong>in</strong><strong>in</strong>gDieselCoalELECTRICITYBiochemical converisonDigestionFermentationBiogasGas-powered eng<strong>in</strong>eDistilationEthanolFUELExtraction(Oleag<strong>in</strong>ous)E<strong>the</strong>rificationBiodieselSource: Turkemburg et al, 2000.
270 Ethanol and Bioelectricity <strong>Sugarcane</strong> <strong>in</strong> <strong>the</strong> <strong>Future</strong> <strong>of</strong> <strong>the</strong> <strong>Energy</strong> <strong>Matrix</strong>The sugar-ethanol sector is Brazil’s largest self-producer <strong>of</strong> electricity and also <strong>the</strong> largest generator <strong>of</strong>surplus electricity for <strong>the</strong> grid. The use <strong>of</strong> high-pressure boilers and efficient steam turb<strong>in</strong>es, along with areduction <strong>in</strong> energy consumption <strong>in</strong> <strong>the</strong> mills <strong>the</strong>mselves, has allowed for <strong>in</strong>creas<strong>in</strong>g generation <strong>of</strong> surpluselectricity. The gradual mechanization <strong>of</strong> <strong>the</strong> sugarcane harvest is free<strong>in</strong>g up part <strong>of</strong> <strong>the</strong> sugarcane straw tobe burned <strong>in</strong> <strong>the</strong> cogeneration power plants, so contribut<strong>in</strong>g to fur<strong>the</strong>r <strong>in</strong>crease <strong>of</strong> <strong>the</strong> electricity surplus.2.5.2 BiodieselOils and fats can be converted to fuel suitable for use <strong>in</strong> Diesel cycle eng<strong>in</strong>es via processes <strong>of</strong> transesterification.The biodiesel supply cha<strong>in</strong> thus <strong>in</strong>volves, as a first step, harvest<strong>in</strong>g an oilseed plant, followed byextraction <strong>of</strong> <strong>the</strong> vegetable oil. An alternative is an animal process<strong>in</strong>g activity, such as a slaughterhouse, with<strong>the</strong> supply <strong>of</strong> animal fat and <strong>the</strong> subsequent transesterification <strong>of</strong> fatty materials. For <strong>the</strong> transesterificationprocess, <strong>the</strong> raw material is mixed with an alcohol <strong>in</strong> <strong>the</strong> presence <strong>of</strong> catalysts. This separates <strong>the</strong> glycer<strong>in</strong>and produces esters <strong>of</strong> fatty acids known as biodiesel. The catalyst may be alkal<strong>in</strong>e, acidic or enzymatic, and<strong>the</strong> alcohol may be ethanol or methanol. Alkal<strong>in</strong>e transesterification has <strong>of</strong>fered <strong>the</strong> most <strong>in</strong>terest<strong>in</strong>g path s<strong>of</strong>ar, with faster reaction k<strong>in</strong>etics. The raw material is important when decid<strong>in</strong>g whe<strong>the</strong>r to use acidic or basiccatalysis. Enzyme catalysis promises advantages such as fewer byproducts, but is still <strong>in</strong> early development.Ethyl transesterification is more <strong>in</strong>terest<strong>in</strong>g for Brazil and could reach similar levels <strong>of</strong> quality, but <strong>the</strong> path ismore complex than <strong>the</strong> methyl one.A wide range <strong>of</strong> raw materials can be used for biodiesel production, <strong>in</strong>clud<strong>in</strong>g: vegetable oils such as annualcrops like soybean and rapeseed and perennials such as palm trees; animal fats; and waste oils and fats. Theproductive contexts for bi<strong>of</strong>uel are <strong>the</strong>refore equally varied.A few years ago, Petrobras patented a process known as H-Bio, for produc<strong>in</strong>g diesel oil <strong>in</strong> ref<strong>in</strong>eries. It isbased on process<strong>in</strong>g a mixture <strong>of</strong> vegetable or animal oil with fractions <strong>of</strong> petroleum diesel. This process wasimplemented, but was discont<strong>in</strong>ued <strong>in</strong> August 2007 due to <strong>the</strong> high cost <strong>of</strong> vegetable oils (Sousa, 2009b).3 Supply and demandThe ma<strong>in</strong> determ<strong>in</strong>ants <strong>of</strong> energy consumption <strong>in</strong> a country are economic growth and population <strong>in</strong>crease.Naturally, <strong>the</strong> level <strong>of</strong> demand is <strong>in</strong>fluenced by <strong>the</strong> adoption <strong>of</strong> technologies, by consumption patterns thatare more or less efficient and by structural changes that may occur <strong>in</strong> <strong>the</strong> composition <strong>of</strong> economic outputand <strong>in</strong> <strong>the</strong> <strong>in</strong>come distribution with<strong>in</strong> society. The follow<strong>in</strong>g sections <strong>of</strong>fer basic <strong>in</strong>formation for an analysis<strong>of</strong> <strong>the</strong> Brazilian energy matrix, present<strong>in</strong>g a brief review <strong>of</strong> <strong>the</strong> current state <strong>of</strong> <strong>the</strong> market with current andforecast supply and demand for different energy vectors, based on <strong>of</strong>ficial and <strong>in</strong>dependent studies.
Ethanol <strong>in</strong> <strong>the</strong> Brazilian <strong>Energy</strong> <strong>Matrix</strong>2713.1 Petroleum and its derivatives3.1.1 DemandEven though diesel is banned for use <strong>in</strong> light vehicles, it figures prom<strong>in</strong>ently among Brazil’s vehicle fuels.Fuel oil and liquefied petroleum gas are <strong>in</strong> relative decl<strong>in</strong>e as <strong>in</strong>dustrial options, while <strong>the</strong> participation <strong>of</strong>ethanol and biodiesel is expected to rise.Diesel consumption is strongly correlated with Gross Domestic Product (GDP) and accounts for 42% <strong>of</strong> <strong>the</strong>overall petroleum derivatives market. The apparent consumption <strong>of</strong> major petroleum products is shown <strong>in</strong>Table 1.There is a regulation bann<strong>in</strong>g <strong>the</strong> consumption <strong>of</strong> diesel <strong>in</strong> passenger, freight and mixed-use vehicles withcapacity under 1,000 kg, count<strong>in</strong>g <strong>the</strong> weight <strong>of</strong> <strong>the</strong> driver, crew, passengers and cargo i .Fuel oil exhibits a trend for decreas<strong>in</strong>g market share, so much so that fuel oil sales fell by 50% between 2000and 2007. It is also worth not<strong>in</strong>g that <strong>in</strong>dustrial consumption <strong>of</strong> LPG has been dropp<strong>in</strong>g s<strong>in</strong>ce <strong>the</strong> start <strong>of</strong> <strong>the</strong>new century (MME, 2008).Demand for biodiesel was ensured significant growth <strong>in</strong> 2009 thanks to regulation CNPE No. 2 <strong>of</strong> April 27,2009. This established a 4% m<strong>in</strong>imum (by volume) <strong>of</strong> biodiesel to be blended with petroleum diesel sold t<strong>of</strong><strong>in</strong>al consumers start<strong>in</strong>g July 1, 2009. The trend will cont<strong>in</strong>ue through 2010, because <strong>the</strong> government alsoestablished a m<strong>in</strong>imum percentage <strong>of</strong> 5% start<strong>in</strong>g January 1, 2010 (resolution CNPE No. 6 <strong>of</strong> September16, 2009).The Brazilian vehicle fuels matrix for 2008 is shown <strong>in</strong> Figure 2. As can be seen, diesel accounts for 52.4% <strong>of</strong>fuel consumption <strong>in</strong> <strong>the</strong> road transportation sector. In second place is Type A gasol<strong>in</strong>e, on 25.4% (note thatType A gasol<strong>in</strong>e is blended with ethanol to make Type C gasol<strong>in</strong>e before sale <strong>the</strong> f<strong>in</strong>al consumer).The share <strong>of</strong> fuels for Otto cycle eng<strong>in</strong>es <strong>in</strong> <strong>the</strong> vehicle fuels matrix started fall<strong>in</strong>g <strong>in</strong> <strong>the</strong> 1970s, up to when asignificant number <strong>of</strong> heavy vehicles had used gasol<strong>in</strong>e. Diesel cycle fuels overtook Otto cycle fuels <strong>in</strong> 1980,and s<strong>in</strong>ce <strong>the</strong>n <strong>the</strong> share <strong>of</strong> diesel has rema<strong>in</strong>ed around 52%, with small fluctuations.However, it is important to note that <strong>the</strong> demand for Otto cycle fuels (gasol<strong>in</strong>e, ethanol and natural gas) hasrisen steadily <strong>in</strong> absolute terms, except for brief periods <strong>of</strong> more serious economic difficulties.As can be seen <strong>in</strong> Figure 3, <strong>the</strong>se three Otto cycle fuels do not exhibit homogeneous behavior <strong>in</strong> terms <strong>of</strong><strong>the</strong>ir participation <strong>in</strong> <strong>the</strong> fuel matrix between 1970 and 2007. In fact, <strong>the</strong> share <strong>of</strong> pure gasol<strong>in</strong>e fell from
272 Ethanol and Bioelectricity <strong>Sugarcane</strong> <strong>in</strong> <strong>the</strong> <strong>Future</strong> <strong>of</strong> <strong>the</strong> <strong>Energy</strong> <strong>Matrix</strong>almost 99% <strong>in</strong> 1970 to reach an historic low <strong>of</strong> 48.3% <strong>in</strong> 1988. Conversely, <strong>the</strong> share <strong>of</strong> ethanol (anhydrousand hydrous) started <strong>the</strong> period at close to 1%, ris<strong>in</strong>g to a maximum <strong>of</strong> 51.7% <strong>in</strong> 1988, <strong>the</strong>n dropp<strong>in</strong>g to29% early <strong>in</strong> <strong>the</strong> new century before pull<strong>in</strong>g up to 34.2% <strong>in</strong> 2007. Natural gas began near zero <strong>in</strong> 2003,reach<strong>in</strong>g 9% <strong>in</strong> 2007. It is worth observ<strong>in</strong>g that if all <strong>the</strong> vehicles us<strong>in</strong>g natural gas (consumption <strong>of</strong> 2.56million m 3 <strong>in</strong> 2007) switched to hydrous ethanol, <strong>the</strong> demand for this bi<strong>of</strong>uel would be <strong>in</strong>creased by 3.7million m 3 (Sousa, 2009b) ii .3.1.2 ProductionBrazilian petroleum production grew at 6.5% per year from 1998 to 2008. Domestic production <strong>in</strong> 2008was 663.28 million barrels, with Petrobras account<strong>in</strong>g for 645.29 million barrels or 97.3% <strong>of</strong> <strong>the</strong> total.This positive performance cont<strong>in</strong>ued <strong>in</strong> 2009. Average petroleum production (<strong>in</strong>clud<strong>in</strong>g LNG) dur<strong>in</strong>g <strong>the</strong>first quarter <strong>of</strong> 2009 was two million barrels per day, accord<strong>in</strong>g to <strong>the</strong> ANP iii . On May 4 th 2009, Petrobrasdaily production set a new record <strong>of</strong> 2.06 million barrels (Petrobras, 2009).Table 1Apparent consumption <strong>of</strong> petroleum derivatives <strong>in</strong> BrazilFuelthousand m 3 %Diesel 2008 2008/2007Diesel 41,558 44,764 7.7Biodiesel 260 1,125 332.7Type C gasol<strong>in</strong>e 24,235 25,175 3.9Type A gasol<strong>in</strong>e 18,483 18,881 2.2Anhydrous ethanol 5,843 6,294 7.7Hydrous ethanol 9,367 13,290 41.9Total ethanol 15,210 19,584 28.8Liquefied petroleum gas (LPG) 12,005 12,259 2.1Fuel oil 5,525 5,172 -6.4Aviation gasol<strong>in</strong>e 4,891 5,227 6.9Aviation kerosene 55 61 10.9Kerosene for illum<strong>in</strong>ation 31 24 -22.6Total 97,757 105,972 8.4CNG (thousand m 3 /day) 7,015 6,614 -5.7
Ethanol <strong>in</strong> <strong>the</strong> Brazilian <strong>Energy</strong> <strong>Matrix</strong>273There are currently 14 oil ref<strong>in</strong>eries <strong>in</strong> Brazil, <strong>of</strong> which 12 are owned by Petrobras and two, Mangu<strong>in</strong>hos(currently disabled) and Univen, are private. Total ref<strong>in</strong><strong>in</strong>g capacity at 31 December 2007 was 323.75 millionm 3 per day (2.04 million BOPD) with a high utilization factor – average process<strong>in</strong>g <strong>in</strong> 2007 was 1.74million BOPD <strong>of</strong> oil, <strong>of</strong> which 77% was domestic crude (ANP, 2008). The average process<strong>in</strong>g pr<strong>of</strong>ile – seeFigure 4 – <strong>in</strong>dicates a concentration <strong>of</strong> production <strong>in</strong> medium derivatives (diesel and jet fuel), but withrelevant participation <strong>of</strong> gasol<strong>in</strong>e (20%).3.1.3 Imports and exportsBrazil is an overall net petroleum exporter, but with important positions as an importer <strong>of</strong> diesel oil and anexporter <strong>of</strong> fuel oil and gasol<strong>in</strong>e.Figure 2Vehicle fuels matrix <strong>in</strong> 2008 % TPE (tonne <strong>of</strong> petroleum equivalent)Diesel oil52.3%Type A gasol<strong>in</strong>e25.4%Natural gas3.4%Hydrous ethanol11.8%Anhydrous ethanol5.9%Biodiesel 1.2%0% 10% 20% 30%40% 50%60%Figure 3Breakdown <strong>of</strong> fuel consumption for Otto Cycle eng<strong>in</strong>es Share (% TPE)1008060402001970 1973 1976 1979 1982 1985 1988 1991 1994 1997 2000 2003 2006Gasol<strong>in</strong>eEthanolNatural gasSource: MME
274 Ethanol and Bioelectricity <strong>Sugarcane</strong> <strong>in</strong> <strong>the</strong> <strong>Future</strong> <strong>of</strong> <strong>the</strong> <strong>Energy</strong> <strong>Matrix</strong>The country has been a net exporter s<strong>in</strong>ce 2006. In 2008, it exported 432,000 BOPD at an average price<strong>of</strong> US$87/b and imported 404,000 BOPD at an average <strong>of</strong> US$111/b iv . Given that <strong>the</strong> average value <strong>of</strong> importedderivatives was well above <strong>the</strong> price achieved by domestic oil, <strong>the</strong> oil trade balance was negative <strong>in</strong>US$2.7 billion.With respect to petroleum derivatives, <strong>the</strong> position <strong>of</strong> imports and exports <strong>of</strong> diesel oil and gasol<strong>in</strong>e shouldbe noted. In 2007, Brazil exported 3.70 million m 3 <strong>of</strong> gasol<strong>in</strong>e (16.7% <strong>of</strong> domestic production) and imported5.10 million m³ <strong>of</strong> diesel oil (ANP, 2008).Brazil exported 5.2 million m 3 <strong>of</strong> gasol<strong>in</strong>e <strong>in</strong> 1988, which accounted for 41% <strong>of</strong> domestic production. Insubsequent years, <strong>the</strong> volume <strong>of</strong> gasol<strong>in</strong>e exported fell due to <strong>in</strong>creased absorption by <strong>the</strong> domestic market,result<strong>in</strong>g from higher sales <strong>of</strong> gasol<strong>in</strong>e vehicles. This situation later reversed, due to <strong>the</strong> high penetration<strong>of</strong> flex-fuel vehicles, <strong>in</strong>troduced <strong>in</strong> March 2003, and <strong>the</strong> fact that most flex-fuel vehicle owners optedto use hydrous ethanol. Dur<strong>in</strong>g <strong>the</strong> first quarter <strong>of</strong> 2009, flex-fuel vehicles accounted for 87.8% <strong>of</strong> new carsand light commercial vehicles licensed (Anfavea, 2009).Brazil will produce a large surplus <strong>of</strong> gasol<strong>in</strong>e due to fall<strong>in</strong>g demand <strong>in</strong> <strong>the</strong> domestic market. To exportgasol<strong>in</strong>e as a f<strong>in</strong>ished product, Brazilian domestic gasol<strong>in</strong>e must meet <strong>the</strong> specifications <strong>of</strong> <strong>the</strong> <strong>in</strong>ternationalmarket. In this context, <strong>the</strong> sulfur content <strong>of</strong> domestic gasol<strong>in</strong>e and diesel is still significantly higher than<strong>the</strong> values observed <strong>in</strong> developed countries (Sousa, 2009b).Figure 4Petroleum ref<strong>in</strong><strong>in</strong>g pr<strong>of</strong>ile <strong>in</strong> Brazil <strong>in</strong> 2007Diesel35%Gasol<strong>in</strong>e20%Fuel oil14%LPG11%Naphtha8%Aviation kerosene4%O<strong>the</strong>rs8%0% 10% 20% 30%40%Source: ANP
Ethanol <strong>in</strong> <strong>the</strong> Brazilian <strong>Energy</strong> <strong>Matrix</strong>2753.1.4 Expansion <strong>of</strong> ref<strong>in</strong><strong>in</strong>g capacityAs shown <strong>in</strong> Table 2, we expect an <strong>in</strong>crease <strong>of</strong> 1.36 million BOPD <strong>in</strong> Petrobras’ ref<strong>in</strong><strong>in</strong>g capacity by 2014,represent<strong>in</strong>g an <strong>in</strong>crease <strong>of</strong> 67% compared to domestic ref<strong>in</strong><strong>in</strong>g capacity at December 31, 2008.Petrobras’ Bus<strong>in</strong>ess Plan 2009-2013 forecasts <strong>in</strong>vestments <strong>of</strong> US$34.9 billion for expansion <strong>of</strong> process<strong>in</strong>gcapacity to prevent Brazil from becom<strong>in</strong>g a major exporter <strong>of</strong> crude oil. The plan <strong>in</strong>cludes expansion <strong>of</strong>380,000 BOPD <strong>in</strong> process<strong>in</strong>g capacity with construction <strong>of</strong> <strong>the</strong> Abreu e Lima ref<strong>in</strong>ery, located <strong>in</strong> <strong>the</strong> state<strong>of</strong> Pernambuco and expected to start operation <strong>in</strong> 2011, toge<strong>the</strong>r with expansion <strong>of</strong> exist<strong>in</strong>g ref<strong>in</strong>eries.On a longer plann<strong>in</strong>g horizon, <strong>the</strong>re are plans to build two Premium Ref<strong>in</strong>eries that focus on produc<strong>in</strong>g premiumpetroleum products, <strong>in</strong> particular diesel fuel, and <strong>the</strong> basic petrochemical unit <strong>of</strong> <strong>the</strong> Rio de JaneiroPetrochemical Complex (Comperj). Premium Ref<strong>in</strong>ery I will be built <strong>in</strong> Maranhão with process<strong>in</strong>g capacity<strong>of</strong> 600,000 BOPD. The first phase is planned to beg<strong>in</strong> operation <strong>in</strong> 2013 and <strong>the</strong> second phase <strong>in</strong> 2015.Premium Ref<strong>in</strong>ery II will be built <strong>in</strong> Ceará with process<strong>in</strong>g capacity <strong>of</strong> 300,000 BOPD. First phase operationsare scheduled to beg<strong>in</strong> <strong>in</strong> 2014, and <strong>the</strong> second phase <strong>in</strong> 2016. Comperj will process 150,000 BOPD forproduction <strong>of</strong> raw materials for petrochemical plus small quantities <strong>of</strong> derivatives; <strong>the</strong> first phase is scheduledto beg<strong>in</strong> operations <strong>in</strong> late 2012 (Petrobras, 2009b). In addition, Petrobras has been <strong>in</strong>vest<strong>in</strong>g <strong>in</strong> <strong>the</strong>Guamaré <strong>in</strong>dustrial park <strong>in</strong> Rio Grande do Norte state, build<strong>in</strong>g a plant to produce gasol<strong>in</strong>e and improve <strong>the</strong>quality <strong>of</strong> exist<strong>in</strong>g derivatives (LPG, jet fuel and diesel). This will expand output to 80,000 BOPD <strong>in</strong> 2010, atwhich po<strong>in</strong>t <strong>the</strong> facility will be classified as a ref<strong>in</strong>ery (ESE, 2008b).Accord<strong>in</strong>g to <strong>the</strong> company’s bus<strong>in</strong>ess plan, Petrobras ref<strong>in</strong><strong>in</strong>g capacity <strong>in</strong> Brazil will reach 2.27 million BOPD<strong>in</strong> 2013. This will represent national self-sufficiency for diesel. Efforts will be made to br<strong>in</strong>g specificationsfor gasol<strong>in</strong>e and diesel <strong>in</strong>to l<strong>in</strong>e with <strong>in</strong>ternational standards, so facilitat<strong>in</strong>g exportation <strong>of</strong> <strong>the</strong> surplus. It isexpected that by 2012, all gasol<strong>in</strong>e produced <strong>in</strong> Brazil will have 50 ppm <strong>of</strong> sulfur.Expansion <strong>of</strong> Petrobras ref<strong>in</strong><strong>in</strong>g capacityTable 2Unit Capacity (thousands <strong>of</strong> BOPD) Start <strong>of</strong> Operation StateNor<strong>the</strong>ast Ref<strong>in</strong>ery 230 2011 PernambucoPremium Ref<strong>in</strong>ery I 600 2013* MaranhãoPremium Ref<strong>in</strong>ery II 300 2014* CearáComperj 150 2012 Rio de JaneiroGuamaré 80 2010 Rio Grande do NorteTotal 1360Source: Petrobras (annual report)
276 Ethanol and Bioelectricity <strong>Sugarcane</strong> <strong>in</strong> <strong>the</strong> <strong>Future</strong> <strong>of</strong> <strong>the</strong> <strong>Energy</strong> <strong>Matrix</strong>Given <strong>the</strong> current market structure, and <strong>the</strong> difference between oil prices <strong>in</strong> <strong>in</strong>ternational markets and <strong>the</strong>price <strong>of</strong> pr<strong>in</strong>cipal derivatives <strong>in</strong> <strong>the</strong> Brazilian domestic market, <strong>the</strong> ref<strong>in</strong><strong>in</strong>g sector is very unlikely to see <strong>the</strong>entry <strong>of</strong> any new players. This perception is confirmed by <strong>the</strong> facts. We would recall that <strong>in</strong> 1998 <strong>the</strong> ANPgranted permission for construction <strong>of</strong> Renor, a new ref<strong>in</strong>ery <strong>in</strong> <strong>the</strong> State <strong>of</strong> Ceará, but this never got <strong>of</strong>f<strong>the</strong> ground. Nor is <strong>the</strong>re room for small ref<strong>in</strong>eries: <strong>the</strong> Mangu<strong>in</strong>hos ref<strong>in</strong>ery is out <strong>of</strong> operation and <strong>the</strong>Ipiranga ref<strong>in</strong>ery was acquired <strong>in</strong> March 2007 by a consortium compris<strong>in</strong>g Petrobras, Braskem and GrupoUltra (Sousa, 2009b).3.2 Natural gasBrazilian natural gas consumption <strong>in</strong>creased from 7.73 billion m 3 to 18.15 billion m3 between 1995 and2007 (MME, 2008), correspond<strong>in</strong>g to average annual growth <strong>of</strong> 14.5% v . Thanks to this strong growth <strong>in</strong>consumption, <strong>the</strong> share <strong>of</strong> this fuel <strong>in</strong> <strong>the</strong> domestic energy matrix grew rapidly to reach 10.2% <strong>in</strong> 2008.Accord<strong>in</strong>g to <strong>the</strong> Brazilian Association <strong>of</strong> Piped Gas Distribution Companies (Abegás), sales by gas distributors<strong>in</strong> 2008 were 50 million m 3 per day. The most significant consum<strong>in</strong>g sectors were <strong>in</strong>dustry, electricitygeneration and vehicles, which accounted for 51.6%, 26.6% and 13.3% <strong>of</strong> sales, respectively.Some characteristics <strong>of</strong> <strong>the</strong> market for compressed natural gas for vehicles (CNG-V) should be noted.Natural gas consumption by automobiles was 6.63 million m 3 per day <strong>in</strong> 2008, correspond<strong>in</strong>g to a relativelysmall share <strong>of</strong> total sales by distributors (13.3%). Sales are highly concentrated <strong>in</strong> <strong>the</strong> state <strong>of</strong> Rio deJaneiro, which accounted for 43% <strong>of</strong> <strong>the</strong> national market. The fleet converted to use CNG-V <strong>in</strong> March 2009was 1,596,511 vehicles. This fleet rema<strong>in</strong>ed virtually stagnant <strong>in</strong> 2008 (Folha do GNV, 2009), thanks to apronounced slowdown <strong>in</strong> <strong>the</strong> rate <strong>of</strong> vehicle conversions due to <strong>the</strong> reduced attractiveness <strong>of</strong> CNG-V pricesfor consumers compared to gasol<strong>in</strong>e and hydrous ethanol, and <strong>the</strong> fear <strong>of</strong> a lack <strong>of</strong> natural gas for automobilesvi . Conversion rates rema<strong>in</strong>ed weak <strong>in</strong> 2009: just 2,726 vehicles were converted to natural gas <strong>in</strong> March2009. If this trend cont<strong>in</strong>ues, <strong>the</strong> natural gas fleet will gradually shr<strong>in</strong>k vii (Sousa, 2009a).Given <strong>the</strong> above-mentioned problems, CNG-V demand fell by 5.4% <strong>in</strong> 2008, <strong>in</strong> TPE (MME, 2009).3.3 Coal and its derivativesConsumption <strong>of</strong> steam coal <strong>in</strong> <strong>the</strong>rmoelectric plants fluctuated significantly <strong>in</strong> <strong>the</strong> period 1970-2007, butalways with an upward trend, while <strong>in</strong>dustrial consumption dropped sharply from 1987 to 1998, <strong>the</strong>n leveled<strong>of</strong>f. Cement was <strong>the</strong> <strong>in</strong>dustrial sector ma<strong>in</strong>ly responsible for <strong>the</strong> relatively high consumption <strong>of</strong> steamcoal <strong>in</strong> <strong>the</strong> eighties and n<strong>in</strong>eties, but this was replaced <strong>in</strong> <strong>the</strong> current decade by cheaper petroleum coke.Lead<strong>in</strong>g <strong>in</strong>dustrial steam coal consumers <strong>in</strong> 2007 were <strong>the</strong> chemicals sector, with 191,000 tonnes, and pulpand paper on 164,000 tonnes.
Ethanol <strong>in</strong> <strong>the</strong> Brazilian <strong>Energy</strong> <strong>Matrix</strong>277Conversion <strong>of</strong> coal <strong>in</strong>to metallurgical coke <strong>in</strong>creased substantially from 1970 to <strong>the</strong> mid-eighties, whenit virtually stabilized. Industrial consumption <strong>of</strong> metallurgical coal started <strong>in</strong> 1993, reach<strong>in</strong>g 4,596,000tonnes <strong>in</strong> 2007. Most <strong>of</strong> this 2007 consumption was by steel <strong>in</strong>dustry blast furnaces, which accountedfor 3,395,000 tonnes. O<strong>the</strong>r major consumers <strong>of</strong> metallurgical coal <strong>in</strong> 2007 were m<strong>in</strong><strong>in</strong>g and pelletiz<strong>in</strong>gsectors with 864,000 tonnes; non-ferrous metals with 161,000 tonnes, and cement with 48,000 tonnes.O<strong>the</strong>r <strong>in</strong>dustry sectors took 128,000 tonnes.Almost all <strong>of</strong> <strong>the</strong> coke produced from metallurgical coal is consumed <strong>in</strong> <strong>the</strong> pig iron and steel sector. Thisconsumption <strong>in</strong>creased significantly from <strong>the</strong> mid-1970s until almost <strong>the</strong> end <strong>of</strong> <strong>the</strong> 1980s, when <strong>the</strong> longtermtrend stabilized. One factor was coke’s partial substitution by pulverized coal as a blast furnace fuel.The pig iron and steel sector accounted for 94.1% <strong>of</strong> <strong>the</strong> total 9,734,000 tonnes <strong>of</strong> cok<strong>in</strong>g coal consumedby Brazilian <strong>in</strong>dustry <strong>in</strong> 2007, with non-ferrous metals tak<strong>in</strong>g 2.2%, iron-alloys 1.5%, m<strong>in</strong><strong>in</strong>g and pelletiz<strong>in</strong>g1.3%, and <strong>the</strong> cement <strong>in</strong>dustry <strong>the</strong> rema<strong>in</strong><strong>in</strong>g 0.9%.The pr<strong>in</strong>cipal use <strong>of</strong> coke oven gas has been to produce <strong>the</strong>rmal energy <strong>in</strong> steel mill processes outside <strong>of</strong><strong>the</strong> coke plants. There has been an <strong>in</strong>crease <strong>in</strong> <strong>the</strong> use <strong>of</strong> this gas to generate electricity at <strong>the</strong> steel mills(Bajay, 2009a).Of <strong>the</strong> three uses <strong>of</strong> coal tar, <strong>the</strong> dom<strong>in</strong>ant one <strong>in</strong> <strong>the</strong> period 1987 – 1995 was produc<strong>in</strong>g <strong>the</strong>rmal energy <strong>in</strong>steel mills. For <strong>the</strong> rest <strong>of</strong> <strong>the</strong> period through 2007, with <strong>the</strong> exception <strong>of</strong> 1977, it was used ma<strong>in</strong>ly as a rawmaterial. Coal tar has been little used as a fuel for auto-generation <strong>of</strong> electricity <strong>in</strong> steel mills (Bajay, 2009b).Accord<strong>in</strong>g to Brazil’s 2008/2017 Ten-Year Plan for <strong>Energy</strong> Expansion (PDE 2008/2017), new coal-fired powerplants total<strong>in</strong>g 6,249 MW are be<strong>in</strong>g evaluated for economic feasibility and environmental impact (EPE/MME, 2009b).The Ten-Year Plan proposes build<strong>in</strong>g 900 MW <strong>of</strong> <strong>the</strong>rmal generat<strong>in</strong>g capacity <strong>in</strong> <strong>the</strong> South <strong>of</strong> Brazil through2015, with Brazilian coal <strong>the</strong> natural fuel <strong>of</strong> choice to meet this need.The 2030 National <strong>Energy</strong> Plan (PNE 2030) contemplates build<strong>in</strong>g 1,100 MW <strong>of</strong> new coal-fired plantsthrough 2015. Long-term plann<strong>in</strong>g for 2016 – 2030 assumes that Brazil could feasibly build up to 9,000MW <strong>of</strong> coal-fired plants, <strong>in</strong>clud<strong>in</strong>g 5,000 MW burn<strong>in</strong>g domestic coal <strong>in</strong> <strong>the</strong> South region. The rema<strong>in</strong><strong>in</strong>g4,000 MW <strong>of</strong> plants would burn imported coal, and <strong>of</strong> <strong>the</strong>se 2,000 MW could be located <strong>in</strong> <strong>the</strong> Sou<strong>the</strong>astand 2,000 MW <strong>in</strong> <strong>the</strong> Nor<strong>the</strong>ast. Start<strong>in</strong>g from this 9,000 MW total capacity <strong>of</strong> “candidate” coal-firedplants, <strong>the</strong> optimization model for electricity supply expansion adopted <strong>in</strong> PNE 2030 viii selected 3,500 MWto be built between 2016 and 2030, located only <strong>the</strong> South and consum<strong>in</strong>g domestic coal.Table 3 reflects <strong>the</strong> basel<strong>in</strong>e scenario used <strong>in</strong> PNE 2030. It breaks down demand projections between steamcoal and metallurgical coal; <strong>the</strong> use <strong>of</strong> coal for conversion <strong>in</strong>to coke or electricity; and its f<strong>in</strong>al consumptionas an energy source. This table clearly shows <strong>the</strong> strong <strong>in</strong>crease <strong>in</strong> total coal consumption between 2020and 2030, due ma<strong>in</strong>ly to its <strong>in</strong>creased conversion <strong>in</strong>to electricity.
278 Ethanol and Bioelectricity <strong>Sugarcane</strong> <strong>in</strong> <strong>the</strong> <strong>Future</strong> <strong>of</strong> <strong>the</strong> <strong>Energy</strong> <strong>Matrix</strong>Table 4 also reflects <strong>the</strong> basel<strong>in</strong>e scenario used <strong>in</strong> PNE 2030. It shows <strong>the</strong> projected supply <strong>of</strong> coal, disaggregatedfor steam coal and metallurgical coal, highlight<strong>in</strong>g <strong>the</strong> current and future importance <strong>of</strong> metallurgicalcoal imports. It also shows a substantial <strong>in</strong>crease <strong>in</strong> domestic steam coal production from 2020, based on <strong>the</strong>assumption that Brazil’s average coal reserves will <strong>in</strong>crease by 40% from 2015, with substantial <strong>in</strong>vestments tobuild new coal-fired power plants <strong>in</strong> <strong>the</strong> period 2020-2030.3.4 UraniumUranium consumption <strong>in</strong> Brazil has been cyclical, with much higher values seen from 1997 onwards due to<strong>the</strong> startup <strong>in</strong> 2000 <strong>of</strong> Angra II, <strong>the</strong> country’s second nuclear power plant (EPE/MME, 2008).Brazil currently has two nuclear power stations, Angra I and Angra II, with <strong>in</strong>stalled capacities <strong>of</strong> 657 MWand 1,350 MW respectively. Both are Pressurized Water Reactors (PWR). The first has been operat<strong>in</strong>g s<strong>in</strong>ce1982 and <strong>the</strong> second s<strong>in</strong>ce 2000. They are located next to each o<strong>the</strong>r on <strong>the</strong> Itaorna beach <strong>in</strong> Angra dosReis, Rio de Janeiro state, and are operated by Eletronuclear, a subsidiary <strong>of</strong> Eletrobrás. Both companies arestate owned and l<strong>in</strong>ked to <strong>the</strong> M<strong>in</strong>istry <strong>of</strong> M<strong>in</strong>es and <strong>Energy</strong>.The PDE 2008/2017 contemplates <strong>the</strong> construction by Eletronuclear <strong>of</strong> one more nuclear plant <strong>in</strong> <strong>the</strong> forecastperiod. This is Angra III, a 1,350 MW PWR station similar to Angra II and due to come on stream <strong>in</strong>November 2014 beside <strong>the</strong> two exist<strong>in</strong>g plants.In <strong>the</strong> 2030 PNE, <strong>the</strong> EPE forecasts <strong>the</strong> Angra III nuclear plant start<strong>in</strong>g operation by 2015. Among <strong>the</strong> variousalternatives for expand<strong>in</strong>g electricity supply <strong>in</strong> <strong>the</strong> period 2016-2030, <strong>the</strong> EPE considered <strong>the</strong> possibleaddition <strong>of</strong> a fur<strong>the</strong>r 6,000 MW <strong>of</strong> new nuclear capacity, located 3,000 MW <strong>in</strong> <strong>the</strong> Sou<strong>the</strong>ast and 3,000MW <strong>in</strong> <strong>the</strong> Nor<strong>the</strong>ast. Plants were assumed to have <strong>in</strong>stalled capacity <strong>of</strong> 1,000 MW each, a load factor <strong>of</strong>85% and a lifespan <strong>of</strong> 40 years.Based on <strong>the</strong> projected demand associated with <strong>the</strong> reference scenario <strong>in</strong> <strong>the</strong> 2030 PNE, <strong>the</strong> MELP model(Portuguese acronym for Long Term Expansion Model) for optimization <strong>of</strong> electricity supply expansion<strong>in</strong>dicated construction <strong>of</strong> 4,000 MW <strong>of</strong> new nuclear plants, divided equally between <strong>the</strong> Sou<strong>the</strong>ast andNor<strong>the</strong>ast. The first <strong>of</strong> <strong>the</strong>se plants should be operational <strong>in</strong> 2019, located <strong>in</strong> <strong>the</strong> Nor<strong>the</strong>ast between Recifeand Salvador. The two new nuclear plants <strong>in</strong> <strong>the</strong> Sou<strong>the</strong>ast should be located between Rio de Janeiro andEspírito Santo. Under this demand scenario Brazil’s total nuclear capacity would generate 15 TWh <strong>in</strong> 2010,30.5 TWh <strong>in</strong> 2020 and 51.6 TWh <strong>in</strong> 2030 (EPE/MME, 2007).EPE projections for <strong>the</strong> production and importation <strong>of</strong> uranium <strong>in</strong> 2010, 2020 and 2030, associated with<strong>the</strong> basel<strong>in</strong>e scenario <strong>of</strong> PNE 2030, are shown <strong>in</strong> Table 5. Note that, accord<strong>in</strong>g to <strong>the</strong>se projections, <strong>the</strong><strong>in</strong>creased domestic production should elim<strong>in</strong>ate imports by 2030.
Ethanol <strong>in</strong> <strong>the</strong> Brazilian <strong>Energy</strong> <strong>Matrix</strong>2793.5 Liquid bi<strong>of</strong>uelsBrazil liquid bi<strong>of</strong>uels markets exhibit unequal degrees <strong>of</strong> maturity. Regular use <strong>of</strong> ethanol blended withgasol<strong>in</strong>e began <strong>in</strong> <strong>the</strong> first decades <strong>of</strong> <strong>the</strong> 20 th century, but biodiesel should be seen as an <strong>in</strong>novative product,on <strong>the</strong> market only s<strong>in</strong>ce 2003. Bi<strong>of</strong>uels accounted for 16.5% <strong>of</strong> energy demand <strong>in</strong> <strong>the</strong> transportationsector <strong>in</strong> 2008 (EPE/MME, 2009a), and enjoy good prospects for expansion <strong>in</strong> com<strong>in</strong>g years.3.5.1 EthanolVehicles with flex-fuel eng<strong>in</strong>es were <strong>in</strong>troduced <strong>in</strong>to <strong>the</strong> Brazilian market <strong>in</strong> 2003 and have accounted for <strong>the</strong>majority <strong>of</strong> light vehicle sales <strong>in</strong> recent years. Reflect<strong>in</strong>g this grow<strong>in</strong>g importance, ethanol consumption has<strong>in</strong>creased <strong>in</strong> both absolute and relative terms, displac<strong>in</strong>g part <strong>of</strong> <strong>the</strong> consumption <strong>of</strong> gasol<strong>in</strong>e and anhydrousethanol. Accord<strong>in</strong>g to figures from <strong>the</strong> National <strong>Energy</strong> Balance, 13.3 million m 3 <strong>of</strong> hydrous ethanol and6.3 million m 3 <strong>of</strong> anhydrous ethanol were consumed <strong>in</strong> 2008, with average annual variations <strong>of</strong> +14.3% and-3.2% respectively between 2003 and 2008 (EPE/MME, 2009a).Projected demand for steam coal and metallurgical coal <strong>in</strong> BrazilIn 10 3 tonnes, for transformation and for f<strong>in</strong>al consumption, <strong>in</strong> <strong>the</strong> “surf<strong>in</strong>g <strong>the</strong> swell’’ scenario (see section 3.6 below)Table 3Steam coalMetallurgical coalTotal2010 2020 2030Transformation 8,653 10,397 20,918F<strong>in</strong>al consumption 1,082 1,657 2,311Transformation 10,456 13,818 15,380F<strong>in</strong>al consumption 6,034 9,216 11,804Transformation 19,109 24,215 36,298F<strong>in</strong>al consumption 7,116 10,874 14,115Source: EPE/MME, 2007.Estimated Supply <strong>of</strong> M<strong>in</strong>eral Coal In 10 3 t, <strong>in</strong> Brazil’s National <strong>Energy</strong> Plan <strong>of</strong> 2030Table 42010 2020 2030Steam coal 9,735 12,055 23,228ProductionMetallurgical coal 210 210 210Total 9,945 12,265 23,438Imports Metallurgical coal 16,281 22,824 26,974Source: EPE/MME, 2007
280 Ethanol and Bioelectricity <strong>Sugarcane</strong> <strong>in</strong> <strong>the</strong> <strong>Future</strong> <strong>of</strong> <strong>the</strong> <strong>Energy</strong> <strong>Matrix</strong>In <strong>the</strong> most recent harvest (2008/2009) Brazil produced 572 million tonnes <strong>of</strong> sugarcane, part <strong>of</strong> which wentto produce a record 26.6 billion liters <strong>of</strong> ethanol. As shown <strong>in</strong> Table 6, <strong>the</strong> production <strong>of</strong> hydrous ethanolexceeded <strong>the</strong> production <strong>of</strong> anhydrous ethanol dur<strong>in</strong>g recent years, a consequence <strong>of</strong> <strong>the</strong> demand trendsmentioned above, with significant expansion <strong>in</strong> both total output and <strong>the</strong> volume exported.The sugar and ethanol sector has 418 production plants, <strong>of</strong> which 155 produce ethanol, 15 produce sugar,and 248 produce both sugar and ethanol. These adequately meet domestic demand and generate grow<strong>in</strong>gsurpluses for export. Several projects are underway to <strong>in</strong>crease <strong>the</strong> <strong>in</strong>stalled capacity for produc<strong>in</strong>g ethanolfrom sugarcane. Estimates by <strong>the</strong> productive sector made prior to <strong>the</strong> f<strong>in</strong>ancial crisis <strong>in</strong>dicated <strong>in</strong>vestments<strong>of</strong> US$33 billion through 2012, divided US$23 billion <strong>in</strong> <strong>the</strong> <strong>in</strong>dustrial area and US$10 billion <strong>in</strong> agriculture(UNICA, 2008).Look<strong>in</strong>g ahead, Meira Filho and Macedo (2009) used demand projections from five <strong>in</strong>stitutions (MAPA,EPE, IE-UFRJ, UNICA and Cepea) to <strong>in</strong>dicate probable demand by 2020 for 45 million m 3 <strong>of</strong> hydrous ethanoland five million m3 <strong>of</strong> anhydrous ethanol, a total volume 155% higher than <strong>in</strong> 2008 and imply<strong>in</strong>g averageannual growth <strong>of</strong> 12.9%.These projections are subject to a degree <strong>of</strong> uncerta<strong>in</strong>ty related to activity level and <strong>in</strong> particular <strong>the</strong> pr<strong>of</strong>ile<strong>of</strong> <strong>the</strong> vehicle fleet, which will <strong>in</strong>corporate new technologies such as electric and hybrid vehicles. Never<strong>the</strong>less<strong>the</strong> projections seem reasonable, bear<strong>in</strong>g <strong>in</strong> m<strong>in</strong>d <strong>the</strong> one-decade horizon and particularly consider<strong>in</strong>gthat <strong>the</strong> Brazilian vehicle fleet could grow from its current estimated 24 million vehicles, <strong>of</strong> which are 41%flex-fuel, to around 40 million vehicles, with 75% <strong>of</strong> <strong>the</strong>m flex-fuel (EPE/MME, 2007).Table 5Projected supply <strong>of</strong> U3O8, <strong>in</strong> tonnes, <strong>in</strong> Brazil’sNational <strong>Energy</strong> Plan (PNE) for 20302010 2020 2030Production 151 844 1,646Imports 304 127 0Source: EPE/MME, 2007.Table 6 Ethanol production <strong>in</strong> Brazil In thousand m 3Harvest 2004-05 2005-06 2006-07 2007-08 2008-09Anhydrous fuel ethanol 7,689 7,352 5,128 6,354 6,406Hydrous fuel ethanol 5,118 5,973 7,696 10,964 13,821Exported ethanol 2,631 2,526 3,928 3,518 5,228Total ethanol for o<strong>the</strong>r uses 703 708 729 686 1,166Total 16,141 16,559 17,481 21,522 26,621Source: MAPA, 2009.
Ethanol <strong>in</strong> <strong>the</strong> Brazilian <strong>Energy</strong> <strong>Matrix</strong>2813.5.2 BiodieselThe production <strong>of</strong> biodiesel has expanded rapidly, thanks to a market that is guaranteed by <strong>the</strong> requirementunder Law 11.097/2005 for a blend <strong>of</strong> biodiesel – 5% from 2010 – <strong>in</strong> all petroleum diesel sold <strong>in</strong> Brazil.Estimates suggest that annual biodiesel production capacity exceeds three billion liters, aga<strong>in</strong>st consumption<strong>of</strong> around 1.2 billion liters <strong>in</strong> 2008, produced ma<strong>in</strong>ly from soy oil, complemented by animal fats andby lesser amounts <strong>of</strong> various o<strong>the</strong>r oilseeds (Nogueira, 2009).Given that biodiesel is <strong>in</strong>tended only for blend<strong>in</strong>g with petroleum diesel oil, <strong>the</strong> estimate <strong>of</strong> its future demand<strong>in</strong> <strong>the</strong> Brazilian market is l<strong>in</strong>ked to projections <strong>of</strong> <strong>the</strong> demand for diesel and prospects for alteration<strong>in</strong> <strong>the</strong> level <strong>of</strong> <strong>the</strong> biodiesel blend.To assess <strong>the</strong> growth <strong>of</strong> <strong>the</strong> diesel market, we used <strong>the</strong> estimate <strong>of</strong> <strong>the</strong> basel<strong>in</strong>e scenario presented <strong>in</strong> <strong>the</strong>National <strong>Energy</strong> Plan. This scenario assumes Brazil will enjoy stable economic expansion with progressive trade<strong>in</strong>tegration among markets, a cont<strong>in</strong>u<strong>in</strong>g process <strong>of</strong> domestic adjustment, some <strong>in</strong>crease <strong>in</strong> purchas<strong>in</strong>g powerand expected annual average GDP growth <strong>of</strong> 4.3% <strong>in</strong> <strong>the</strong> period 2005 to 2030. In this context, <strong>the</strong> demandfor diesel, whe<strong>the</strong>r or not it <strong>in</strong>cludes biodiesel, is expected to expand significantly. Ma<strong>in</strong> sectoral drivers aretransportation and agriculture, with <strong>the</strong>ir participation <strong>in</strong> f<strong>in</strong>al national energy demand grow<strong>in</strong>g from 17% <strong>in</strong>2005 to 19% <strong>in</strong> 2030, when domestic consumption is expected to reach 82.8 million m 3 (EPE/MME, 2007).This study <strong>in</strong>dicates diesel demand <strong>in</strong> 2020 <strong>of</strong> 82.8 million m 3 . Based on this number, and assum<strong>in</strong>g a 5%blend, demand for biodiesel <strong>in</strong> that year could be 3.08 million m3, correspond<strong>in</strong>g to <strong>the</strong> current <strong>in</strong>stalledproduction capacity. O<strong>the</strong>r studies could be undertaken, tak<strong>in</strong>g <strong>in</strong>to account <strong>the</strong> segmentation <strong>of</strong> <strong>the</strong>biodiesel market <strong>in</strong> farm<strong>in</strong>g, electricity generation <strong>in</strong> stand-alone systems and <strong>the</strong> metropolitan marketfor diesel, toge<strong>the</strong>r with <strong>the</strong> possible export sales <strong>of</strong> biodiesel, although current price structures are notattractive (Nogueira, 2009).3.6 ElectricityElectricity consumption <strong>in</strong> Brazil <strong>in</strong> 2008 was 428.7 TWh, 4% up on 2007 when consumption was 412.1TWh (EPE/MME, 2009a).The average growth rate <strong>of</strong> electricity consumption <strong>in</strong> Brazil between 1980 and 2005 was 4% per year. If<strong>the</strong> 1970s are added <strong>in</strong>, when <strong>the</strong>re was strong growth <strong>in</strong> both Gross Domestic Product (GDP) and electricityconsumption, <strong>the</strong> average annual rate jumps to 6.2% (EPE/MME, 2007).The National <strong>Energy</strong> Plan 2030 (PNE 2030) def<strong>in</strong>es four alternative scenarios for economic growth <strong>in</strong> Brazilthrough 2030, comb<strong>in</strong>ed with three scenarios for <strong>the</strong> global economy (EPE/MME, 2007). The four nationalsett<strong>in</strong>gs are called “on <strong>the</strong> crest <strong>of</strong> <strong>the</strong> wave”, “surf<strong>in</strong>g <strong>the</strong> swell”, “paddl<strong>in</strong>g” and “shipwreck”, while <strong>the</strong>three <strong>in</strong>ternational ones are named “one world”, “archipelago” and “island” (Bajay, 2009b ).
282 Ethanol and Bioelectricity <strong>Sugarcane</strong> <strong>in</strong> <strong>the</strong> <strong>Future</strong> <strong>of</strong> <strong>the</strong> <strong>Energy</strong> <strong>Matrix</strong>“Surf<strong>in</strong>g <strong>the</strong> swell” was adopted as reference scenario <strong>in</strong> <strong>the</strong> 2030 PNE and served as <strong>the</strong> basis for project<strong>in</strong>g<strong>the</strong> expansion <strong>of</strong> supply <strong>of</strong> various energy sources <strong>in</strong> general, and specifically <strong>the</strong> generat<strong>in</strong>g capacity<strong>of</strong> different types <strong>of</strong> power plants. Average GDP growth under this scenario is 4.1% per year, as is averagegrowth <strong>in</strong> electricity demand. This is slightly higher than <strong>the</strong> 4% per year growth <strong>of</strong> consumption recorded<strong>in</strong> <strong>the</strong> period 1980-2005.The 2008-2017 Ten-Year Plan for <strong>Energy</strong> Expansion (PDE 2008-2017) adopted a basel<strong>in</strong>e scenario that haseconomic growth <strong>of</strong> around 4% <strong>in</strong> 2009 and 5% per year from 2010 to 2017, plus population growth <strong>of</strong>1.2% through <strong>the</strong> horizon <strong>of</strong> <strong>the</strong> study. Based on <strong>the</strong>se assumptions, growth <strong>in</strong> electricity consumptionwould be 5.4% per year, <strong>in</strong>clud<strong>in</strong>g self-production.Table 7 shows <strong>the</strong> contracted capacities for different types <strong>of</strong> power plants at <strong>the</strong> various auctions for newenergy held until 2008, toge<strong>the</strong>r with <strong>the</strong> prices paid.In its reference scenario <strong>the</strong> 2008-2017 PDE forecasts vigorous expansion <strong>of</strong> <strong>in</strong>stalled generat<strong>in</strong>g capacity<strong>in</strong> Brazil, add<strong>in</strong>g 55,055 MW. Table 8 shows this expansion by type <strong>of</strong> power plant by 2017.There is a decrease <strong>in</strong> <strong>the</strong> share <strong>of</strong> hydropower plants, from 81.9% <strong>in</strong> 2008 to 70.9% <strong>in</strong> 2017. This is <strong>of</strong>fsetby <strong>in</strong>creases <strong>in</strong> <strong>the</strong> participation <strong>of</strong> o<strong>the</strong>r types <strong>of</strong> plants, especially <strong>the</strong> substantial <strong>in</strong>crease <strong>in</strong> <strong>the</strong> participation<strong>of</strong> <strong>the</strong>rmoelectric stations, ris<strong>in</strong>g from just 0.9% <strong>in</strong> 2008 to 5.7% <strong>in</strong> 2017. This sw<strong>in</strong>g towards a “dirtier”energy matrix <strong>in</strong> Brazil has been <strong>the</strong> target <strong>of</strong> strong criticism from various segments <strong>of</strong> society, ever s<strong>in</strong>cevarious oil-fired <strong>the</strong>rmoelectric power plants won <strong>the</strong> auctions for “new energy” <strong>in</strong> recent years.These auction results were certa<strong>in</strong>ly not foreseen <strong>in</strong> <strong>the</strong> 2030 PNE, published <strong>in</strong> 2007. Table 9 shows<strong>the</strong> imag<strong>in</strong>ed trend under this plan for <strong>the</strong> <strong>in</strong>stalled capacity <strong>of</strong> various types <strong>of</strong> electricity generationstations.4 Reserves/resources and production potentialThis section provides key elements for <strong>the</strong> discussion <strong>of</strong> possibilities for develop<strong>in</strong>g <strong>the</strong> domestic energymatrix. It presents a syn<strong>the</strong>sis <strong>of</strong> <strong>the</strong> availability <strong>of</strong> primary energy sources that should be harnessed for <strong>the</strong>production <strong>of</strong> different vectors that can be used to meet <strong>the</strong> above-mentioned needs.4.1 Petroleum and its derivativesOn December 31, 2008, Brazil’s proven oil reserves stood at 12.64 billion barrels, correspond<strong>in</strong>g to a reserves/productionratio equal to 19 years ix (ANP, 2009). At that time, Petrobras’ proven oil reserves were94.2% <strong>of</strong> proven reserves <strong>in</strong> <strong>the</strong> country, and <strong>the</strong> company’s rate <strong>of</strong> reserves replenishment <strong>in</strong> 2008 was123% (Petrobras, 2009c).
Ethanol <strong>in</strong> <strong>the</strong> Brazilian <strong>Energy</strong> <strong>Matrix</strong>283Contracted capacity and prices paid for types <strong>of</strong> power plants and fuel at auctions for new energyIn MW and R$/MWhTable 7A-5200516/12/05A-3200629/6/06A-5200610/10/06FA200718/6/06A-3200726/7/06A-5200716/10/07SA200719/5/08JI200819/5/08A-3200817/9/08A-5200830/9/08Total %Hydroelectric 1,006 1,028 569 46 715 1.443 1.383 121 6,311 37.3%Biomass 224 60 61 140 35 520 3.1%Coal 546 930 276 1,752 10.4%Natural gas 1,264 270 200 1,734 10.3%Liquefiednatural gas351 265 703 1,319 7.8%Process gas 200 200 1.2%Biogas 10 10 0.1%Diesel oil 244 102 69 415 2.5%Fuel oil 212 5 1,304 316 811 1,990 4,638 27.4%Total 3,284 1,682 1,104 186 1,304 2,312 1,443 1,383 1,076 3,125 16,899(R$/MWh)Average price 128.95 128.90 137.32 134.67 128.33 78.87 71.37 128.42 141.78Hydroelectric 120.86 134.99 129.14 78.87 71.37 98.98Thermal 137.44 138.85 134.67 128.37 128.42 145.23FA= alternative sources; SA = Santo Antonio; JI = JirauSource: EPE.Expansion <strong>of</strong> Brazilian generat<strong>in</strong>g capacity, by type <strong>of</strong> power plantIn MW; estimates <strong>in</strong> <strong>the</strong> PDE 2008-2017; <strong>in</strong>stalled capacity each DecemberTable 8Sources 2008 2009 2010 2011 2012 2013 2014 2015 2016 2017Hydro a 84,374 86,504 89,592 91,480 92,495 95,370 98,231 103,628 110,970 117,506Nuclear 2,007 2,007 2,007 2,007 2,007 2,007 3,357 3,357 3,357 3,357Oil b 1,984 3,807 5,713 7,153 7,397 10,463 10,463 10,463 10,463 10,463Natural gas 8,237 8,237 8,453 8,948 10,527 12,204 12,204 12,204 12,204 12,204Coal 1,415 1,415 1,765 2,465 2,815 3,175 3,175 3,175 3,175 3,175AlternativesourcescProcess gas andsteamIndicated <strong>the</strong>rmalplant1,256 2,682 5,420 5,479 5,479 5,593 5,593 5,913 6,233 6,233469 959 959 959 959 959 959 959 959 959- - - - - - - 900 900 900Total 99.742 105.611 113.909 118.491 121.679 129.771 133.982 140.599 148.261 154.797aIncludes small hydro; b fuel oil and diesel; c biomass and w<strong>in</strong>d. Source: EPE/MME 2009b.
28 4 Ethanol and Bioelectricity <strong>Sugarcane</strong> <strong>in</strong> <strong>the</strong> <strong>Future</strong> <strong>of</strong> <strong>the</strong> <strong>Energy</strong> <strong>Matrix</strong>Proven domestic oil reserves could double thanks to <strong>the</strong> announced recoverable volumes <strong>in</strong> <strong>the</strong> sub-salt<strong>of</strong>fshore fields. Announced sub-salt reserves range from eight to 14 billion barrels, distributed as follows:five to eight billion barrels <strong>in</strong> <strong>the</strong> Tupi field, three to four billion <strong>in</strong> Iara, and 1.5 billion barrels <strong>in</strong> Parquedas Baleias. However, <strong>the</strong>re are strong <strong>in</strong>dications that <strong>the</strong> aforementioned reserves are even greater. Thisis because <strong>the</strong> sub-salt area so far granted for prospection (41,000 sq km) corresponds to just 38% <strong>of</strong> <strong>the</strong>total sub-salt area. Follow<strong>in</strong>g this logic, <strong>the</strong> director general <strong>of</strong> <strong>the</strong> National Petroleum, Natural Gas andBi<strong>of</strong>uels Agency (ANP), dur<strong>in</strong>g a presentation at a jo<strong>in</strong>t public hear<strong>in</strong>g by <strong>the</strong> M<strong>in</strong>es and <strong>Energy</strong> Committeeand <strong>the</strong> Economic Development, Industry and Commerce Committee <strong>of</strong> <strong>the</strong> House <strong>of</strong> Representatives heldon May 13, 2009, spoke <strong>of</strong> expectations that proven reserves could hit 50 billion barrels thanks to <strong>the</strong> subsaltfields (Sousa, 2009b).4.2 Natural gasOn December 31, 2008, Brazil’s proven reserves <strong>of</strong> natural gas stood at 364.24 billion m 3 (ANP, 2009), with63% <strong>of</strong> <strong>the</strong> volume be<strong>in</strong>g natural gas associated with oil. This means that <strong>the</strong> bulk <strong>of</strong> future natural gas productionwill cont<strong>in</strong>ue to depend on oil production. The share <strong>of</strong> Petrobras <strong>in</strong> this volume was 92.7% (337.62billion m 3 ). The reserves/production ratio <strong>in</strong> December 2008 was 17 years, as shown <strong>in</strong> Table 10.Tabela 9Predicted growth <strong>in</strong> <strong>the</strong> <strong>in</strong>stalled capacity <strong>of</strong> various types <strong>of</strong> power plants <strong>in</strong> Brazil,accord<strong>in</strong>g to <strong>the</strong> 2030 PNE. In MWInstalled capacity <strong>in</strong>IncreaseSource2020 2030 2005-2030 2015-2030Hydroelectric 116,100 156,300 87,700 57,300Large 1 115,100 156,300 87,700 57,300Thermal 26,897 39,897 22,945 15,500Natural Gas 14,035 21,035 12,300 8,000Nuclear 4,347 7,347 5,345 4,000Coal 2 3,015 6,015 4,600 3,500O<strong>the</strong>rs 3 5,500 5,500 700 -Alternatives 8,783 20,322 19,468 15,350Small hydro 3,330 7,769 7,000 6,000W<strong>in</strong>d 2,282 4,682 4,653 3,300<strong>Sugarcane</strong> biomass 2,971 6,571 6,515 4,750Urban waste 200 1,300 1,300 1,300Imports 8,400 8,400 - -Total 160,180 224,919 130,113 88,1501Includes b<strong>in</strong>ational power plants.2Refers only to domestic coal; no expansion <strong>of</strong> imported coal.3Expansion after 2015 is not verysignificant, numerically, because it refers to rema<strong>in</strong><strong>in</strong>g stand-alone systems (0.2% <strong>of</strong> national consumption).Source: EPE/MME, 2007.
Ethanol <strong>in</strong> <strong>the</strong> Brazilian <strong>Energy</strong> <strong>Matrix</strong>285This does not mean that natural gas will run out <strong>in</strong> 17 years, because new discoveries are be<strong>in</strong>g made. Pro<strong>of</strong><strong>of</strong> this is <strong>the</strong> fact that <strong>the</strong> rate <strong>of</strong> growth <strong>of</strong> proven natural gas reserves <strong>in</strong> <strong>the</strong> period 1997 to 2007 was 4.8%per year, even with <strong>the</strong> <strong>in</strong>crease <strong>in</strong> production seen dur<strong>in</strong>g this period.Past performance is not <strong>the</strong> only reason for be<strong>in</strong>g optimistic about a significant <strong>in</strong>crease <strong>in</strong> proven reserves<strong>of</strong> natural gas <strong>in</strong> <strong>the</strong> medium term. The announcement <strong>of</strong> large discoveries <strong>of</strong> recoverable hydrocarbons(around eight to 14 billion barrels <strong>of</strong> oil) x <strong>in</strong> <strong>the</strong> sub-salt area is ano<strong>the</strong>r <strong>in</strong>dication (Sousa, 2009a), despite<strong>the</strong> difficult logistics <strong>of</strong> produc<strong>in</strong>g associated natural gas <strong>in</strong> <strong>the</strong> sub-salt fields. Problems <strong>in</strong>clude highconcentrations <strong>of</strong> CO 2, pipel<strong>in</strong>es greater than 18” <strong>in</strong> water depths <strong>of</strong> 2,200 meters, and wells ly<strong>in</strong>g about300 km from <strong>the</strong> coast.4.3 Coal and its derivativesBrazil’s identified and measured coal reserves at December 31 st , 2007 were 10,084 10 6 tonnes. On <strong>the</strong>same date, <strong>the</strong> <strong>in</strong>ferred reserves were 22,240 10 6 tonnes, giv<strong>in</strong>g total reserves <strong>of</strong> 32,324 10 6 tonnes xi , correspond<strong>in</strong>gto 2,752,932 tonnes <strong>of</strong> petroleum equivalent (TPE). Of <strong>the</strong> total reserves, 27,175 10 6 tonnes(84%) were steam coal and just 5,149 10 6 tonnes were metallurgical coal. Total known reserves <strong>of</strong> peat <strong>in</strong>Brazil on <strong>the</strong> same date were 487 10 6 tonnes (EPE/MME, 2008a).Brazil has <strong>the</strong> 10 th largest coal reserves <strong>in</strong> <strong>the</strong> world (EPE/MME, 2007).M<strong>in</strong>eral prospect<strong>in</strong>g studies for coal have been at a virtual halt <strong>in</strong> Brazil for <strong>the</strong> past 20 years. Evidence <strong>of</strong> this isthat <strong>the</strong> volume <strong>of</strong> total reserves has been steady at around 32 billion tonnes s<strong>in</strong>ce 1985 (EPE/MME, 2007).Growth <strong>of</strong> natural gas reservesTable 10Proven reserves (P/R)(<strong>in</strong> millions <strong>of</strong> m 3 )2000 2001 2002 2003 2004 2005 2006 2007 2008Reserves 216,574 219,692 244,548 327,673 322,485 306,395 347,903 365,688 364,236P/R (years) 21 20 20 26 24 21 24 25 17Land 78,597 77,009 76,070 76,597 73,761 71,752 71,462 68,131 66,305BrazilOffshore 137,977 142,683 168,477 251,075 248,724 234,642 276,441 297,558 297,931AssociatedgasNonassociatedgas157,237 157,550 173,969 178,411 182,195 188,914 209,022 217,764 229,20959,337 62,143 70,578 149,262 140,290 117,482 138,881 147,925 135,027Note: Data for proven reserves <strong>of</strong> natural gas are updated accord<strong>in</strong>g to <strong>the</strong> ANP Super<strong>in</strong>tendency <strong>of</strong> Production Development.Source: ANP, January 2009.
286 Ethanol and Bioelectricity <strong>Sugarcane</strong> <strong>in</strong> <strong>the</strong> <strong>Future</strong> <strong>of</strong> <strong>the</strong> <strong>Energy</strong> <strong>Matrix</strong>Brazilian coal reserves are located ma<strong>in</strong>ly <strong>in</strong> Rio Grande do Sul, where most <strong>of</strong> <strong>the</strong> m<strong>in</strong><strong>in</strong>g is open-cast.There are also significant xii coal reserves <strong>in</strong> Santa Catar<strong>in</strong>a, where most m<strong>in</strong>es are underground, and somesmall reserves <strong>in</strong> Paraná.4.4 UraniumBrazil’s total uranium reserves as <strong>of</strong> 1997 xiii are 309,370 tonnes <strong>of</strong> U 3O 8, equal to 1,254,681 TPE xiv . Of <strong>the</strong>total, 177,500 tonnes are identified and measured reserves, while 131,870 tonnes are <strong>in</strong>ferred reserves(EPE/MME, 2008a). Brazil has <strong>the</strong> sixth largest uranium reserves <strong>in</strong> <strong>the</strong> world (Mongelli, 2006).It should be noted that 57% <strong>of</strong> <strong>the</strong>se reserves are associated with costs below US$80/kgU, mean<strong>in</strong>g that<strong>the</strong>y are competitive by <strong>in</strong>ternational standards, and only 25% <strong>of</strong> <strong>the</strong> country has been surveyed for uraniumso far (EPE/MME, 2007).4.5 Liquid bi<strong>of</strong>uelsThe potential for production <strong>of</strong> bi<strong>of</strong>uels, and <strong>in</strong> particular ethanol and biodiesel, is associated with <strong>the</strong>availability <strong>of</strong> <strong>the</strong> natural resources needed for <strong>the</strong>ir efficient and susta<strong>in</strong>able production. In <strong>the</strong> case <strong>of</strong>Brazil and most humid tropical countries, <strong>the</strong>re is a significant available area <strong>of</strong> vacant or underutilized agriculturalland. Assum<strong>in</strong>g <strong>the</strong> adoption <strong>of</strong> <strong>the</strong> best available technology paths, bi<strong>of</strong>uel production capacityfar exceeds current demand expectations.Brazil has a surface area <strong>of</strong> 851.4 million hectares, much <strong>of</strong> it covered by tropical forests. Based on <strong>the</strong>results <strong>of</strong> <strong>the</strong> 2006 Agricultural Census, <strong>the</strong> total area <strong>of</strong> rural properties was 354.8 million hectares represent<strong>in</strong>g42% <strong>of</strong> national territory exclud<strong>in</strong>g protected areas, unsuitable areas, lakes and rivers, and <strong>the</strong>legally-def<strong>in</strong>ed reserves <strong>of</strong> native forests and o<strong>the</strong>r biomes. These rural properties are dedicated to naturaland planted pastures, native and planted forests and perennial and annual crops. Brazilian arable farm<strong>in</strong>ggrew 83.5% between 1995 and 2006 to occupy 76.7 million hectares, about 9% <strong>of</strong> national territory.As shown <strong>in</strong> Figure 5, this growth occurred ma<strong>in</strong>ly <strong>in</strong> areas that were unused, or rest<strong>in</strong>g, and to a lesserdegree <strong>in</strong> some pastureland. This process <strong>of</strong> agricultural expansion has been occurr<strong>in</strong>g <strong>in</strong> a systematic ways<strong>in</strong>ce <strong>the</strong> 1970s, so that <strong>the</strong> ratio <strong>of</strong> pastureland to crops was reduced from 4.5 <strong>in</strong> 1970 to 2.2 <strong>in</strong> 2006(Nogueira, 2009).The <strong>Sugarcane</strong> Agro-Ecological Zon<strong>in</strong>g program was developed under <strong>the</strong> coord<strong>in</strong>ation <strong>of</strong> <strong>the</strong> M<strong>in</strong>istry <strong>of</strong>Agriculture, Livestock and Supply (MAPA) to demarcate Brazil’s potential for expansion <strong>of</strong> bi<strong>of</strong>uel production,consider<strong>in</strong>g <strong>in</strong> particular sugarcane ethanol (Embrapa, 2009). This zon<strong>in</strong>g estimated that 64.7 million hectares(7.5% <strong>of</strong> total Brazilian territory) would be available for sugarcane production, tak<strong>in</strong>g <strong>in</strong>to account croplandand ranch<strong>in</strong>g areas where sugarcane is currently not grown, but where it has potential. Soil and climate<strong>in</strong>formation, environmental protection areas, geomorphologic characteristics and topographic maps were
Ethanol <strong>in</strong> <strong>the</strong> Brazilian <strong>Energy</strong> <strong>Matrix</strong>287also considered. The process also <strong>in</strong>corporated federal and state environmental legislation and analysis <strong>of</strong> agronomicdata for sugarcane <strong>in</strong>clud<strong>in</strong>g optimal temperatures for growth, best soil types, water requirements,and o<strong>the</strong>rs. Add<strong>in</strong>g toge<strong>the</strong>r <strong>the</strong> 7.8 million hectares currently used for sugarcane plantations or sugar andethanol, plus <strong>the</strong> additional area to be cultivated with sugarcane by 2017, which we estimate at 6.7 millionhectares, <strong>the</strong> total land to be occupied by sugarcane <strong>in</strong> that year would be about 20% <strong>of</strong> <strong>the</strong> area def<strong>in</strong>ed assuitable by <strong>the</strong> zon<strong>in</strong>g, and equivalent to 1.7% <strong>of</strong> national territory.Brazil’s potential for sugarcane production effectively far exceeds its raw material requirements, even with<strong>in</strong><strong>the</strong> most optimistic demand scenarios and <strong>in</strong>clud<strong>in</strong>g exports. As an exercise to assess <strong>the</strong> current potential wecan consider <strong>the</strong> overall values <strong>of</strong> 2007/2008 harvest, when Brazil produced approximately 22 billion liters <strong>of</strong>ethanol from 3.6 million hectares <strong>of</strong> sugarcane plantations. Based on this empirical data, add<strong>in</strong>g 10% <strong>of</strong> anhydrousethanol to all <strong>the</strong> gasol<strong>in</strong>e consumed <strong>in</strong> <strong>the</strong> world (1.3 billion cubic meters) would require 136.5 billionliters <strong>of</strong> ethanol. Produc<strong>in</strong>g this volume under current Brazilian conditions would require 23 million hectares<strong>of</strong> sugarcane plantation, equivalent to <strong>the</strong> area currently occupied by soybeans <strong>in</strong> Brazil and about one third<strong>of</strong> <strong>the</strong> area designated by <strong>the</strong> Agro-Ecological Zon<strong>in</strong>g program as apt for sugarcane.By analyz<strong>in</strong>g <strong>the</strong> Brazilian situation and employ<strong>in</strong>g land-use models and satellite images to study <strong>the</strong> dynamics<strong>of</strong> sugarcane expansion <strong>in</strong> different regions <strong>of</strong> <strong>the</strong> country, Nassar and colleagues (2008) conv<strong>in</strong>c<strong>in</strong>gly showthat sugarcane expansion has occurred mostly <strong>in</strong> pastures. They also <strong>in</strong>dicate that plantations could cont<strong>in</strong>ueto expand <strong>in</strong> a similar manner, without affect<strong>in</strong>g <strong>the</strong> production <strong>of</strong> meat and milk, even with an estimated5.1% growth <strong>of</strong> <strong>the</strong> cattle herd, thanks to productivity ga<strong>in</strong>s <strong>in</strong> <strong>the</strong> period (Nogueira, 2009).Figure 5Land use <strong>in</strong> rural properties <strong>in</strong> BrazilIn millions <strong>of</strong> hectares4003503002502001501005001975 1985 19952006Pastures Forests and woodland CropsFallow or unused areasSource: IBGE (2008).
288 Ethanol and Bioelectricity <strong>Sugarcane</strong> <strong>in</strong> <strong>the</strong> <strong>Future</strong> <strong>of</strong> <strong>the</strong> <strong>Energy</strong> <strong>Matrix</strong>5 Technological evolution and conversion efficiencies5.1 Petroleum and its derivativesDevelopment <strong>of</strong> <strong>the</strong> sub-salt petroleum fields <strong>of</strong>f <strong>the</strong> Brazilian coast will require new technologies both forprospection and production.In geophysical terms, <strong>the</strong> layer <strong>of</strong> salt acts as a mirror to reflect acoustic waves, prevent<strong>in</strong>g <strong>the</strong>ir penetrationand so h<strong>in</strong>der<strong>in</strong>g precise studies <strong>of</strong> its thickness and <strong>the</strong> conditions beneath it.Paraff<strong>in</strong>s present <strong>in</strong> <strong>the</strong> oil represent ano<strong>the</strong>r challenge. At 8,000 meters down, <strong>the</strong> oil temperature is 60º Cor 70° C, but when it flows through sea-bed pipes <strong>in</strong> water at 4° C it suffers abrupt cool<strong>in</strong>g and <strong>the</strong> paraff<strong>in</strong>solidifies. Among <strong>the</strong> possible solutions are heated pipes, enhanced <strong>in</strong>sulation, and <strong>the</strong> use <strong>of</strong> chemicalcompounds to keep <strong>the</strong> paraff<strong>in</strong> liquid.The sub-salt oil reserves also conta<strong>in</strong> high levels <strong>of</strong> CO 2, which need to be separated <strong>in</strong> an economic wayat <strong>the</strong> surface, processed, pressurized and re-<strong>in</strong>jected <strong>in</strong>to <strong>the</strong> oil fields to <strong>in</strong>crease pressure, dissolve <strong>the</strong>oil and facilitate <strong>the</strong> flow.5.2 Natural gasTechnological <strong>in</strong>novation <strong>in</strong> gas-fired <strong>the</strong>rmoelectric plants have been obta<strong>in</strong>ed by <strong>in</strong>cremental advances<strong>in</strong> gas turb<strong>in</strong>e technology, associated with <strong>the</strong> use <strong>of</strong> new materials and new concepts for refrigerationsystems <strong>of</strong> <strong>the</strong> turb<strong>in</strong>e blades. These have allowed for use <strong>of</strong> higher temperatures at <strong>the</strong> turb<strong>in</strong>e <strong>in</strong>takes,yield<strong>in</strong>g higher efficiency.5.3 Coal and its derivativesAGenerally speak<strong>in</strong>g, coal deposits <strong>of</strong> <strong>the</strong> South <strong>of</strong> Brazil conta<strong>in</strong> low-carbon coals, known commercially ashigh-volatility coal with high ash content (50%) and variable sulfur content. Raw coal (ROM) <strong>in</strong> Rio Grandedo Sul has approximately 1% sulfur, while <strong>in</strong> Santa Catar<strong>in</strong>a it has about 4% and <strong>in</strong> Paraná, 7%. The m<strong>in</strong>eralmatter dissem<strong>in</strong>ated <strong>in</strong> <strong>the</strong> organic matter makes process<strong>in</strong>g difficult, with low yields, except for coal fromParaná that <strong>of</strong>fers a higher yield (Osorio et al, 2008).The efficiency <strong>of</strong> Brazilian <strong>the</strong>rmoelectric plants burn<strong>in</strong>g pulverized coal and operat<strong>in</strong>g subcritical steamcycles is relatively low, rang<strong>in</strong>g from 33% to 35%. The use <strong>of</strong> supercritical and ultra-supercritical steamcycles can raise this efficiency to 44% and 50%, respectively. The use <strong>of</strong> combustion boilers with fluidizedbeds can achieve efficiencies between 40% and 44%, while coal gasification <strong>in</strong>tegrated with a comb<strong>in</strong>ed
Ethanol <strong>in</strong> <strong>the</strong> Brazilian <strong>Energy</strong> <strong>Matrix</strong>289cycle (IGCC) is already used <strong>in</strong> several demonstration plants abroad, and can raise <strong>the</strong> efficiency <strong>of</strong> a coalfiredplant to 52% (EPE/MME, 2007).In estimat<strong>in</strong>g <strong>the</strong> capacity <strong>of</strong> new <strong>the</strong>rmoelectric plants that could be built <strong>in</strong> Brazil consum<strong>in</strong>g domesticcoal, <strong>the</strong> 2008/2017 PDE assumed a m<strong>in</strong><strong>in</strong>g recovery factor <strong>of</strong> 60%, a usable percentage <strong>of</strong> 50%, an averagecapacity factor <strong>of</strong> 55% and plant efficiency <strong>of</strong> 35% (EPE/MME, 2009).5.4 UraniumOne kilogram <strong>of</strong> uranium <strong>in</strong> <strong>the</strong> form <strong>of</strong> UO 2powder conta<strong>in</strong>ed <strong>in</strong> <strong>the</strong> fuel elements requires <strong>the</strong> m<strong>in</strong><strong>in</strong>g <strong>of</strong>8 kg <strong>of</strong> U 3O 8, <strong>the</strong> conversion <strong>of</strong> 7 kg <strong>of</strong> U 3O 8to UF 6, and <strong>the</strong> enrichment <strong>of</strong> 4.8 kg <strong>of</strong> UF 6.Second-generation PWR power plants like Brazil’s Angra II and Angra III have an average efficiency <strong>of</strong> 33%(EPE/MME, 2007).Designs <strong>of</strong> first and second-generation reactors rely exclusively on active safety systems and <strong>in</strong>herent safetyfeatures (Mongelli, 2006).Third and fourth-generation nuclear reactors are still under development, although some units are operat<strong>in</strong>gon a commercial scale.The ma<strong>in</strong> features <strong>of</strong> third-generation reactors are (Mongelli, 2006):. Standardized design for each type <strong>of</strong> reactor, <strong>in</strong> order to expedite licens<strong>in</strong>g, lower capital costs andreduce construction time.. Simplified projects that facilitate <strong>the</strong> operation <strong>of</strong> reactors and make <strong>the</strong>m less vulnerable tooperational failures.. Greater availability and <strong>in</strong>creased lifespan to up to 60 years.. M<strong>in</strong>imization <strong>of</strong> <strong>the</strong> possibility <strong>of</strong> core meltdown.. Use <strong>of</strong> advanced safety systems.. Higher burn<strong>in</strong>g rates, to m<strong>in</strong>imize <strong>the</strong> amount <strong>of</strong> waste.. Use <strong>of</strong> burnable poisons to <strong>in</strong>crease <strong>the</strong> lifetime <strong>of</strong> <strong>the</strong> fuel.Several countries are devot<strong>in</strong>g great efforts to <strong>the</strong> research and development <strong>of</strong> closed nuclear fuel cyclesand <strong>the</strong> concept <strong>of</strong> partition<strong>in</strong>g and transmutation, which is <strong>the</strong> separation <strong>of</strong> transuranic elements andfission products <strong>in</strong> <strong>the</strong> fuel that have a longer half-live, and burn<strong>in</strong>g <strong>the</strong>se <strong>in</strong> dedicated reactors, <strong>in</strong> a doublestrata fuel cycle. This double cycle consists <strong>of</strong> <strong>the</strong> conventional cycle <strong>of</strong> fast <strong>the</strong>rmal reactors – <strong>the</strong> first stratum– <strong>in</strong> which <strong>the</strong> U and Pu (Th) can be recycled via aqueous reprocess<strong>in</strong>g (Purex/Thorex), complementedby a transmutation cycle. In this second cycle – <strong>the</strong> second stratum – <strong>the</strong> m<strong>in</strong>or act<strong>in</strong>ides, long half-life
290 Ethanol and Bioelectricity <strong>Sugarcane</strong> <strong>in</strong> <strong>the</strong> <strong>Future</strong> <strong>of</strong> <strong>the</strong> <strong>Energy</strong> <strong>Matrix</strong>fission products and Pu (Th) are partitioned by electrochemical processes to feed a dedicated burner reactor– transmutation. The first stratum <strong>of</strong> <strong>the</strong> cycle has technically mastered, but second stratum processesare still at <strong>the</strong> demonstration stage (Mongelli, 2006).Fourth generation reactors are called ‘revolutionary’ with<strong>in</strong> <strong>the</strong> nuclear <strong>in</strong>dustry, to dist<strong>in</strong>guish <strong>the</strong>m fromthird-generation reactors which are ‘evolutionary’. They meet <strong>the</strong> most modern safety requirements witha comb<strong>in</strong>ation <strong>of</strong> active, passive and <strong>in</strong>herent safety systems. These requirements dictate that any severeaccident – a reactor core meltdown – must be conf<strong>in</strong>ed with<strong>in</strong> <strong>the</strong> plant, so reduc<strong>in</strong>g or elim<strong>in</strong>at<strong>in</strong>g evacuationand emergency requirements (Mongelli, 2006).Most fourth-generation reactors utilize a closed fuel cycle with <strong>the</strong> dual objective <strong>of</strong> m<strong>in</strong>imiz<strong>in</strong>g <strong>the</strong> production<strong>of</strong> waste and maximize use <strong>of</strong> fuel. Given that more efficient fuel recycl<strong>in</strong>g takes place <strong>in</strong> a fastspectrum reactor, most fourth-generation reactor projects now under development are fast reactors.5.5 Bi<strong>of</strong>uelsWhile <strong>the</strong> technology employed for conventional production <strong>of</strong> sugarcane ethanol has evolved significantly,with average annual <strong>in</strong>crements <strong>of</strong> 3.1% <strong>in</strong> agro-<strong>in</strong>dustrial productivity dur<strong>in</strong>g <strong>the</strong> past three decades, <strong>the</strong>reare still <strong>in</strong>terest<strong>in</strong>g opportunities for fur<strong>the</strong>r improvement. Examples <strong>of</strong> technologies that will <strong>in</strong>crease <strong>the</strong>energy susta<strong>in</strong>ability <strong>of</strong> this agribus<strong>in</strong>ess, some <strong>of</strong> which are already be<strong>in</strong>g implemented, <strong>in</strong>clude <strong>the</strong> use <strong>of</strong>cogeneration systems with high pressure boilers; harvest<strong>in</strong>g cane raw (unburned) to allow for use <strong>of</strong> <strong>the</strong>energy <strong>in</strong> <strong>the</strong> straw; and <strong>the</strong> <strong>in</strong>troduction <strong>of</strong> hydrolysis processes for <strong>the</strong> cellulosic wastes <strong>of</strong> ethanol manufacture.Notable results <strong>in</strong> <strong>the</strong> agricultural stage <strong>in</strong>clude varietal improvement, use <strong>of</strong> biological pest control,<strong>in</strong>troduction <strong>of</strong> precision-farm<strong>in</strong>g systems and <strong>the</strong> adoption <strong>of</strong> high-performance logistics systems.A summary <strong>of</strong> progress to date and medium-term possibilities for performance ga<strong>in</strong>s <strong>in</strong> sugarcane ethanolproduction is presented <strong>in</strong> Table 11, toge<strong>the</strong>r with values for agricultural and <strong>in</strong>dustrial productivity. Formore details, see Nogueira (2009).The performance levels shown for <strong>the</strong> first stage <strong>of</strong> process optimization, predicted for <strong>the</strong> period 2005 –2010, have effectively been met. In some mills and distilleries, especially new units, <strong>the</strong> levels have been surpassed.As can be seen, even without consider<strong>in</strong>g <strong>the</strong> <strong>in</strong>troduction <strong>of</strong> additional production paths such ascellulosic ethanol, <strong>the</strong> higher productivity due to agribus<strong>in</strong>ess should, <strong>in</strong> <strong>the</strong> com<strong>in</strong>g years, allow a decrease<strong>of</strong> 3.4% <strong>in</strong> planted area per unit <strong>of</strong> ethanol produced – a significant result for technological research anddevelopment <strong>in</strong> <strong>the</strong> sector. If <strong>the</strong> production <strong>of</strong> bioethanol from cellulosic waste is also considered, productivitycould reach, 10,400 liters <strong>of</strong> bioethanol per hectare <strong>in</strong> <strong>the</strong> same time frame (Nogueira, 2009).Tak<strong>in</strong>g <strong>in</strong>to account <strong>the</strong> <strong>in</strong>troduction <strong>of</strong> new technologies, with <strong>the</strong> better use <strong>of</strong> sugarcane waste, <strong>the</strong>adoption <strong>of</strong> procedures for hydrolytic conversion <strong>of</strong> cellulose and <strong>the</strong> use <strong>of</strong> optimized cogeneration systems,Macedo et al (2008) estimated that <strong>the</strong> energy balance will evolve favorably <strong>in</strong> <strong>the</strong>se units. The rela-
Ethanol <strong>in</strong> <strong>the</strong> Brazilian <strong>Energy</strong> <strong>Matrix</strong>291tionship between energy produced and consumed <strong>in</strong> <strong>the</strong> process, estimated at 9.3 us<strong>in</strong>g 2006 data, shouldrise to 12.1 <strong>in</strong> 2020, whe<strong>the</strong>r priority is given to maximiz<strong>in</strong>g production <strong>of</strong> ethanol or electricity.Production paths for biodiesel also show good prospects for improvement, consider<strong>in</strong>g conventional technologies.However, <strong>the</strong>re are still uncerta<strong>in</strong>ties about <strong>the</strong> viability <strong>of</strong> some crops, especially from <strong>the</strong> viewpo<strong>in</strong>t<strong>of</strong> energy balance, so more work is needed to better characterize <strong>the</strong> most desirable systems. Look<strong>in</strong>gfur<strong>the</strong>r ahead, new possibilities such as <strong>the</strong> development <strong>of</strong> processes for produc<strong>in</strong>g biodiesel from algaewith high lipid content, or by fermentation processes employ<strong>in</strong>g polysaccharides as raw material, may representpromis<strong>in</strong>g options, but this is yet to be confirmed.6 Competitiveness <strong>of</strong> bi<strong>of</strong>uelsThe price and cost <strong>of</strong> bi<strong>of</strong>uels are relevant factors <strong>in</strong> determ<strong>in</strong><strong>in</strong>g <strong>the</strong> appropriateness and susta<strong>in</strong>ability <strong>of</strong><strong>the</strong>ir use. For biodiesel, <strong>the</strong> market is def<strong>in</strong>ed by compulsory use and prices have been set via <strong>the</strong> auctionsheld periodically by <strong>the</strong> ANP. Consider<strong>in</strong>g <strong>the</strong> auctions held dur<strong>in</strong>g <strong>the</strong> period <strong>of</strong> mandatory blend<strong>in</strong>g andweighted for volumes sold, <strong>the</strong> average price <strong>of</strong> biodiesel <strong>in</strong> this period was R$2.42/liter (ANP, 2009a).Given <strong>the</strong> manner <strong>in</strong> which <strong>the</strong> price is def<strong>in</strong>ed, we believe it adequately covers <strong>the</strong> costs <strong>of</strong> production.However, it is significantly higher than <strong>the</strong> pre-tax price <strong>of</strong> <strong>the</strong> diesel it substitutes, confirm<strong>in</strong>g that thisbi<strong>of</strong>uel is still at <strong>the</strong> embryonic stage <strong>of</strong> development.Impact <strong>of</strong> <strong>the</strong> <strong>in</strong>troduction <strong>of</strong> new technologies on bio-ethanol productionTabela 11PeriodAgricultural(t/ha)ProductivityIndustrial(litre/t)Agri-<strong>in</strong>dustrial(litre/ha)1977–1978Initial phase <strong>of</strong> <strong>the</strong> National Ethanol Program.Low efficiency <strong>in</strong> <strong>the</strong> <strong>in</strong>dustrial process and65 70 4,550agricultural production.1987–1988Consolidation <strong>of</strong> <strong>the</strong> National Ethanol Program.Agricultural and <strong>in</strong>dustrial productivity <strong>in</strong>crease 75 76 5,700significantly.Current SituationThe bioethanol production process operateswith <strong>the</strong> best technology available.85 80 6,8002005–2010 First stage <strong>of</strong> process optimization. 81 86.2 6,9002010–2015 Second stage <strong>of</strong> process optimization. 83 87.7 7,0202015–2020 Third stage <strong>of</strong> process optimization. 84 89.5 7,160Source: CGEE (2007).
292 Ethanol and Bioelectricity <strong>Sugarcane</strong> <strong>in</strong> <strong>the</strong> <strong>Future</strong> <strong>of</strong> <strong>the</strong> <strong>Energy</strong> <strong>Matrix</strong>The scenario is quite different for ethanol, which has a more complex market with free pric<strong>in</strong>g and demanddivided between <strong>the</strong> compulsory blend<strong>in</strong>g <strong>in</strong> gasol<strong>in</strong>e (anhydrous ethanol) and <strong>the</strong> use as pure fuel (hydrousethanol). In <strong>the</strong> follow<strong>in</strong>g paragraphs, we attempt to analyze <strong>the</strong> competitiveness <strong>of</strong> ethanol <strong>in</strong> <strong>the</strong>Brazilian context.Initially, it should be noted that economic studies <strong>of</strong> <strong>the</strong> sugarcane ethanol market, look<strong>in</strong>g at <strong>the</strong> determ<strong>in</strong>ation<strong>of</strong> production costs and studies <strong>of</strong> price formation mechanisms, entail <strong>the</strong>ir own complexity. Thisarises from <strong>the</strong> possibility <strong>of</strong> us<strong>in</strong>g <strong>the</strong> raw material for different products like sugar – which has importantdomestic and foreign markets – plus <strong>the</strong> relevant possibility that consumers <strong>of</strong> hydrous ethanol who driveflex-fuel vehicles, <strong>in</strong>creas<strong>in</strong>gly common <strong>in</strong> <strong>the</strong> Brazilian vehicle fleet, can choose to use this bi<strong>of</strong>uel or not,depend<strong>in</strong>g on <strong>the</strong> price each time <strong>the</strong> tank is filled. This means that <strong>in</strong> addition to <strong>the</strong> usual costs associatedwith production factors, opportunity costs are also <strong>of</strong> great importance <strong>in</strong> <strong>the</strong> ethanol market.The follow<strong>in</strong>g factors also contribute to mak<strong>in</strong>g economic studies more difficult: (i) significant rigidity <strong>of</strong><strong>in</strong>ternational sugar markets, with different market<strong>in</strong>g processes and quotas established by major buyers,distort<strong>in</strong>g price formation; (ii) <strong>the</strong> artificiality <strong>of</strong> <strong>the</strong> petroleum market, where prices are not related todirect costs; and (iii) especially for Brazilian ethanol, <strong>the</strong> virtual absence <strong>of</strong> stabiliz<strong>in</strong>g mechanisms to mitigate<strong>the</strong>se sources <strong>of</strong> <strong>in</strong>stability, for example buffer stocks or futures markets.In <strong>the</strong> current scenario, we must also add to <strong>the</strong> above-mentioned factors <strong>the</strong> high volatility <strong>of</strong> commodityprices, especially petroleum and foreign exchange and f<strong>in</strong>ancial <strong>in</strong>dicators. This means that <strong>the</strong> figures beloware <strong>in</strong>dicative, but make it possible to establish some <strong>in</strong>terest<strong>in</strong>g references with respect to <strong>the</strong> economicviability <strong>of</strong> sugarcane ethanol, associated with its cost structure and competitiveness with crude oil.6.1 Prices and costs <strong>of</strong> ethanolAs a result <strong>of</strong> <strong>the</strong> progressive improvement <strong>in</strong> processes, with productivity ga<strong>in</strong>s <strong>in</strong> both agriculture and<strong>in</strong>dustry, Brazilian sugarcane ethanol is recognized as <strong>the</strong> world’s lowest-cost bi<strong>of</strong>uel (BNDES, 2008). It iscompetitive with gasol<strong>in</strong>e <strong>in</strong> terms <strong>of</strong> producer costs and prices and consumer prices, although it sufferslosses due to distortions <strong>in</strong> <strong>the</strong> Brazilian petroleum derivatives market.The feasibility <strong>of</strong> us<strong>in</strong>g ethanol <strong>in</strong>stead <strong>of</strong> gasol<strong>in</strong>e can be confirmed by compar<strong>in</strong>g prices at <strong>the</strong> distilleries,without freight or taxes, as shown <strong>in</strong> Figure 6. The values refer to <strong>the</strong> average price <strong>of</strong> anhydrous ethanol <strong>in</strong><strong>the</strong> state <strong>of</strong> São Paulo, as reported by <strong>the</strong> Center for Advanced Studies <strong>in</strong> Applied Economics (Cepea) <strong>of</strong> <strong>the</strong>Escola Superior de Agricultura Luiz de Queiroz, University <strong>of</strong> São Paulo, and <strong>the</strong> price <strong>of</strong> regular gasol<strong>in</strong>e <strong>in</strong><strong>the</strong> U.S. Gulf Coast spot market, as reported by <strong>the</strong> U.S. <strong>Energy</strong> Information Adm<strong>in</strong>istration.From <strong>the</strong>se trends, we can conclude that, <strong>in</strong> addition to exhibit<strong>in</strong>g lower volatility than gasol<strong>in</strong>e, producerprices for sugarcane ethanol began to be consistently more attractive than those for gasol<strong>in</strong>e <strong>in</strong> recentyears, exclud<strong>in</strong>g taxes and any subsidy. In o<strong>the</strong>r words, under <strong>the</strong>se conditions, without taxes, <strong>the</strong> addition
Ethanol <strong>in</strong> <strong>the</strong> Brazilian <strong>Energy</strong> <strong>Matrix</strong>293<strong>of</strong> anhydrous ethanol made it possible to reduce, at least most <strong>of</strong> <strong>the</strong> time, <strong>the</strong> average market price <strong>of</strong> TypeC gasol<strong>in</strong>e (a blend <strong>of</strong> Type A gasol<strong>in</strong>e with ethanol).Ano<strong>the</strong>r way to assess <strong>the</strong> evolution <strong>of</strong> <strong>the</strong> attractiveness <strong>of</strong> ethanol when compared to conventional fuelsfor <strong>the</strong> f<strong>in</strong>al consumer is compar<strong>in</strong>g <strong>the</strong> average retail price <strong>of</strong> ethanol with that for regular gasol<strong>in</strong>e.Observ<strong>in</strong>g <strong>the</strong> price series summarized <strong>in</strong> Figure 7, it can be seen that hydrous ethanol has regularly beencompetitive with gasol<strong>in</strong>e, with lower cost per kilometer, due to its lower price at <strong>the</strong> producer level and<strong>in</strong> <strong>the</strong> tax structure. The values <strong>in</strong> Figure 7 are derived from fuel price surveys provided regularly by ANP,applied on a large sample that covers <strong>the</strong> entire territory <strong>of</strong> Brazil (ANP, 2009b).Ethanol has generally been preferred for flex-fuel vehicles, up to a limit <strong>of</strong> 70% <strong>of</strong> <strong>the</strong> gasol<strong>in</strong>e price. In thiscontext, it should be noted that dur<strong>in</strong>g most recent years, except dur<strong>in</strong>g short periods, it has been cheaperto use ethanol than gasol<strong>in</strong>e. Of course, this price difference varies by region. It is greater <strong>in</strong> produc<strong>in</strong>gregions, where ethanol use is more attractive than gasol<strong>in</strong>e all year round, while <strong>in</strong> distant regions, gasol<strong>in</strong>eis almost always more competitive.Figura 6Prices paid to producers for gasol<strong>in</strong>e <strong>in</strong> <strong>the</strong> U.S. and sugarcane ethanol <strong>in</strong> BrazilIn US$/liter, without taxes1.201.000.800.600.400.200.001 61 121 181 241 301 361 421U.S. – gasol<strong>in</strong>e GCBrazil – anhydrous ethanolSource: Cepea (2009) and EIA (2009).
294 Ethanol and Bioelectricity <strong>Sugarcane</strong> <strong>in</strong> <strong>the</strong> <strong>Future</strong> <strong>of</strong> <strong>the</strong> <strong>Energy</strong> <strong>Matrix</strong>Figura 7 also shows <strong>the</strong> regular pattern <strong>of</strong> price variation, ris<strong>in</strong>g at <strong>the</strong> end <strong>of</strong> <strong>the</strong> harvest and fall<strong>in</strong>g at itsstart <strong>in</strong> <strong>the</strong> middle <strong>of</strong> <strong>the</strong> first semester. This pattern was broken <strong>in</strong> <strong>the</strong> most recent period, when <strong>the</strong> price<strong>of</strong> gasol<strong>in</strong>e was artificially held down by Petrobras act<strong>in</strong>g under government <strong>in</strong>struction. This <strong>in</strong>tervention,carried out without specific rules and with little transparency, is one <strong>of</strong> <strong>the</strong> most disturb<strong>in</strong>g distortions <strong>in</strong><strong>the</strong> Brazilian fuel market. It gives bad cost <strong>in</strong>dications, wrongly directs <strong>the</strong> market, and <strong>in</strong> effect constitutesdisrespect for <strong>the</strong> law: sell<strong>in</strong>g below production cost is dump<strong>in</strong>g, while sell<strong>in</strong>g above market prices is equallypernicious and signals <strong>the</strong> existence <strong>of</strong> market barriers to be elim<strong>in</strong>ated. This topic is addressed below, whenwe exam<strong>in</strong>e legal and regulatory issues.After look<strong>in</strong>g briefly at ethanol’s competitiveness for producers and consumers, relative to gasol<strong>in</strong>e, it isopportune to review production costs. The costs <strong>of</strong> Brazilian sugar and ethanol agribus<strong>in</strong>ess were for along time audited by <strong>the</strong> federal government, which set prices throughout <strong>the</strong> sugar-ethanol supply cha<strong>in</strong>,<strong>in</strong>clud<strong>in</strong>g commercial distribution. It was similar to mechanisms that were <strong>in</strong> force for decades throughout<strong>the</strong> fuel and electricity supply cha<strong>in</strong>s, until <strong>the</strong> current regulatory framework for <strong>the</strong> energy sector was<strong>in</strong>troduced.Major liberalization <strong>of</strong> <strong>the</strong> sugar-ethanol sector started with <strong>the</strong> 1997 harvest, and was completed by 2002.This allows economic agents to freely decide <strong>the</strong>ir prices based on market strategies, consider<strong>in</strong>g availabilityand outlook <strong>in</strong> <strong>the</strong> sugar and fuel markets. Estimat<strong>in</strong>g costs is a complex task <strong>in</strong> this competitive environment,because – <strong>in</strong> addition to <strong>the</strong> great diversity <strong>of</strong> situations, with different products and technologiesbe<strong>in</strong>g used – <strong>the</strong> ma<strong>in</strong> cost component <strong>in</strong> ethanol is <strong>the</strong> raw material, which can be produced by <strong>the</strong> process<strong>in</strong>gcompany itself, on leased land, or grown by <strong>in</strong>dependent producers. The difficulty <strong>of</strong> consistentlyknow<strong>in</strong>g production costs is not unique to <strong>the</strong> bioethanol market; <strong>in</strong> an analogous way <strong>the</strong> detailed productioncosts for oil and natural gas are even less easily available.As a reference for conditions <strong>in</strong> <strong>the</strong> Center-South at <strong>the</strong> start <strong>of</strong> <strong>the</strong> 2009 harvest, <strong>the</strong> Organization <strong>of</strong><strong>Sugarcane</strong> Planters <strong>of</strong> <strong>the</strong> Center-South Region <strong>of</strong> Brazil (Orplana) estimated <strong>the</strong> total cost <strong>of</strong> produc<strong>in</strong>gethanol at R$0.762 per liter, with raw material represent<strong>in</strong>g 62.1% <strong>of</strong> this. The value <strong>in</strong>dicates producersoperat<strong>in</strong>g on a very tight marg<strong>in</strong>, and possibly negative <strong>in</strong> some periods. This is exacerbated if we take <strong>in</strong>toaccount <strong>the</strong> relatively <strong>in</strong>flexibility <strong>of</strong> <strong>the</strong> sugarcane <strong>in</strong>dustry, which is subject to marked seasonality, work<strong>in</strong>gwith raw material that must be harvested each year, and which requires build<strong>in</strong>g up large <strong>in</strong>ventoriesfor w<strong>in</strong>ter.Conab, <strong>the</strong> agency responsible for monitor<strong>in</strong>g <strong>the</strong> activities <strong>of</strong> Brazilian agriculture, recognizes that <strong>the</strong>sefactors have brought <strong>the</strong> sugar-ethanol sector to an “a major economic crisis, certa<strong>in</strong>ly <strong>the</strong> most persistentand long-last<strong>in</strong>g s<strong>in</strong>ce <strong>the</strong> sector was deregulated,” requir<strong>in</strong>g important adjustments to make this agribus<strong>in</strong>esssector attractive aga<strong>in</strong> (Conab, 2009).
Ethanol <strong>in</strong> <strong>the</strong> Brazilian <strong>Energy</strong> <strong>Matrix</strong>2956.2 Tax aspects <strong>of</strong> <strong>the</strong> competitiveness <strong>of</strong> ethanolFuel taxes constitute one <strong>of</strong> <strong>the</strong> most important and effective <strong>in</strong>struments for implement<strong>in</strong>g energy policies<strong>in</strong> several countries. Besides be<strong>in</strong>g important sources <strong>of</strong> revenue, <strong>the</strong>se taxes allow for differentiationbetween seem<strong>in</strong>gly similar products to help steer evolution <strong>of</strong> <strong>the</strong> matrix energy <strong>in</strong> a desired direction. In<strong>the</strong> case <strong>of</strong> ethanol this aspect is essential and should be used more widely.In Brazil, taxes have been differentiated between various vehicle fuels accord<strong>in</strong>g to <strong>the</strong> economic implicationsand typical applications <strong>of</strong> each one. Taxes have particularly favored:a) diesel fuel, used for productive activities and cargo and passenger transportation;b) natural gas, whose consumption was <strong>in</strong> pr<strong>in</strong>ciple desirable to stimulate and enable domestic productionand <strong>the</strong> deployment <strong>of</strong> <strong>in</strong>frastructure for gas transportation and distribution; andc) bi<strong>of</strong>uels, for <strong>the</strong>ir social, environmental and economic benefits. However, given that both <strong>the</strong> Union and<strong>in</strong>dividual states tax <strong>the</strong> fuels that are available to <strong>the</strong> Brazilian consumer, <strong>the</strong> f<strong>in</strong>al price composition is complexand varies between states, depend<strong>in</strong>g on <strong>the</strong> rates and <strong>the</strong> way <strong>the</strong> Tax on Circulation <strong>of</strong> Goods andServices (ICMS) is implemented (Nogueira, 2009). As an example, Figure 8 shows taxes on vehicle fuels <strong>in</strong> Riode Janeiro (S<strong>in</strong>dcomb, 2009).Figure 7 Average consumer price <strong>of</strong> regular gasol<strong>in</strong>e and hydrous ethanol In R$/liter3.002.502.001.501.000.50jan/01 jan/02 jan/03 jan/04 jan/05 jan/06 jan/07 jan/08 jan/09Hydrous bioethanol Regular gasol<strong>in</strong>e % bioethanol/gasol<strong>in</strong>eSource: ANP (2009).
296 Ethanol and Bioelectricity <strong>Sugarcane</strong> <strong>in</strong> <strong>the</strong> <strong>Future</strong> <strong>of</strong> <strong>the</strong> <strong>Energy</strong> <strong>Matrix</strong>The level <strong>of</strong> <strong>the</strong>se taxes is critical to <strong>the</strong> f<strong>in</strong>al price for consumers. It is <strong>of</strong>ten <strong>the</strong> difference that decideswhich fuel will be used, particularly for vehicles that have full flexibility to use more than one fuel, as is <strong>the</strong>case with natural gas and most <strong>of</strong> <strong>the</strong> fleet with ethanol eng<strong>in</strong>es. The situation <strong>in</strong> Brazil differs from o<strong>the</strong>rcountries, where <strong>the</strong>re are not so many fuels and <strong>the</strong> fleet does not have <strong>the</strong> same flexibility to choosebetween fuels at <strong>the</strong> moment <strong>of</strong> fill<strong>in</strong>g <strong>the</strong> tank. It is worth not<strong>in</strong>g that <strong>the</strong> additional <strong>in</strong>vestment requiredto ga<strong>in</strong> flexibility is relatively low <strong>in</strong> <strong>the</strong> case <strong>of</strong> ethanol; somewhat higher for natural gas. This difference isimportant to <strong>the</strong> consumer at <strong>the</strong> time <strong>of</strong> purchas<strong>in</strong>g <strong>the</strong> car, consider<strong>in</strong>g fixed and operational costs, butis <strong>of</strong> limited relevance afterwards when operational costs are decisive.Despite <strong>the</strong>ir enormous importance, fuel taxes <strong>in</strong> Brazil have been implemented <strong>in</strong> a disjo<strong>in</strong>ted manner,rarely tak<strong>in</strong>g <strong>in</strong>to account strategies for national development. While ethanol enjoys lower rates <strong>of</strong> CIDEand ICMS <strong>in</strong> relation to its substitutes, it has been hampered by distortions <strong>in</strong> producer prices for naturalgas and gasol<strong>in</strong>e. Figure 9 shows average prices practiced <strong>in</strong> Brazilian and U.S. ref<strong>in</strong>eries (ANP, 2009c; EIA,2009), with values converted us<strong>in</strong>g exchange rates reported by <strong>the</strong> Brazilian Central Bank (BC, 2009). It canbe seen that through much <strong>of</strong> <strong>the</strong> recent past Brazilian gasol<strong>in</strong>e prices have been held artificially low byfreez<strong>in</strong>g ref<strong>in</strong>ery prices and reduc<strong>in</strong>g federal taxes.Figure 8Taxes on vehicle fuels <strong>in</strong> Rio de Janeiro R$ per liter, May 20091,201,000,800,600,400,200,00Diesel Hydrous ethanol Gasol<strong>in</strong>e (with 25% Compressed natural gasanhydrous ethanol) for vehiclesCIDE/Pis/C<strong>of</strong><strong>in</strong>sICMsSource: S<strong>in</strong>dcomb (2009).
Ethanol <strong>in</strong> <strong>the</strong> Brazilian <strong>Energy</strong> <strong>Matrix</strong>297This procedure gives consumers <strong>in</strong>correct signals about <strong>the</strong> value <strong>of</strong> energy sources, <strong>in</strong>creases market uncerta<strong>in</strong>tiesand leads to a significant loss <strong>of</strong> tax revenue. Consider<strong>in</strong>g <strong>the</strong> difference between domestic and<strong>in</strong>ternational prices, <strong>the</strong> losses for Petrobras <strong>in</strong> <strong>the</strong> period 2005-2008 would be around US$2.8 billion.More serious for Brazilian society and <strong>the</strong> fiscal equilibrium <strong>of</strong> <strong>the</strong> federal government is <strong>the</strong> implicit taxwaiver. In <strong>the</strong> period April-December 2008 <strong>the</strong> reduction <strong>of</strong> <strong>the</strong> CIDE (Contribution on Intervention <strong>in</strong> <strong>the</strong>Economy) by R$0.10 per liter (a 35.7% discount) implied a loss <strong>of</strong> R$1.2 billion to <strong>the</strong> national treasury,without society hav<strong>in</strong>g any clear idea <strong>of</strong> <strong>the</strong> relevant benefit, objective or strategy to be achieved. Figure 9also shows that <strong>in</strong> some periods, domestic prices are higher than <strong>in</strong>ternational market prices, which implieshigher earn<strong>in</strong>gs for Petrobras, a state-owned company.As can be seen, current tax legislation has negatively impacted <strong>the</strong> competitiveness <strong>of</strong> ethanol; legislationshould be improved as an <strong>in</strong>strument <strong>of</strong> national energy policy. In this sense, it would be appropriate toconsider two actions: a) a return to <strong>the</strong> regulatory nature <strong>of</strong> CIDE, provid<strong>in</strong>g a relevant differentiation between<strong>the</strong> f<strong>in</strong>al price <strong>of</strong> fuels and attenuat<strong>in</strong>g <strong>the</strong> price volatility <strong>of</strong> petroleum <strong>in</strong> <strong>the</strong> <strong>in</strong>ternational market;and b) revisit<strong>in</strong>g <strong>the</strong> difference between <strong>the</strong> CIDE and ICMS tax rates <strong>in</strong> order to guide energy development<strong>in</strong> <strong>the</strong> desired direction <strong>in</strong> a balanced and efficient manner. To this end, it is essential that <strong>the</strong> price structurefor vehicle fuels – tak<strong>in</strong>g <strong>in</strong>to account costs, marg<strong>in</strong>s, taxes, fuel mileage and eventual eng<strong>in</strong>e adaptationcosts – leads to a streng<strong>the</strong>n<strong>in</strong>g <strong>of</strong> <strong>the</strong> energy matrix <strong>in</strong> a way that is compatible with <strong>the</strong> availability, impactsand benefits <strong>of</strong> each fuel.Figura 9Prices for standard gasol<strong>in</strong>e received by Brazilian and American producersUS$/litro, sem tributos0,900,800,700,600,500,400,300,20jan/05 jul/05 jan/06 jul/06 jan/07 jul/07 jan/08 jul/08 jan/09Brazilian ref<strong>in</strong>eryU.S. Gulf Coast ref<strong>in</strong>erySource: EIA (2009 and ANP (2009c).
298 Ethanol and Bioelectricity <strong>Sugarcane</strong> <strong>in</strong> <strong>the</strong> <strong>Future</strong> <strong>of</strong> <strong>the</strong> <strong>Energy</strong> <strong>Matrix</strong>6.3 Electricity generation from sugarcane bagasseThe Brazilian electricity sector sells wholesale energy us<strong>in</strong>g <strong>the</strong> Regulated Contract<strong>in</strong>g Environment (ACR)and <strong>the</strong> Free Contract<strong>in</strong>g Environment (ACL); <strong>the</strong> search for affordable tariffs is currently <strong>the</strong> ma<strong>in</strong> policygoal for electric energy generation (Bajay, 2009b).In <strong>the</strong> ACR environment, power from exist<strong>in</strong>g generat<strong>in</strong>g stations – called “old energy” – and from plannedgenerat<strong>in</strong>g stations – “new energy” – is contracted for <strong>the</strong> supply <strong>of</strong> “captive consumers” via lowest-priceauctions. There are also auctions for stand-by energy. In <strong>the</strong> “new energy” auctions, entrepreneurs <strong>of</strong>fer energy<strong>in</strong> lots with a m<strong>in</strong>imum quantity <strong>of</strong> 1 MW av, stipulat<strong>in</strong>g <strong>the</strong>ir required fixed revenue (RF <strong>in</strong> Portuguese).Auction w<strong>in</strong>ners are those <strong>of</strong>fer<strong>in</strong>g <strong>the</strong> lowest tariff. A cost-benefit <strong>in</strong>dex (ICB) for <strong>the</strong>rmoelectric stations iscalculated by <strong>the</strong> federal government’s <strong>Energy</strong> Research Company (EPE) and is <strong>the</strong> average price expected ifstations are dispatched accord<strong>in</strong>g to <strong>the</strong> operational premise used by <strong>the</strong> EPE <strong>in</strong> <strong>the</strong> auction model<strong>in</strong>g. Asnoted below, <strong>the</strong> methodology used to calculate this <strong>in</strong>dicator has been <strong>the</strong> object <strong>of</strong> much criticism and hasnot reflected <strong>the</strong> competitiveness <strong>of</strong> stations that generate electricity us<strong>in</strong>g sugarcane bagasse.In <strong>the</strong> ACL, producers, retailers and large “free consumers” negotiate bilateral contracts.Law No. 10,438 <strong>of</strong> April 26, 2002 created <strong>in</strong>centives for alternative sources <strong>of</strong> electrical energy (Pro<strong>in</strong>fa<strong>in</strong> Portuguese). This was to be implemented <strong>in</strong> two phases. In <strong>the</strong> first stage, 3,300 MW would be builtthrough 2006, count<strong>in</strong>g small hydro, w<strong>in</strong>d generation and <strong>the</strong>rmoelectric or cogeneration plants burn<strong>in</strong>gbiomass. In <strong>the</strong> second stage runn<strong>in</strong>g through 2022, power generated by such plants would supply 15%<strong>of</strong> annual growth <strong>in</strong> energy use and 10% <strong>of</strong> total electricity consumption. Pro<strong>in</strong>fa was revised by Law No.10,762 <strong>of</strong> November 11, 2003 and is seen with<strong>in</strong> <strong>the</strong> new <strong>in</strong>stitutional model for <strong>the</strong> Brazilian electricitysector as an <strong>in</strong>strument for creat<strong>in</strong>g opportunities to diversify national generat<strong>in</strong>g capacity. However, <strong>the</strong>strong emphasis that <strong>the</strong> model placed on lower tariffs ended up limit<strong>in</strong>g <strong>the</strong> implementation <strong>of</strong> <strong>the</strong> secondphase <strong>of</strong> <strong>the</strong> Pro<strong>in</strong>fa program.Pro<strong>in</strong>fa energy contracts are <strong>the</strong> most expensive <strong>in</strong> Brazil, accord<strong>in</strong>g to <strong>the</strong> June 2009 Tariff Newsletter publishedby DGSE/MME. This report said <strong>the</strong> price <strong>of</strong> electricity from Pro<strong>in</strong>fa <strong>in</strong> May <strong>of</strong> 2009 xv was R$165.92per MWh, while <strong>the</strong> price <strong>of</strong> <strong>the</strong> cheapest energy with<strong>in</strong> <strong>the</strong> energy mix <strong>in</strong> Brazil was R$71.49 per MWh. Thenewsletter also revealed that <strong>the</strong> most expensive energy after Pro<strong>in</strong>fa was from <strong>the</strong>rmal generators. Theaverage price for biomass at energy auctions, for delivery start<strong>in</strong>g <strong>in</strong> 2010, was R$153.48 per MWh, whilefor oil-fired <strong>the</strong>rmal plants with delivery start<strong>in</strong>g this year, <strong>the</strong> average standby price was R$147.20. Theaverage price at energy auctions with natural gas as fuel, with delivery start<strong>in</strong>g <strong>in</strong> 2011, estimated by <strong>the</strong>MME, was R$145.24/MWh. For coal-fired <strong>the</strong>rmal plants <strong>the</strong> average auction price <strong>of</strong> energy, with deliverystart<strong>in</strong>g <strong>in</strong> 2012, was R$141.08/MWh.The figures published <strong>in</strong> <strong>the</strong> DGSE/MME Tariff Newsletter for <strong>the</strong>rmal power plants are averages <strong>of</strong> <strong>the</strong> costbenefit <strong>in</strong>dexes <strong>of</strong> plants that won new energy auctions held s<strong>in</strong>ce 2005. In o<strong>the</strong>r words, those values aretied to capacity factors simulated by <strong>the</strong> EPE before each <strong>of</strong> <strong>the</strong>se auctions. In a dry hydrological period,
Ethanol <strong>in</strong> <strong>the</strong> Brazilian <strong>Energy</strong> <strong>Matrix</strong>299power plants with a high degree <strong>of</strong> flexibility and high fuel costs, such as those burn<strong>in</strong>g fuel oil or LNG, willhave to be dispatched at a capacity factor much higher than <strong>the</strong> one calculated before <strong>the</strong> correspond<strong>in</strong>gauction, with unit generat<strong>in</strong>g costs well above <strong>the</strong> values <strong>of</strong> <strong>the</strong>ir respective cost-benefit ratios.The EPE has not used <strong>the</strong> same matrix <strong>of</strong> values for Prices for Settlement <strong>of</strong> Differences (PLD) when calculat<strong>in</strong>g<strong>the</strong> Variable Cost <strong>of</strong> Operation (COP) and Short-term Economic Cost (CEC) parameters and <strong>the</strong> physicalsecurity <strong>of</strong> generators, which are part <strong>of</strong> <strong>the</strong> formula used for calculat<strong>in</strong>g <strong>the</strong> ICB (Bajay, 2009b).Wise Systems, with help from Tractebel Energia SA xvi , <strong>the</strong> largest private power generator <strong>in</strong> Brazil, calculated<strong>the</strong> ICB for six <strong>the</strong>rmal power plants us<strong>in</strong>g different fuels, us<strong>in</strong>g <strong>in</strong>ternal rate <strong>of</strong> return (IRR) rang<strong>in</strong>gfrom 10% to 16% and apply<strong>in</strong>g three PLD matrices <strong>in</strong> <strong>the</strong> calculations <strong>of</strong> physical security, COP and CEC.Matrices for 2007 and 2008 were based on PDEs 2006-2015 and 2007-2016, and were used to calculate<strong>the</strong> COP and CEC <strong>in</strong> <strong>the</strong> auctions for new energy <strong>in</strong> 2007 and 2008, respectively. The Marg<strong>in</strong>al Cost <strong>of</strong>System Expansion (CME) matrix corresponds to <strong>the</strong> use <strong>in</strong> COP and CEC calculations <strong>of</strong> <strong>the</strong> same PLD valuesused <strong>in</strong> <strong>the</strong> calculation <strong>of</strong> <strong>the</strong> physical security <strong>of</strong> generators.The first <strong>of</strong> <strong>the</strong>se generators is a 50 MW cogeneration plant burn<strong>in</strong>g sugarcane bagasse. It would be built<strong>in</strong> <strong>the</strong> Sou<strong>the</strong>ast, with a null variable cost per unit (CVU) and completely <strong>in</strong>flexible operation. Two 350 MWplants would be built near Brazilian coal m<strong>in</strong>es, one <strong>in</strong> Rio Grande do Sul and <strong>the</strong> o<strong>the</strong>r <strong>in</strong> Santa Catar<strong>in</strong>a.Each has an Equivalent Forced Outage Rate (TEIF) <strong>of</strong> 7.5% and scheduled outages (IP) <strong>of</strong> 8.5%. The CVU <strong>of</strong><strong>the</strong> Rio Grande do Sul plant is R$48.10 per MWh and <strong>the</strong> degree <strong>of</strong> <strong>in</strong>flexibility is 60%, while <strong>the</strong> CVU <strong>of</strong><strong>the</strong> Santa Catar<strong>in</strong>a plant is 50% higher at R$72.60, but <strong>the</strong> degree <strong>of</strong> <strong>in</strong>flexibility is smaller. The fourth plantis also coal-fired with <strong>in</strong>stalled capacity <strong>of</strong> 350 MW, but would be built <strong>in</strong> <strong>the</strong> Nor<strong>the</strong>ast burn<strong>in</strong>g importedcoal. It has TEIF <strong>of</strong> 3.5%, IP <strong>of</strong> 5.5%, and CVU <strong>of</strong> R$83.81/MWh. The <strong>in</strong>stalled capacity <strong>of</strong> <strong>the</strong> fifth powerplant is also 350 MW, also built <strong>in</strong> <strong>the</strong> Nor<strong>the</strong>ast but burn<strong>in</strong>g fuel oil. Its CVU is R$266.05/MWh with TEIF <strong>of</strong>1% and IP <strong>of</strong> 2%. F<strong>in</strong>ally, <strong>the</strong> sixth plant is a 500 MW LNG-fired station located <strong>in</strong> <strong>the</strong> Sou<strong>the</strong>ast, with CVU<strong>of</strong> R$172.20, TEIF <strong>of</strong> 2.2%, and IP <strong>of</strong> 6.3%. These last three plants have 100% flexible operation.The physical guarantees calculated for <strong>the</strong> plants are: biomass, 17 MW av; Rio Grande do Sul coal, 298 MWav; Santa Catar<strong>in</strong>a coal, 298 MW av; imported coal, 300 MW av; fuel oil, 174 MW av; and natural gas, 315MW av.The same conditions for BNDES f<strong>in</strong>anc<strong>in</strong>g were applied to <strong>the</strong> six power plants <strong>in</strong> <strong>the</strong> form <strong>of</strong> Project F<strong>in</strong>anc<strong>in</strong>goperations.These simulations performed by Wise Systems show just how much <strong>the</strong> ICB <strong>of</strong> <strong>the</strong>rmoelectric plants variesaccord<strong>in</strong>g to <strong>the</strong> desired IRR, and most importantly <strong>the</strong> PLD matrix adopted. Among <strong>the</strong> <strong>the</strong>rmoelectric andcogeneration plants simulated, <strong>the</strong> most competitive consume imported coal and sugarcane bagasse.By work<strong>in</strong>g with static configurations for both demand and supply, <strong>the</strong> marg<strong>in</strong>alist methodology employedby <strong>the</strong> EPE does not provide good estimates <strong>of</strong> <strong>the</strong> physical security <strong>of</strong> <strong>the</strong> power plants, <strong>in</strong> particular
300 Ethanol and Bioelectricity <strong>Sugarcane</strong> <strong>in</strong> <strong>the</strong> <strong>Future</strong> <strong>of</strong> <strong>the</strong> <strong>Energy</strong> <strong>Matrix</strong>for <strong>the</strong>rmoelectrics, ei<strong>the</strong>r for <strong>the</strong> period <strong>of</strong> <strong>the</strong>ir ACR contracts or for <strong>the</strong>ir economic life (Bajay, 2009b).Castro, Brandão and Dantas (2009) demonstrate that this methodology has underestimated <strong>the</strong> physicalguarantee <strong>of</strong> <strong>the</strong> biomass power plants and overestimated <strong>the</strong> physical guarantee <strong>of</strong> <strong>the</strong>rmoelectric plantswith high CVU, such as those us<strong>in</strong>g imported coal, LNG and fuel oil.7 Policy, plann<strong>in</strong>g, and regulation7.1 The market for vehicle fuelsUntil <strong>the</strong> mid 1990s, Brazil was very dependent on imported petroleum and derivatives. By 2007 <strong>the</strong> countrywas consum<strong>in</strong>g 32.7 million m 3 <strong>of</strong> diesel oil and 32.5 million m 3 <strong>of</strong> gasol<strong>in</strong>e equivalent, count<strong>in</strong>g fuelsused <strong>in</strong> Otto Cycle light vehicles: gasol<strong>in</strong>e, ethanol, and natural gas. In that same year Brazil exported 3.5million m 3 <strong>of</strong> ethanol and 3.7 million m 3 <strong>of</strong> gasol<strong>in</strong>e while import<strong>in</strong>g 3.3 million m 3 <strong>of</strong> diesel. Divid<strong>in</strong>g <strong>the</strong>Brazilian transportation sector between light vehicles, essentially for personal use, and commercial vehiclesfor cargo and passenger transport powered by diesel eng<strong>in</strong>es, has proved to be efficient and allowed for<strong>the</strong> adoption <strong>of</strong> tax differentials to favor economic activities.The last 40 years have seen important changes <strong>in</strong> <strong>the</strong> relative participation <strong>of</strong> fuels used by light vehicles,because <strong>of</strong> supply restrictions, governmental policy changes and technological <strong>in</strong>novation. Gasol<strong>in</strong>e consumptionhas fallen steadily s<strong>in</strong>ce <strong>the</strong> <strong>in</strong>crease <strong>in</strong> <strong>the</strong> ethanol participation <strong>in</strong> 1979, reach<strong>in</strong>g its lowest po<strong>in</strong>t<strong>in</strong> 1988. It <strong>in</strong>creased aga<strong>in</strong> until 2006 and has stabilized s<strong>in</strong>ce <strong>the</strong>n. The market for hydrous ethanol moved<strong>the</strong> opposite direction: consumption <strong>in</strong>creased from 1979, to a peak <strong>in</strong> 1989, <strong>the</strong>n decreased until 2004,when it started grow<strong>in</strong>g aga<strong>in</strong> with <strong>the</strong> <strong>in</strong>troduction <strong>of</strong> flex-fuel eng<strong>in</strong>es and attractive prices. Data for anhydrousethanol are less precise. To a certa<strong>in</strong> extent it has tracked <strong>the</strong> gasol<strong>in</strong>e market, but is also subject to<strong>the</strong> variations between 20% to 25% <strong>of</strong> <strong>the</strong> ethanol blend <strong>in</strong> gasol<strong>in</strong>e, accord<strong>in</strong>g to short-term governmentpolicies. Mak<strong>in</strong>g this market even more complex, CNG use started <strong>in</strong> 1991 and today serves a fleet <strong>of</strong> 1.6million vehicles, account<strong>in</strong>g for 9% <strong>of</strong> light vehicle fuel consumption <strong>in</strong> 2007.It is important to note that <strong>the</strong> current option for ethanol <strong>in</strong> flex-fuel vehicles is a result <strong>of</strong> direct pricecompetition: when ethanol costs 70% <strong>of</strong> gasol<strong>in</strong>e, or less, <strong>the</strong>n ethanol is preferred. The cost <strong>of</strong> sugarcaneethanol based on factors <strong>of</strong> production is between US$0.35 and US$0.41 per liter, which corresponds topetroleum at between US$60 and US$72 per barrel.It could be said that, if <strong>the</strong> current scenario for <strong>the</strong> consumer prices <strong>of</strong> gasol<strong>in</strong>e and hydrous ethanol rema<strong>in</strong>sunchanged, <strong>the</strong>n <strong>the</strong> vast majority <strong>of</strong> vehicles with flex-fuel eng<strong>in</strong>es will cont<strong>in</strong>ue to run ma<strong>in</strong>ly onethanol. Huge private <strong>in</strong>vestments to expand ethanol production capacity are be<strong>in</strong>g made to ensure <strong>the</strong>necessary supply. Ano<strong>the</strong>r factor that will tend to ma<strong>in</strong>ta<strong>in</strong> and even expand ethanol participation <strong>in</strong> <strong>the</strong>fuel matrix is <strong>the</strong> prospect <strong>of</strong> significant future productivity ga<strong>in</strong>s for ethanol, even <strong>in</strong>clud<strong>in</strong>g an <strong>in</strong>crease <strong>in</strong><strong>the</strong> surplus electricity. However, it is possible that <strong>the</strong> demand for ethanol will be seriously affected if wrongpolicies are implemented, or if <strong>the</strong>re is a lack <strong>of</strong> clear policies for <strong>the</strong> energy market to ma<strong>in</strong>ta<strong>in</strong> a balanced
Ethanol <strong>in</strong> <strong>the</strong> Brazilian <strong>Energy</strong> <strong>Matrix</strong>301use <strong>of</strong> bi<strong>of</strong>uels, promot<strong>in</strong>g <strong>the</strong> consumption <strong>of</strong> gasol<strong>in</strong>e <strong>in</strong> flex-fuel eng<strong>in</strong>es and <strong>the</strong> use <strong>of</strong> diesel vehicles<strong>in</strong> <strong>the</strong> current Otto Cycle market.7.2 A law for liquid bi<strong>of</strong>uelsAfter decades <strong>of</strong> pioneer development <strong>of</strong> a renewable energy market <strong>in</strong> Brazil, where two bi<strong>of</strong>uels, ethanoland biodiesel, are now widely used, it is important to evaluate <strong>the</strong> new perspectives created by <strong>the</strong>substantial <strong>in</strong>crease <strong>in</strong> <strong>the</strong> country’s proven oil reserves and production through 2020. There are plansto expand oil ref<strong>in</strong><strong>in</strong>g capacity by around 1.36 million BOPD by 2014, thus <strong>in</strong>creas<strong>in</strong>g <strong>the</strong> country’s 2008ref<strong>in</strong><strong>in</strong>g capacity by 67% to m<strong>in</strong>imize exports <strong>of</strong> crude oil and add value to domestic crude. Accord<strong>in</strong>g togovernment plans <strong>the</strong>re will thus be large exportable surpluses <strong>of</strong> gasol<strong>in</strong>e and diesel start<strong>in</strong>g 2017. Theseexports will <strong>of</strong> course depend on foreign markets, so we should consider <strong>the</strong> risk that domestic production<strong>of</strong> fossil fuel will be directed to <strong>the</strong> domestic market, <strong>in</strong> particular for light vehicles with flex-fuel eng<strong>in</strong>es,promot<strong>in</strong>g gasol<strong>in</strong>e consumption and divert<strong>in</strong>g demand from hydrous ethanol.This outlook f<strong>in</strong>ds <strong>the</strong> sugarcane agribus<strong>in</strong>ess today weakened by successive harvests <strong>of</strong> low pr<strong>of</strong>itability,experienc<strong>in</strong>g an alarm<strong>in</strong>g crisis <strong>of</strong> economic decl<strong>in</strong>e, as portrayed by Conab (2009). Ethanol production hasbecome <strong>the</strong> overrid<strong>in</strong>g goal <strong>of</strong> <strong>the</strong> sugarcane <strong>in</strong>dustry dur<strong>in</strong>g <strong>the</strong> past decade. However, with <strong>the</strong> advent<strong>of</strong> flex-fuel vehicles <strong>the</strong> domestic market for ethanol has been determ<strong>in</strong>ed by gasol<strong>in</strong>e prices, which arefixed <strong>in</strong> a very non-transparent manner and are subject to possible cont<strong>in</strong>gencies, while <strong>the</strong> export marketrema<strong>in</strong>s largely blocked by high protectionist barriers. It is important that energy policies focus on <strong>the</strong> differentialbenefits <strong>of</strong> bi<strong>of</strong>uels and re-establish strategies that allowed <strong>the</strong>ir development to current levels.Without this, <strong>the</strong> best scenarios presented above may never be more than just good <strong>in</strong>tentions.In this context, it is important to correct a deficiency: ethanol has been used for decades <strong>in</strong> Brazil, but<strong>the</strong>re is no specific law to regulate its market, like those that exist <strong>in</strong> various countries that have sought toencourage <strong>the</strong> use <strong>of</strong> ethanol and biodiesel. In addition to general objectives such as stimulat<strong>in</strong>g productive<strong>in</strong>vestment, promot<strong>in</strong>g a level play<strong>in</strong>g field with defense <strong>of</strong> free competition, and ensur<strong>in</strong>g <strong>the</strong> flow <strong>of</strong><strong>in</strong>formation, a specific law could:. Consolidate exist<strong>in</strong>g legislation, above all with respect to <strong>the</strong> decision-mak<strong>in</strong>g cha<strong>in</strong>, <strong>the</strong> conditions and<strong>in</strong>struments for monitor<strong>in</strong>g <strong>the</strong> market and <strong>the</strong> authorization <strong>of</strong> agents. For example, <strong>the</strong> Interm<strong>in</strong>isterialCouncil for Sugar and Ethanol (CIMA), today responsible for def<strong>in</strong><strong>in</strong>g public policies relat<strong>in</strong>g to ethanol,should receive enhanced status and have its coord<strong>in</strong>ation functions streng<strong>the</strong>ned.. Clearly def<strong>in</strong>e <strong>the</strong> tax structure for bi<strong>of</strong>uels, tak<strong>in</strong>g <strong>in</strong>to account externalities and establish<strong>in</strong>g mechanismsto susta<strong>in</strong> competitiveness <strong>in</strong> volatile scenarios, possibly via <strong>the</strong> flexible arbitration <strong>of</strong> taxes. In this sense,<strong>the</strong> CIDE tax levied on <strong>the</strong> sale <strong>of</strong> petroleum derivatives should have its procedures for application andrate adjustment redef<strong>in</strong>ed.. Establish mechanisms for regular support <strong>of</strong> research and development activities with<strong>in</strong> <strong>the</strong> sugar and ethanolsector, with for example <strong>the</strong> establishment <strong>of</strong> a sector-specific fund to f<strong>in</strong>ance basic and applied studies.
302 Ethanol and Bioelectricity <strong>Sugarcane</strong> <strong>in</strong> <strong>the</strong> <strong>Future</strong> <strong>of</strong> <strong>the</strong> <strong>Energy</strong> <strong>Matrix</strong>7.3 The <strong>the</strong>rmoelectricity market and <strong>the</strong> opportunities for bioelectricitySome important observations need to be made about current conditions <strong>in</strong> <strong>the</strong> wholesale electricity market<strong>in</strong> Brazil, <strong>in</strong>dicat<strong>in</strong>g <strong>the</strong> need for changes (Bajay, 2009b):. There is no convergence between <strong>the</strong> policy to prioritize new medium and large hydroelectric plants and<strong>the</strong> environmental policies <strong>of</strong> <strong>the</strong> federal and state governments. In this context, it is unlikely that <strong>the</strong>growth <strong>in</strong> supply from new dams projected <strong>in</strong> <strong>the</strong> 2008-2017 Ten Year Expansion Plan (PDE) and <strong>the</strong> 2030National <strong>Energy</strong> Plan (PNE) will materialize.. Most new hydroelectric plants will be run-<strong>of</strong>-river, so reduc<strong>in</strong>g <strong>the</strong> capacity for multi-year regularization<strong>of</strong> large reservoirs that exists <strong>in</strong> <strong>the</strong> current Brazilian hydro<strong>the</strong>rmal system and requir<strong>in</strong>g <strong>the</strong> <strong>in</strong>stallationand <strong>in</strong>creas<strong>in</strong>g dispatch <strong>of</strong> <strong>the</strong>rmoelectric plants for complementation. The projected growth <strong>in</strong> <strong>the</strong> share<strong>of</strong> <strong>the</strong>rmal power plants and perhaps renewable alternatives such as w<strong>in</strong>d and small hydro are underestimated<strong>in</strong> <strong>the</strong> 2008-2017 PDE and <strong>the</strong> 2030 PNE.. Rules for calculat<strong>in</strong>g prices, <strong>in</strong> auctions for new energy, have favored <strong>the</strong> contract<strong>in</strong>g <strong>of</strong> <strong>the</strong>rmoelectricplants that have high variable unit cost, such as fuel oil, liquefied natural gas and imported coal. These,<strong>in</strong> turn, lead to higher electricity rates when <strong>the</strong>y are dispatched. These rates are much higher than <strong>the</strong>average predicted <strong>in</strong> EPE simulations. They also cause a significant <strong>in</strong>crease <strong>in</strong> emissions.Changes are required <strong>in</strong> <strong>the</strong> methodology for calculat<strong>in</strong>g <strong>the</strong> <strong>the</strong>rmoelectric ICB. Accord<strong>in</strong>g to Bajay (2009b)changes must take <strong>in</strong>to account: conditions for dispatch outside <strong>the</strong> order <strong>of</strong> merit used by <strong>the</strong> NationalSystem Operator (ONS); <strong>the</strong> grow<strong>in</strong>g capacity factor <strong>of</strong> <strong>the</strong>se plants throughout <strong>the</strong> period <strong>of</strong> <strong>the</strong>ir supplycontracts; and improvements <strong>in</strong> <strong>the</strong> calculation <strong>of</strong> physical guarantees (FG) for biomass plants that havezero variable cost per unit (CVU) and for plants like imported coal and fuel oil with high CVU.Also accord<strong>in</strong>g to Bajay (2009b), <strong>the</strong> M<strong>in</strong>es and <strong>Energy</strong> M<strong>in</strong>istry (MME) needs to implement long-term policiesthat lead to <strong>the</strong> gradual <strong>in</strong>troduction <strong>of</strong>:i Thermoelectric plants and cogeneration units that supply <strong>the</strong> National Interconnected System (SIN) at <strong>the</strong>base <strong>of</strong> <strong>the</strong> load curve with non-renewable resources whose CVU is not very high (nuclear, domestic coal,and cogeneration with natural gas);ii Power plants us<strong>in</strong>g renewable sources that complement hydropower dur<strong>in</strong>g <strong>the</strong> dry season (such as cogenerationplants burn<strong>in</strong>g sugarcane bagasse <strong>in</strong> <strong>the</strong> Sou<strong>the</strong>ast and Midwest), or that supply <strong>the</strong> base <strong>of</strong> <strong>the</strong>load curve (small hydro and cogeneration plants burn<strong>in</strong>g waste biomass, <strong>in</strong>clud<strong>in</strong>g sugarcane waste).iii Parameters that are standardized for technology and fuel, and reflect <strong>the</strong> costs and socio-environmentalbenefits <strong>of</strong> <strong>the</strong> various generation options <strong>in</strong> <strong>the</strong> calculation <strong>of</strong> <strong>the</strong> ICB. This is a better solution than establish<strong>in</strong>genvironmental compensation for coal or fuel oil, as determ<strong>in</strong>ed by Instruction No. 7 <strong>of</strong> April 13,2009 from <strong>the</strong> Brazilian Institute <strong>of</strong> <strong>the</strong> Environment and Renewable Natural Resources (IBAMA).As for Pro<strong>in</strong>fa, it would be appropriate for <strong>the</strong> market shares established for each alternative electricitysource (small hydro, biomass, w<strong>in</strong>d) to take <strong>in</strong>to account targets associated with environmental policies,
Ethanol <strong>in</strong> <strong>the</strong> Brazilian <strong>Energy</strong> <strong>Matrix</strong>303costs and available volumes, plus <strong>the</strong> capacity <strong>of</strong> local manufacture (or <strong>the</strong> <strong>in</strong>terest to promote it). It isimportant for <strong>the</strong> program to <strong>in</strong>clude <strong>in</strong>centives to reduce <strong>the</strong> cost <strong>of</strong> energy produced by participat<strong>in</strong>gfacilities, someth<strong>in</strong>g that could be achieved by means <strong>of</strong> specific auctions, or by mak<strong>in</strong>g Renewable <strong>Energy</strong>Certificates tradable, as foreseen for <strong>the</strong> second phase <strong>of</strong> <strong>the</strong> program (Bajay, 2009b ).Specifically, a policy and targets for promot<strong>in</strong>g <strong>the</strong> generation <strong>of</strong> electricity from sugarcane waste couldbe implemented by restructur<strong>in</strong>g Pro<strong>in</strong>fa, or through a new law, establish<strong>in</strong>g <strong>the</strong> legal basis <strong>of</strong> a regulatoryframework for bi<strong>of</strong>uels <strong>in</strong> Brazil.8 Options for evolution <strong>of</strong> <strong>the</strong> Brazilian energy matrixUntil <strong>the</strong> 1960s, <strong>the</strong> plann<strong>in</strong>g for expansion <strong>of</strong> energy systems <strong>in</strong> <strong>the</strong> world was essentially sectoral, and <strong>the</strong>sectors <strong>in</strong>volved were electricity, oil and gas, plus coal <strong>in</strong> some countries. Plann<strong>in</strong>g was on <strong>the</strong> supply side,and <strong>the</strong> challenge for project<strong>in</strong>g energy demand was to try to capture <strong>the</strong> key market trends.The oil price shocks <strong>of</strong> 1973 and 1979 showed <strong>the</strong> need to also plan <strong>the</strong> demand side through energy conservationprograms, tariffs that vary by time and season, <strong>in</strong>terruptible tariffs, and so on.Multisectoral actions focus<strong>in</strong>g on both supply and demand were developed <strong>in</strong> <strong>the</strong> second half <strong>of</strong> <strong>the</strong> 1970sand <strong>the</strong> first half <strong>of</strong> <strong>the</strong> 1980s. The ma<strong>in</strong> motivation was to f<strong>in</strong>d options to reduce <strong>the</strong> dependence onpetroleum derivatives and <strong>in</strong>crease energy supply security us<strong>in</strong>g local sources, or fail<strong>in</strong>g that us<strong>in</strong>g externalsources that were less volatile than petroleum.The decl<strong>in</strong>e and subsequent stabilization <strong>in</strong> oil prices s<strong>in</strong>ce <strong>the</strong> mid-1980s put a partial brake on this process.However, grow<strong>in</strong>g concern about <strong>the</strong> environmental impacts <strong>of</strong> <strong>the</strong> energy <strong>in</strong>dustry – acid ra<strong>in</strong>, smog,<strong>the</strong> ozone layer and <strong>the</strong> greenhouse effect – has reawakened <strong>in</strong>terest <strong>in</strong> <strong>the</strong> use <strong>of</strong> <strong>the</strong>se more comprehensiveapproaches.Concern over <strong>the</strong> <strong>in</strong>creased use <strong>of</strong> renewables <strong>in</strong> <strong>the</strong> energy matrix <strong>of</strong> most countries was quite strong <strong>in</strong><strong>the</strong> 1970s. It lost importance through <strong>the</strong> next two decades and <strong>the</strong>n returned with force <strong>in</strong> <strong>the</strong> first decade<strong>of</strong> this century.The 1990s showed that <strong>the</strong>re can be competition <strong>in</strong> some markets that were once considered to be naturalmonopolies. That decade also saw several important players <strong>in</strong> <strong>the</strong> energy <strong>in</strong>dustry start to globalization<strong>the</strong>ir activities, not just geographically but also between market sectors. The rigid boundaries between <strong>the</strong>electricity, petroleum and natural gas sectors began to collapse.Renewable energy sources are be<strong>in</strong>g promoted <strong>in</strong> <strong>the</strong> current decade <strong>in</strong> most countries, with many plac<strong>in</strong>ga special emphasis on bi<strong>of</strong>uels, <strong>in</strong> particular ethanol and biodiesel.
304 Ethanol and Bioelectricity <strong>Sugarcane</strong> <strong>in</strong> <strong>the</strong> <strong>Future</strong> <strong>of</strong> <strong>the</strong> <strong>Energy</strong> <strong>Matrix</strong>Whatever <strong>the</strong> degree <strong>of</strong> importance that each country gives to plann<strong>in</strong>g its energy matrix, this matrix nownormally <strong>in</strong>cludes <strong>the</strong> entire energy <strong>in</strong>dustry and <strong>in</strong>cludes actions on both <strong>the</strong> supply and demand sides.Plann<strong>in</strong>g for <strong>the</strong> evolution <strong>of</strong> this matrix is a problem that <strong>in</strong>volves multiple objectives, among which wecan highlight:i meet<strong>in</strong>g energy requirements at reasonable costs;ii diversification <strong>of</strong> energy sources and supplies <strong>in</strong> order to reduce <strong>the</strong> risks <strong>of</strong> shortages and m<strong>in</strong>imize <strong>the</strong>market power <strong>of</strong> some major suppliers; andiii m<strong>in</strong>imize negative environmental and social impacts. As with any issue <strong>in</strong>volv<strong>in</strong>g conflict<strong>in</strong>g goals,compromise solutions must be sought. Renewable energy sources <strong>in</strong> general, and <strong>the</strong> more competitive <strong>of</strong><strong>the</strong>se <strong>in</strong> particular, play a key role <strong>in</strong> f<strong>in</strong>d<strong>in</strong>g <strong>the</strong>se solutions.Brazil has several options for <strong>in</strong>creas<strong>in</strong>g its energy supply us<strong>in</strong>g its own sources. Few countries are endowedwith such a diversity and availability <strong>of</strong> natural resources that can be used as fuel or to generate electricity.In fact, analyz<strong>in</strong>g <strong>the</strong> historical data available <strong>in</strong> <strong>the</strong> National <strong>Energy</strong> Balance, we can see that Brazil diversifiedits energy sources from 1970 to 2007. Accord<strong>in</strong>g to projections <strong>in</strong> <strong>the</strong> 2030 National <strong>Energy</strong> Plan (PNE2030), this diversification should cont<strong>in</strong>ue to <strong>in</strong>crease through 2030.On <strong>the</strong> o<strong>the</strong>r hand, <strong>the</strong> share <strong>of</strong> renewable sources <strong>in</strong> domestic energy supply decl<strong>in</strong>ed from 57.7% <strong>in</strong> 1970to 45.9% <strong>in</strong> 2007 and, accord<strong>in</strong>g to projections <strong>in</strong> <strong>the</strong> 2030 PNE, is expected to decrease fur<strong>the</strong>r to 44.7%through 2030. Although renewable sources <strong>in</strong> 2007 provided a share <strong>of</strong> <strong>the</strong> Brazilian energy matrix thatwas far higher than <strong>the</strong> global average <strong>of</strong> 12.9%, Brazil is never<strong>the</strong>less mov<strong>in</strong>g <strong>in</strong> <strong>the</strong> opposite direction tomost o<strong>the</strong>r countries that are adopt<strong>in</strong>g a series <strong>of</strong> policies to encourage <strong>in</strong>creas<strong>in</strong>g participation <strong>of</strong> renewablesources <strong>in</strong> <strong>the</strong>ir energy matrices.One <strong>of</strong> <strong>the</strong> ma<strong>in</strong> goals <strong>of</strong> recent policies to promote renewable energy worldwide has been reduc<strong>in</strong>g <strong>the</strong>negative environmental impacts <strong>of</strong> produc<strong>in</strong>g and consum<strong>in</strong>g energy, particularly by reduc<strong>in</strong>g emissions<strong>of</strong> gases that cause global warm<strong>in</strong>g. In Brazil, <strong>the</strong> opposite has happened <strong>in</strong> recent years, particularly afterrecent auctions for new energy where <strong>the</strong> w<strong>in</strong>ners have <strong>of</strong>fered substantial capacity from <strong>the</strong>rmoelectricstations burn<strong>in</strong>g fuel oil and coal, with high pollution potential.The marg<strong>in</strong>al costs <strong>of</strong> supply for major fuels and electricity <strong>in</strong> Brazil have been shown to be <strong>in</strong>creas<strong>in</strong>g <strong>in</strong>recent years. In addition, <strong>the</strong>re are currently many uncerta<strong>in</strong>ties about <strong>the</strong> unit costs <strong>of</strong> production from varioussources and/or technologies, such as oil and natural gas from <strong>the</strong> newly-discovered sub-salt oil fields,biodiesel, nuclear power plants, <strong>the</strong>rmoelectric plants burn<strong>in</strong>g domestic coal, and o<strong>the</strong>rs. These uncerta<strong>in</strong>tiescan be sensed when read<strong>in</strong>g <strong>the</strong> 2008-2017 Ten-Year <strong>Energy</strong> Plan (PDE 2008-2017) and, <strong>in</strong> particular, <strong>the</strong>2030 PNE. To m<strong>in</strong>imize <strong>the</strong> cost <strong>of</strong> energy supply, <strong>the</strong> Brazilian government should <strong>the</strong>refore encourage <strong>the</strong>expansion <strong>of</strong> energy sources that exhibit low unit costs <strong>of</strong> production such as hydroelectric plants – bothlarge and small – and ethanol. These are sources where Brazil enjoys major competitive advantages.
Ethanol <strong>in</strong> <strong>the</strong> Brazilian <strong>Energy</strong> <strong>Matrix</strong>305Brazil has made progress <strong>in</strong> its energy plann<strong>in</strong>g <strong>in</strong> recent years, with <strong>the</strong> creation <strong>of</strong> <strong>the</strong> <strong>Energy</strong> ResearchCompany (EPE). This prepares 10-year and long-term plans for <strong>the</strong> M<strong>in</strong>istry <strong>of</strong> M<strong>in</strong>es and <strong>Energy</strong> (MME).Additional progress, however, today faces a significant barrier, which is <strong>the</strong> lack <strong>of</strong> long-term energy policies.These still need to be decided by <strong>the</strong> competent agency with<strong>in</strong> <strong>the</strong> federal adm<strong>in</strong>istration, which is <strong>the</strong>National <strong>Energy</strong> Policy Council (CNPE), chaired by <strong>the</strong> M<strong>in</strong>ister <strong>of</strong> M<strong>in</strong>es and <strong>Energy</strong> and with <strong>the</strong> participation<strong>of</strong> <strong>the</strong> m<strong>in</strong>isters pr<strong>in</strong>cipally affected by energy policy.The country faces two major options for <strong>the</strong> future development <strong>of</strong> its energy matrix. If current energypolicies are ma<strong>in</strong>ta<strong>in</strong>ed – most <strong>of</strong> which have short or medium-term horizons, and with <strong>the</strong> operat<strong>in</strong>g rules<strong>of</strong> <strong>the</strong> fuels and electricity markets currently <strong>in</strong> force – <strong>the</strong> tendency will be for <strong>the</strong> share <strong>of</strong> renewables <strong>in</strong><strong>the</strong> domestic energy supply to fall even more than predicted <strong>in</strong> <strong>the</strong> 2030 PNE. Discount<strong>in</strong>g very optimisticassumptions regard<strong>in</strong>g <strong>the</strong> growth <strong>of</strong> some renewable sources, such as electricity generation <strong>in</strong> large hydropowerplants, this plan did not take <strong>in</strong>to account <strong>the</strong> new oil and natural gas reserves <strong>in</strong> <strong>the</strong> sub-saltfields.On <strong>the</strong> o<strong>the</strong>r hand, if <strong>the</strong> Brazilian government wants to reverse this situation, start<strong>in</strong>g to consistently andcont<strong>in</strong>uously promote renewable energy sources, especially <strong>the</strong> most competitive such as ethanol, it mustestablish policies and long-term goals that provide orientation for new plann<strong>in</strong>g exercises. These goalsshould reflect <strong>the</strong> benefits that can be <strong>of</strong>fered by <strong>the</strong>se sources, <strong>in</strong>clud<strong>in</strong>g environmental, social (job creation),technological development (for example second generation ethanol) and cheaper energy supply.In <strong>the</strong> case <strong>of</strong> bi<strong>of</strong>uels, specific legislation with a long-term perspective, like that <strong>of</strong> <strong>the</strong> United States,would be a next step after <strong>the</strong> recent natural gas legislation that has already been approved by Congress,and <strong>the</strong> legislation proposed for oil and gas prospect<strong>in</strong>g and production <strong>in</strong> <strong>the</strong> sub-salt fields <strong>of</strong>f <strong>the</strong> Braziliancoast. This could ensure <strong>the</strong> harmonious future development <strong>of</strong> production, consumption and export<strong>of</strong> bi<strong>of</strong>uels, side by side with <strong>the</strong>ir fossil competitors.Conditions <strong>in</strong> <strong>the</strong> fuel market are now quite different from those perta<strong>in</strong><strong>in</strong>g <strong>in</strong> 1970, when Brazil regulated<strong>the</strong> <strong>in</strong>troduction <strong>of</strong> hydrous ethanol. Today, <strong>the</strong> market is diversified, with large volumes. It <strong>of</strong>fers social andenvironmental benefits, with demand stimulated by <strong>the</strong> flexibility <strong>of</strong> fuel choice.Given <strong>the</strong> new realities and demands, and to serve <strong>the</strong> <strong>in</strong>terests <strong>of</strong> society, it is essential to ensure <strong>the</strong> susta<strong>in</strong>ability<strong>of</strong> bi<strong>of</strong>uels <strong>in</strong> Brazil, a country whose energy matrix should cont<strong>in</strong>ue to <strong>in</strong>corporate a significantshare <strong>of</strong> renewable sources.
306 Ethanol and Bioelectricity <strong>Sugarcane</strong> <strong>in</strong> <strong>the</strong> <strong>Future</strong> <strong>of</strong> <strong>the</strong> <strong>Energy</strong> <strong>Matrix</strong>Bibliography. Anfavea, Carta da Anfavea – June 2009, Associação Nacional dos Fabricantes de Veículos Automotores – Anfavea,São Paulo, 2009.. ANP, Anuário Estatístico 2008, Agência Nacional do Petróleo, Gás Natural e Biocombustíveis – ANP, Rio de Janeiro,2008.. ANP, Resultados dos leilões de biodiesel, Agência Nacional de Petróleo, Gás Natural e Biocombustíveis, available athttp://www.anp.gov.br/biodiesel/leiloes.asp, June 2009a.. ANP, Preços dos combustíveis, Agência Nacional do Petróleo, Gás Natural e Biocombustíveis, several l<strong>in</strong>ks at http://www.anp.gov.br/<strong>in</strong>dex.asp, June 2009b.. ANP, Preços dos derivados: Produtores, Agência Nacional de Petróleo, Gás Natural e Biocombustíveis, available athttp://www.anp.gov.br/petro/produtores.asp, June 2009c.. Bajay, S. V., Carvão m<strong>in</strong>eral e urânio, Nota Técnica para a União da Indústria de Cana-de-açúcar, NúcleoInterdiscipl<strong>in</strong>ar de Planejamento Energético (Nipe), Universidade Estadual de Camp<strong>in</strong>as – Unicamp, Camp<strong>in</strong>as, SP,June 2009a.. Bajay, S. V., Geração termelétrica, Nota Técnica para a União da Indústria de Cana-de-açúcar, Núcleo Interdiscipl<strong>in</strong>arde Planejamento Energético – NIPE, Universidade Estadual de Camp<strong>in</strong>as – Unicamp, Camp<strong>in</strong>as, SP, August 2009b.. BC, Taxas de Câmbio, Banco Central do Brasil, available at http://www.bancocentral.gov.br/?TXCAMBIO, June 2009.. BNDES, Bioetanol de cana-de-açúcar: energia para o desenvolvimento sustentável. Rio de Janeiro, Banco Nacional deDesenvolvimento Econômico e Social, 2008.. Castro, N. J., Brandão, R. and Dantas, G. A., A competitividade da bioeletricidade e a metodologia dos leilões deenergia nova, Grupo de Estudos do Setor Elétrico (Gesel), Universidade Federal do Rio de Janeiro, Rio de Janeiro, RJ,2009.. Conab, Os Fundamentos da Crise do Setor Sucroalcooleiro no Brasil, Companhia Nacional de Abastecimento,Super<strong>in</strong>tendência de Informações do Agronegócio, Brasília, September 2009.. EIA, Petroleum Statistics, <strong>Energy</strong> Information Adm<strong>in</strong>istration, Department <strong>of</strong> <strong>Energy</strong>, available at http://www.eia.doe.gov/oil_gas/petroleum/<strong>in</strong>fo_glance/petroleum.html, May 2009.. Embrapa Solos, Zoneamento Agroecológico da Cana-de-Açúcar, Centro Nacional de Pesquisa de Solos, Documento110, Rio de Janeiro, 2009.. EPE/MME, Plano Nacional de Energia 2030, Empresa de Pesquisa Energética (EPE), M<strong>in</strong>istério de M<strong>in</strong>as e Energia,Brasília, DF, 2007.. EPE/MME, Balanço Energético Nacional 2008, Empresa de Pesquisa Energética (EPE), M<strong>in</strong>istério de M<strong>in</strong>as e Energia,Brasília, DF, 2008.. EPE/MME, Balanço Energético Nacional 2009 (resultados prelim<strong>in</strong>ares), Empresa de Pesquisa Energética (EPE),M<strong>in</strong>istério de M<strong>in</strong>as e Energia, Brasília, DF, 2009a.. EPE/MME, Plano Decenal de Expansão de Energia 2008/2017, Empresa de Pesquisa Energética (EPE), M<strong>in</strong>istério deM<strong>in</strong>as e Energia, Brasília, DF, 2009b.. Folha do GNV – June 2009, GNV GROUP, Rio de Janeiro, 2009. www.ngvgroup.com. July 16, 2009.. IEA, Medium-Term Oil Market Report, International <strong>Energy</strong> Agency – IEA, 2009. URL: http://www.iea.org, accessed6/29/2009.
Ethanol <strong>in</strong> <strong>the</strong> Brazilian <strong>Energy</strong> <strong>Matrix</strong>307. Macedo, I.C., Seabra, J., Silva, J.E.A.R., “Greenhouse gases emissions <strong>in</strong> <strong>the</strong> production and use <strong>of</strong> ethanol fromsugarcane <strong>in</strong> Brazil: The 2005/2006 averages and a prediction for 2020”, Biomass and Bioenergy, Vol 32, 2008.. MAPA, Anuário estatístico da agroenergia, M<strong>in</strong>istério da Agricultura, Pecuária e Abastecimento, Brasília, 2009.. Meira Filho e Macedo, Etanol e mudança do clima: a contribuição para o PNMC e as metas para o Pós-Kyoto, NotaTécnica, Projeto Perspectivas para a Matriz Energética Brasileira, UNICA, São Paulo, 2009.. MME, Resenha Energética Brasileira – Exercício de 2008, M<strong>in</strong>istério de M<strong>in</strong>as e Energia, Brasília - MME, 2009.. Mongelli, S. T., Geração Núcleo-Elétrica: Retrospectiva, Situação Atual e Perspectivas Futuras, <strong>the</strong>sis for master’sdegree <strong>in</strong> science, <strong>in</strong> <strong>the</strong> area <strong>of</strong> nuclear technology - reactors, Instituto de Pesquisas Energéticas e Nucleares (IPEN),an <strong>in</strong>stitution associated with <strong>the</strong> Universidade de São Paulo, São Paulo, SP, 2006.. Nassar, A.M., Rudorff, B.F.T., Antoniazzi, L.B., Aguiar, D.A., Bacchi, M.R.P., Adami, M., “Prospects <strong>of</strong> <strong>the</strong> sugarcaneexpansion <strong>in</strong> Brazil: impacts on direct and <strong>in</strong>direct land use changes”, <strong>in</strong> Zuurbier, P. and Vooren, J. (editors),<strong>Sugarcane</strong> ethanol: contributions to climate change mitigation and <strong>the</strong> environment, Wagenigen AcademicPublishers, Wagen<strong>in</strong>gen, 2008.. Nogueira, L. A. H., Biocombustíveis líquidos, Nota Técnica para a União da Indústria de Cana-de-açúcar, Instituto deRecursos Naturais, Universidade Federal de Itajubá – Unifei, September 2009.. Osório, E., Vilela, A. C. F. e Sampaio, C. H., Carvão m<strong>in</strong>eral e coque – viabilização do carvão brasileiro, Nota TécnicaTR05 para o Centro de Gestão e Estudos Estratégicos, Brasília, DF, 2008.. Petrobras, press advisory – Lucro líquido de R$5 bilhões 816 milhões no 1º trimestre de 2009, Rio de Janeiro, 2009.URL: http://petrobras.com.br, accessed 05/25/2009.. S<strong>in</strong>dcomb, 2009, Formação estimada do preço dos combustíveis, S<strong>in</strong>dicato do Comércio Varejista de Combustíveis,Lubrificantes e Lojas de Conveniência do Município do Rio de Janeiro, available at http://www.s<strong>in</strong>dcomb.org.br/economia.php, May 2009.. Sousa, F. J. R., Gás natural, Nota Técnica para a União da Indústria de Cana-de-açúcar, Núcleo Interdiscipl<strong>in</strong>ar dePlanejamento Energético (Nipe), Universidade Estadual de Camp<strong>in</strong>as – Unicamp, Camp<strong>in</strong>as, SP, July 2009a.. Sousa, F. J. R., Petróleo e seus derivados, Nota Técnica para a União da Indústria de Cana-de-açúcar, NúcleoInterdiscipl<strong>in</strong>ar de Planejamento Energético (Nipe), Universidade Estadual de Camp<strong>in</strong>as – Unicamp, Camp<strong>in</strong>as, SP,August 2009b.. Turkemburg, W. C. et alii, “Renewable energy technologies”. In: Goldemberg, J. (ed.), World energy assessment <strong>of</strong><strong>the</strong> United Nations, Chapter 7, New York: UNDP, Undesa/WEC, UNDP, 2000.. UNICA, Evolução do Mercado de etanol e Desenvolvimento Tecnológico do Setor Produtivo, (by Szwarc, A.), XIISimpósio Agro<strong>in</strong>dustrial Internacional da STAB, Sertãoz<strong>in</strong>ho, September 2008.. Wise Systems, A Competitividade do Carvão M<strong>in</strong>eral Nacional na Produção de Energia Elétrica, Relatório Técnico –ABCM/104/08, December 2008.. Zancan, F. L., Carvão m<strong>in</strong>eral & combustível estratégico para o Brasil, presented to <strong>the</strong> Associação Brasileira deCarvão M<strong>in</strong>eral, <strong>in</strong> Tubarão, SC, <strong>in</strong> 02/16/2009.
308 Ethanol and Bioelectricity <strong>Sugarcane</strong> <strong>in</strong> <strong>the</strong> <strong>Future</strong> <strong>of</strong> <strong>the</strong> <strong>Energy</strong> <strong>Matrix</strong>Explanatory NotesiThis refers to Instruction (Portaria) No. 23, <strong>of</strong> June 6, 1994, from <strong>the</strong> now-ext<strong>in</strong>ct National Department <strong>of</strong> Fuels (DNC <strong>in</strong> Portuguese).iiConsider<strong>in</strong>g <strong>the</strong> follow<strong>in</strong>g average consumption <strong>of</strong> vehicles as reported <strong>in</strong> <strong>the</strong> Folha do Gás Natural: CNG (10 km/m³) and hydrous ethanol (7km/liter).iiiSource: www.anp.gov.br, l<strong>in</strong>k “dados estatísticos”.ivSource: www.anp.gov.br/petro/dados_estatisticos.vImportation <strong>of</strong> natural gas from Bolívia started <strong>in</strong> August <strong>of</strong> 1999.viSome authorities and specialists argued at <strong>the</strong> start <strong>of</strong> 2008 that us<strong>in</strong>g natural gas as a vehicle fuel should not be a priority, because it couldbe substituted by o<strong>the</strong>r fuels.viiIf we assume a vehicle scrappage rate <strong>of</strong> 3% a year, <strong>the</strong>n 47,895 vehicles would be scrapped <strong>in</strong> 2009, a quantity that is far greater than <strong>the</strong>number <strong>of</strong> conversions predicted for this period based on extrapolation <strong>of</strong> <strong>the</strong> quantity seen <strong>in</strong> March <strong>of</strong> 2009.viiiThis is <strong>the</strong> MELP model – Long Term Expansion Model (Modelo de Planejamento da Expansão da Geração de Longo Prazo) – that wasdeveloped by <strong>the</strong> Electrical <strong>Energy</strong> Research Center (Cepel) l<strong>in</strong>ked to Eletrobrás.ixThe world ratio <strong>of</strong> reserves to production was equal to 42 years on December 31, 2008 (BP, 2009).xIt should be noted that <strong>the</strong>re is natural gas dissolved <strong>in</strong> <strong>the</strong> petroleum.xiThis total reserve value has been unchanged s<strong>in</strong>ce 1986, <strong>in</strong>dicat<strong>in</strong>g <strong>the</strong> lack <strong>of</strong> geological prospection for this m<strong>in</strong>eral <strong>in</strong> recent decades.xiiAround 90%.xiiiIn <strong>the</strong> case <strong>of</strong> uranium, <strong>the</strong>re have also been no recent geological surveys.xivTak<strong>in</strong>g <strong>in</strong>to account losses <strong>in</strong> m<strong>in</strong><strong>in</strong>g and process<strong>in</strong>g; ignor<strong>in</strong>g recycl<strong>in</strong>g <strong>of</strong> <strong>the</strong> residual plutonium and uranium.xvUpdated us<strong>in</strong>g <strong>the</strong> IPCA <strong>in</strong>flation <strong>in</strong>dex.xviTractebel <strong>Energy</strong> calculated <strong>the</strong> physical guarantees <strong>of</strong> <strong>the</strong> projects.
Ethanol <strong>in</strong> <strong>the</strong> Brazilian <strong>Energy</strong> <strong>Matrix</strong>309
310 Ethanol and Bioelectricity <strong>Sugarcane</strong> <strong>in</strong> <strong>the</strong> <strong>Future</strong> <strong>of</strong> <strong>the</strong> <strong>Energy</strong> <strong>Matrix</strong>Authors and Coord<strong>in</strong>atorsEduardo L. Leão de Sousa, responsible for organiz<strong>in</strong>g this book, has been <strong>the</strong> Executive Director <strong>of</strong> UNICAs<strong>in</strong>ce October 2007. He is a former Senior Economist and Cluster Leader for agricultural and environmentalprograms at <strong>the</strong> World Bank <strong>in</strong> Wash<strong>in</strong>gton (from 2003 to 2007). Prior to that, he was general coord<strong>in</strong>atorfor agricultural and agri-<strong>in</strong>dustrial products at <strong>the</strong> Brazilian M<strong>in</strong>istry <strong>of</strong> F<strong>in</strong>ance from 1999 to 2002, where heoversaw agricultural and agri-<strong>in</strong>dustrial policies <strong>in</strong>clud<strong>in</strong>g matters relat<strong>in</strong>g to rural credit, food supply, antitrustpolicies <strong>in</strong> agribus<strong>in</strong>ess and <strong>in</strong>ternational trade. A former head <strong>of</strong> <strong>the</strong> Economics Department at <strong>the</strong> São PauloState Federation <strong>of</strong> Agriculture (FAESP), he was also a senior researcher at <strong>the</strong> University <strong>of</strong> São Paulo’s Institutefor Economic Research (FIPE). He holds a BA <strong>in</strong> Agronomic Eng<strong>in</strong>eer<strong>in</strong>g with a Master’s Degree and a Doctorate<strong>in</strong> Applied Economics from <strong>the</strong> University <strong>of</strong> São Paulo’s Luiz de Queiroz School <strong>of</strong> Agronomy. He is a member<strong>of</strong> <strong>the</strong> Commodity Advisory Group at <strong>the</strong> New York Stock Exchange’s Euronext, <strong>the</strong> World Sugar Committee atICE <strong>Future</strong>s U.S., <strong>the</strong> Executive Committee <strong>of</strong> <strong>the</strong> World Sugar Research Organization, <strong>the</strong> High Council on Agribus<strong>in</strong>essat <strong>the</strong> São Paulo State Federation <strong>of</strong> Industries and <strong>the</strong> Executive Committee <strong>of</strong> <strong>the</strong> São Paulo chapter<strong>of</strong> <strong>the</strong> World Trade Center.Isaias de Carvalho Macedo, <strong>the</strong> co-organizer and a co-author <strong>of</strong> this book, received his degree <strong>in</strong> MechanicalEng<strong>in</strong>eer<strong>in</strong>g from <strong>the</strong> Aeronautics Technology Institute ITA (1967), and a Ph.D. from <strong>the</strong> University <strong>of</strong>Michigan (1971). Until 1983, he was a pr<strong>of</strong>essor <strong>of</strong> mechanical eng<strong>in</strong>eer<strong>in</strong>g at ITA and Unicamp, where he wasalso a provost. In <strong>the</strong> period 1981-2001, he planned and coord<strong>in</strong>ated research and development programs at<strong>the</strong> Center <strong>of</strong> Technology <strong>of</strong> Copesucar. S<strong>in</strong>ce 2001, he has worked as an energy consultant for <strong>the</strong> private sectorand <strong>the</strong> federal government. He supervises biomass energy projects <strong>in</strong> his capacity as visit<strong>in</strong>g-pr<strong>of</strong>essor <strong>of</strong>Nipe and is an advisor at Cosema (Fiesp).Adriano Pires, found<strong>in</strong>g director <strong>of</strong> <strong>the</strong> Brazilian Infrastructure Center (CBIE <strong>in</strong> Portuguese), was a pr<strong>of</strong>essor <strong>in</strong><strong>the</strong> <strong>Energy</strong> Plann<strong>in</strong>g Program at Coppe/UFRJ, an advisor to <strong>the</strong> director-general <strong>of</strong> <strong>the</strong> ANP and super<strong>in</strong>tendent<strong>of</strong> <strong>the</strong> areas deal<strong>in</strong>g with importation, exportation and supply. He holds a Doctorate <strong>of</strong> Science <strong>in</strong> IndustrialEconomics from Universidade Paris XIII (1988) and an Economics Degree from UFRJ (1981).Alfred Szwarc is a former environmental eng<strong>in</strong>eer<strong>in</strong>g director at <strong>the</strong> São Paulo State Environmental Agency(CETESB). He has been a consultant with UNICA s<strong>in</strong>ce 1998 <strong>in</strong> <strong>the</strong> fields <strong>of</strong> transportation fuels, technology and<strong>the</strong> environment. He is also president <strong>of</strong> <strong>the</strong> Sugar and Ethanol Industry’s Environmental Chamber and coord<strong>in</strong>ator<strong>of</strong> <strong>the</strong> Jo<strong>in</strong>t Environmental Committee between UNICA and <strong>the</strong> <strong>Sugarcane</strong> Technology Center (CTC). Anexpert <strong>in</strong> <strong>the</strong> fields <strong>of</strong> automotive fuels and emission controls, he has contributed significantly to <strong>the</strong> developmentand use <strong>of</strong> ethanol as a transportation fuel <strong>in</strong> Ch<strong>in</strong>a, India, Japan, Colombia and Jamaica. He holds a BA<strong>in</strong> Mechanical Eng<strong>in</strong>eer<strong>in</strong>g from <strong>the</strong> Taubaté School <strong>of</strong> Eng<strong>in</strong>eer<strong>in</strong>g and an M.Sc. <strong>in</strong> Environmental PollutionControl from <strong>the</strong> University <strong>of</strong> Leeds (UK), with post-graduate studies <strong>in</strong> Environmental Management at <strong>the</strong>University <strong>of</strong> Sou<strong>the</strong>rn California, USA.Carol<strong>in</strong>a Policarpo Garcia has a Bachelor’s Degree <strong>in</strong> Economics from FEA/USP. Currently, she is research<strong>in</strong>gareas <strong>of</strong> antitrust under <strong>the</strong> guidance <strong>of</strong> Pr<strong>of</strong>essor Elizabeth Far<strong>in</strong>a. She participated <strong>in</strong> <strong>the</strong> Exchange Program<strong>of</strong> CADE (<strong>the</strong> Council for Economic Defense) and worked on model<strong>in</strong>g for <strong>the</strong> <strong>in</strong>surance market at Fipecafi.C<strong>in</strong>thia Cabral da Costa, an agronomist, has a Ph.D. <strong>in</strong> Applied Economics from ESALQ/USP. She worked at <strong>the</strong>Institute for International Trade Negotiations (Icone) and is currently a member <strong>of</strong> <strong>the</strong> UFSCar faculty (Sorocabacampus).
Autores e Organizadores311Claudia Viegas, is project coord<strong>in</strong>ator <strong>in</strong> <strong>the</strong> area <strong>of</strong> legal economics at LCA Consultants. She is an economistfrom FEA/USP, with Master’s and Doctorate Degrees from <strong>the</strong> same <strong>in</strong>stitution. She was Assistant Secretary <strong>of</strong><strong>the</strong> Secretariat for Economic Monitor<strong>in</strong>g at <strong>the</strong> M<strong>in</strong>istry <strong>of</strong> F<strong>in</strong>ance (Seae/MF), from 2004 to 2007, when sheworked <strong>in</strong> <strong>the</strong> area <strong>of</strong> antitrust and economic regulation.Elizabeth Maria Mercier Querido Far<strong>in</strong>a is head pr<strong>of</strong>essor at <strong>the</strong> economics department at USP, which shedirected between 2002 and 2004. She was president <strong>of</strong> CADE from 2004 to 2008. She was vice-coord<strong>in</strong>ator<strong>of</strong> Pensa (Program for Bus<strong>in</strong>ess Studies <strong>in</strong> <strong>the</strong> Agribus<strong>in</strong>ess System) <strong>of</strong> <strong>the</strong> university for over 10 years. She holdsa Ph.D. <strong>in</strong> Economics (1983) and Tenured Pr<strong>of</strong>essorship (1996), both at USP. She has published over 40 papers,<strong>in</strong>clud<strong>in</strong>g articles, book chapters and books.Fabíola Crist<strong>in</strong>a Ribeiro de Oliveira is an economist and Ph.D. candidate <strong>in</strong> Applied Economics from ESALQ/USP. She has a Master’s Degree <strong>in</strong> Applied Economics from <strong>the</strong> same <strong>in</strong>stitution. Her Master’s dissertation wasa study on <strong>the</strong> labor market <strong>in</strong> sugarcane and o<strong>the</strong>r farm<strong>in</strong>g sectors. A researcher for <strong>the</strong> Extension Group <strong>in</strong><strong>the</strong> Labor Market (Gemt) at ESALQ/USP, her publications have focused on <strong>the</strong> labor market, <strong>in</strong>come <strong>in</strong>equality,poverty and econometric methods.Francisco Emílio Baccaro Nigro is a mechanical eng<strong>in</strong>eer from <strong>the</strong> Polytechnic School <strong>of</strong> USP with a Ph.D.<strong>in</strong> Mechanical Eng<strong>in</strong>eer<strong>in</strong>g from <strong>the</strong> University <strong>of</strong> Waterloo, Canada. He was a researcher at IPT from 1968to 2006 and pr<strong>of</strong>essor at <strong>the</strong> Polytechnic School s<strong>in</strong>ce 1970. At <strong>the</strong> IPT he held several senior positions andretired as a director. He supervised Master’s and Doctoral candidates, developed and coord<strong>in</strong>ated research onmach<strong>in</strong>ery and equipment, with special emphasis on <strong>the</strong> use <strong>of</strong> alternative fuels <strong>in</strong> eng<strong>in</strong>es and vehicles. He iscurrently a technical adviser to <strong>the</strong> São Paulo State Secretariat for Development.Francisco José Rocha de Sousa is a civil eng<strong>in</strong>eer from <strong>the</strong> University <strong>of</strong> Brasilia, with specialization <strong>in</strong> petroleumeng<strong>in</strong>eer<strong>in</strong>g at <strong>the</strong> Bahia Education Center <strong>of</strong> Petrobras and a Master’s Degree <strong>in</strong> <strong>Energy</strong> Systems Plann<strong>in</strong>g fromUnicamp. He is a legislative consultant to <strong>the</strong> Chamber <strong>of</strong> Deputies <strong>in</strong> <strong>the</strong> area <strong>of</strong> m<strong>in</strong>es, energy and water resources.He was an advisor to <strong>the</strong> executive secretary <strong>of</strong> <strong>the</strong> M<strong>in</strong>istry <strong>of</strong> M<strong>in</strong>es and <strong>Energy</strong> and to <strong>the</strong> super<strong>in</strong>tendent foreconomic regulation at Aneel. He was also deputy super<strong>in</strong>tendent <strong>of</strong> supply at ANP, division chief at <strong>the</strong> NationalFuel Department <strong>of</strong> MME, advisor to <strong>the</strong> National <strong>Energy</strong> Commission and production eng<strong>in</strong>eer at Petrobras.Guilherme de A. Dantas is a doctoral candidate <strong>in</strong> <strong>the</strong> <strong>Energy</strong> Plann<strong>in</strong>g Program at COPPE/UFRJ. He has a Master’sDegree <strong>in</strong> Economics and Politics <strong>of</strong> <strong>Energy</strong> and <strong>the</strong> Environment from <strong>the</strong> Technical University <strong>of</strong> Lisbonwith a Degree <strong>in</strong> Economics from UFRJ. He is a senior researcher at Gesel/IE/UFRJ and an expert on alternativeenergy sources, distribution regulation and bi<strong>of</strong>uels.Joaquim José Mart<strong>in</strong>s Guilhoto is a specialist <strong>in</strong> structural analysis <strong>of</strong> national and regional economies andenvironmental models. He is a full pr<strong>of</strong>essor at USP and also currently a visit<strong>in</strong>g pr<strong>of</strong>essor at MIT. He has publishedmore than 200 studies <strong>in</strong> Brazil and abroad.Luiz Augusto Horta Nogueira received a Degree <strong>in</strong> Mechanical Eng<strong>in</strong>eer<strong>in</strong>g from Unesp <strong>in</strong> 1987, and a Master’sand Doctorate <strong>in</strong> Eng<strong>in</strong>eer<strong>in</strong>g from Unicamp (1981, 1987). Currently he is a full pr<strong>of</strong>essor at <strong>the</strong> Institute<strong>of</strong> Natural Resources at <strong>the</strong> Federal University <strong>of</strong> Itajubá, where he has taught s<strong>in</strong>ce 1979. He was also headpr<strong>of</strong>essor <strong>of</strong> <strong>the</strong> Lat<strong>in</strong> American Memorial <strong>in</strong> 2007, technical director <strong>of</strong> <strong>the</strong> ANP between 1998 and 2004, anda visit<strong>in</strong>g fellow at <strong>the</strong> Wood <strong>Energy</strong> Program (FAO, Rome) <strong>in</strong> 1997/1998 and at Cepal (Santiago) <strong>in</strong> 2009. Hehas supervised 34 academic <strong>the</strong>ses about energy issues and is <strong>the</strong> author <strong>of</strong> five books and various technicalstudies and specialized articles about bi<strong>of</strong>uels and <strong>the</strong> rational use <strong>of</strong> energy.
312 Ethanol and Bioelectricity <strong>Sugarcane</strong> <strong>in</strong> <strong>the</strong> <strong>Future</strong> <strong>of</strong> <strong>the</strong> <strong>Energy</strong> <strong>Matrix</strong>Luiz Gustavo Antonio de Souza holds a Degree <strong>in</strong> Economics from <strong>the</strong> State University <strong>of</strong> Londr<strong>in</strong>a and aPh.D. <strong>in</strong> Applied Economics from Esalq/USP. In 2008 he won <strong>the</strong> Corecon award for his doctoral <strong>the</strong>sis. He iscurrently a researcher at Gemt, Esalq/USP, Nereus, FEA/USP, and Geite-UEL. His areas <strong>of</strong> focus are labor economics,<strong>in</strong>dustrial economics, regional economics, and <strong>the</strong> economics <strong>of</strong> <strong>in</strong>novation.Luiz Gylvan Meira Filho is a visit<strong>in</strong>g researcher with <strong>the</strong> Institute for Advanced Studies <strong>of</strong> <strong>the</strong> University <strong>of</strong> SãoPaulo. He holds a Degree <strong>in</strong> Electronic Eng<strong>in</strong>eer<strong>in</strong>g from <strong>the</strong> Aeronautics Technology Institute (ITA) and Ph.D.<strong>in</strong> Astro-Geophysics from <strong>the</strong> University <strong>of</strong> Colorado. In 1994, he became <strong>the</strong> first president <strong>of</strong> <strong>the</strong> BrazilianSpace Agency (AEB). He also served as Secretary for Science and Technology Policy <strong>in</strong> <strong>the</strong> M<strong>in</strong>istry <strong>of</strong> Scienceand Technology. He participated actively as an adviser to <strong>the</strong> Brazilian Government <strong>in</strong> <strong>the</strong> UNFCCC and KyotoProtocol process and was <strong>in</strong>vited to be <strong>the</strong> Senior Scientific Adviser to <strong>the</strong> UNFCCC Secretariat <strong>in</strong> Bonn, Germany.He served as co-chair <strong>of</strong> <strong>the</strong> IPCC Science Work<strong>in</strong>g Group as vice-president <strong>of</strong> <strong>the</strong> Panel.Márcia Azanha Ferraz Dias de Moraes has a Bachelor’s Degree <strong>in</strong> Mechanical Eng<strong>in</strong>eer<strong>in</strong>g from Unicamp,with Master’s and Doctoral Degree <strong>in</strong> Applied Economics from USP. She is currently a pr<strong>of</strong>essor at ESALQ/USP, for undergraduate and graduate students. She conducts research on <strong>in</strong>dustrial organization and <strong>the</strong> agriculturallabor market, and has published papers on <strong>the</strong> sugarcane <strong>in</strong>dustry, <strong>in</strong>dustrial organization, and <strong>the</strong>agricultural labor market. She coord<strong>in</strong>ates <strong>the</strong> research group registered with <strong>the</strong> CNPq/Gemt.Marcos Fava Neves is a pr<strong>of</strong>essor for plann<strong>in</strong>g and strategy at FEA/USP (Ribeirão Preto campus). He graduated<strong>in</strong> agronomy from ESALQ and holds an MA <strong>in</strong> Management from FEA/USP (1995), specialization <strong>in</strong> foodproducts market<strong>in</strong>g <strong>in</strong> France, and a Ph.D. from FEA/USP (1999), specializ<strong>in</strong>g <strong>in</strong> Dutch supply cha<strong>in</strong>s. He is <strong>the</strong>author/coord<strong>in</strong>ator <strong>of</strong> over 20 books <strong>in</strong> Brazil, Argent<strong>in</strong>a, Europe and <strong>the</strong> United States, among <strong>the</strong>m Estratégiaspara a cana no Brasil, Editora Atlas (2010). He is founder and coord<strong>in</strong>ator <strong>of</strong> Markestrat (<strong>the</strong> Center forResearch and Projects <strong>in</strong> Market<strong>in</strong>g and Strategy, USP), which currently has 35 researchers. He has more than80 scientific papers published abroad.Marcos S. Jank has been president and CEO <strong>of</strong> <strong>the</strong> Brazilian <strong>Sugarcane</strong> Industry Association (UNICA) s<strong>in</strong>ce June2007. He was <strong>the</strong> found<strong>in</strong>g president <strong>of</strong> <strong>the</strong> Brazilian Institute for International Trade Negotiations (ICONE).Dur<strong>in</strong>g 20 years, he was a pr<strong>of</strong>essor at <strong>the</strong> School <strong>of</strong> Economics and Bus<strong>in</strong>ess <strong>of</strong> <strong>the</strong> University <strong>of</strong> São Paulo(FEA/USP), at <strong>the</strong> International Relations Institute (IRI), and at <strong>the</strong> “Luiz de Queiroz” School <strong>of</strong> Agriculture (ES-ALQ). He received his Bachelor’s Degree <strong>in</strong> Agronomy from ESALQ, a Master’s Degree <strong>in</strong> Agricultural Policiesfrom IAMM, Montpellier, France, and a Ph.D. from FEA/USP. He has worked as special trade expert at <strong>the</strong> Integration,Trade, and Hemispheric Issues Division <strong>of</strong> <strong>the</strong> Inter-American Development Bank (IDB) <strong>in</strong> Wash<strong>in</strong>gton,and was a visit<strong>in</strong>g pr<strong>of</strong>essor at <strong>the</strong> Universities <strong>of</strong> Georgetown and Missouri-Columbia. With over 20 years <strong>of</strong>experience <strong>in</strong> topics related to <strong>the</strong> sugar-ethanol <strong>in</strong>dustry, he has published over 200 works and presentedabout 500 lectures at events <strong>in</strong> Brazil and abroad.Maria de Fátima Andrade holds Bachelor’s, Master’s, and Doctoral Degrees <strong>in</strong> Physics from <strong>the</strong> University <strong>of</strong> SãoPaulo (USP). She did post-doctoral work at <strong>the</strong> California Institute <strong>of</strong> Technology <strong>in</strong> 1994. She currently teachesat USP. She has experience <strong>in</strong> geoscience, with a focus on atmospheric pollution. Her ma<strong>in</strong> areas <strong>of</strong> focus areatmospheric chemistry, photochemical models, atmospheric aerosols, air quality models and receptor models.Ma<strong>the</strong>us Alberto Consoli has a Ph.D. <strong>in</strong> Production Eng<strong>in</strong>eer<strong>in</strong>g from USP (Sao Carlos) and is researcher atMarkestrat.Nivalde José de Castro is a pr<strong>of</strong>essor at <strong>the</strong> Economics Institute at UFRJ and coord<strong>in</strong>ator <strong>of</strong> Gesel (<strong>the</strong> Electric-
Autores e Organizadores313ity Sector Study Group), where he carries out research <strong>in</strong>to bioelectricity l<strong>in</strong>ked to sugar-ethanol production. Hehas published studies and articles about <strong>the</strong> importance <strong>of</strong> bioelectricity for energy plann<strong>in</strong>g, with emphasis on<strong>the</strong> synergies and externalities that it can br<strong>in</strong>g to <strong>the</strong> energy matrix. He was coauthor <strong>of</strong> <strong>the</strong> book Bioeletricidadee a <strong>in</strong>dústria de álcool e açúcar: possibilidades e limites (2008).Paula Carvalho Pereda holds a Master’s Degree <strong>in</strong> Economic Theory from USP (2008), where she has been<strong>in</strong> <strong>the</strong> doctoral program s<strong>in</strong>ce 2009. She has worked as an assistant pr<strong>of</strong>essor <strong>of</strong> microeconomics and econometrics<strong>in</strong> <strong>the</strong> Department <strong>of</strong> Economics at USP s<strong>in</strong>ce 2006, and has participated <strong>in</strong> several national and<strong>in</strong>ternational conferences, present<strong>in</strong>g academic papers <strong>in</strong> applied microeconomics (health economics, laboreconomics and consumer <strong>the</strong>ory) s<strong>in</strong>ce 2008.Paulo Afonso de André studied eng<strong>in</strong>eer<strong>in</strong>g at <strong>the</strong> USP Polytechnic School and holds Master’s and DoctoralDegrees from <strong>the</strong> Faculty <strong>of</strong> Medic<strong>in</strong>e, USP. He coord<strong>in</strong>ates <strong>the</strong> Experimental Air Pollution Laboratory at <strong>the</strong>USP Medical Faculty and <strong>the</strong> Equipments and Projects Nucleus, where he develops equipment and facilities fortoxicological test<strong>in</strong>g and supervises equipment operation <strong>in</strong> field sampl<strong>in</strong>g and analysis <strong>of</strong> air pollutants. Healso supports epidemiological and toxicological experiments conducted by <strong>the</strong> National Institute for IntegratedAnalysis <strong>of</strong> Environmental Risk (Inaira).Paulo Hilário Nascimento Saldiva is a medical pathologist and Head Pr<strong>of</strong>essor at <strong>the</strong> USP School <strong>of</strong> Medic<strong>in</strong>e.He is head <strong>of</strong> USP’s Experimental Air Pollution Laboratory, a researcher at <strong>the</strong> CNPq, a committee member at<strong>the</strong> Harvard School <strong>of</strong> Public Health and a member <strong>of</strong> several World Health Organization panels. He coord<strong>in</strong>ates<strong>the</strong> National Institute for Integrated Analysis <strong>of</strong> Environmental Risk (Inaira).Rafael Schechtman is a director <strong>of</strong> <strong>the</strong> Brazilian Infrastructure Center (CBIE). He was a pr<strong>of</strong>essor at <strong>the</strong> <strong>Energy</strong>Plann<strong>in</strong>g Program at COPPE/UFRJ, holds Doctorates <strong>in</strong> Nuclear Eng<strong>in</strong>eer<strong>in</strong>g from MIT (1984) and Electrical Eng<strong>in</strong>eer<strong>in</strong>gfrom PUC/Rio (1975), and was an advisor to <strong>the</strong> director-general <strong>of</strong> ANP, where he was super<strong>in</strong>tendent<strong>of</strong> <strong>the</strong> areas <strong>of</strong> control <strong>of</strong> government participation and strategic studies.Roberto Brandão is an economist, a senior researcher at Gesel-IE-UFRJ, and a consultant for electricity companies.He conducts research on <strong>the</strong> energy matrix, alternative energy and <strong>the</strong>rmal power generation.Sergio Valdir Bajay holds undergraduate and Master’s Degrees <strong>in</strong> Mechanical Eng<strong>in</strong>eer<strong>in</strong>g from Unicamp(1973, 1976) and a Ph.D. from <strong>the</strong> University <strong>of</strong> Newcastle upon Tyne, England (1981). S<strong>in</strong>ce 1974, he has beena pr<strong>of</strong>essor <strong>of</strong> mechanical eng<strong>in</strong>eer<strong>in</strong>g at Unicamp, where <strong>in</strong> 1987 he created a post-graduate course <strong>in</strong> energysystem plann<strong>in</strong>g. He also created <strong>the</strong> Interdiscipl<strong>in</strong>ary Nucleus <strong>of</strong> <strong>Energy</strong> Research (NIPE) at Unicamp <strong>in</strong> 1993,where is he is a senior fellow. Between 2001 and 2002, he was director <strong>of</strong> <strong>the</strong> National <strong>Energy</strong> Policy Departmentat <strong>the</strong> MME. S<strong>in</strong>ce 1982 he has been a researcher and consultant <strong>in</strong> <strong>the</strong> formulation <strong>of</strong> energy policy,energy plann<strong>in</strong>g and regulation <strong>of</strong> energy markets. He is also sits on <strong>the</strong> advisory board <strong>of</strong> <strong>the</strong> <strong>Energy</strong> ResearchCompany (EPE), a state-owned company that conducts energy plann<strong>in</strong>g studies for <strong>the</strong> MME s<strong>in</strong>ce 2008.Simone Georges El Khouri Miraglia holds undergraduate and Master’s Degrees <strong>in</strong> Eng<strong>in</strong>eer<strong>in</strong>g from <strong>the</strong> USPPolytechnic School, with a Doctorate and post-doctoral studies from <strong>the</strong> USP School <strong>of</strong> Medic<strong>in</strong>e, where shewrote her doctoral <strong>the</strong>sis on <strong>the</strong> environmental and health costs <strong>of</strong> atmospheric pollution <strong>in</strong> São Paulo. She is aresearch pr<strong>of</strong>essor at Unifesp <strong>in</strong> <strong>the</strong> chemical eng<strong>in</strong>eer<strong>in</strong>g course. She studies environmental valuation, susta<strong>in</strong>ability,and atmospheric pollution and its impacts on health.V<strong>in</strong>icius Gustavo Tromb<strong>in</strong> is a Ph.D. student <strong>in</strong> adm<strong>in</strong>istration at FEARP/USP and a researcher at Markestrat.
314 Ethanol and Bioelectricity <strong>Sugarcane</strong> <strong>in</strong> <strong>the</strong> <strong>Future</strong> <strong>of</strong> <strong>the</strong> <strong>Energy</strong> <strong>Matrix</strong>UNICABrazilian <strong>Sugarcane</strong> Industry AssociationPresident: Marcos Sawaya JankExecutive Director: Eduardo L. Leão de SousaCommunications Director: Adhemar AltieriTechnical Director: Antônio de Padua RodriguesHeadquarters:Av. Brigadeiro Faria Lima, 2179 – 9º andarJardim PaulistanoSão Paulo, SP – BrazilPhone: +55(11) 3093-4949 Fax: +55(11) 3812-1416www.unica.com.br unica@unica.com.brRegional Offices:Ribeirão Preto (Brazil), Wash<strong>in</strong>gton (USA) andBrussels (Belgium)Ethanol andBioelectricity<strong>Sugarcane</strong> <strong>in</strong> <strong>the</strong> future energy matrixCoord<strong>in</strong>ation and OrganizationEduardo L. Leão de SousaIsaias de Carvalho MacedoText edit<strong>in</strong>gOscar PilagalloPlann<strong>in</strong>g, project, edit<strong>in</strong>g and graphic productionLUC Comunicação Integrada (11) 5044 6099Art editor: Ricardo FerreiraGraphic design and cover: Eduardo MatsudaGraphics and image treatment: Cláudio SantosTechnical team and collaboratorsAlfred Szwarc, Beatriz Stuart Secaf, Carlos Dias,Carlos Roberto Silvestr<strong>in</strong>, Daniel Lobo, Diana EdnaNóbrega, Elimara Aparecida Assad Sallum, EmmanuelDesplech<strong>in</strong>, Fabiane Cunha, Francesco Gianetti,Gerald<strong>in</strong>e Kutas, Jean<strong>in</strong>e Ferreira de Souza, JoelVelasco, Leandro Pamp<strong>in</strong>, Letícia Phillips, LucianoRodrigues, Luiz Fernando do Amaral, Maria LuizaBarbosa, Mariana Reg<strong>in</strong>a Zech<strong>in</strong>, Nayana Rizzo eZilmar José de Souza.AGORA PROJECTThe Agora Project – Agro-energy and <strong>the</strong> Environmentis designed to develop a broad and <strong>in</strong>tegratedcommunication and market<strong>in</strong>g effort to promote<strong>the</strong> benefits <strong>of</strong> <strong>the</strong> production and use <strong>of</strong> clean, renewableand susta<strong>in</strong>able agricultural energy sourcessuch as ethanol, bioelectricity, bioplastics and hydrocarbons,among o<strong>the</strong>rs.The project has five ma<strong>in</strong> objectives:. Clarify and promote questions related to climatechange and <strong>the</strong> environment, highlight<strong>in</strong>g <strong>the</strong>contribution <strong>of</strong> ethanol and bioelectricity;. Inform and promote <strong>the</strong> sugar-ethanol supplycha<strong>in</strong>, emphasiz<strong>in</strong>g its impacts and benefits for <strong>the</strong>Brazilian economy;. Increase <strong>the</strong> consumption <strong>of</strong> ethanol <strong>in</strong> motorvehicles, encourage new uses and <strong>the</strong> growth <strong>of</strong>bioelectricity;. Promote consumption and market <strong>in</strong>tegration <strong>of</strong>new products from <strong>the</strong> sugarcane supply cha<strong>in</strong>;. Clarify myths about <strong>the</strong> sugar-energy sector.The follow<strong>in</strong>g companies and organizations <strong>in</strong> <strong>the</strong>sugarcane supply cha<strong>in</strong> are part <strong>of</strong> <strong>the</strong> Agora Project:. Itaú. Monsanto. Amyris. Basf. BP. FMC. Sew Eurodrive. ALCOPAR – Association <strong>of</strong> Bioenergy Producers <strong>in</strong><strong>the</strong> State <strong>of</strong> Paraná. BioSul – Association <strong>of</strong> Bioenergy Producers <strong>in</strong>Mato Grosso do Sul. Orplana – Organization <strong>of</strong> <strong>Sugarcane</strong> Growers <strong>of</strong><strong>the</strong> Center-South Region <strong>of</strong> Brazil. SIAMIG – Syndicate <strong>of</strong> Ethanol Manufactur<strong>in</strong>gIndustry <strong>in</strong> <strong>the</strong> State <strong>of</strong> M<strong>in</strong>as Gerais. Sifaeg – Syndicate <strong>of</strong> <strong>the</strong> Ethanol Manufactur<strong>in</strong>gIndustry <strong>in</strong> <strong>the</strong> State <strong>of</strong> M<strong>in</strong>as Gerais. S<strong>in</strong>dalcool/MT – Syndicate <strong>of</strong> Sugar and EthanolManufactur<strong>in</strong>g Companies <strong>in</strong> <strong>the</strong> State <strong>of</strong> MatoGrosso. UNICA – Brazilian <strong>Sugarcane</strong> Industry AssociationPhotosPrivate collection, Fotolia, Luc Imagens,Stock Photos, Tadeu FesselPr<strong>in</strong>t<strong>in</strong>gGráficos BurtiPr<strong>in</strong>ted on 250g Paper Duo Design (cover)And 90g Pollen (<strong>in</strong>side). Produced <strong>in</strong> Humanist 777family font.5,000 issues pr<strong>in</strong>tedJune 2010
The FSC label is<strong>the</strong> guarantee that <strong>the</strong>paper used <strong>in</strong> this bookwas made with woodfrom well managedforests and o<strong>the</strong>rcontrolled sources.