Foreign Direct Investments and Exchange Rate Volatility at the EMU ...
Foreign Direct Investments and Exchange Rate Volatility at the EMU ...
Foreign Direct Investments and Exchange Rate Volatility at the EMU ...

Create successful ePaper yourself
Turn your PDF publications into a flip-book with our unique Google optimized e-Paper software.
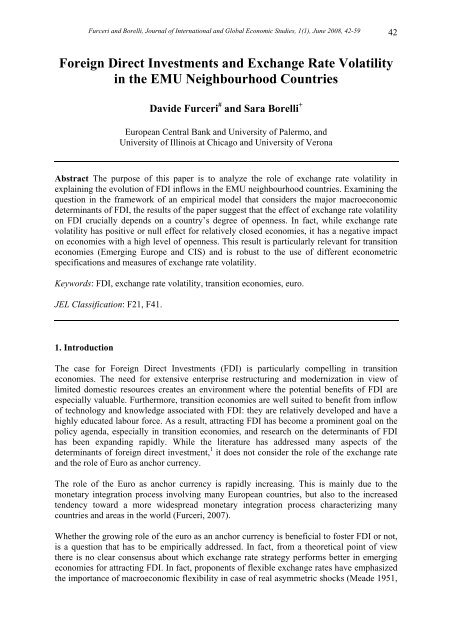
Furceri <strong>and</strong> Borelli, Journal of Intern<strong>at</strong>ional <strong>and</strong> Global Economic Studies, 1(1), June 2008, 42-59 42<strong>Foreign</strong> <strong>Direct</strong> <strong>Investments</strong> <strong>and</strong> <strong>Exchange</strong> <strong>R<strong>at</strong>e</strong> <strong>Vol<strong>at</strong>ility</strong>in <strong>the</strong> <strong>EMU</strong> Neighbourhood CountriesDavide Furceri # <strong>and</strong> Sara Borelli +European Central Bank <strong>and</strong> University of Palermo, <strong>and</strong>University of Illinois <strong>at</strong> Chicago <strong>and</strong> University of VeronaAbstract The purpose of this paper is to analyze <strong>the</strong> role of exchange r<strong>at</strong>e vol<strong>at</strong>ility inexplaining <strong>the</strong> evolution of FDI inflows in <strong>the</strong> <strong>EMU</strong> neighbourhood countries. Examining <strong>the</strong>question in <strong>the</strong> framework of an empirical model th<strong>at</strong> considers <strong>the</strong> major macroeconomicdeterminants of FDI, <strong>the</strong> results of <strong>the</strong> paper suggest th<strong>at</strong> <strong>the</strong> effect of exchange r<strong>at</strong>e vol<strong>at</strong>ilityon FDI crucially depends on a country’s degree of openness. In fact, while exchange r<strong>at</strong>evol<strong>at</strong>ility has positive or null effect for rel<strong>at</strong>ively closed economies, it has a neg<strong>at</strong>ive impacton economies with a high level of openness. This result is particularly relevant for transitioneconomies (Emerging Europe <strong>and</strong> CIS) <strong>and</strong> is robust to <strong>the</strong> use of different econometricspecific<strong>at</strong>ions <strong>and</strong> measures of exchange r<strong>at</strong>e vol<strong>at</strong>ility.Keywords: FDI, exchange r<strong>at</strong>e vol<strong>at</strong>ility, transition economies, euro.JEL Classific<strong>at</strong>ion: F21, F41.1. IntroductionThe case for <strong>Foreign</strong> <strong>Direct</strong> <strong>Investments</strong> (FDI) is particularly compelling in transitioneconomies. The need for extensive enterprise restructuring <strong>and</strong> moderniz<strong>at</strong>ion in view oflimited domestic resources cre<strong>at</strong>es an environment where <strong>the</strong> potential benefits of FDI areespecially valuable. Fur<strong>the</strong>rmore, transition economies are well suited to benefit from inflowof technology <strong>and</strong> knowledge associ<strong>at</strong>ed with FDI: <strong>the</strong>y are rel<strong>at</strong>ively developed <strong>and</strong> have ahighly educ<strong>at</strong>ed labour force. As a result, <strong>at</strong>tracting FDI has become a prominent goal on <strong>the</strong>policy agenda, especially in transition economies, <strong>and</strong> research on <strong>the</strong> determinants of FDIhas been exp<strong>and</strong>ing rapidly. While <strong>the</strong> liter<strong>at</strong>ure has addressed many aspects of <strong>the</strong>determinants of foreign direct investment, 1 it does not consider <strong>the</strong> role of <strong>the</strong> exchange r<strong>at</strong>e<strong>and</strong> <strong>the</strong> role of Euro as anchor currency.The role of <strong>the</strong> Euro as anchor currency is rapidly increasing. This is mainly due to <strong>the</strong>monetary integr<strong>at</strong>ion process involving many European countries, but also to <strong>the</strong> increasedtendency toward a more widespread monetary integr<strong>at</strong>ion process characterizing manycountries <strong>and</strong> areas in <strong>the</strong> world (Furceri, 2007).Whe<strong>the</strong>r <strong>the</strong> growing role of <strong>the</strong> euro as an anchor currency is beneficial to foster FDI or not,is a question th<strong>at</strong> has to be empirically addressed. In fact, from a <strong>the</strong>oretical point of view<strong>the</strong>re is no clear consensus about which exchange r<strong>at</strong>e str<strong>at</strong>egy performs better in emergingeconomies for <strong>at</strong>tracting FDI. In fact, proponents of flexible exchange r<strong>at</strong>es have emphasized<strong>the</strong> importance of macroeconomic flexibility in case of real asymmetric shocks (Meade 1951,
Furceri <strong>and</strong> Borelli, Journal of Intern<strong>at</strong>ional <strong>and</strong> Global Economic Studies, 1(1), June 2008, 42-59 43Friedman 1953) <strong>and</strong> thus <strong>the</strong> possibility to cre<strong>at</strong>e a more stable <strong>and</strong> favourable environmentto <strong>at</strong>tract investments. In contrast, proponents of fixed exchange r<strong>at</strong>es have stressed <strong>the</strong>(microeconomic) benefits of low transaction costs for intern<strong>at</strong>ional trade (Rose 2000, Frankel<strong>and</strong> Rose 2002), <strong>and</strong> for capital flows (Bacchetta <strong>and</strong> van Wincoop, 1998). In particular, forcountries in <strong>the</strong> economic c<strong>at</strong>ching-up process where capital markets remain underdeveloped<strong>and</strong> macroeconomic instability tends to be high, also due to a high level of openness, fixedexchange r<strong>at</strong>es are an important anchor for macroeconomic policies <strong>and</strong> priv<strong>at</strong>e expect<strong>at</strong>ions,<strong>and</strong> can thus be an important element to foster capital inflows.The purpose of <strong>the</strong> paper is to analyze <strong>the</strong> role exchange r<strong>at</strong>e vol<strong>at</strong>ility plays in explaining <strong>the</strong>evolution of FDI inflows in <strong>the</strong> <strong>EMU</strong> neighbourhood countries. This study will undertake <strong>at</strong>horough analysis of this issue, ignored so far by <strong>the</strong> liter<strong>at</strong>ure, examining <strong>the</strong> question in <strong>the</strong>framework of an empirical model th<strong>at</strong> considers <strong>the</strong> major macroeconomic determinants ofFDI pointed out by <strong>the</strong> liter<strong>at</strong>ure.The rest of <strong>the</strong> paper is organized as follows. The next section presents some stylized factsregarding <strong>the</strong> exchange r<strong>at</strong>e str<strong>at</strong>egies <strong>and</strong> <strong>the</strong> FDI inflows in <strong>the</strong> <strong>EMU</strong> neighborhoodcountries. Section 3 discusses <strong>the</strong> d<strong>at</strong>a <strong>and</strong> <strong>the</strong> empirical str<strong>at</strong>egy used to construct ourmeasure of exchange r<strong>at</strong>e vol<strong>at</strong>ility. Section 4 presents <strong>the</strong> empirical specific<strong>at</strong>ion to test <strong>the</strong>effect of exchange r<strong>at</strong>e vol<strong>at</strong>ility on FDI. Section 5 reports <strong>the</strong> results. Finally, section 6summarizes <strong>the</strong> main findings.2. Stylized Facts on <strong>Exchange</strong> <strong>R<strong>at</strong>e</strong> <strong>Vol<strong>at</strong>ility</strong> <strong>and</strong> FDIThe role of <strong>the</strong> euro as an anchor currency is growing steadily <strong>at</strong> <strong>the</strong> cost of <strong>the</strong> US dollar.While in central, eastern, <strong>and</strong> south-eastern Europe <strong>the</strong> growing exchange r<strong>at</strong>e stabilityagainst <strong>the</strong> euro can be associ<strong>at</strong>ed with <strong>the</strong> EU enlargement process, also o<strong>the</strong>r non-EUc<strong>and</strong>id<strong>at</strong>e countries are trying to stabilize <strong>the</strong>ir exchange r<strong>at</strong>es against <strong>the</strong> euro <strong>and</strong>/or <strong>the</strong>dollar.Figure 1 compares <strong>the</strong> percent change devi<strong>at</strong>ion of <strong>the</strong> monthly exchange r<strong>at</strong>e of 35 <strong>EMU</strong>neighbourhood currencies against <strong>the</strong> euro <strong>and</strong> <strong>the</strong> dollar for <strong>the</strong> years 1994 to 2004(unweighted averages). Observing <strong>the</strong> figure, we can see th<strong>at</strong> a very similar p<strong>at</strong>tern emergesfor both currencies. In particular, exchange r<strong>at</strong>e vol<strong>at</strong>ility in <strong>the</strong> <strong>EMU</strong> neighbourhood hassteadily decreased (with <strong>the</strong> exception of <strong>the</strong> turbulent year of <strong>the</strong> Russian crisis), <strong>and</strong> in <strong>the</strong>very recent years (after 2002) exchange r<strong>at</strong>e stability against <strong>the</strong> euro is becoming higher than<strong>the</strong> one against <strong>the</strong> dollar.Figures 2-5 show different degrees of exchange r<strong>at</strong>e vol<strong>at</strong>ility for several sub-groups ofcountries both against <strong>the</strong> euro <strong>and</strong> <strong>the</strong> dollar (unweighted averages). The first sub-sample(Figure 2) considers <strong>the</strong> non–<strong>EMU</strong> developed countries (Denmark, Icel<strong>and</strong>, Norway,Sweden, Switzerl<strong>and</strong>, <strong>and</strong> United Kingdom). In <strong>the</strong>se countries exchange r<strong>at</strong>e vol<strong>at</strong>ility hasbeen significantly lower against <strong>the</strong> euro than against <strong>the</strong> dollar. Moreover, while it increasedagainst <strong>the</strong> dollar after 1999, it remained stable against <strong>the</strong> euro.Figure 3 considers <strong>the</strong> exchange r<strong>at</strong>e vol<strong>at</strong>ility developments for <strong>the</strong> Emerging Europecountries (i.e. <strong>the</strong> central, eastern <strong>and</strong> south-eastern European countries). 2 These countriesexperienced very high exchange r<strong>at</strong>e vol<strong>at</strong>ility before 1997. Since <strong>the</strong>n it has declinedconsiderably, significantly more against <strong>the</strong> euro than against <strong>the</strong> dollar.
Furceri <strong>and</strong> Borelli, Journal of Intern<strong>at</strong>ional <strong>and</strong> Global Economic Studies, 1(1), June 2008, 42-59 44In <strong>the</strong> CIS (Figure 4) exchange r<strong>at</strong>e stabiliz<strong>at</strong>ion against <strong>the</strong> dollar persists <strong>and</strong> exchange r<strong>at</strong>evol<strong>at</strong>ility has remarkably decreased also against <strong>the</strong> euro. In contrast, in <strong>the</strong> Mediterraneancountries exchange r<strong>at</strong>e vol<strong>at</strong>ility is increased both against <strong>the</strong> euro <strong>and</strong> <strong>the</strong> dollar until 2002,<strong>and</strong> only in <strong>the</strong> recent years <strong>the</strong>y moved toward higher exchange r<strong>at</strong>e stability.The increasing degree of exchange r<strong>at</strong>e stability in <strong>the</strong>se countries poses <strong>the</strong> question of wh<strong>at</strong>are <strong>the</strong> motiv<strong>at</strong>ions to stabilize exchange r<strong>at</strong>es in general <strong>and</strong> to peg in particular to <strong>the</strong> euro.This paper focuses on <strong>the</strong> effects of <strong>the</strong> exchange r<strong>at</strong>e regime on <strong>the</strong> ability for foreigncountries to <strong>at</strong>tract foreign investment. As mentioned in <strong>the</strong> previous section, <strong>the</strong> case for FDIis particularly compelling for transition <strong>and</strong> emerging economies. First, because <strong>the</strong> need forextensive enterprise restructuring <strong>and</strong> moderniz<strong>at</strong>ion in view of limited domestic resourcescre<strong>at</strong>es an environment where <strong>the</strong> potential benefits of FDI are especially valuable. Second,because <strong>the</strong> inflow(s) of foreign direct investments in <strong>the</strong>se countries has changed rapidly in<strong>the</strong> last decade (Figure 6). In fact, while for <strong>the</strong> non-<strong>EMU</strong> developed countries <strong>the</strong> flows ofFDI remained constant during <strong>the</strong> last years (except a boom during 1999 <strong>and</strong> 2000), itremarkably increased for <strong>the</strong> o<strong>the</strong>r subset of countries in <strong>the</strong> last two years.Thus, <strong>at</strong> first it could seem th<strong>at</strong> both exchange r<strong>at</strong>e stability <strong>and</strong> FDI follow similar p<strong>at</strong>terns in<strong>the</strong>se countries. However, in order to assess <strong>the</strong> role played by exchange r<strong>at</strong>e stability instimul<strong>at</strong>ing FDI, we should empirically test for <strong>the</strong> presence of an economic rel<strong>at</strong>ion between<strong>the</strong>se two variables. This will be analyzed in <strong>the</strong> rest of <strong>the</strong> paper.3. Sample Selection <strong>and</strong> <strong>Vol<strong>at</strong>ility</strong> MeasuresTo identify <strong>the</strong> effect of exchange r<strong>at</strong>e vol<strong>at</strong>ility on FDI, we specify a cross-country panelmodel for 35 <strong>EMU</strong> neighbourhood countries. In particular, we include 17 central, eastern <strong>and</strong>south-eastern European countries which have already joined <strong>the</strong> European Union or areassoci<strong>at</strong>ed with <strong>the</strong> EU enlargement process as c<strong>and</strong>id<strong>at</strong>e or potential c<strong>and</strong>id<strong>at</strong>e countries (i.e.Albania, Bosnia-Herzegovina, Bulgaria, Cro<strong>at</strong>ia, Cyprus, Czech Republic, Estonia, FYR ofMacedonia, Hungary, L<strong>at</strong>via, Lithuania, Malta, Pol<strong>and</strong>, Romania, Slovak Republic, Slovenia<strong>and</strong> Turkey). Most central, eastern <strong>and</strong> south-eastern European countries have redirected <strong>the</strong>irexchange r<strong>at</strong>e policies towards <strong>the</strong> euro.Second, we include six non-euro area industrialized economies, namely, Icel<strong>and</strong>, Denmark,Norway, Sweden, Switzerl<strong>and</strong> <strong>and</strong> <strong>the</strong> UK. Also this second group exhibits tighter exchanger<strong>at</strong>e stability against <strong>the</strong> euro than against <strong>the</strong> dollar.Third, we include 8 CIS countries, which have traditionally been stabilizing exchange r<strong>at</strong>esagainst <strong>the</strong> US dollar (i.e. Armenia, Azerbaijan, Georgia, Kazakhstan, Kyrgyzstan, Moldova,Russia, <strong>and</strong> Tajikistan). Finally, <strong>the</strong> sample comprises four Mediterranean countries th<strong>at</strong>maintain close economic linkages with <strong>the</strong> European Union, i.e. Egypt, Israel, Morocco <strong>and</strong>Syria. The Mediterranean countries have traditionally pursued (tight) exchange r<strong>at</strong>e stabilityagainst <strong>the</strong> dollar, but some countries such as Morocco are using <strong>the</strong> euro as an anchor incurrency baskets.The d<strong>at</strong>a sources are IMF Intern<strong>at</strong>ional Financial St<strong>at</strong>istics, IMF World Economic Outlook,<strong>the</strong> Penn World Table <strong>and</strong> UNCTAD. We use yearly d<strong>at</strong>a, as for some countries d<strong>at</strong>a are onlyavailable on a yearly basis. The vol<strong>at</strong>ility measures are calcul<strong>at</strong>ed as yearly averages of
Furceri <strong>and</strong> Borelli, Journal of Intern<strong>at</strong>ional <strong>and</strong> Global Economic Studies, 1(1), June 2008, 42-59 46positively (risk premium) or neg<strong>at</strong>ively (lower macroeconomic stability). Investment price isexpected to be neg<strong>at</strong>ively correl<strong>at</strong>ed with FDI. Dummies for Asian <strong>and</strong> Russian crisis couldbe neg<strong>at</strong>ively correl<strong>at</strong>ed, to <strong>the</strong> extent th<strong>at</strong> <strong>the</strong>se crises were detrimental for <strong>the</strong> countries inour sample to <strong>at</strong>tract investments.EXitconsists of <strong>the</strong> indic<strong>at</strong>ors of exchange r<strong>at</strong>e vol<strong>at</strong>ility ( σ, μ, z ). Our parameter of interestβ will measure <strong>the</strong> impact of exchange r<strong>at</strong>e vol<strong>at</strong>ility on <strong>the</strong> inflows of FDI in <strong>the</strong> hostcountry. From a <strong>the</strong>oretical point of view <strong>the</strong>re is no clear consensus about sign of thiscoefficient. In fact, while flexible exchange r<strong>at</strong>es could help to offset asymmetric shocks(Meade 1951, Friedman 1953) <strong>and</strong> thus cre<strong>at</strong>e a more stable <strong>and</strong> favourable environment to<strong>at</strong>tract investments, fixed exchange r<strong>at</strong>es could cre<strong>at</strong>e benefits of low transaction costs forintern<strong>at</strong>ional trade (Rose, 2000; Frankel <strong>and</strong> Rose 2002), <strong>and</strong> for capital flows (Bacchetta <strong>and</strong>van Wincoop, 1998). We estim<strong>at</strong>e equ<strong>at</strong>ion (2) taking into account country specific fixedeffects <strong>and</strong> robust variance-covariance m<strong>at</strong>rix (S<strong>and</strong>wich Estim<strong>at</strong>or). We use a country fixedeffects model as baseline framework since we are little concerned about <strong>the</strong> potentialendogeneity of exchange r<strong>at</strong>e vol<strong>at</strong>ility. Basically, <strong>the</strong>re is no empirical evidence th<strong>at</strong>countries with a higher level of FDI inflows are more prone to adopt ei<strong>the</strong>r a fixed or aflexible exchange r<strong>at</strong>e regime. Moreover, in contrast to a dynamic model, <strong>the</strong> country fixedeffects framework provides inform<strong>at</strong>ion with respect to <strong>the</strong> fit of <strong>the</strong> model (in particular withrespect to <strong>the</strong> cross section <strong>and</strong> time dimension), it is more robust to a smaller sample size,<strong>and</strong> allows for testing <strong>the</strong> effect of exchange r<strong>at</strong>e vol<strong>at</strong>ility for sub-groups of countries.However, <strong>the</strong> fixed effects framework is likely to suffer from endogeneity bias with respectto some of <strong>the</strong> control variables (GDP, for example). To this purpose, <strong>and</strong> for robustnesscheck, we also regress <strong>the</strong> (log of <strong>the</strong>) inflows of FDI in country i <strong>at</strong> time t, against our(altern<strong>at</strong>ive) measure(s) of exchange r<strong>at</strong>e vol<strong>at</strong>ility <strong>and</strong> control variables <strong>at</strong> time t-1:ln FDI α δ β + ε(3)it=i+ Xit −1+ EXit −1itMoreover, rel<strong>at</strong>ively to <strong>the</strong> full sample we also estim<strong>at</strong>e equ<strong>at</strong>ion (2) using <strong>the</strong> GMMestim<strong>at</strong>or proposed by Arellano <strong>and</strong> Bond (1991) <strong>and</strong> developed by Arellano <strong>and</strong> Bover(1995) <strong>and</strong> Blundell <strong>and</strong> Bover (1998). 5 In particular, this GMM model uses <strong>the</strong> lags of allendogenous <strong>and</strong> exogenous variables as instruments. The exchange r<strong>at</strong>e stability indic<strong>at</strong>ors,(<strong>the</strong> interaction term, see equ<strong>at</strong>ion 4) <strong>the</strong> level of openness, real GDP, real GDP per capita,<strong>the</strong> price of investment, infl<strong>at</strong>ion, are assumed to be subject to an endogeneity bias. Dummiesfor <strong>the</strong> Asian <strong>and</strong> Russian crises are assumed to be exogenous.However, <strong>the</strong> impact of exchange r<strong>at</strong>e vol<strong>at</strong>ility on FDI could be non linear <strong>and</strong> depend on<strong>the</strong> level of openness. In fact, it could be <strong>the</strong> case th<strong>at</strong> while for rel<strong>at</strong>ively closed economies<strong>the</strong> effect of exchange r<strong>at</strong>e vol<strong>at</strong>ility is negligible, for rel<strong>at</strong>ively open economies (moresubject to external shocks) higher exchange r<strong>at</strong>e stability could favor FDI inflows. To thispurpose, we add to our basic regression ano<strong>the</strong>r variable measuring <strong>the</strong> interaction betweenexchange r<strong>at</strong>e vol<strong>at</strong>ility <strong>and</strong> openness:ln FDI = α + δX+ βEX+ γEX⋅Openness+ ε(4)itiitititOur hypo<strong>the</strong>sis is th<strong>at</strong> β ≥ 0 <strong>and</strong> γ < 0 , so th<strong>at</strong> <strong>the</strong> impact of exchange r<strong>at</strong>e vol<strong>at</strong>ility on FDI( β + γ ⋅Openness)is positive or null <strong>at</strong> low level of openness, but becomes neg<strong>at</strong>ive <strong>at</strong> higherlevel of openness. In o<strong>the</strong>r words, our hypo<strong>the</strong>sis is th<strong>at</strong> while for countries with a low degreeit
Furceri <strong>and</strong> Borelli, Journal of Intern<strong>at</strong>ional <strong>and</strong> Global Economic Studies, 1(1), June 2008, 42-59 47of openness exchange r<strong>at</strong>e flexibility could significantly reduce limited external shocks, incountries with high level of openness <strong>the</strong> transaction costs associ<strong>at</strong>ed with higher exchanger<strong>at</strong>e vol<strong>at</strong>ility overcome <strong>the</strong> potential benefits. Moreover, when <strong>the</strong> two parameters haveopposite sign, it is possible to identify a threshold level for <strong>the</strong> level of openness <strong>at</strong> which <strong>the</strong>effect of exchange r<strong>at</strong>e vol<strong>at</strong>ility on FDI becomes zero. This threshold effect is computed as<strong>the</strong> r<strong>at</strong>io between <strong>the</strong> absolute value of <strong>the</strong> estim<strong>at</strong>ed coefficient for exchange r<strong>at</strong>e vol<strong>at</strong>ility<strong>and</strong> <strong>the</strong> coefficient of <strong>the</strong> interaction term. In <strong>the</strong> same way, since openness is part of ourcontrol variables, it is possible to identify a threshold level for exchange r<strong>at</strong>e vol<strong>at</strong>ility <strong>at</strong>which <strong>the</strong> effect of openness on FDI becomes zero.Finally, for robustness checks we estim<strong>at</strong>e equ<strong>at</strong>ions 2-4 including also time fixed effects,<strong>and</strong> /or considering country r<strong>and</strong>om effects.5. ResultsWe start our empirical analysis estim<strong>at</strong>ing equ<strong>at</strong>ion 2, <strong>and</strong> checking <strong>the</strong> existence of anylinear rel<strong>at</strong>ion between <strong>the</strong> exchange r<strong>at</strong>e vol<strong>at</strong>ility (measured ad <strong>the</strong> z-score against <strong>the</strong> euro)<strong>and</strong> FDI. In <strong>the</strong> first column of Table 1 we report <strong>the</strong> results obtained using country fixedeffects <strong>and</strong> robust variance <strong>and</strong> covariance m<strong>at</strong>rix (S<strong>and</strong>wich Estim<strong>at</strong>or).Analyzing <strong>the</strong> results we can see th<strong>at</strong> <strong>the</strong> (linear) impact of exchange r<strong>at</strong>e vol<strong>at</strong>ility on FDI isnot st<strong>at</strong>istically significant. In particular, <strong>the</strong> only variable th<strong>at</strong> turns out to be st<strong>at</strong>isticallysignificant is openness. In particular, a one percent increase in openness stimul<strong>at</strong>es anincrease of 1.9 percent of FDI. The o<strong>the</strong>r variables are not st<strong>at</strong>istically significant in ourregression when included altoge<strong>the</strong>r. In contrast, step-wise regression suggests th<strong>at</strong> also GDP<strong>and</strong> investment price are significant <strong>and</strong> with signs coherent with <strong>the</strong>ory. However, <strong>the</strong>estim<strong>at</strong>e of <strong>the</strong> impact of exchange r<strong>at</strong>e vol<strong>at</strong>ility is not affected by <strong>the</strong> differentspecific<strong>at</strong>ions of our control variables, <strong>and</strong> thus we decided to report <strong>the</strong> more completeeconometric specific<strong>at</strong>ion 6 , including <strong>the</strong> main macroeconomic determinants of FDI pointedout by <strong>the</strong> liter<strong>at</strong>ure.However, as we already mentioned in <strong>the</strong> previous section, <strong>the</strong> impact of exchange r<strong>at</strong>evol<strong>at</strong>ility on FDI could be non-linear <strong>and</strong> depend on <strong>the</strong> level of openness. In fact, it could be<strong>the</strong> case th<strong>at</strong> while for rel<strong>at</strong>ively closed economies (with rel<strong>at</strong>ively low FDI inflows) <strong>the</strong>effect of exchange r<strong>at</strong>e vol<strong>at</strong>ility is negligible, for rel<strong>at</strong>ively high open economies (<strong>and</strong> thuswith gre<strong>at</strong>er potential to <strong>at</strong>tract FDI <strong>and</strong> more subject to external shocks) higher exchanger<strong>at</strong>e stability could favor <strong>and</strong> stimul<strong>at</strong>e FDI inflows. To this purpose, we add to our previousregression ano<strong>the</strong>r variable measuring <strong>the</strong> interaction between exchange r<strong>at</strong>e vol<strong>at</strong>ility <strong>and</strong>openness (z-Euro * lnOpenness). In column 2 we report <strong>the</strong> results using <strong>the</strong> sameeconometric specific<strong>at</strong>ion of <strong>the</strong> one used in <strong>the</strong> first column. The results clearly show th<strong>at</strong>now <strong>the</strong> impact of exchange r<strong>at</strong>e vol<strong>at</strong>ility on FDI ( β + γ ⋅ Openness)is st<strong>at</strong>isticallysignificant <strong>and</strong> is positive or null <strong>at</strong> low level of openness, but becomes neg<strong>at</strong>ive <strong>at</strong> higherlevel of openness. Moreover, since <strong>the</strong> two parameters have opposite sign, it is possible toidentify a threshold level for <strong>the</strong> level of openness <strong>at</strong> which <strong>the</strong> effect of exchange r<strong>at</strong>evol<strong>at</strong>ility on FDI becomes zero. In particular, <strong>the</strong> threshold level, computed as <strong>the</strong> r<strong>at</strong>iobetween <strong>the</strong> absolute value of <strong>the</strong> estim<strong>at</strong>ed coefficient of exchange r<strong>at</strong>e vol<strong>at</strong>ility <strong>and</strong> <strong>the</strong>coefficient of <strong>the</strong> interaction term, is equal to 4.8 % (125 % ) of <strong>the</strong> log of Openness (<strong>the</strong>level of Openness). This means th<strong>at</strong> while <strong>the</strong> effect of exchange r<strong>at</strong>e vol<strong>at</strong>ility on FDI (onaverage) is neg<strong>at</strong>ive for those countries characterized by a level of openness higher than
Furceri <strong>and</strong> Borelli, Journal of Intern<strong>at</strong>ional <strong>and</strong> Global Economic Studies, 1(1), June 2008, 42-59 48125%, it is (on average) positive for those countries characterized by a level of openness lessthan 125%. 7Very similar results, in terms of <strong>the</strong> magnitude of <strong>the</strong> coefficients of exchange r<strong>at</strong>e vol<strong>at</strong>ility<strong>and</strong> <strong>the</strong> interaction term, are obtained when we include in our specific<strong>at</strong>ion also time fixedeffects (column 3). In contrast, when we use r<strong>and</strong>om effects (column 4) we can see th<strong>at</strong> both<strong>the</strong> estim<strong>at</strong>ed coefficient of exchange r<strong>at</strong>e vol<strong>at</strong>ility <strong>and</strong> <strong>the</strong> one of <strong>the</strong> interaction term aresmaller. However, since <strong>the</strong> change of <strong>the</strong> estim<strong>at</strong>es is in <strong>the</strong> same direction, <strong>the</strong> estim<strong>at</strong>e of<strong>the</strong> threshold level is almost unchanged. Moreover, <strong>the</strong> results are very similar when we alsoadd time fixed effects in <strong>the</strong> country r<strong>and</strong>om effects estim<strong>at</strong>ion (column 5). Finally, it’sworthwhile to mention th<strong>at</strong> in <strong>the</strong> r<strong>and</strong>om effects model some of our controls (namely, GDP<strong>and</strong> GDP per capita) are significant even in <strong>the</strong> full specific<strong>at</strong>ion (when all controls areadded).5.1 Robustness CheckThe results shown in Table 1 may be driven by endogeneity problems or by <strong>the</strong> particularchoice of our measure of exchange r<strong>at</strong>e vol<strong>at</strong>ility. To isol<strong>at</strong>e such effects <strong>and</strong> to check forrobustness of our results, we first estim<strong>at</strong>e <strong>the</strong> rel<strong>at</strong>ion between exchange r<strong>at</strong>e vol<strong>at</strong>ility <strong>and</strong>FDI considering respectively GMM, fixed <strong>and</strong> r<strong>and</strong>om effects estim<strong>at</strong>or with lagged valuesof explan<strong>at</strong>ory variables, <strong>and</strong> second we re-estim<strong>at</strong>e equ<strong>at</strong>ion (3) considering differentmeasure of exchange r<strong>at</strong>e vol<strong>at</strong>ility.Starting with <strong>the</strong> endogeneity issue, Table 2 reports <strong>the</strong> results obtained using <strong>the</strong> Arellano-Bond estim<strong>at</strong>es of equ<strong>at</strong>ion (2) (column 1), country fixed effects estim<strong>at</strong>es with lagged valuesof explan<strong>at</strong>ory variables (column 2) <strong>and</strong> r<strong>and</strong>om effects estim<strong>at</strong>es with lagged values of <strong>the</strong>explan<strong>at</strong>ory variables (column 3). Analyzing <strong>the</strong> results, we can see th<strong>at</strong> <strong>the</strong> effects ofexchange r<strong>at</strong>e vol<strong>at</strong>ility, of <strong>the</strong> interaction term <strong>and</strong> of openness are mostly unchanged.Moreover, <strong>the</strong> estim<strong>at</strong>e of <strong>the</strong> threshold effect is broadly similar across <strong>the</strong> three differentmethods, ranging from 4.2% for <strong>the</strong> r<strong>and</strong>om effects to 5.1% for <strong>the</strong> Arellano-Bond.Table 3 replic<strong>at</strong>es <strong>the</strong> estim<strong>at</strong>e reported in <strong>the</strong> second column of Table1 for differentmeasures of vol<strong>at</strong>ility <strong>and</strong> interactions. In particular, we consider <strong>the</strong> z-measure computedusing <strong>the</strong> dollar as anchor currency (coulmn2), <strong>the</strong> st<strong>and</strong>ard devi<strong>at</strong>ion against <strong>the</strong> euro(column 3) <strong>and</strong> <strong>the</strong> average depreci<strong>at</strong>ion r<strong>at</strong>e against <strong>the</strong> euro (column 4). Again, <strong>the</strong> resultsare robust to different specific<strong>at</strong>ions. In fact, <strong>the</strong> sign of <strong>the</strong> exchange r<strong>at</strong>e vol<strong>at</strong>ility <strong>and</strong> of <strong>the</strong>interaction term are unchanged <strong>and</strong> <strong>the</strong> estim<strong>at</strong>e of threshold level is similar across <strong>the</strong>different measures of vol<strong>at</strong>ility.5.2 Country GroupsAs it has been pointed out by <strong>the</strong> economic liter<strong>at</strong>ure (i.e. Eichengreen <strong>and</strong> Leblang, 2003;Aghion et al. 2005; De Grauwe <strong>and</strong> Schnabl, 2005) <strong>the</strong> effect of exchange r<strong>at</strong>e vol<strong>at</strong>ility onmacroeconomic performance, especially in terms of investments <strong>and</strong> growth, is not veryrobust but heavily depends on <strong>the</strong> time <strong>and</strong> sample of analysis. Moreover, as we mentioned insection 1 <strong>and</strong> shown in section 2 <strong>the</strong> case for FDI is particularly compelling in transitioneconomies. Thus, it is important to underst<strong>and</strong> whe<strong>the</strong>r <strong>the</strong> results obtained so far are drivenby certain country groups or whe<strong>the</strong>r <strong>the</strong> effect of exchange r<strong>at</strong>e vol<strong>at</strong>ility on FDI is broadlysimilar across country groups.
Furceri <strong>and</strong> Borelli, Journal of Intern<strong>at</strong>ional <strong>and</strong> Global Economic Studies, 1(1), June 2008, 42-59 50becomes (on average) neg<strong>at</strong>ive for those countries characterized by a level of opennesshigher than 106% (181 %) .Endnotes#Davide Furceri. Corresponding author. Mailing Address: European Central Bank,<strong>Direct</strong>or<strong>at</strong>e General Economics, Kaiserstraße 29, D-60311 Frankfurt am Main, Germany.Email: Davide.Furceri@ecb.int / Furceri@economia.unipa.it.+Sara Borelli. Mailing address: Department of Economics, University of Illinois <strong>at</strong> Chicago,2103 UH 601 S. Morgan Street 60607 Chicago-IL, USA. E-mail: sborel2@uic.edu <strong>and</strong>Dipartimento di Scienze Economiche, Viale dell’Universita’ 4, 37129 Verona-Italy. E-mail:saraborelli77@gmail.com.1. See Clausing <strong>and</strong> Dorobantu (2005) for an extensive liter<strong>at</strong>ure review.2. See next section for a detailed list <strong>and</strong> classific<strong>at</strong>ion of countries.3. Official (IMF) classific<strong>at</strong>ions of exchange r<strong>at</strong>e arrangements as published in <strong>the</strong> IMFAnnual Report on <strong>Exchange</strong> <strong>R<strong>at</strong>e</strong> Arrangements <strong>and</strong> <strong>Exchange</strong> Restrictions provide ameasure for <strong>the</strong> commitment by <strong>the</strong> monetary authorities in favour of specified exchange r<strong>at</strong>etargets. The IMF classifies de jure exchange r<strong>at</strong>e arrangements into eight groups with a risingdegree of exchange r<strong>at</strong>e flexibility: 1) exchange r<strong>at</strong>e regime with no separ<strong>at</strong>e legal tender; 2)currency board arrangements; 3) o<strong>the</strong>r conventional fixed peg arrangements (with a b<strong>and</strong> ofmost ± 1 percent); 4) pegged exchange r<strong>at</strong>e arrangements with horizontal b<strong>and</strong>s (<strong>at</strong> least ± 1percent); 5) crawling pegs (with small, pre-announced adjustment); 6) exchange r<strong>at</strong>es withcrawling b<strong>and</strong>s; 7) managed flo<strong>at</strong>ing with no pre-announced p<strong>at</strong>h for exchange r<strong>at</strong>e; 8)independent flo<strong>at</strong>ing (market-determined exchange r<strong>at</strong>e <strong>and</strong> independent monetary policy).4. See, for example, Lansbury et al. (1996), Altomonte (1998), Holl<strong>and</strong> <strong>and</strong> Pain (1998),Rasmini (2000), Woodward et al. (2000), Smarzynska (2002), Brada et al. (2003), Cartensen<strong>and</strong> Toubal (2003), Kinoshita <strong>and</strong> Campos (2003), Clausing <strong>and</strong> Dorobantu (2005).5. Arellano <strong>and</strong> Bover (1995) <strong>and</strong> Blundell <strong>and</strong> Bover (1998) improve <strong>the</strong> efficiency of <strong>the</strong>“difference GMM” estim<strong>at</strong>or by introducing additional assumptions of no correl<strong>at</strong>ionbetween <strong>the</strong> fixed-effects <strong>and</strong> <strong>the</strong> first differences of <strong>the</strong> instrument variables.6. Additional results are available upon request.7. Similarly our results suggest th<strong>at</strong> while <strong>the</strong> effect of openness on FDI is positive for lowlevel of exchange r<strong>at</strong>e vol<strong>at</strong>ility, it could become neg<strong>at</strong>ive for countries with very highexchange r<strong>at</strong>e vol<strong>at</strong>ility.8. Also for this group <strong>the</strong> measure of exchange r<strong>at</strong>e vol<strong>at</strong>ility <strong>and</strong> FDI have a similar sign ofthose rel<strong>at</strong>ive to <strong>the</strong> full sample, but are insignificant. This could be mainly due to <strong>the</strong> lack ofsufficient degree of freedom in <strong>the</strong> econometric specific<strong>at</strong>ion for this country group.
Furceri <strong>and</strong> Borelli, Journal of Intern<strong>at</strong>ional <strong>and</strong> Global Economic Studies, 1(1), June 2008, 42-59 51ReferencesAghion, P., P. Bachetta, R. Ranciere, <strong>and</strong> K. Rogoff. 2005. “Productivity Growth <strong>and</strong> <strong>the</strong><strong>Exchange</strong> <strong>R<strong>at</strong>e</strong> Regime: The Role of Financial Development,” NBER Working Paper 12117.Altomonte, C. 1998. “FDI in <strong>the</strong> CEECs <strong>and</strong> <strong>the</strong> Theory of Real Options: An EmpiricalAssessment,” LICOS Discussion Paper 76, K<strong>at</strong>holieke Universiteit Leuven, Belgium.Arellano, M. <strong>and</strong> B. Stephen. 1991. “Some Tests of Specific<strong>at</strong>ion for Panel D<strong>at</strong>a: MonteCarlo Evidence <strong>and</strong> an Applic<strong>at</strong>ion to Employment Equ<strong>at</strong>ions,” Review of Economic Studies,58, 277–297.Arellano, M. <strong>and</strong> B. Olympia. 1995. “Ano<strong>the</strong>r Look <strong>at</strong> <strong>the</strong> Instrumental-Variable Estim<strong>at</strong>ionof Error-Components Models,” Journal of Econometrics, 68, 29-51.Brada, J. C., A. M. Kutan, <strong>and</strong> T. Yigit. 2003. “The Effects of Transition <strong>and</strong> PoliticalInstability on <strong>Foreign</strong> <strong>Direct</strong> Investment: Central Europe <strong>and</strong> <strong>the</strong> Balkans,” Center forEuropean Integr<strong>at</strong>ion Studies Working Paper B28, Germany: Bonn.Bacchetta, P. <strong>and</strong> E. Van Wincoop. 1998. “Does <strong>Exchange</strong> <strong>R<strong>at</strong>e</strong> Stability Increase Trade<strong>and</strong> Capital Flows?” NBER Working Papers 6704.Carstensen, K. <strong>and</strong> F. Toubal. 2003. “<strong>Foreign</strong> <strong>Direct</strong> Investment in Central <strong>and</strong> EasternEuropean Countries: A Dynamic Panel Analysis,” Kiel Institute for World EconomicsWorking Paper No. 1143, Germany: Kiel.Clausing, K. <strong>and</strong> C. Dorobantu. 2005. “Re-entering Europe: Does European UnionC<strong>and</strong>idacy Boost <strong>Foreign</strong> <strong>Direct</strong> Investment?” Economics of Transition, 13, 77-103.De Grauwe, P. <strong>and</strong> G. Schnabl. 2005. “<strong>Exchange</strong> <strong>R<strong>at</strong>e</strong> Regime <strong>and</strong> MacroeconomicPerformance in Central <strong>and</strong> Eastern Europe,” CESifo Working Paper 1182.Eichengreen, B. <strong>and</strong> D. Leblang. 2003. “<strong>Exchange</strong> <strong>R<strong>at</strong>e</strong>s <strong>and</strong> Cohesion: HistoricalPerspectives <strong>and</strong> Political-Economy Consider<strong>at</strong>ions,” Journal of Common Market Studies,41, 797–822.Fischer, S. 2001. “<strong>Exchange</strong> <strong>R<strong>at</strong>e</strong> Regimes: Is <strong>the</strong> Bipolar View Correct?” Journal ofEconomic Perspectives, 15, 3–24.Frankel, J. <strong>and</strong> A. Rose. 2002. “An Estim<strong>at</strong>e of <strong>the</strong> Effect of Common Currencies on Trade<strong>and</strong> Income,” Quarterly Journal of Economics, 117, 437–66.Friedman, M. 1953. “The Methodology of Positive Economics,” in Essays in PositiveEconomics. Chicago: University of Chicago Press.Furceri, D. 2007. “From Currency Unions to a World Currency: A Possibility?”Intern<strong>at</strong>ional Journal of Applied Economics, 4, 17-32.Ghosh, A., A. Gulde, <strong>and</strong> W. Holger. 2003. <strong>Exchange</strong> <strong>R<strong>at</strong>e</strong> Regimes: Choices <strong>and</strong>Consequences. Cambridge, Massachusetts: MIT Press.
Furceri <strong>and</strong> Borelli, Journal of Intern<strong>at</strong>ional <strong>and</strong> Global Economic Studies, 1(1), June 2008, 42-59 53Figure 1. <strong>Exchange</strong> r<strong>at</strong>e vol<strong>at</strong>ility in <strong>the</strong> <strong>EMU</strong> neighbourhoodPercent1098765432101995 1996 1997 1998 1999 2000 2001 2002 2003 2004Time$€Source: IMF (IFS). <strong>Vol<strong>at</strong>ility</strong> defined as percentage devi<strong>at</strong>ions of <strong>the</strong> monthly exchange r<strong>at</strong>e(Coefficient of Vari<strong>at</strong>ion). Country groups calcul<strong>at</strong>ed as arithmetic averages.Figure 2. <strong>Exchange</strong> <strong>R<strong>at</strong>e</strong> <strong>Vol<strong>at</strong>ility</strong> in <strong>the</strong> non-<strong>EMU</strong> Developed Countries8Percent765432101995 1996 1997 1998 1999 2000 2001 2002 2003 2004Time$€Source: IMF (IFS). <strong>Vol<strong>at</strong>ility</strong> defined as percentage devi<strong>at</strong>ions of <strong>the</strong> monthly exchange r<strong>at</strong>e(Coefficient of Vari<strong>at</strong>ion). Country groups calcul<strong>at</strong>ed as arithmetic averages.
Furceri <strong>and</strong> Borelli, Journal of Intern<strong>at</strong>ional <strong>and</strong> Global Economic Studies, 1(1), June 2008, 42-59 54Figure 3. <strong>Exchange</strong> <strong>R<strong>at</strong>e</strong> <strong>Vol<strong>at</strong>ility</strong> in <strong>the</strong> Emerging Europe Countries8Percent765432101995 1996 1997 1998 1999 2000 2001 2002 2003 2004Time$€Source: IMF (IFS). <strong>Vol<strong>at</strong>ility</strong> defined as percentage devi<strong>at</strong>ions of <strong>the</strong> monthly exchange r<strong>at</strong>e (Coefficientof Vari<strong>at</strong>ion). Country groups calcul<strong>at</strong>ed as arithmetic averages.Figure 4. <strong>Exchange</strong> <strong>R<strong>at</strong>e</strong> <strong>Vol<strong>at</strong>ility</strong> in <strong>the</strong> CIS Countries3025Percent2015105$€01995 1996 1997 1998 1999 2000 2001 2002 2003 2004TimeSource: IMF (IFS). <strong>Vol<strong>at</strong>ility</strong> defined as percentage devi<strong>at</strong>ions of <strong>the</strong> monthly exchange r<strong>at</strong>e (Coefficientof Vari<strong>at</strong>ion). Country groups calcul<strong>at</strong>ed as arithmetic averages.
Furceri <strong>and</strong> Borelli, Journal of Intern<strong>at</strong>ional <strong>and</strong> Global Economic Studies, 1(1), June 2008, 42-59 55Figure 5. <strong>Exchange</strong> <strong>R<strong>at</strong>e</strong> <strong>Vol<strong>at</strong>ility</strong> in <strong>the</strong> Mediterranean Countries65Percent4321$€01995 1996 1997 1998 1999 2000 2001 2002 2003 2004TimeSource: IMF (IFS). <strong>Vol<strong>at</strong>ility</strong> defined as percentage devi<strong>at</strong>ions of <strong>the</strong> monthly exchange r<strong>at</strong>e (Coefficientof Vari<strong>at</strong>ion). Country groups calcul<strong>at</strong>ed as arithmetic averages.Figure 6. FDI (net) Inflows in <strong>the</strong> <strong>EMU</strong> Neighbourhood120100<strong>EMU</strong> PeripheryPercent og GDP80604020Non <strong>EMU</strong>-DevelopedEmerging EuropeCISMediterraneanCountries019951996Source: UNCTAD.199719981999Time20002001200220032004
Furceri <strong>and</strong> Borelli, Journal of Intern<strong>at</strong>ional <strong>and</strong> Global Economic Studies, 1(1), June 2008, 42-59 56Table 1. <strong>Exchange</strong> <strong>R<strong>at</strong>e</strong> <strong>Vol<strong>at</strong>ility</strong> <strong>and</strong> FDIFE with TimeRE with TimeFEFE Dummies RE Dummies(1) (2) (3) (4) (5)EX -0.003 0.058 0.053 0.032 0.031(-1.18) (4.63)*** (4.09)*** (3.25)*** (3.05)***Interaction - -0.012 -0.011 -0.007 -0.007- (-4.85)*** (-4.23)*** (-3.37)*** (-3.16)***GDP 1.153 1.151 0.401 1.068 1.017(0.69) (0.72) (0.22) (12.88)*** (12.08)***GDP per capita 0.774 0.662 1.066 0.765 0.691(0.45) (0.40) (0.66) (5.83)*** (5.25)***OPEN 1.922 2.397 2.199 1.659 1.446(6.06)*** (6.50)*** (4.71)*** (6.01)*** (4.94)***Barriers 0.000 0.000 0.000 0.000 0.000(0.41) (0.60) (0.88) (0.36) (0.10)Infl<strong>at</strong>ion -0.004 -0.005 -0.004 -0.009 -0.006(-1.17) (-1.04) (-0.91) (-1.43) (-1.26)Price ofInvestment -0.027 -0.002 0.000 0.000 0.002(-0.74) (-0.58) (0.02) (0.43) (1.23)Dummy Asian 0.139 0.140 0.044 0.100 -0.240(1.07) (1.22) (0.17) -0.830 (-1.33)Dummy Russian 0.190 0.170 - 0.179 -(1.13) (1.26) - (1.25) -Observ<strong>at</strong>ions 332 332 332 332 332R 2 -within 0.29 0.32 0.36 0.31 0.35R 2 -between 0.78 0.68 0.32 0.84 0.85R 2 -overall 0.70 0.61 0.32 0.74 0.76Robust st<strong>and</strong>ard errors; t-st<strong>at</strong>istics in paren<strong>the</strong>sis;*,**,*** respectively significant <strong>at</strong> 10%,5% <strong>and</strong> 1%.
Furceri <strong>and</strong> Borelli, Journal of Intern<strong>at</strong>ional <strong>and</strong> Global Economic Studies, 1(1), June 2008, 42-59 57Table 2. Robustness Results for EndogeneityAB^ FE RE(1) (2) (3)EX 0.036 0.053 0.025(3.48)*** (3.89)*** (2.58)***Interaction -0.007 -0.011 -0.006(2.62)*** (-3.91)*** (-2.62)***GDP 3.899 2.466 1.054(1.21) (1.61)* (11.29)***GDP per capita -1.688 -0.903 0.714(-0.58) (-0.57) (4.74)***OPEN 1.651 2.393 1.640(2.52)** (5.62)*** (4.74)***Barriers 0.000 0.000 0.000(1.02) (0.09) (-0.22)Infl<strong>at</strong>ion 0.009 -0.003 -0.004(3.64)*** (-0.80) (-1.14)Price of Investment 0.011 -0.001 0.000(2.14)** (-0.31) (0.12)Dummy Asian 0.465 - -(3.50)*** - -Dummy Russian -0.329 - -(-1.59) - -Observ<strong>at</strong>ions 260 302 332R 2 -within - 0.27 0.36R 2 -between - 0.49 0.32R 2 -overall - 0.44 0.32Robust st<strong>and</strong>ard errors; t-st<strong>at</strong>istics in paren<strong>the</strong>sis;*,**,*** respectively significant <strong>at</strong> 10%,5% <strong>and</strong> 1%.^Sargan Test (p-value)=0.09;Serial correl<strong>at</strong>ion(p-value): a) First order=0.00; b) Second order=0.47
Furceri <strong>and</strong> Borelli, Journal of Intern<strong>at</strong>ional <strong>and</strong> Global Economic Studies, 1(1), June 2008, 42-59 58Table 3. Robustness Results for Measures of <strong>Vol<strong>at</strong>ility</strong>z-Euro z-Dollar SD-Euro Mu-Euro(1) (2) (3) (4)EX 0.058 1.043 0.053 0.058(4.63)*** (3.82)*** (4.09)*** (4.62)***Interaction -0.012 -0.230 -0.011 -0.012(-4.85)*** (-3.79)*** (-4.23)*** (-4.84)***GDP 1.151 1.100 0.401 1.151(0.72) (0.70) (0.22) (0.72)GDP per capita 0.662 0.766 1.066 0.664(0.40) (0.48) (0.66) (0.40)OPEN 2.397 2.171 2.199 2.397(6.50)*** (6.14)*** (4.71)*** (6.50)***Barriers 0.000 0.000 0.000 0.000(0.60) (0.50) (0.88) (0.36)Infl<strong>at</strong>ion -0.005 -0.005 -0.004 -0.005(-1.04) (-1.10) (-0.91) (-1.04)Price of Investment -0.002 -0.002 0.000 -0.002(-0.58) (-0.58) (0.02) (-0.58)Dummy Asian 0.140 0.152 0.044 0.140(1.22) (1.30) (0.17) (1.22)Dummy Russian 0.170 0.166 0.166 0.171(1.26) (1.21) (1.21) (1.26)Observ<strong>at</strong>ions 332 332 332 332R 2 -within 0.32 0.32 0.32 0.32R 2 -between 0.68 0.73 0.78 0.68R 2 -overall 0.61 0.66 0.70 0.61Robust st<strong>and</strong>ard errors; t-st<strong>at</strong>istics in paren<strong>the</strong>sis;*,**,*** respectively significant <strong>at</strong> 10%,5% <strong>and</strong> 1%.
Furceri <strong>and</strong> Borelli, Journal of Intern<strong>at</strong>ional <strong>and</strong> Global Economic Studies, 1(1), June 2008, 42-59 59Table 4. <strong>Exchange</strong> <strong>R<strong>at</strong>e</strong> <strong>Vol<strong>at</strong>ility</strong> <strong>and</strong> FDI by Country Groupsnon-<strong>EMU</strong> EmergingMediterraneanindustrialized EuropeCIScountries(1) (2) (3) (4)EX 0.132 0.056 0.052 0.550(0.22) (2.37)** (3.15)*** (0.30)Interaction -0.003 -0.012 -0.010 -0.122(-0.02) (-2.99)*** (-3.14)*** (-0.28)GDP 38.000 3.643 -13.368 7.556(1.36) (1.22) (-1.67)* (1.76)*GDP per capita -35.137 -1.192 14.566 -12.450(-1.40) (-0.40) (1.85)* (-1.45)OPEN 5.154 2.124 2.828 0.514(1.16) (3.79)*** (3.10)*** (0.11)Barriers 0.001 -0.001 0.002 0.000(0.12) (-0.36) (1.18) (0.37)Infl<strong>at</strong>ion -0.255 0.002 -0.008 -0.082(-1.86)* (0.78) (-0.62) (-0.99)Price of Investment -0.020 -0.010 0.011 0.008(-0.95) (-1.45) (0.84) (1.56)Dummy Asian 2.381 -0.142 0.576 0.329(1.38) (-0.73) (2.32)** (1.57)Dummy Russian -0.108 0.296 0.123 -0.416(-0.23) (1.35) (0.51) (-1.31)Observ<strong>at</strong>ions 58 159 75 40R 2 -within 0.29 0.39 0.61 0.25R 2 -between 0.18 0.62 0.72 0.28R 2 -overall 0.03 0.49 0.51 0.20Robust st<strong>and</strong>ard errors; t-st<strong>at</strong>istics in paren<strong>the</strong>sis;*,**,*** respectively significant <strong>at</strong> 10%,5% <strong>and</strong> 1%.