

Vanguard Tax-Managed International Fund Annual Report ...
Vanguard Tax-Managed International Fund Annual Report ...
Vanguard Tax-Managed International Fund Annual Report ...

You also want an ePaper? Increase the reach of your titles
YUMPU automatically turns print PDFs into web optimized ePapers that Google loves.
<strong>Tax</strong>-<strong>Managed</strong> <strong>International</strong> <strong>Fund</strong><br />
Performance Summary<br />
All of the returns in this report represent past performance, which is not a guarantee of future<br />
results that may be achieved by the fund. (Current performance may be lower or higher than<br />
the performance data cited. For performance data current to the most recent month-end, visit<br />
our website at www.vanguard.com/performance.) Note, too, that both investment returns and<br />
principal value can fluctuate widely, so an investor’s shares, when sold, could be worth more<br />
or less than their original cost. The returns shown do not reflect taxes that a shareholder would<br />
pay on fund distributions or on the sale of fund shares.<br />
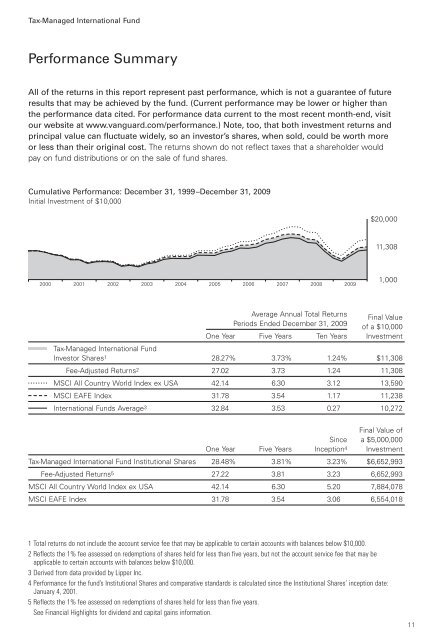
Cumulative Performance: December 31, 1999–December 31, 2009<br />
Initial Investment of $10,000<br />
2000<br />
2001<br />
2002<br />
2003<br />
2004<br />
1 Total returns do not include the account service fee that may be applicable to certain accounts with balances below $10,000.<br />
2 Reflects the 1% fee assessed on redemptions of shares held for less than five years, but not the account service fee that may be<br />
applicable to certain accounts with balances below $10,000.<br />
3 Derived from data provided by Lipper Inc.<br />
4 Performance for the fund’s Institutional Shares and comparative standards is calculated since the Institutional Shares’ inception date:<br />
January 4, 2001.<br />
5 Reflects the 1% fee assessed on redemptions of shares held for less than five years.<br />
See Financial Highlights for dividend and capital gains information.<br />
2005<br />
2006<br />
2007<br />
2008<br />
2009<br />
$20,000<br />
11,308<br />
1,000<br />
Average <strong>Annual</strong> Total Returns<br />
Periods Ended December 31, 2009<br />
Final Value<br />
of a $10,000<br />
One Year Five Years Ten Years Investment<br />
<strong>Tax</strong>-<strong>Managed</strong> <strong>International</strong> <strong>Fund</strong><br />
Investor Shares1 28.27% 3.73% 1.24% $11,308<br />
Fee-Adjusted Returns2 27.02 3.73 1.24 11,308<br />
MSCI All Country World Index ex USA 42.14 6.30 3.12 13,590<br />
MSCI EAFE Index 31.78 3.54 1.17 11,238<br />
<strong>International</strong> <strong>Fund</strong>s Average3 32.84 3.53 0.27 10,272<br />
Since<br />
Final Value of<br />
a $5,000,000<br />
One Year Five Years Inception4 Investment<br />
<strong>Tax</strong>-<strong>Managed</strong> <strong>International</strong> <strong>Fund</strong> Institutional Shares 28.48% 3.81% 3.23% $6,652,993<br />
Fee-Adjusted Returns5 27.22 3.81 3.23 6,652,993<br />
MSCI All Country World Index ex USA 42.14 6.30 5.20 7,884,078<br />
MSCI EAFE Index 31.78 3.54 3.06 6,554,018<br />
11


