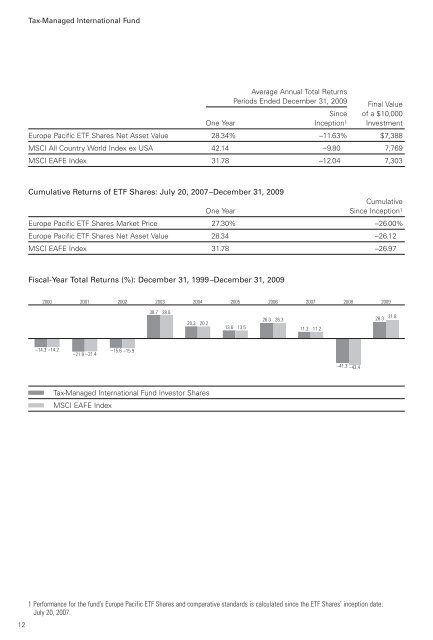
12 <strong>Tax</strong>-<strong>Managed</strong> <strong>International</strong> <strong>Fund</strong> Average <strong>Annual</strong> Total Returns Periods Ended December 31, 2009 Final Value Since of a $10,000 One Year Inception1 Investment Europe Pacific ETF Shares Net Asset Value 28.34% –11.63% $7,388 MSCI All Country World Index ex USA 42.14 –9.80 7,769 MSCI EAFE Index 31.78 –12.04 7,303 Cumulative Returns of ETF Shares: July 20, 2007–December 31, 2009 One Year Cumulative Since Inception1 Europe Pacific ETF Shares Market Price 27.30% –26.00% Europe Pacific ETF Shares Net Asset Value 28.34 –26.12 MSCI EAFE Index 31.78 –26.97 Fiscal-Year Total Returns (%): December 31, 1999–December 31, 2009 2000 –14.3 –14.2 2001 –21.9 –21.4 2002 –15.6 –15.9 2003 38.7 38.6 2004 20.3 20.2 <strong>Tax</strong>-<strong>Managed</strong> <strong>International</strong> <strong>Fund</strong> Investor Shares MSCI EAFE Index 13.6 13.5 1 Performance for the fund’s Europe Pacific ETF Shares and comparative standards is calculated since the ETF Shares’ inception date: July 20, 2007. 2005 2006 26.3 26.3 2007 11.2 11.2 2008 –41.3 –43.4 2009 28.3 31.8
<strong>Tax</strong>-<strong>Managed</strong> <strong>International</strong> <strong>Fund</strong> Financial Statements Statement of Net Assets As of December 31, 2009 The fund reports a complete list of its holdings in regulatory filings four times in each fiscal year, at the quarter-ends. For the second and fourth fiscal quarters, the lists appear in the fund’s semiannual and annual reports to shareholders. For the first and third fiscal quarters, the fund files the lists with the Securities and Exchange Commission on Form N-Q. Shareholders can look up the fund’s Forms N-Q on the SEC’s website at www.sec.gov. Forms N-Q may also be reviewed and copied at the SEC’s Public Reference Room (see the back cover of this report for further information). Market Value• Shares ($000) Common Stocks (99.9%) Australia (8.3%) BHP Billiton Ltd. Commonwealth Bank of 2,040,729 78,147 Australia 927,860 45,244 Westpac Banking Corp. National Australia 1,781,848 40,108 Bank Ltd. Australia & New Zealand 1,254,357 30,522 Banking Group Ltd. 1,500,103 30,521 Woolworths Ltd. 757,796 18,981 Rio Tinto Ltd. 271,840 17,986 Wesfarmers Ltd. 618,067 17,184 QBE Insurance Group Ltd. 614,298 14,021 Woodside Petroleum Ltd. 331,555 13,935 CSL Ltd. 374,911 10,907 Newcrest Mining Ltd. 308,083 9,656 Telstra Corp. Ltd. 2,738,723 8,393 Origin Energy Ltd. 553,467 8,309 Macquarie Group Ltd. 192,231 8,230 AMP Ltd. 1,251,181 7,535 Santos Ltd. 512,864 6,458 Foster’s Group Ltd. 1,241,334 6,108 Suncorp-Metway Ltd. 787,455 6,081 Brambles Ltd. 906,660 5,492 Orica Ltd. Insurance Australia 233,727 5,418 Group Ltd. 1,330,633 4,766 Amcor Ltd. AXA Asia Pacific 823,067 4,585 Holdings Ltd. 681,484 4,010 Transurban Group 807,906 4,002 Incitec Pivot Ltd. 1,177,250 3,731 AGL Energy Ltd. 294,261 3,702 Toll Holdings Ltd. 473,313 3,688 Coca-Cola Amatil Ltd. 356,967 3,678 ASX Ltd. 113,337 3,530 Sonic Healthcare Ltd. 253,128 3,486 Leighton Holdings Ltd. 96,283 3,253 Market Value • Shares ($000) BlueScope Steel Ltd. 1,147,219 3,166 Computershare Ltd. 307,808 3,139 WorleyParsons Ltd. 117,873 3,053 * Fortescue Metals Group Ltd. 746,026 2,938 * Alumina Ltd. 1,764,758 2,898 Lend Lease Group 302,897 2,760 TABCORP Holdings Ltd. 433,548 2,688 * Asciano Group 1,657,088 2,675 Wesfarmers Ltd. Price Protected Shares 93,546 2,601 Cochlear Ltd. 40,501 2,501 * OZ Minerals Ltd. 2,372,018 2,480 * James Hardie Industries NV 321,444 2,424 OneSteel Ltd. 812,040 2,416 Qantas Airways Ltd. 880,294 2,340 Boral Ltd. 422,964 2,235 Tatts Group Ltd. 1,014,190 2,212 Crown Ltd. 298,990 2,141 Metcash Ltd. 527,486 2,111 Fairfax Media Ltd. 1,331,301 2,053 Bendigo and Adelaide Bank Ltd. 218,117 1,912 CSR Ltd. 1,102,013 1,773 Sims Metal Management Ltd. 87,661 1,716 Goodman Fielder Ltd. 1,084,467 1,579 Harvey Norman Holdings Ltd. 402,112 1,510 * Paladin Energy Ltd. 406,196 1,508 * Arrow Energy Ltd. 369,834 1,369 Billabong <strong>International</strong> Ltd. 127,462 1,239 MAp Group 448,081 1,210 Aristocrat Leisure Ltd. 310,272 1,108 Nufarm Ltd. 110,068 1,075 SP AusNet 1,278,312 1,047 Energy Resources of Australia Ltd. 44,108 943 * Caltex Australia Ltd. 92,691 769 13