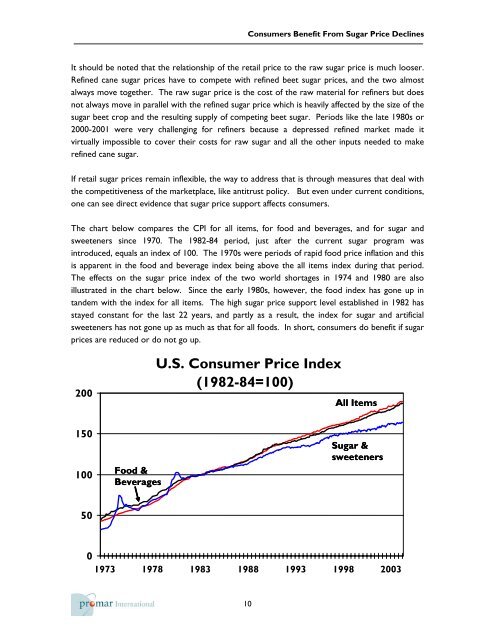
<strong>Consumers</strong> <strong>Benefit</strong> <strong>From</strong> <strong>Sugar</strong> Price DeclinesIt should be noted that the relationship of the retail price to the raw sugar price is much looser.Refined cane sugar prices have to compete with refined beet sugar prices, and the two almostalways move together. The raw sugar price is the cost of the raw material for refiners but doesnot always move in parallel with the refined sugar price which is heavily affected by the size of thesugar beet crop and the resulting supply of competing beet sugar. Periods like the late 1980s or2000-2001 were very challenging for refiners because a depressed refined market made itvirtually impossible to cover their costs for raw sugar and all the other inputs needed to makerefined cane sugar.If retail sugar prices remain inflexible, the way to address that is through measures that deal withthe competitiveness of the marketplace, like antitrust policy. But even under current conditions,one can see direct evidence that sugar price support affects consumers.The chart below compares the CPI for all items, for food and beverages, and for sugar andsweeteners since 1970. The 1982-84 period, just after the current sugar program wasintroduced, equals an index of 100. The 1970s were periods of rapid food price inflation and thisis apparent in the food and beverage index being above the all items index during that period.The effects on the sugar price index of the two world shortages in 1974 and 1980 are alsoillustrated in the chart below. Since the early 1980s, however, the food index has gone up intandem with the index for all items. The high sugar price support level established in 1982 hasstayed constant for the last 22 years, and partly as a result, the index for sugar and artificialsweeteners has not gone up as much as that for all foods. In short, consumers do benefit if sugarprices are reduced or do not go up.200U.S. Consumer Price Index(1982-84=100)All Items150100Food &Beverages<strong>Sugar</strong> &sweeteners5001973 1978 1983 1988 1993 1998 200310
<strong>Consumers</strong> <strong>Benefit</strong> <strong>From</strong> <strong>Sugar</strong> Price DeclinesThis graph clearly refutes the sugar lobby’s central claim that product prices do not rise or fall inrelation to changes in ingredient costs. If that were so, the sugar and sweetener index shouldhave gone up in tandem with the index for all foods and beverages. It did not. Instead, theconstant price support level and periods of lower prices like 1999-2000 were obviouslytranslated into savings for consumers relative to all other food and beverage items.The benefit to consumers of lower sugar prices is clearly evident in countries like Canada, whichimports sugar at the world price, and Australia or Brazil, are producing sugar competitively atrecent world price levels.3.2 <strong>Prices</strong> of sugar-containing productsThe American <strong>Sugar</strong> Alliance (ASA), representing sugar producer interests, often uses a chartshowing that while raw and refined sugar prices have declined since 1990 or 1996, prices ofvarious sugar-containing products have risen. ASA’s choice of those two years for comparisonwas not accidental – 1990 had the highest refined sugar prices since the world shortage of 1980,and 1996 was second highest. Naturally, sugar prices subsequently declined. More importantly,prices of the sugar-containing products they cite have gone up by less than the increase for allfoods and beverages or for all items. This is strong evidence that a decline in or moderation ofsugar prices does have a negative effect on food prices.As one might have guessed from the previous chart showing the slow but relentless increase inthe overall consumer price level, the main determinants of processed food prices are notcommodity costs. Today the farm value of food ingredients makes up less than 20% of whatconsumers actually spend for food.According to USDA, in 2002 consumers spent $709 billion for domestically produced foods,including both food at home and food away from home. Of that total, $577 billion or 81% wasaccounted for by what the Department calls the marketing bill. The chart below plots the farmvalue and marketing bill, and it is clear that the farm share has steadily declined. This is primarilybecause impressive long-term productivity growth in agriculture continues to give us decliningreal prices for all farm commodities. But it is also attributable to the fact that we demand moreconvenience, do less cooking at home, and eat more meals away from home.The main components of the food dollar are illustrated in the second chart on the next page.The marketing bill is comprised of everything but the farm value. Labor is obviously the mostimportant at 37%, followed by packaging at 8 percent. Then there are several categories thateach account for 4-5% of the final cost of food to the consumer – depreciation, advertising,transportation, rent, and pre-tax profits.11