Consumers' demand and willingness to pay for rice attributes in ...
Consumers' demand and willingness to pay for rice attributes in ...
Consumers' demand and willingness to pay for rice attributes in ...

You also want an ePaper? Increase the reach of your titles
YUMPU automatically turns print PDFs into web optimized ePapers that Google loves.
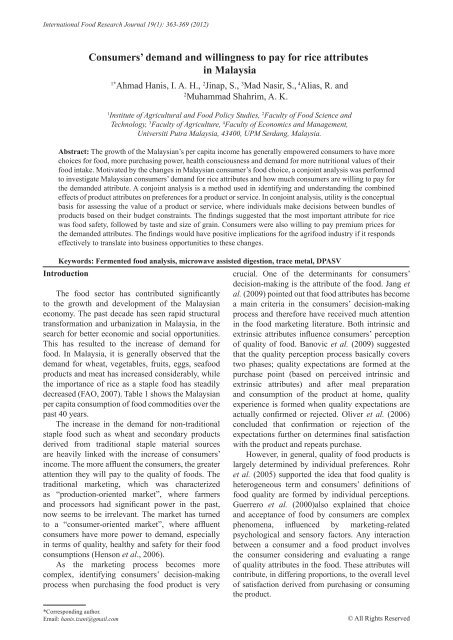
International Food Research Journal 19(1): 363-369 (2012)Consumers’ <strong>dem<strong>and</strong></strong> <strong>and</strong> <strong>will<strong>in</strong>gness</strong> <strong>to</strong> <strong>pay</strong> <strong>for</strong> <strong>rice</strong> <strong>attributes</strong><strong>in</strong> Malaysia1*Ahmad Hanis, I. A. H., 2 J<strong>in</strong>ap, S., 3 Mad Nasir, S., 4 Alias, R. <strong>and</strong>2Muhammad Shahrim, A. K.1Institute of Agricultural <strong>and</strong> Food Policy Studies, 2 Faculty of Food Science <strong>and</strong>Technology, 3 Faculty of Agriculture, 4 Faculty of Economics <strong>and</strong> Management,Universiti Putra Malaysia, 43400, UPM Serdang, Malaysia.Abstract: The growth of the Malaysian’s per capita <strong>in</strong>come has generally empowered consumers <strong>to</strong> have morechoices <strong>for</strong> food, more purchas<strong>in</strong>g power, health consciousness <strong>and</strong> <strong>dem<strong>and</strong></strong> <strong>for</strong> more nutritional values of theirfood <strong>in</strong>take. Motivated by the changes <strong>in</strong> Malaysian consumer’s food choice, a conjo<strong>in</strong>t analysis was per<strong>for</strong>med<strong>to</strong> <strong>in</strong>vestigate Malaysian consumers’ <strong>dem<strong>and</strong></strong> <strong>for</strong> <strong>rice</strong> <strong>attributes</strong> <strong>and</strong> how much consumers are will<strong>in</strong>g <strong>to</strong> <strong>pay</strong> <strong>for</strong>the <strong>dem<strong>and</strong></strong>ed attribute. A conjo<strong>in</strong>t analysis is a method used <strong>in</strong> identify<strong>in</strong>g <strong>and</strong> underst<strong>and</strong><strong>in</strong>g the comb<strong>in</strong>edeffects of product <strong>attributes</strong> on preferences <strong>for</strong> a product or service. In conjo<strong>in</strong>t analysis, utility is the conceptualbasis <strong>for</strong> assess<strong>in</strong>g the value of a product or service, where <strong>in</strong>dividuals make decisions between bundles ofproducts based on their budget constra<strong>in</strong>ts. The f<strong>in</strong>d<strong>in</strong>gs suggested that the most important attribute <strong>for</strong> <strong>rice</strong>was food safety, followed by taste <strong>and</strong> size of gra<strong>in</strong>. Consumers were also will<strong>in</strong>g <strong>to</strong> <strong>pay</strong> premium p<strong>rice</strong>s <strong>for</strong>the <strong>dem<strong>and</strong></strong>ed <strong>attributes</strong>. The f<strong>in</strong>d<strong>in</strong>gs would have positive implications <strong>for</strong> the agrifood <strong>in</strong>dustry if it respondseffectively <strong>to</strong> translate <strong>in</strong><strong>to</strong> bus<strong>in</strong>ess opportunities <strong>to</strong> these changes.Keywords: Fermented food analysis, microwave assisted digestion, trace metal, DPASVIntroductionThe food sec<strong>to</strong>r has contributed significantly<strong>to</strong> the growth <strong>and</strong> development of the Malaysianeconomy. The past decade has seen rapid structuraltrans<strong>for</strong>mation <strong>and</strong> urbanization <strong>in</strong> Malaysia, <strong>in</strong> thesearch <strong>for</strong> better economic <strong>and</strong> social opportunities.This has resulted <strong>to</strong> the <strong>in</strong>crease of <strong>dem<strong>and</strong></strong> <strong>for</strong>food. In Malaysia, it is generally observed that the<strong>dem<strong>and</strong></strong> <strong>for</strong> wheat, vegetables, fruits, eggs, seafoodproducts <strong>and</strong> meat has <strong>in</strong>creased considerably, whilethe importance of <strong>rice</strong> as a staple food has steadilydecreased (FAO, 2007). Table 1 shows the Malaysianper capita consumption of food commodities over thepast 40 years.The <strong>in</strong>crease <strong>in</strong> the <strong>dem<strong>and</strong></strong> <strong>for</strong> non-traditionalstaple food such as wheat <strong>and</strong> secondary productsderived from traditional staple material sourcesare heavily l<strong>in</strong>ked with the <strong>in</strong>crease of consumers’<strong>in</strong>come. The more affluent the consumers, the greaterattention they will <strong>pay</strong> <strong>to</strong> the quality of foods. Thetraditional market<strong>in</strong>g, which was characterizedas “production-oriented market”, where farmers<strong>and</strong> processors had significant power <strong>in</strong> the past,now seems <strong>to</strong> be irrelevant. The market has turned<strong>to</strong> a “consumer-oriented market”, where affluentconsumers have more power <strong>to</strong> <strong>dem<strong>and</strong></strong>, especially<strong>in</strong> terms of quality, healthy <strong>and</strong> safety <strong>for</strong> their foodconsumptions (Henson et al., 2006).As the market<strong>in</strong>g process becomes morecomplex, identify<strong>in</strong>g consumers’ decision-mak<strong>in</strong>gprocess when purchas<strong>in</strong>g the food product is verycrucial. One of the determ<strong>in</strong>ants <strong>for</strong> consumers’decision-mak<strong>in</strong>g is the attribute of the food. Jang etal. (2009) po<strong>in</strong>ted out that food <strong>attributes</strong> has becomea ma<strong>in</strong> criteria <strong>in</strong> the consumers’ decision-mak<strong>in</strong>gprocess <strong>and</strong> there<strong>for</strong>e have received much attention<strong>in</strong> the food market<strong>in</strong>g literature. Both <strong>in</strong>tr<strong>in</strong>sic <strong>and</strong>extr<strong>in</strong>sic <strong>attributes</strong> <strong>in</strong>fluence consumers’ perceptionof quality of food. Banovic et al. (2009) suggestedthat the quality perception process basically coverstwo phases; quality expectations are <strong>for</strong>med at thepurchase po<strong>in</strong>t (based on perceived <strong>in</strong>tr<strong>in</strong>sic <strong>and</strong>extr<strong>in</strong>sic <strong>attributes</strong>) <strong>and</strong> after meal preparation<strong>and</strong> consumption of the product at home, qualityexperience is <strong>for</strong>med when quality expectations areactually confirmed or rejected. Oliver et al. (2006)concluded that confirmation or rejection of theexpectations further on determ<strong>in</strong>es f<strong>in</strong>al satisfactionwith the product <strong>and</strong> repeats purchase.However, <strong>in</strong> general, quality of food products islargely determ<strong>in</strong>ed by <strong>in</strong>dividual preferences. Rohret al. (2005) supported the idea that food quality isheterogeneous term <strong>and</strong> consumers’ def<strong>in</strong>itions offood quality are <strong>for</strong>med by <strong>in</strong>dividual perceptions.Guerrero et al. (2000)also expla<strong>in</strong>ed that choice<strong>and</strong> acceptance of food by consumers are complexphenomena, <strong>in</strong>fluenced by market<strong>in</strong>g-relatedpsychological <strong>and</strong> sensory fac<strong>to</strong>rs. Any <strong>in</strong>teractionbetween a consumer <strong>and</strong> a food product <strong>in</strong>volvesthe consumer consider<strong>in</strong>g <strong>and</strong> evaluat<strong>in</strong>g a rangeof quality <strong>attributes</strong> <strong>in</strong> the food. These <strong>attributes</strong> willcontribute, <strong>in</strong> differ<strong>in</strong>g proportions, <strong>to</strong> the overall levelof satisfaction derived from purchas<strong>in</strong>g or consum<strong>in</strong>gthe product.*Correspond<strong>in</strong>g author.Email: hanis.izani@gmail.com© All Rights Reserved
Consumers’ <strong>dem<strong>and</strong></strong> <strong>and</strong> <strong>will<strong>in</strong>gness</strong> <strong>to</strong> <strong>pay</strong> <strong>for</strong> <strong>rice</strong> <strong>attributes</strong> <strong>in</strong> Malaysia 365The data <strong>for</strong> the study was gathered directly from<strong>in</strong>terview respondents <strong>in</strong> face-<strong>to</strong>-face sett<strong>in</strong>g basedon adm<strong>in</strong>istration of a prepared questionnaire.Package of <strong>attributes</strong> <strong>and</strong> levels of <strong>attributes</strong>Primarily, <strong>in</strong> the focus group session, therewere seven potential <strong>attributes</strong> (taste, packag<strong>in</strong>g,biotechnology, food safety, percentage of damage<strong>in</strong> packag<strong>in</strong>g, size of gra<strong>in</strong> <strong>and</strong> p<strong>rice</strong>) that couldbe selected by respondents. Respondents wereasked <strong>to</strong> rank the seven potential <strong>attributes</strong> basedon their preferences. Based on the mean score <strong>for</strong>each <strong>attributes</strong>, four <strong>attributes</strong> were selected as themost important <strong>attributes</strong> <strong>for</strong> <strong>rice</strong>, which are taste,food safety, size of gra<strong>in</strong> <strong>and</strong> p<strong>rice</strong>. The package of<strong>attributes</strong> that were used <strong>in</strong> the study is shown <strong>in</strong>Table 2.Table 2. Package of Attributes <strong>and</strong> Respective LevelsUsed <strong>in</strong> the StudyAttributes Levels DescriptionNormal <strong>rice</strong>Normal <strong>rice</strong>Taste Fragrant <strong>rice</strong>Fragrant <strong>rice</strong>Brown <strong>rice</strong>Brown <strong>rice</strong> (nutritious <strong>rice</strong>)Food Conventional Use <strong>in</strong>secticides <strong>and</strong> pesticides <strong>in</strong> productionSafety OrganicFree-chemical producedShort gra<strong>in</strong>Short gra<strong>in</strong>Size Medium gra<strong>in</strong>Medium gra<strong>in</strong>Long gra<strong>in</strong>Long gra<strong>in</strong>0% <strong>in</strong>crease No <strong>in</strong>crease <strong>in</strong> p<strong>rice</strong>P<strong>rice</strong> 10% <strong>in</strong>crease Increase 10% from the current p<strong>rice</strong>20% <strong>in</strong>crease Increase 20% from the current p<strong>rice</strong>Experimental designHav<strong>in</strong>g selected the relevant <strong>attributes</strong> <strong>and</strong>their levels, hypothetical <strong>rice</strong> profile with differentcomb<strong>in</strong>ations of <strong>attributes</strong> was presented <strong>to</strong>respondents. The comb<strong>in</strong>ations of <strong>attributes</strong> conta<strong>in</strong>edone level of <strong>attributes</strong> from each of the four <strong>attributes</strong>(taste, food safety, size of gra<strong>in</strong> <strong>and</strong> p<strong>rice</strong>) of this study.The study gave rise <strong>to</strong> 54 possible comb<strong>in</strong>ations of<strong>rice</strong> <strong>attributes</strong> (3 x 2 x 3 x 3). However, it is unrealistic<strong>to</strong> ask <strong>in</strong>dividuals their <strong>in</strong>tention <strong>to</strong> purchase <strong>for</strong> <strong>to</strong>omany scenarios, <strong>and</strong> it also could be very tir<strong>in</strong>g <strong>and</strong>time consum<strong>in</strong>g (Murphy et al., 2004). To reducethe number of profiles <strong>to</strong> a manageable size, while atthe same time ma<strong>in</strong>ta<strong>in</strong><strong>in</strong>g r<strong>and</strong>omness, a fractionalfac<strong>to</strong>rial design, us<strong>in</strong>g SPSS, was used. This reducedthe number of profiles <strong>to</strong> be evaluated <strong>to</strong> n<strong>in</strong>e. The<strong>rice</strong> profiles used <strong>in</strong> this study is illustrated <strong>in</strong> Table3. A rat<strong>in</strong>g scale from one <strong>to</strong> ten, with one be<strong>in</strong>g notpreferred <strong>and</strong> ten be<strong>in</strong>g most preferred was chosen.Respondents rated the comb<strong>in</strong>ations of <strong>attributes</strong>accord<strong>in</strong>g <strong>to</strong> their preferences.Data Collection ProceduresA <strong>to</strong>tal of 205 respondents from the capital citiesof all states <strong>in</strong> Malaysia were <strong>in</strong>terviewed us<strong>in</strong>gconvenience sampl<strong>in</strong>g. The cities covered <strong>in</strong>cludeTable 3. Profiles of <strong>rice</strong> evaluated by consumersProfile* Taste Food safety Size of gra<strong>in</strong> P<strong>rice</strong>1 Normal <strong>rice</strong> Conventional Long gra<strong>in</strong> 10% <strong>in</strong>crease2 Normal <strong>rice</strong> Conventional Short gra<strong>in</strong> No <strong>in</strong>crease3 Normal <strong>rice</strong> Organic Medium gra<strong>in</strong> 20% <strong>in</strong>crease4 Brown <strong>rice</strong> Conventional Short gra<strong>in</strong> 20% <strong>in</strong>crease5 Brown <strong>rice</strong> Conventional Medium gra<strong>in</strong> 10% <strong>in</strong>crease6 Brown <strong>rice</strong> Organic Long gra<strong>in</strong> No <strong>in</strong>crease7 Fragrant <strong>rice</strong> Conventional Medium gra<strong>in</strong> No <strong>in</strong>crease8 Fragrant <strong>rice</strong> Conventional Long gra<strong>in</strong> 20% <strong>in</strong>crease9 Fragrant <strong>rice</strong> Organic Short gra<strong>in</strong> 10% <strong>in</strong>crease*Comb<strong>in</strong>ations of <strong>attributes</strong> <strong>for</strong> <strong>rice</strong> <strong>to</strong> be scored by respondents accord<strong>in</strong>g <strong>to</strong> their preferences.Kuantan, Kuala Terengganu, Kota Bharu, Ipoh,Kangar, Alor Setar, George<strong>to</strong>wn, Shah Alam, JohorBahru, Seremban, Malacca, Kota K<strong>in</strong>abalu <strong>and</strong>Kuch<strong>in</strong>g. The target population was adults withthe age are more than 18 years old. Survey wasconducted from December 2009 <strong>to</strong> March 2010. TheCA questions were then presented <strong>to</strong> respondents.Respondents were asked <strong>to</strong> rate the profiles of <strong>rice</strong><strong>in</strong> the range one <strong>to</strong> ten (one is the least preferred,<strong>and</strong> ten is the most preferred). In terms of sampl<strong>in</strong>g,Hair et al. (1998) suggested that traditional conjo<strong>in</strong>tanalysis has no sample size requirements <strong>and</strong> could beutilized <strong>for</strong> s<strong>in</strong>gle respondents; the larger sample sizeenhances the reliability of the results <strong>and</strong> allows theresearcher <strong>to</strong> make some generalizations. To providereliable estimates, Green <strong>and</strong> Sr<strong>in</strong>avasan (1978)suggested a m<strong>in</strong>imum sample of 100 respondents.For accurate predictions of consumer preferences atthe <strong>in</strong>dividual level, it is important not only <strong>to</strong> askthe respondent the right questions, but also <strong>to</strong> aska sufficient number of questions. The number ofconjo<strong>in</strong>t tasks or questions depends on the conjo<strong>in</strong>tmethod used <strong>in</strong> a study. Based on rat<strong>in</strong>g score <strong>for</strong>each comb<strong>in</strong>ation, the conjo<strong>in</strong>t analysis procedurecalculates the contribution of each attribute <strong>to</strong> therespondent’s preference. The contribution of theattribute level is termed as “part-worth utility”. Thepart worth was estimated us<strong>in</strong>g OLS (Ord<strong>in</strong>ary LeastSquares) analysis. OLS assumes <strong>in</strong>dependent product<strong>attributes</strong>.Results <strong>and</strong> DiscussionProfile of respondentsThe distribution of demographic profile ofrespondents is shown <strong>in</strong> Table 4. The <strong>to</strong>tal samplecomprises 49.8% male <strong>and</strong> 50.2% female. The age ofrespondents were grouped <strong>in</strong><strong>to</strong> five categories; below17 years old, 18 <strong>to</strong> 30 years old, 31-40, 41-50, 51-60,<strong>and</strong> more than 61 years old. About 30% were from18-30 years old, 26.3% from 31-40 years old, 31.2%from 41-50 <strong>and</strong> 10.7% <strong>for</strong> 51-60 years old. OnlyInternational Food Research Journal 19(1): 363-369
366 Ahmad Hanis, I. A. H., J<strong>in</strong>ap, S., Mad Nasir, S., Alias, R. <strong>and</strong> Muhammad Shahrim, A. K.17 years old, 18 <strong>to</strong> 30 years old, 31-40, 41-50, 51-60,<strong>and</strong> more than 61 years old. About 30% were from 18-30 years old, 26.3% from 31-40 years old, 31.2% from41-50 <strong>and</strong> 10.7% <strong>for</strong> 51-60 years old. Only 2% wereabove 61 years old. Respondents’ range of <strong>in</strong>comewas grouped <strong>in</strong><strong>to</strong> six, below RM1999, RM1000-RM1999, RM2000-RM2999, RM3000-RM3999,RM4000-RM4999 <strong>and</strong> more than RM5000. About6% were from below RM999, 17.1% from RM1000-RM1999, 22.4% from RM2000-RM2999, 16.1%from RM3000-RM3999, 16.1% from RM4000-RM4999 <strong>and</strong> 22.0% from above RM5000. In termsof ethnic, 72.2% were Malay, 10.7% were Ch<strong>in</strong>ese,3.4% were Indian, 10.2% were Sabah <strong>and</strong> SarawakBumiputera <strong>and</strong> 3.4% were from other ethnics.For respondents’ employment, the categories ofemployment were divided <strong>in</strong><strong>to</strong> five categories. Thecategories were; the government sec<strong>to</strong>r, private sec<strong>to</strong>r,unemployed, retired <strong>and</strong> others. 68.3% were work<strong>in</strong>gwith the government, 12.2% were from privatesec<strong>to</strong>r, 8.8% were unemployed, 1.0% was retirees<strong>and</strong> 9.8% were others. Respondent’s education levelwas categorized <strong>in</strong><strong>to</strong> never been <strong>to</strong> school, primaryschool, secondary school <strong>and</strong> university or college.Respondents stated the highest level of educationobta<strong>in</strong>ed when answer<strong>in</strong>g questionnaires. About 3%have attended primary school, 62.0% have attendedsecondary school <strong>and</strong> 34.6% have attended universityor college.Table 4. Profile of respondents (%)PercentageDemographic Fac<strong>to</strong>rs(n = 205)Gender Male 49.8Female 50.218-30 29.831-40 26.3Age (years old) 41-50 31.251-60 10.7> 61 2.0< 999 6.31000-1999 17.1Income (RM) 2000-2999 22.43000– 3999 16.14000- 4999 16.1> 5000 22.0Malay 72.2Ch<strong>in</strong>ese 10.7EthnicIndian 3.4Bumiputera Sabah <strong>and</strong>Sarawak10.2Others 3.4Government Sec<strong>to</strong>r 68.3Private Sec<strong>to</strong>r 12.2Employment Unemployed 8.8Retiree 1.0Others 9.8Primary School 3.4Education Secondary School 62.0University/ College 34.6RM refers <strong>to</strong> the Malaysian R<strong>in</strong>ggit. 1 USD is equal <strong>to</strong> RM3.02 (as of May 10, 2011)Relative Importance of Attribute <strong>for</strong> RiceThe results <strong>in</strong> Table 5 <strong>in</strong>dicate that food safetywas the most important attribute <strong>for</strong> <strong>rice</strong>, with34.18% relative importance compared <strong>to</strong> others.Taste (33.43%) was the second attribute consideredby consumers, <strong>and</strong> the size of gra<strong>in</strong> which constituted32.39% of relative importance was ranked third.From the calculation, it can be noted that Malaysianconsumers prefer regular or normal <strong>rice</strong> compared <strong>to</strong>fragrant <strong>and</strong> brown <strong>rice</strong> as the utility was a positivevalue, which was 0.2817 (Table 5). Meanwhile, thesef<strong>in</strong>d<strong>in</strong>gs were unexpected <strong>and</strong> suggested that betterlevel of taste <strong>for</strong> <strong>rice</strong>, which is fragrant <strong>and</strong> brown <strong>rice</strong>were less preferred. The utility <strong>for</strong> both levels were-0.0786 <strong>and</strong> -0.2030, respectively. Although theseresults differ from expectations, there are severalpossible explanations <strong>for</strong> this result. It seems possiblethat these results are due <strong>to</strong> the p<strong>rice</strong> of both fragrant<strong>and</strong> brown <strong>rice</strong>. In Malaysia, people who consumefragrant or brown <strong>rice</strong> generally have a higher thanaverage household <strong>in</strong>come. Other important reasonscan be familiarity <strong>and</strong> lack of promotions. Consumerswho are not familiar with brown <strong>rice</strong> might not bekeen <strong>to</strong> try it. However, through identify<strong>in</strong>g therelevant market segment with offer<strong>in</strong>g both fragrant<strong>and</strong> brown <strong>rice</strong> at a p<strong>rice</strong> that consumers are will<strong>in</strong>g<strong>to</strong> <strong>pay</strong> <strong>and</strong> creat<strong>in</strong>g a distribution system can makethe product available <strong>to</strong> the cus<strong>to</strong>mer <strong>in</strong> the rightplace at the right time, both fragrant <strong>and</strong> brown <strong>rice</strong>is expected <strong>to</strong> be preferred compared <strong>to</strong> regular <strong>rice</strong>due <strong>to</strong> the quality offered. The supply sides have <strong>to</strong>f<strong>in</strong>d the right products <strong>for</strong> the right cus<strong>to</strong>mers, ratherthan the right cus<strong>to</strong>mers <strong>for</strong> the products.In describ<strong>in</strong>g food safety, conventional <strong>rice</strong>was less preferred, which had the utility value of-0.2880 compared <strong>to</strong> <strong>rice</strong> produced organically,with utility value of 0.2880. This result may beexpla<strong>in</strong>ed by the relatively good correlation betweenorganically produced <strong>rice</strong> with the consumers’health consciousness. The present f<strong>in</strong>d<strong>in</strong>gs seem <strong>to</strong>be consistent with researches conducted by Baker,1999, Rohr et al. (2005) <strong>and</strong> Schobesberger etal. (2008), which <strong>in</strong>dicated that food safety is animportant attribute which needs <strong>to</strong> be considered <strong>in</strong>terms of food choice. The f<strong>in</strong>d<strong>in</strong>gs suggested thatthe Malaysian consumers have a health <strong>and</strong> safetyperspective while consum<strong>in</strong>g <strong>rice</strong>. Greater consumerpreference <strong>for</strong> organic <strong>rice</strong> <strong>in</strong>dicated enough marketpotential <strong>for</strong> the local farmers. More <strong>in</strong>frastructuredevelopment such as upgrad<strong>in</strong>g the production sec<strong>to</strong>r<strong>to</strong> use organic method <strong>in</strong> production of <strong>rice</strong> can beapplied.For the size of gra<strong>in</strong>, short gra<strong>in</strong> was less preferreds<strong>in</strong>ce the utility value was -0.2729 compared <strong>to</strong> long<strong>and</strong> medium gra<strong>in</strong>, which has the utility value of0.1640 <strong>and</strong> 0.1089 respectively. It seems possiblethat these results were due <strong>to</strong> long gra<strong>in</strong> giv<strong>in</strong>g bettertaste compared <strong>to</strong> short gra<strong>in</strong>.International Food Research Journal 19(1): 363-369
Consumers’ <strong>dem<strong>and</strong></strong> <strong>and</strong> <strong>will<strong>in</strong>gness</strong> <strong>to</strong> <strong>pay</strong> <strong>for</strong> <strong>rice</strong> <strong>attributes</strong> <strong>in</strong> Malaysia 367Table 5. Relative Importance of Attribute <strong>for</strong> RiceLevel of Attributes Coefficients t-valueAttributesUtility Relative Importance (%)(Constant) 6.6989 *** 44.9605Normal Rice - - 0.2817Taste Fragrant Rice -0.1902 * -1.3791 -0.078633.43Brown Rice -0.4911 *** -3.5599 -0.2030Food Safety Conventional - - -0.2880Organic 0.6967 *** 5.8324 0.288034.18Short Gra<strong>in</strong> - - -0.2729Size of Gra<strong>in</strong> Medium Gra<strong>in</strong> 0.2634 ** 1.9096 0.108932.39Long Gra<strong>in</strong> 0.3967 *** 2.8762 0.1640P<strong>rice</strong> Actual P<strong>rice</strong> -0.0915 *** -13.2728 - -Std. error = 2.4189, F = 38.6067Note: Significance levels are denoted by *** <strong>for</strong> 1%, ** <strong>for</strong> 5%, <strong>and</strong> * <strong>for</strong> 10%.Will<strong>in</strong>gness <strong>to</strong> <strong>pay</strong> (WTP) <strong>for</strong> <strong>attributes</strong> <strong>dem<strong>and</strong></strong>edWith an underst<strong>and</strong><strong>in</strong>g of the relative importanceof <strong>attributes</strong> <strong>and</strong> the impact of specific levels, it is thenpossible <strong>to</strong> conduct further analysis by predict<strong>in</strong>g theWTP <strong>for</strong> each attribute <strong>dem<strong>and</strong></strong>ed. The <strong>dem<strong>and</strong></strong>ed<strong>rice</strong> needs <strong>to</strong> be economically viable. It may not bepossible <strong>to</strong> market high-quality <strong>rice</strong> at a low p<strong>rice</strong>level. WTP was calculated by us<strong>in</strong>g the <strong>for</strong>mulastated as follows:WTP = β 0/ -β p<strong>rice</strong>Where: β 0= Coefficients value of non-p<strong>rice</strong> <strong>attributes</strong>β p<strong>rice</strong>= Coefficients value of p<strong>rice</strong> <strong>attributes</strong>Table 6 shows the calculated WTP <strong>for</strong> eachattribute <strong>and</strong> level of <strong>attributes</strong> <strong>for</strong> <strong>rice</strong>. The WTPcalculated were based on the current average p<strong>rice</strong>of <strong>rice</strong>; RM2.40 per kilogram. In terms of <strong>attributes</strong>,the taste of <strong>rice</strong> <strong>and</strong> the size of the gra<strong>in</strong> conferredthe highest WTP, <strong>in</strong> which both were RM4.18 perkilogram of <strong>rice</strong>. The WTP <strong>for</strong> food safety of <strong>rice</strong>ranked third, RM4.17 per kilogram.For the level of <strong>attributes</strong>, the highest WTPamong level of tastes were fragrant <strong>and</strong> brown <strong>rice</strong>.The results <strong>in</strong>dicated that consumers were will<strong>in</strong>g <strong>to</strong><strong>pay</strong> up <strong>to</strong> RM4.19 per kilogram of <strong>rice</strong> <strong>for</strong> both levelsof <strong>attributes</strong>. The WTP <strong>for</strong> regular or normal <strong>rice</strong> wasRM4.16 per kilogram. From the calculation it wasalso discovered that the WTP <strong>for</strong> medium <strong>and</strong> longgra<strong>in</strong> (levels of the size of gra<strong>in</strong>) were RM4.19/kg.The WTP <strong>for</strong> short gra<strong>in</strong> was the lowest among levelsof the size of gra<strong>in</strong>; RM4.16/kg. For the level of foodsafety of <strong>rice</strong>, the WTP <strong>for</strong> organic <strong>rice</strong> was higherthan conventional <strong>rice</strong>, which was as expected. TheWTP <strong>for</strong> organic <strong>rice</strong> <strong>and</strong> conventional <strong>rice</strong> wereRM4.19/kg <strong>and</strong> RM4.16/kg, respectively.Limitations of the studyThe previous results must be considered <strong>in</strong> ligh<strong>to</strong>f limitations of the study. One such limitation relates<strong>to</strong> the selection of the <strong>attributes</strong> <strong>for</strong> <strong>rice</strong>. While theresults of this study demonstrate the potential <strong>for</strong> us<strong>in</strong>gconjo<strong>in</strong>t analysis method <strong>to</strong> determ<strong>in</strong>e consumers’preferences <strong>for</strong> <strong>rice</strong> <strong>attributes</strong>, this research approachhas some limitations. One such limitation, the selected<strong>attributes</strong> <strong>and</strong> levels of <strong>attributes</strong> <strong>for</strong> <strong>rice</strong> products,which is difficult <strong>to</strong> make choice what <strong>attributes</strong> <strong>to</strong><strong>in</strong>clude <strong>in</strong> the study design <strong>and</strong> what <strong>to</strong> exclude. Inthis study, only selected <strong>attributes</strong> from focus groupsurvey were used. However, it is most likely that thereare other <strong>attributes</strong> of <strong>rice</strong> products that are important<strong>to</strong> consumers beyond those considered <strong>in</strong> this study.It is also important <strong>to</strong> consider that, the results ofconsumers’ <strong>will<strong>in</strong>gness</strong> <strong>to</strong> <strong>pay</strong> is only the calculationof consumers’ surplus under the <strong>dem<strong>and</strong></strong> curve.The <strong>in</strong>dividual consumer surplus is the differencebetween the maximum <strong>to</strong>tal p<strong>rice</strong> a consumer wouldbe will<strong>in</strong>g <strong>to</strong> <strong>pay</strong> <strong>for</strong> the amount consumers buy <strong>and</strong>the actual <strong>to</strong>tal p<strong>rice</strong>. However, <strong>in</strong> terms of pric<strong>in</strong>gstrategy <strong>and</strong> implementations, the value of WTPcalculated based on <strong>dem<strong>and</strong></strong>ed <strong>attributes</strong> itself is notthe only determ<strong>in</strong>ant <strong>to</strong> set the p<strong>rice</strong> of <strong>rice</strong> products.Other fac<strong>to</strong>rs such as demographic profiles also need<strong>to</strong> be considered.Throughout this study, it was not exam<strong>in</strong>edwhether the effects of the demographic fac<strong>to</strong>rs <strong>to</strong>the <strong>dem<strong>and</strong></strong> <strong>for</strong> <strong>rice</strong> are significant or not <strong>in</strong> termsof <strong>dem<strong>and</strong></strong> <strong>for</strong> <strong>rice</strong> <strong>attributes</strong>. For example, <strong>dem<strong>and</strong></strong><strong>for</strong> <strong>rice</strong> may differ <strong>in</strong> terms of age groups, <strong>in</strong>come oreducation levels of consumers. Older people might bemore aware about their health <strong>and</strong> be more selectiveon dietary <strong>in</strong>takes, so they change their eat<strong>in</strong>g habitsby consum<strong>in</strong>g more healthy foods. Other variablessuch as education level <strong>and</strong> <strong>in</strong>come could also beimportant <strong>to</strong> capture structural changes <strong>in</strong> terms offood preferences of <strong>attributes</strong>. Further studies, whichtake these demographic profile variables <strong>in</strong><strong>to</strong> account,will need <strong>to</strong> be undertaken.Conclusions <strong>and</strong> RecommendationsThe CA <strong>for</strong> the overall 205 consumers gives some<strong>in</strong>sight <strong>in</strong><strong>to</strong> consumer preferences <strong>for</strong> <strong>rice</strong> commodity.The “ideal <strong>rice</strong>” is <strong>to</strong> be regular <strong>rice</strong>, organic <strong>and</strong>long gra<strong>in</strong>. If a match<strong>in</strong>g between supply <strong>and</strong> whatInternational Food Research Journal 19(1): 363-369
368 Ahmad Hanis, I. A. H., J<strong>in</strong>ap, S., Mad Nasir, S., Alias, R. <strong>and</strong> Muhammad Shahrim, A. K.Table 6. Will<strong>in</strong>gness <strong>to</strong> <strong>pay</strong> <strong>for</strong> <strong>rice</strong>Attributes Level of Attributes Coefficients + β 0β 0/-β p<strong>rice</strong>WTP *(RM/kg)Normal Rice 6.6989 *** 0.7318 4.16Taste Fragrant Rice 6.8369 * 0.7468 4.19Brown Rice 6.8369 *** 0.7468 4.19Food Conventional 6.6989 *** 0.7318 4.16Safety Organic 6.8184 *** 0.7448 4.19Size ofShort Gra<strong>in</strong> 6.6989 *** 0.7318 4.16Medium Gra<strong>in</strong> 6.8369Gra<strong>in</strong>** 0.7468 4.19Long Gra<strong>in</strong> 6.8369 *** 0.7468 4.19Std. error = 2.4189, F = 38.6067, β 0= 6.6989, Coefficients of p<strong>rice</strong> = -0.0915Note: Significance levels are denoted by *** <strong>for</strong> 1%, ** <strong>for</strong> 5%, <strong>and</strong> * <strong>for</strong> 10%.WTP* calculated based on the current average p<strong>rice</strong> of <strong>rice</strong>; RM2.40/ kg.consumers really need is desired, this requires a neworientation <strong>for</strong> the “consumer-oriented” market. Asproposed by Kotler <strong>and</strong> Keller (2006), the marketersmust identify three parts <strong>in</strong> a sequence of phases <strong>to</strong>ga<strong>in</strong> market access. These phases are important <strong>to</strong>determ<strong>in</strong>e the efficiency of delivery sequences fromthe producer <strong>to</strong> the target consumer. The phasesare choos<strong>in</strong>g the value, provid<strong>in</strong>g the value <strong>and</strong>communicat<strong>in</strong>g the value.Phase one (choos<strong>in</strong>g the value) consists ofcus<strong>to</strong>mer segmentation, target<strong>in</strong>g <strong>and</strong> position<strong>in</strong>g. Inthe case of <strong>dem<strong>and</strong></strong> <strong>for</strong> <strong>rice</strong> <strong>attributes</strong>, marketers have<strong>to</strong> f<strong>in</strong>d the right products <strong>for</strong> the right cus<strong>to</strong>mers,rather than the right cus<strong>to</strong>mers <strong>for</strong> the products. Forexample, <strong>in</strong> the case brown <strong>rice</strong>, consumers who live<strong>in</strong> rural area might not familiar with the product.There<strong>for</strong>e, the market <strong>for</strong> the brown <strong>rice</strong> should focuson urban area, where the possibility of consumers’<strong>will<strong>in</strong>gness</strong> <strong>to</strong> buy the product is higher.The second phase is provid<strong>in</strong>g the value, whichconsists of product features, p<strong>rice</strong>s <strong>and</strong> distribution.Greater consumer preference <strong>for</strong> organic <strong>and</strong>controlled-environment <strong>rice</strong> <strong>in</strong>dicated enough marketpotential <strong>for</strong> the local farmers. More <strong>in</strong>frastructuredevelopment such as upgrad<strong>in</strong>g the production sec<strong>to</strong>r<strong>to</strong> use controlled environment <strong>and</strong> organic method <strong>in</strong>production of <strong>rice</strong> can be applied. The use of pesticides<strong>and</strong> <strong>in</strong>secticides <strong>in</strong> <strong>rice</strong> production should be reduced.The dosage of chemicals used <strong>in</strong> the production mustbe at the m<strong>in</strong>imum level of requirement.The task <strong>in</strong> the third phase is <strong>to</strong> communicate thevalue by utiliz<strong>in</strong>g the sales <strong>for</strong>ce, sales promotion,advertis<strong>in</strong>g, <strong>and</strong> other communicat<strong>in</strong>g <strong>to</strong>ols <strong>to</strong>announce <strong>and</strong> promote the product. One of the tasksthat can be applied is <strong>to</strong> set the p<strong>rice</strong> of <strong>rice</strong> equivalentwith the <strong>attributes</strong> offered. The Calculations of WTPcan help <strong>to</strong> predict the p<strong>rice</strong> of the consumers iswill<strong>in</strong>g <strong>to</strong> <strong>pay</strong> <strong>for</strong> their <strong>dem<strong>and</strong></strong>ed <strong>attributes</strong> <strong>for</strong> <strong>rice</strong>.Labell<strong>in</strong>g of <strong>rice</strong> <strong>in</strong> terms of nutritional contents,chemicals used <strong>and</strong> method of production also couldbe very useful <strong>in</strong> order <strong>to</strong> give freedom <strong>to</strong> consumer<strong>to</strong> choose their preferred <strong>rice</strong>. The study resultsalso found that better level of <strong>rice</strong> such as fragrant<strong>rice</strong> <strong>and</strong> brown <strong>rice</strong> were not preferred. AlthoughOverallWTP *(RM/kg)4.184.174.18it may relate <strong>to</strong> the p<strong>rice</strong> of the products, anotherpossible reason might be that familiarity affects the<strong>dem<strong>and</strong></strong> <strong>for</strong> brown <strong>rice</strong>. Marketers need <strong>to</strong> promoteboth mentioned products <strong>to</strong> consumers <strong>to</strong> get better<strong>dem<strong>and</strong></strong> <strong>for</strong> the product s<strong>in</strong>ce all the products are verygood <strong>in</strong> terms of health <strong>to</strong> consumer.AcknowledgementThis study was conducted with f<strong>in</strong>ancial supportfrom Federal Agricultural Market<strong>in</strong>g Authority(FAMA) <strong>for</strong> which we are deeply grateful.ReferencesAhmad Hanis Izani Abdul Hadi, J<strong>in</strong>ap Selamat, Mad NasirShamsud<strong>in</strong> <strong>and</strong> Alias Radam. 2010. Dem<strong>and</strong> <strong>for</strong> FoodSafety Attributes <strong>for</strong> Vegetables <strong>in</strong> Malaysia. Journalof Environment Asia, 3 (special issue): 160-167.Babicz-Ziel<strong>in</strong>ska, E. <strong>and</strong> Zagorska, A. 1998. Fac<strong>to</strong>rsAffect<strong>in</strong>g the Preferences <strong>for</strong> Vegetables <strong>and</strong> Fruits.Polish Journal of Food <strong>and</strong> Nutrition Sciences,7/48(4): 755-762.Baker, G.A. 1999. Consumer Preferences <strong>for</strong> FoodSafety Attributes <strong>in</strong> Fresh Apples: MarketSegments, Consumer Characteristics <strong>and</strong> Market<strong>in</strong>gOpportunities. Journal of Agricultural <strong>and</strong> ResourceEconomics 24(1): 80-97.Banovic, M., Grunert, K.G., Barreira, M.M. <strong>and</strong> Fontes,M.A. 2009. Beef Quality Perception at the Po<strong>in</strong>t ofPurchase: A Study from Portugal. Food Quality <strong>and</strong>Preference 20 (4): 335-342.Ennek<strong>in</strong>g, U., Neumann, C. <strong>and</strong> Henneberg, S. 2007. HowImportant Intr<strong>in</strong>sic <strong>and</strong> Extr<strong>in</strong>sic Product AttributesAffect Purchase Decision. Food Quality <strong>and</strong> Preference18(1): 133-138.Food <strong>and</strong> Agriculture Organization of the United Nations,2007. FAOSTAT. [Onl<strong>in</strong>e]. http://faostat.fao.org/site/609/Desk<strong>to</strong>pDefault.aspx?PageID=609 #anchor[accessed 11 December 2009].Green, P.E. <strong>and</strong> Sriv<strong>in</strong>asan, V. 1978. Conjo<strong>in</strong>t Analysis <strong>in</strong>Consumer Research: Issues <strong>and</strong> Outlook. The Journalof Consumer Research 5: 103-123.Guerrero, L., Colomer, Y., Guàrdia, M.D., Xicola, J. <strong>and</strong>Clotet, R. 2000. Consumer Attitude <strong>to</strong>wards S<strong>to</strong>reBr<strong>and</strong>s. Food Quality <strong>and</strong> Preference 11(5): 387-395.Hair, J. F., Black, W. C., Bab<strong>in</strong>, B. J. <strong>and</strong> Anderson, R. E.International Food Research Journal 19(1): 363-369
Consumers’ <strong>dem<strong>and</strong></strong> <strong>and</strong> <strong>will<strong>in</strong>gness</strong> <strong>to</strong> <strong>pay</strong> <strong>for</strong> <strong>rice</strong> <strong>attributes</strong> <strong>in</strong> Malaysia 3692010. Multivariate data analysis (7 th ed.). NJ: PearsonPrentice Hall.Henson, S., Majowicz, S., Masakure, O., Sockett, P.,Jones, A., Hart, R., Carr, D. <strong>and</strong> Knowles, L. 2006.Consumer Assessment of the Safety of Restaurants:The Role of Inspection Notices <strong>and</strong> Other In<strong>for</strong>mationCues. Journal of Food Safety 26(4): 275-301.Jang, S., Ha, J. <strong>and</strong> Silkes, C.A. 2009. Perceived Attributesof Asian Foods: From the Perspective of the AmericanCus<strong>to</strong>mers. International Journal of HospitalityManagement 28(1): 63-70.Kotler, P. <strong>and</strong> Keller, K.L. 2006. Market<strong>in</strong>g <strong>and</strong> Cus<strong>to</strong>merValue. In Market<strong>in</strong>g Management, ed. Kotler, P, pp 34.Pearson Prentice HallMurphy, M., Cowan, C., Meehan, H. <strong>and</strong> O’Reilly, S. 2004.A Conjo<strong>in</strong>t Analysis of Irish Consumer Preferences<strong>for</strong> Farmhouse Cheese. British Food Journal 106(4):288 - 300.Oliver, M.A., Nute, G.R., Furnols, M., San Julián, R.,Campo, M.M. <strong>and</strong> Sañudo, C., 2006. Eat<strong>in</strong>g Qualityof Beef, from Different Production Systems, Assessedby German, Spanish <strong>and</strong> British Consumers. MeatScience, 74(3), 435-442.Ragaert, P., Verbeke, W., Devlieghere, F. <strong>and</strong> Debevere, J.2004. Consumer Perception <strong>and</strong> Choice of M<strong>in</strong>imallyProcessed Vegetables <strong>and</strong> Packaged Fruits. FoodQuality <strong>and</strong> Preference 15(3): 259-270.Rohr, A., Luddecke, K., Drusch, S., Muller, M. J. <strong>and</strong>Alvensleben, R. V. 2005. Food Quality <strong>and</strong> Safety -Consumer Perception <strong>and</strong> Public Health Concern.Food Control 16(8): 649-655.Schobesberger, B.R., Darnhofer, I., Somsook, S. <strong>and</strong> Vogl,,C. R. 2008. Consumer Perceptions of Organic Foods<strong>in</strong> Bangkok, Thail<strong>and</strong>. Food Policy 33(2): 112-121.Van der Pol, M. <strong>and</strong> M. Ryan, 1996. Us<strong>in</strong>g Conjo<strong>in</strong>tAnalysis <strong>to</strong> Establish Consumer Preferences <strong>for</strong> Fruit<strong>and</strong> Vegetables. British Food Journal 98(8): 5-12.International Food Research Journal 19(1): 363-369