The American School of Doha 2006-07 Annual Report
The American School of Doha 2006-07 Annual Report
The American School of Doha 2006-07 Annual Report
- No tags were found...
Create successful ePaper yourself
Turn your PDF publications into a flip-book with our unique Google optimized e-Paper software.
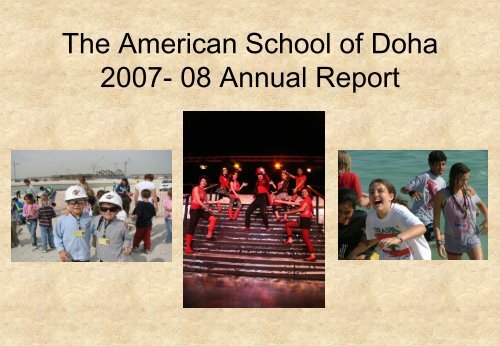
<strong>The</strong> <strong>American</strong> <strong>School</strong> <strong>of</strong> <strong>Doha</strong>20<strong>07</strong>- 08 <strong>Annual</strong> <strong>Report</strong>0
Contents• Demographics & Basic FactsPage 1Page 2Page 4Page 5Page 6Page 7Page 8Page 9Page 10Page 11Mission StatementDirector’s LetterDemographicsASD Student EnrollmentStudent TransitionsMiddle <strong>School</strong> Class SizesHigh <strong>School</strong> Class SizesStaffing at ASDASD Faculty LongevityASD Faculty RetentionPage 12 ASD Admissions 2008-2009• FinancesPage 13 Budget Expenses 2008-2009Page 14Page 15Page 16• Student AchievementASD TuitionTuition ComparisonsExpenses for Technology and PDPage 17 PD at ASD 20<strong>07</strong>-2008Page 18Gates MacGinitie ResultsPages 19-22 SAT ResultsPages 23-34 AP ResultsPages 35-37 Standardized Testing Results• ASD Program FeaturesPage 38Page 39• SurveysPresidential Fitness AwardsComputer –Student RatiosPage 40Parent SurveysPages 41-43 MS WWW Survey ResultsPages 44-47 Elementary LibraryPages 48-50 MS/HS Library• Sports and ActivitiesPage 51Elementary SportsPages 52-53 Elementary ASAPage 54Varsity SportsPage 55Junior Varsity SportsPages 56-58 Fine Arts ProgramPages 59-61 Community Service• MatriculationPage 62Page 63Page 64Page 65Pages 66-67College AcceptancesMatriculation DataEpilogueCollege Acceptancesby the Class <strong>of</strong> 2008ASD Highlights3
Demographics<strong>The</strong> demographics for 2008-09 reveal a slow shift as North <strong>American</strong> students reveal a 5% decrease (-2%<strong>American</strong> and -3% Canadian) and an increase in European students, +2%, and in the subcontinent, India andPakistan, +2%. We also see slippage in our number <strong>of</strong> Middle Eastern students with the Qatari percentagedecreasing by 1% and the remainder <strong>of</strong> Middle Eastern students declining by 1%. I would conjecture that thisslight, but significant erosion is due in part to more quality opportunities for education for Qatari and Gulfcountry nationals, plus an ever increasing expatriate presence in Qatar. We have also grown in diversity fromforty-one countries to sixty-five countries represented in our student body. Possible impacts <strong>of</strong> this data are onour ESL program, admission priorities, our Qatari scholarship program, and how we look at the possibleinclusion <strong>of</strong> the IB Diploma program in the future.United States 44%Australia/NZ 3%2%8%4%7%3%7%7%12%3%44%Canada 12%Qatar 7%Middle East 3%Europe 8%Latin America 2%Asia 7%3%India/Pakistan 4%Africa 3%Scandinavia 7%4
ASD EnrollmentThis chart merely shows the increase in enrollment numbers per grade level over the last six years. Of course, all <strong>of</strong>us know that we have more sections this year at most grade levels, so a more appropriate perspective in viewingthis data is to look at “optimal” and “maximum” class sizes. Class size is important to us for two reasons: it impactshow we teach and how students learn, and ASD wants every student to receive individual attention. This year, wehave eight classes at optimal levels and five at maximum levels. Once a class reaches maximum level, a waiting listis formed. This balance between “optimal” and “maximum” is important to us as a gauge on how well we have madeour enrollment projections and, thus, how well we have staffed the school. For grades 3-12, the optimal level is 140students; for grades one and two the optimal level is 126; and for PK and kindergarten it is 105 and 112 students.160# per class 03-04 # per class 04-05 # per class 05-06 per class 06-<strong>07</strong> per class <strong>07</strong>-08 per class 08-09140120100806040200PK K GR 1 GR 2 GR 3 GR 4 GR 5 GR 6 GR 7 GR 8 GR 9 GR 10 GR 11 GR 125
Student TransitionsThis graph shows the growth inenrollment at ASD over the pastseven years. For the first time inthese seven years, we see ourretention rate decrease (70%compared to 87% last year) and ouroverall growth slowed to 15%compared to 22% this past year.Although these numbers are solid,there are indications <strong>of</strong> growthslowing down and turnoverincreasing. <strong>The</strong>re are many possiblecauses for this ranging fromincreased options in education in<strong>Doha</strong> to the cost <strong>of</strong> tuition and capitalfees.6
ASD Faculty Retention<strong>The</strong> recruitment and retention <strong>of</strong> high quality teachers remainsone <strong>of</strong> ASD’s most important goals. <strong>The</strong> graph below showswhat percentage <strong>of</strong> our faculty leave each year. Currently, weare averaging about 17% per year.25%20%15%10%5%0%2001/02 2002/03 2003/04 2004/05 2005/06 <strong>2006</strong>/<strong>07</strong> 20<strong>07</strong>/0811
ASD ADMISSIONS 2008-09Admissions at ASD continue to be dynamic as space remains an issue in the elementary school as seen bythe large number <strong>of</strong> pending students whose files are not processed unless there is space available. <strong>The</strong>issue in the middle and high school is slightly different with a larger number <strong>of</strong> students who do not meet theASD admission standard in English and Math. <strong>The</strong> withdrawals are the result <strong>of</strong> students finding otherschools, family plans changing, or siblings not being accepted.Applications Accepted Pending Denials Withdrawals AcceptancePercentageElementary<strong>School</strong>700Middle<strong>School</strong>224High <strong>School</strong>237333 257 43 67 88%104 33 56 31 65%113 30 71 23 62%12
Budget Expenses: 2008-09<strong>The</strong> budget for 2008/09 shows expenditures in the amount <strong>of</strong> QR 79,546,650. Almost seventy-ninepercent <strong>of</strong> this budget is for faculty salaries, housing, and benefits, which is aligned with previousbudgets. Within this group, our housing did increase by 2%, but this is primarily the result <strong>of</strong> providinghousing for a larger faculty, as well as price increases. Our building and grounds costs, logically interms <strong>of</strong> the expanded campus, rose another 1% this year. Our library budget doubled this year as weentered a three-year plan to match our collection with our new facilities.13
ASD TuitionASD tuition fees vary according to the grade level <strong>of</strong> the student although we are seeing more schools level thecost <strong>of</strong> tuition from grades one to twelve as services have expanded in the elementary realm. <strong>The</strong> graphillustrates the higher rise in tuition costs this past year which is a direct reflection <strong>of</strong> the rising cost in <strong>Doha</strong>,especially in housing, as well as the added expenses <strong>of</strong> maintaining a larger campus with more varied facilitiesfor students.14
Tuition Comparison <strong>of</strong> ASD and Other NESA <strong>School</strong>sThis chart shows the current amount in dollars <strong>of</strong> what different schools in the NESA region charge fortuition. <strong>The</strong> price <strong>of</strong> education in overseas schools continues to rise. Compared to these schoolswithin our own region, we remain relatively inexpensive; however, the capital fee expense is notincluded in this chart and each <strong>of</strong> these schools have their own capital fee structure. You may noticein the chart that in grades 9-12 there is more separation in what our fees are compared to otherschools.21,00016,00011,000ASD <strong>Doha</strong>IslamabadASD DubaiCAC CairoAES New DelhiColumboTAISM OmanACS Abu Dhabi6,0001,000PK Kindergarten Gr. 1-5 Gr. 6-8 Gr. 9-1215
Expenses for Technology and Pr<strong>of</strong>essional DevelopmentTwo key areas <strong>of</strong> our components <strong>of</strong> ASD are technology and pr<strong>of</strong>essional development. <strong>The</strong> chart belowillustrates how our investment in these two essential areas have progressed over the past eight years. While weare pleased that this year all faculty have been issued laptops, the expansion <strong>of</strong> our school and the increased use<strong>of</strong> technology by teachers in the classroom create more budget demands. Our technology budget grew by 40%this year while our student body grew by 17% and our teaching space more than doubled. However, with thecontinued expansion, as well as the upgrade, our technology continues to be a fiscal challenge. We are proud <strong>of</strong>our support for pr<strong>of</strong>essional development, and although a 25% growth in funds is healthy, we should rememberthat our faculty grew by an equal amount. With the cost <strong>of</strong> airfare, accommodations, and consultants continuingto rise, we will need to manage this budget very carefully. We need to ensure that we continue to provide both <strong>of</strong>these areas with appropriate funding in order for us to meet our goals as a school.16
Pr<strong>of</strong>essional Development at ASD 20<strong>07</strong>-08NESA Fall Leadership ConferenceBangkok, October 25-28, 20<strong>07</strong>8 Staff Members AttendedNESA Fall Training InstituteBahrain, November 2-3, 20<strong>07</strong>10 Staff Members AttendedNESA Winter ConferenceBahrain, Jan 25 – 26, 20084 Staff Members AttendedNESA Spring Educator ConferenceBangkok, April 5 – 7, 200838 Staff Members AttendedSummer PD WorkshopsJune – August 200824 Staff Members AttendedTARABahrain – February8 Staff Members AttendedQRA Workshops53 Staff Members AttendedASD is a “Learning Focused” school. We believe that as well as our students being engagedlearners, our teachers need to be engaged learners as well.ASD teachers are committed to refining their craft through pr<strong>of</strong>essional developmentopportunities that are aligned to our school improvement plan. ASD supports teacher learningthrough a planned process <strong>of</strong> school improvement and the commitment <strong>of</strong> dedicated funding.ASD teachers and leaders were involved throughout the year in various pr<strong>of</strong>essionaldevelopment opportunities, both embedded in our school and from outside our schoolcommunity.This past year the ASD Leadership Team were trained in the “Looking for Learning” protocolwith Mr. Martin Skelton from the Fieldwork organization.<strong>The</strong> following consultants worked with teachers and leadership within the school at varioustimes throughout the year:* Erma Anderson –Evidence to Excellence protocol for looking at student work* Bambi Betts – Trans-disciplinary skills and dispositions and grading* Deb Welch – Looking at data* Carrie Ekey – Balanced Literacy program* Kathy Stetson – Looking at data (NWEA MAP)ASD teachers are actively involved in regional conferences sponsored by the Near East SouthAsian Council <strong>of</strong> Overseas <strong>School</strong>s, <strong>The</strong> Arabian Reading Association, Qatar ReadingAssociation, and Qatar Math and Science Teachers Association. ASD is a “learning” school.QMASTA Workshops25 Staff Members Attended17
Gates MacGinitie Testing<strong>The</strong> Gates MacGinitie is a literacy assessment which targets the areas <strong>of</strong> decoding, vocabulary, andreading comprehension. Student performance is determined in relation to norms governing testingtimeframes, grade level equivalency, percentile ranks, and stanines. Student growth is monitoredthroughout the year, with testing being conducted twice a year in grades one to two. Testing data,generated from the test, is utilized by teachers to improve student learning by identifying specificcurricular and instructional needs and in turn setting instructional targets, both short and long term. Asshown in the accompanying table, approximately 72% <strong>of</strong> students tested from grades one and twodemonstrated more than six months growth throughout the year, and 86% <strong>of</strong> the students are working inthe grade level range.Gates MacGinitie ScoresAt Grade Level Below Grade Level < 6 >6 Above 2 Year &>6Gr. 1 100 89% 13 11% 78/103 25% 26 25%Gr. 2 87 83% 18 17% 72/105 69.5% 32 30.5% 3 7%18
ASD Overall Performanceon the SATFor the past ten years, ASD hasmaintained an average SATscore <strong>of</strong> 1000 or better, and forthe past seven years we havestayed above 1100. Wecontinued this trend with theclass <strong>of</strong> 2008 with combinedaverage scores <strong>of</strong> 1135 (562 forverbal and 573 for math). Thisrepresented a small increase <strong>of</strong>16 points from last year. Ouraverage score on the writingcomponent was 559. This wasabove the national average <strong>of</strong>494. We were also above thenational averages in reading(502) and math (515). Our goalstill remains to crack the 1200ceiling and score better than 600in both reading and math.19
SAT Verbal and Math ScoresSAT scores at ASD, as shown in the graphson the right, have consistently been abovenational averages in the States. It was niceto see our math scores crawl a little closer tothe 600 plateau this year.Our verbal scores were almost identical thisyear to last year, but still remain strongagainst the national mean (60 points above)and is still the second highest mean score wehave had over the past seven years.This is the third year that the College Boardhas tested writing as a third component <strong>of</strong> theSAT. Although this is not shown on a graph,ASD’s mean score was 559, which is 65points above the national mean. We shouldbe pleased with this result. Our students arelearning to write well!610580550520490460430400580550520SAT MATH SCORESMath ASD Math Nat.2001-02 2002-03 2003-04 2004-05 2005-06 <strong>2006</strong>-<strong>07</strong> 20<strong>07</strong>-08SAT VERBAL SCORESVerbal ASD Verbal Nat.4904604304002001-02 2002-03 2003-04 2004-05 2005-06 <strong>2006</strong>-<strong>07</strong> 20<strong>07</strong>-0820
Range <strong>of</strong> SAT Scores at ASDRange <strong>of</strong> Verbal ScoresAnother good way to look at our SAT performance isto view our scores in terms <strong>of</strong> the range <strong>of</strong> scores. Inother words, what percentage <strong>of</strong> students scoredabove 600 in verbal or math, and what percentagescored below 500. <strong>The</strong>se two numbers represent anatural “low” and “high” bar for scores.45%40%35%30%25%2001-20022002-20032003-20042004-20052005-<strong>2006</strong>This year 27% <strong>of</strong> our students scored above 600 and30% scored below 500. <strong>The</strong> shift in this year’s scorescompared to <strong>2006</strong>/<strong>07</strong> reveals a drop <strong>of</strong> 9% in scoresabove 600 (a concern since this is the second year ina row that we have seen a sharp drop in thesescores) and an increase <strong>of</strong> 10% in scores between500-550. In other words, our bottom stayed about thesame, our middle grew, and our top decreased.20%15%10%5%0%Below 500 500-550 550-600 600-650 650-700 700-800Range <strong>of</strong> Math Scores<strong>2006</strong>-20<strong>07</strong>20<strong>07</strong>-2008In math, everything remained fairly stable with aslight decrease (3% from last year) <strong>of</strong> our studentsscoring below 500 and an increase <strong>of</strong> 4% from lastyear <strong>of</strong> students scoring above 600. This is a goodtrend.Every class differs and there is a little concern withthe bell-shaped performance in verbal over the lasttwo years, while our math is more biased toward thehigh range than the low range <strong>of</strong> scores.35%30%25%20%15%10%2001-20022002-20032003-20042004-20052005-<strong>2006</strong><strong>2006</strong>-20<strong>07</strong>20<strong>07</strong>-20085%0%400-500 500-550 550-600 600-650 650-700 700-80021
SAT II ScoresSAT II exams are required by most top level universities and colleges. Our students did very well overall on theseexams, averaging 632; beating the national average in nine <strong>of</strong> the eleven tests. This year we had thirty-eight studentstake these challenging subject tests, and we added the ecology and world history to this year’s tests. Both Spanish (fourstudents) and Math II (with fourteen students) broke the seven hundred ceiling this year. In fact, two students scored aperfect 800 in the Math II test!22
ASD AP Tests Performance<strong>The</strong> Advanced Placement courses and examsrepresent a snapshot <strong>of</strong> how many <strong>of</strong> our studentsare willing and able to perform at the highestlevel. For the most part, these courses reflect alevel <strong>of</strong> sophistication and challenge beyond thesecondary level.Currently at ASD, we <strong>of</strong>fer fourteen AP courses.<strong>The</strong>re are two important indicators for us to followin examining our AP program: how many studentsare taking the exams and what percentage arescoring 3.0 or above, which is considered a“benchmark” since many colleges and universitieswill award students a credit for these scores.Last year, I commented on what I referred toas the “phenomenal” increases in these areas;however, this year we have maintained thoselevels and that is a good thing.<strong>The</strong> bottom line is that we continue to challengestudents and many <strong>of</strong> them are accepting thechallenge and meeting the expectations. Our APprogram remains strong and vibrant.23
BiologyCal ABCal BCChemistryFrenchEng Lang/CompEng Lit/CompEur. HistoryPhysicsSpanishStatsUS HistWorld HistComp. Sci. AEnviron.SciComp Sci ABOverall AP ScoresThis graph shows the overall performance <strong>of</strong> each AP test in a scale from one to five this past year. This is avisual view <strong>of</strong> how the scores break down in each <strong>of</strong> our AP courses. Research shows that a student gainsmore by taking an AP course and scoring a one than by not taking the course. We encourage students to takethis challenge and do not see AP scores as a rating scale. Instead, we see this as an achievement scale thatshows our students are doing very well.Please note that different courses have different numbers <strong>of</strong> students enrolled; this graph is not intended tocompare courses to courses, but rather give an overall view <strong>of</strong> performance within individual courses as well asa snapshot <strong>of</strong> the entire AP program.6560555045403530FiveFour2520ThreeTwo1510One5024
Percentage <strong>of</strong> AP Scores 3 or Better<strong>The</strong> overall performance on the Advanced Placement tests this year was again very strong. As aschool, ASD had 79% (same as last year) <strong>of</strong> its students score three or higher on all the examstaken. French and Spanish, although smaller classes, did very well again this year. <strong>The</strong>y havedoubled in size since last year. <strong>The</strong> number <strong>of</strong> students taking the two English AP’s remain largeand we should be pleased that so many students seek this AP challenge and that our performanceremains strong. Calculus scores continue to be very strong, and we saw improvements in all ourhistory AP class scores.25
BioCal ABCal BCChemFrenchComp Sci AEng Lang/CompEng Lit/CompEur HistPhysicsSpanishStatsUS HistWorld HistEnviron SciNumber <strong>of</strong> Students Taking AP ExamsOne <strong>of</strong> our basic goals in our Advanced Placement program is to get as many students as possible tostretch themselves and accept the AP challenge. For this reason, we do not see the AP as an eliteprogram so much as a demanding program. This past year, for the first time in three years, we saw adecrease in the numbers <strong>of</strong> students taking math, science, and English AP exams. Part <strong>of</strong> this is dueto a change in course <strong>of</strong>ferings (more options). In science, for instance, we saw a shift to physics anda new <strong>of</strong>fering, environmental science. We also saw a decline in both <strong>of</strong> our English AP classes, and aslight increase in our enrollment in history AP classes.655545352003 2004 200525<strong>2006</strong> 20<strong>07</strong> 2008155-526
AP History Exam ScoresAP US History<strong>The</strong> main purpose <strong>of</strong> thesegraphs is to show how ourstudents performed compared toother students who took the sameAP tests. Although our worldwidescores do not arrive until late inOctober, we can see based onprevious years, that we clearlyout perform the average APscores in these two areas andthat we have remained veryconsistent in our performance.We should take great pride in theincrease in AP US History scores.100908<strong>07</strong>06050403020100100908<strong>07</strong>02000 2001 2002 2003 2004 2005 <strong>2006</strong> 20<strong>07</strong> 2008AP European HistoryASD 3+ %Worldwide 3+ %605040ASD 3+ %3020Worldwide Passing %1002000 2001 2002 2003 2004 2005 <strong>2006</strong> 20<strong>07</strong> 200827
AP World History ResultsIn our third year <strong>of</strong> <strong>of</strong>fering AP World History, our scoresremain substantially higher than worldwide performance onthis exam.28
AP English Exams1009080AP LiteratureOur AP English classesremain the most popular <strong>of</strong>our AP <strong>of</strong>ferings and ourstudents continue to do well.<strong>The</strong> scores in AP Literaturewere exceptional this year,and our Language andComposition scoresremained high. It is good tosee so many students takingthe AP challenge.10<strong>07</strong>060504030201002000 2001 2002 2003 2004 2005 <strong>2006</strong> 20<strong>07</strong> 2008AP Language and CompositionASD 3+%Worldwide 3+ %908<strong>07</strong>0605040ASD 3+ %Worldwide 3+ %30201002000 2001 2002 2003 2004 2005 <strong>2006</strong> 20<strong>07</strong> 200829
AP Science ExamResultsAP BiologyOur performance in both biologyand chemistry were aboveworldwide scores last year andagain this year as well. Wemade significant gains againstthe worldwide average inchemistry. Our scores <strong>of</strong> 3+percentage remain very high inboth subjects.AP Chemistry30
AP Statistics & PhysicsOur physics scores, while less in percentage <strong>of</strong> 3+ scores, actually reveal growth as we had triple the number <strong>of</strong> studentstake the exam this year (21 compared to 8 in 20<strong>07</strong>). We have seen a decline in our statistics scores that is somewhatpuzzling to us. We know that statistics requires a different type <strong>of</strong> thinking and it appears that many <strong>of</strong> the students whotake this course do so with the perception that this is an easy AP, which it is not. We may need to re-consider the prerequisitesfor this course in the future.AP StatisticsAP Physics31
AP Calculus ResultsOur students in Calculus AB continue to build on the trend from the last few years. Inaddition, five students in the class, thanks to extra time after class from the teacher,achieved five’s in the AP Calculus BC as well as the Calculus AB!32
AP Spanish & FrenchOur numbers are very small in AP Spanish and French, but our performance remains strong. Withstudent transitions, it is difficult to build a base <strong>of</strong> students who take world language at our school for atleast four years, but our goal remains to increase the number <strong>of</strong> students who reach this level <strong>of</strong>pr<strong>of</strong>iciency.33
AP Computer Science AIn this difficult programmingcourse our student numbersremain small (6 students thisyear) but the scores areexemplary.34
NWEA Measures <strong>of</strong> Academic ProgressGrades 3 – 520<strong>07</strong>/2008Grade level Subject Area ASD Mean RIT Score US National Above US NormsMean RIT ScoreGrade 3 Math 201.9 202.4 -0.5Reading 204.1 199 5.1Language Usage 204.9 200.5 4.4Science 198.8 196.3 2.5Grade 4 Math 214.6 211.4 3.2Reading 211.3 205.8 5.5Language Usage 212.2 2<strong>07</strong> 5.2Science 203.9 200.9 3Grade 5 Math 228.6 219.2 9.4Reading 218.6 211.1 7.5Language usage 220.4 211.8 8.6Science 209.2 204.9 4.3Grades three, four and five took the NWEA Measures <strong>of</strong> Academic Progress test three times during the 20<strong>07</strong>/2008 school year. <strong>The</strong> results aboverepresent the results from the final testing in the spring and compare ASD results against the National US Norms.As evidenced in the table ASD students scored above the US National Norms in all areas except Math in third grade. <strong>The</strong> subtests <strong>of</strong> the third gradeMath showed that the area <strong>of</strong> relative weakness was in computations (-0.5). However, it is worth mentioning that the third graders showed 10. 2 RITpoints growth in this area. This is the expected growth, given the starting point for the first testing <strong>of</strong> the year. In recognizing that the area <strong>of</strong>computation is in need <strong>of</strong> improvement, a targeted goal has been set to improve computation skills in third grade. It is important to note that in theareas <strong>of</strong> measurement, statistics, probability and algebraic concepts, ASD third graders scored above the US National Norms. In the area <strong>of</strong> problemsolving ASD third graders demonstrated a very significant strength.All other grade levels scored above the US National Norms in all areas. Fifth grade scored significantly high in the Math areas <strong>of</strong> number sense andgeometry.35
NWEA Measures <strong>of</strong> Academic ProgressMiddle <strong>School</strong>20<strong>07</strong>/2008Grade level Subject Area ASD Mean RIT Score US National Above US NormsMean RIT ScoreGrade 6 Math 232.4 223.8 8.6Reading 222.1 214.8 7.3Language Usage 222.3 215.1 7.2Grade 7 Math 237.8 228.3 9.5Reading 227.7 217.9 9.8Language Usage 227.5 217.7 9.8Grade 8 Math 244.1 232.7 11.4Reading 231.4 221.2 10.2Language Usage 229.4 220.4 9Middle <strong>School</strong> students took the NWEA Measures <strong>of</strong> Academic Progress test twice during the 20<strong>07</strong>/2008school-year in the areas <strong>of</strong> math, reading and language usage. As evidenced in the table above, ASDMiddle <strong>School</strong> students scored above the US National Norms in all areas. Areas <strong>of</strong> significant strength werein sixth grade, seventh grade and eighth grade math, seventh grade reading and language usage andeighth grade reading.<strong>The</strong> NWEA Measures <strong>of</strong> Academic Progress is an adaptive test that looks for individual growth instudent learning.36
<strong>American</strong> <strong>School</strong> <strong>of</strong> <strong>Doha</strong>Results from the <strong>2006</strong> PISA TESTSubject ASD Results Qatar Results OECD Highest ScoringUS ScoresCountryWorldwideResultsResultsMean Mean Mean MeanReading 579 312 500 556 (Korea)Mathematics 560 318 500 549 (Taipei) 474Science (composite) 570 349 500 563 (Finland) 489*Identifying Scientificissues* Scientifically explainingphenomena*Using scientificevidence562 353 500 Not available567 357 500 Not available575 325 500 Not availablePISA stands for Programme for International Student Assessment. It is an international standardizedassessment that was jointly developed by participating countries and administered to 15-year-olds in schools invarious countries. <strong>The</strong> survey was implemented in 64 countries, including the State <strong>of</strong> Qatar in <strong>2006</strong>. A randomselection <strong>of</strong> ASD students participated in this test. <strong>The</strong> results were shared internationally and with ASD inDecember 20<strong>07</strong>.As evidenced in the chart above, ASD students scored very well relative to the World-Wide Norms, the USNorms and the highest scoring countries.37
Presidential Fitness AwardsIn our Physical Education program, the only measure <strong>of</strong> overall student performance in fitness that wehave are the National and Presidential Fitness Awards. Since we started recording this data, we haveseen some very positive growth in this area. This past year both the middle and high school had hugeincreases in students who qualified for the “Presidential” fitness recognition. In the national fitnesstest, the middle school had a substantial decrease, while the high school had a tremendous jump inqualified students.130120110100908<strong>07</strong>06050403020Middle <strong>School</strong> 2003-04Middle <strong>School</strong> 2004-05Middle <strong>School</strong> 2005-06Middle <strong>School</strong> <strong>2006</strong>-<strong>07</strong>Middle <strong>School</strong> 20<strong>07</strong>-08High <strong>School</strong> 2003-04High <strong>School</strong> 2004-05High <strong>School</strong> 2005-06High <strong>School</strong> <strong>2006</strong>-<strong>07</strong>High <strong>School</strong> 20<strong>07</strong>-08100PresidentialNational38
Computers-Student RatiosWe continue to expand and invest in our technology resources; however, with the increased use <strong>of</strong> technology forinstruction, coupled with our growth, it is still difficult to meet all <strong>of</strong> our technology demands. We have completedthe laptop program for faculty and all teachers have laptop computers which are essential for the required work onVirtual <strong>School</strong>, Power <strong>School</strong>, and curriculum mapping/unit design. We have also provided all middle and highschool teachers with classroom LCD projectors and have provided one LCD projector per team in the elementaryschool. <strong>The</strong> next large obstacle for us is to provide more mobile units for classes and to investigate how a studentlaptop program could help us cope with the every increasing demand for technology. In addition, much <strong>of</strong> ourtechnology is aging and we need to develop a comprehensive replacement cycle in order to keep our students andteachers on the “cutting edge.”200180# <strong>of</strong> Computers160140120100806040200MS/HS 05-06MS/HS 06-<strong>07</strong>MS/HS <strong>07</strong>-08MS/HS 08-09ES 05-06ES 06-<strong>07</strong>ES <strong>07</strong>-08ES 08-09Faculty 05-06Faculty 06-<strong>07</strong>Faculty <strong>07</strong>-08Facuty 08-0939
Parent Survey: Overall Satisfaction ResponseAt ASD we are blessed with strong parent support and the response to our annualparent survey reveals the trust and faith that parents have in our school. We willcontinue to try and meet your high expectations.This year we gave our annual survey electronically via Survey Monkey, and althoughwe did have fewer returns (about 81%) the results remained strong to the essentialopening question <strong>of</strong> the survey:As a parent I am very satisfied with the <strong>American</strong> <strong>School</strong> <strong>of</strong> <strong>Doha</strong>:5 & 4StronglyAgree/orAgree3SomewhatAgree2Disagree1StronglyDisagreeElementary 88% 10.7% 1.3% 0Middle 73.9% 26.1% 0 0High 71.3% 21.9% 4.1% 2.7%40
Middle <strong>School</strong> Week Without Walls: Grade SixWWW 2008 Survey ResultsScoring = 5 strongly agree, 1 strongly disagreeGrade 6 Parents 2008WWW was a worthwhile educational experience 4.24Sufficient connections made to the curriculum 3.65Organization and communication met my needs 3.82My child has enthusiastically shared the week 4.05My child was challenged to grow outside their comfort zone 3.70AVERAGE 3.89Grade 6 Students 2008I learned new & valuable things during WWW 3.57I enjoyed the activities conducted during WWW 4.36Parents and I have talked about WWW experience 3.53Some <strong>of</strong> the activities were new and challenging 3.01I can enthusiastically recommend the WWW to other students. 4.29AVERAGE 3.75Parents and students continue to rate the experience highly. Parents and studentsshowed a decrease in connection to the curriculum and this will be a focal point<strong>of</strong> the 2008-2009 trip. Student feedback also indicates that the experience couldbe more challenging to them through the introduction <strong>of</strong> new concepts andactivities.41
Middle <strong>School</strong> Week Without Walls: Grade SevenGrade 7 Parents 2008WWW was a worthwhile educational experience 4.42Sufficient connections were made to the curriculum 3.90Organization and communication met my needs 4.25My child has enthusiastically shared the week 4.25My child was challenged to grow outside their comfort zone 4.47<strong>The</strong> choice <strong>of</strong> UAE was appropriate locale 4.36AVERAGE 4.27Grade 7 Students 2008WWW was a worthwhile educational experience 4.12I enjoyed the activities in the UAE 4.63I have spent time sharing WWW with parents 3.96I was challenged to grow outside my comfort zone 3.75I can enthusiastically recommend the WWW to other students 4.40AVERAGE 4.17Parents thought this year’s program did more to stretch our students than in yearspast. A point <strong>of</strong> focus for the coming year will be getting students to communicatewith their parents and boosting the connection to the curriculum. It is interestingthat parents rate the experience high for taking the kids out <strong>of</strong> the their comfortzones and making this a worthwhile experience.42
Middle <strong>School</strong> Week Without Walls: Grade EightGrade 8 Parents 2008WWW was a worthwhile educational experience 4.02Sufficient connections were made to the curriculum 3.52Organization and communication met my needs 3.92My child has enthusiastically shared the week 3.96My child was challenged to grow outside their comfort zone 3.86<strong>The</strong> choice <strong>of</strong> Malaysia was appropriate locale 3.98AVERAGE 3.87Grade 8 Students 2008WWW was a worthwhile educational experience 4.15I enjoyed the activities in the Malaysia 4.21I have spent time sharing WWW with parents 4.10I was challenged to grow outside my comfort zone 3.60I can enthusiastically recommend the WWW to other students 4.52AVERAGE 4.11<strong>The</strong> ratings <strong>of</strong> the parents remained fairly consistent with previous years.Interestingly, students felt that the trip could have done more to challengetheir comfort. A point <strong>of</strong> emphasis for the coming year will be to emphasizethe connection <strong>of</strong> the trip to the curriculum experienced at ASD.43
Elementary Library Circulation/MonthShowing Current Year against the Past Three Years7000600050004000Aug <strong>07</strong><strong>School</strong>ClosedDec 06ASIAN GAMESWINTER BREAKJun 08library closedfor packingJun <strong>07</strong>library closedfor packing3000200010000Aug Sep Oct Nov Dec Jan Feb Mar Apr May JunAugust 04 - June 05 August 05 - June 06 August 06 - June <strong>07</strong> August <strong>07</strong> - June 08In this graph, the elementary library increased circulation by 1,000 materials a month onaverage, from the <strong>2006</strong>-20<strong>07</strong> school year to the 20<strong>07</strong>-2008 school year. Higher enrollment andincreased collection numbers have resulted in more books in students’ hands.44
Number <strong>of</strong> MaterialsElementary Library Circulation: 20<strong>07</strong>-089000Elementary Library Check-out800<strong>07</strong>0006000500040003000200010000ElemFacultyElem Staff PreK K Grade 1 Grade 2 Grade 3 Grade 4 Grade 5 ParentsElementary Community2004-2005 2005-<strong>2006</strong> <strong>2006</strong>-20<strong>07</strong> 20<strong>07</strong>-2008In this graph, the circulation numbers <strong>of</strong> the elementary community members has beendivided into grade levels and patron types. With the addition <strong>of</strong> one class per grade level,with the exception <strong>of</strong> grade five, nearly every grade increased circulation. <strong>The</strong> move <strong>of</strong> thelibrary from a location directly across from grade two, to an area outside the primary school,resulted in second grade circulation holding steady.45
Number <strong>of</strong> VisitorsDEC 06 ASIAN GAMES WINTER BREAKLIBRARY CLOSED FOR PACKING IN JUNEElementary Library Patrons Usage: 20<strong>07</strong>-08Total Foot Traffic14000120001000080006000400020000Aug Sep Oct Nov Dec Jan Feb Mar Apr May Jun2004-2005 2005-<strong>2006</strong> <strong>2006</strong>-20<strong>07</strong> 20<strong>07</strong>-2008This graph illustrates the number <strong>of</strong> ASD community members who have visited the libraryduring the 20<strong>07</strong>-2008 school year. With the move <strong>of</strong> the elementary library into a new spacethree times its original size, total foot traffic nearly doubled every month. March was thebusiest month with nearly 14,000 visits to the library.46
Number <strong>of</strong> VisitorsAUG <strong>07</strong> SCHOOL CLOSEDDEC 06 ASIAN GAMES WINTERBREAKJUNE <strong>07</strong> LIBRARY CLOSED FOR PACKINGJUNE 08 LIBRARY CLOSED FOR PACKINGElementary Library Average Foot Traffic / Day80<strong>07</strong>5<strong>07</strong>00650600550500450400350300250200150100500Aug Sep Oct Nov Dec Jan Feb Mar Apr May Jun2004-2005 2005-<strong>2006</strong> <strong>2006</strong>-20<strong>07</strong> 20<strong>07</strong>-2008In this graph, the number <strong>of</strong> visits to the library has been broken down to show averagedaily attendance by ASD community members, which includes, students, faculty, staff andparents. During the 20<strong>07</strong>-2008 school year, the elementary library had an average <strong>of</strong> 621visits per day.47
Middle and High <strong>School</strong> Database Usage<strong>The</strong> use and instruction <strong>of</strong> online databases remains a critical aspect <strong>of</strong> information literacy. Thischart shows that Grolier online encyclopedias remain a popular source <strong>of</strong> information.48
# <strong>of</strong> BooksMiddle and High <strong>School</strong> Library CirculationMiddle school students, especially sixth graders, read the most books in the MS/HS Library. As the students go up in grades wesee fewer checkouts, more use <strong>of</strong> reference materials, and more dependency on the internet sources.Book Circulation by Grade14001200100080060040020006 7 8 9 10 11 12Grade49
Middle and High <strong>School</strong> Library CollectionFor the first time, the new MS/HS library divided the book collection to provide separate distinct collections forthe middle school and high school students. In addition, we were able to start aligning book purchases withthe curriculum. This graph shows the number <strong>of</strong> books in various subject areas.GeneralitiesPhilosophyReligionSocial ScienceLanguageNatural Science & MathTechnology<strong>The</strong> ArtsLiteratureGeography & HistoryFictionReferenceBiographyPr<strong>of</strong>essionalStory CollectionCollection Size0 500 1000 1500 2000 2500 3000 3500 4000Number <strong>of</strong> Books50
Elementary Sports ProgramLast year saw a “boom” in elementary sports as the opening <strong>of</strong> the middle and high school facilities provided morespace and opportunity for elementary students. In most sports, the numbers doubled or tripled from the previousyear. Cross country was a great new addition as well. Qualifying students were selected to play on school teamsin both 2 nd /3 rd and 4 th /5 th grade divisions in the city tournaments as ASD is a member <strong>of</strong> Qatar <strong>School</strong>s SportsAssociation (QSSA).BASKETBALL SOCCER SWIMMING TRACK & FIELD CROSS COUNTRYGRADE 2 & 3 GRADE 4 & 5 GRADE 2 & 3 GRADE 4 & 5 GRADE 2 & 3 GRADE 4 & 5 GRADE 2-5 GRADE 2-5BOYS GIRLS BOYS GIRLS BOYS GIRLS BOYS GIRLS BOYS GIRLS BOYS GIRLS BOYS GIRLS BOYS GIRLS90 47 83 54 112 52 90 34 25 25 25 25 40 40 18 17ALL SPORTS COMBINEDB.BALL SOCCER SWIM Track X Country ALLBOYS 173 202 50 40 18 463GIRLS 101 86 50 40 17 28551
Lower ElementaryAfter <strong>School</strong> Activities<strong>The</strong> ASA program in the lower elementary school remains a vital part <strong>of</strong> the school day for well overhalf <strong>of</strong> our students. <strong>The</strong>se programs not only <strong>of</strong>fer enrichment learning, but also many exploratoryopportunities for students.KindergartenQUARTER 1 QUARTER 2 QUARTER 3 QUARTER 4Number <strong>of</strong> Activities 6 5Number <strong>of</strong> Students 54 47% <strong>of</strong> Students 64 51Grade 1Number <strong>of</strong> Activities 5 7 6 6Number <strong>of</strong> Students 51 71 71 60% <strong>of</strong> Students 57 78 76 64Grade 2Number <strong>of</strong> Activities 8 11 7 8Number <strong>of</strong> Students 61 59 54 63% <strong>of</strong> Students 64 64 53 5852
Upper Elementary After <strong>School</strong>s ActivitiesQUARTER 1 QUARTER 2 QUARTER 3 QUARTER 4GRADE 3Number <strong>of</strong> Activities 12 10 8 7Number <strong>of</strong> Students 71 55 61 70% <strong>of</strong> Students 64% 64% 53% 58%GRADE 4Number <strong>of</strong> Activities 10 8 8 12Number <strong>of</strong> Students 70 53 54 57% <strong>of</strong> Students 81 61 64 67GRADE 5Number <strong>of</strong> Activities 9 8 5 12Number <strong>of</strong> Students 68 50 57 64% <strong>of</strong> Students 70 53 57 60K-5 # <strong>of</strong> activities 23 21 23 21K-5 # <strong>of</strong> Students 321 288 351 36153
Varsity SportsIt was a banner year for varsity sports at ASD beginning with the opening <strong>of</strong> the new indoor swimming poolfor the EMAC tournament and capped by ASD’s track and field victory in Cairo, breaking a twenty-five yearmonopoly by the host school. In between these two events we watched the varsity girls volleyball team wintheir second consecutive EMAC championship, the boys volleyball team finish a strong second, our soccerteams play some great matches, our varsity girls win cross-country and our boys cross-country givinganother strong performance for second, and our basketball teams go to the final minutes before losing tothe eventual EMAC champions. Even better than our performances on the field was the class andsportsmanship that we exhibited <strong>of</strong>f the field. Our varsity athletes did a great job <strong>of</strong> representing ourschool.54
Junior Varsity Sports<strong>The</strong> junior varsity program continued this year to provide both excitement and a great training groundfor young athletes. Our EMAC tournament results were great with junior volleyball girls taking gold,.boys and girls soccer capturing silver, as did our boys and girls cross-country teams and basketballteams. Our junior track team was part <strong>of</strong> the success story in Cairo this year with the girls taking a firstand boys a fifth, and our academic team won a silver in a sudden death play<strong>of</strong>f in the final round. Ourjunior athletes, in learning to compete, also learn how to accept victory with humility anddisappointment with dignity. We are proud <strong>of</strong> all <strong>of</strong> these young athletes.55
Music at ASDASD is blessed with a vibrant and active music program that includes both vocal and instrumental music. Inaddition to a concert band, percussion ensemble and jazz band, many <strong>of</strong> our students participate in the local<strong>Doha</strong> Community Orchestra as well. Our choral program consists <strong>of</strong> both a concert choir and ensemble group,the Chamber Singers. This past year was highlighted by the opening <strong>of</strong> our new Fine Arts Center and wehosted the EMAC Senior Arts Festival with more than two hundred students involved in music, drama, and thevisual arts. In addition, our students continue to do well in their “audition based” participation in AMIS honorbands with five middle school students selected to play in Morocco, and 9 high school students selected to playand sing in the festival in London. Our program is supported by a strong elementary and middle schoolprogram, with beginning band starting in grade six. In addition to annual concerts, our music studentsperformed at graduation, our “Grand Opening” ceremony, and for special guest Madeleine Albright, plusnumerous holiday performances.56
Drama at ASDDrama took a huge step forward with the advent <strong>of</strong> our new theater and a whole new and variedprogram for middle and high school. A new step in stage production was realized with theproduction <strong>of</strong> the musical “Pippin” in the spring with over forty students involved in the production.In addition, several ensemble pieces were also performed, including “Antigone,” “A MidsummerNight’s Dream,” and “Tartuffe.”57
Visual Arts at ASD<strong>The</strong> visual arts are taught in grades PK-12 and student art is featured throughout the school. In the elementaryschool, the Peace Dove Project involved every single elementary student and created a visual reminder <strong>of</strong> ourvalue <strong>of</strong> “Peace” throughout our elementary corridor. In the secondary school, there was an art exhibit duringthe EMAC festival, a faculty – student exhibit, and in May, the advanced art class did an art show as well. Bothmiddle and high school classes continually gave visual energy to our lobbies.58
Elementary <strong>School</strong> Community ServiceCommunity service learning is an essential part <strong>of</strong> our “learning” as a school and we align thiswith our school values <strong>of</strong> respect, responsibility, honesty, and compassion. Our students are veryfortunate and we want them to develop the inner joy <strong>of</strong> giving to others, protecting ourenvironment, and working toward a goal together.Grade Level Project Amount RaisedPK Collection <strong>of</strong> hygienic items for workers No money involvedKG Collection <strong>of</strong> canned food for workers No money involvedGrade 1 ES Compost Project No money involvedGrade 2Created and workers for books for aNo money involvedTanzanian <strong>School</strong>Grade 3 Toy Sale to raise money for A-CET QR 4,888.00Grade 4 Lance Armstrong Drive QR 6,850.00Bake Sale for A-CETBoot Sale for A-CET QR 5,000.00Grade 5 Walkathon for A-CET US$ 7,500.00Student CouncilSelling <strong>of</strong> Heart-o-grams“<strong>The</strong> Cats”ACETBook Aide InternationalDonated 1,500 QRDonated 5,400 QRDonated 5,400 QREdo Care Recycling paper No money involvedArt Department <strong>School</strong> community art projects No money involvedPeace DovesLibraryPeace FlagsDragon Wall MuralPeace BenchesChildren Around the WorldPainted Tables & ChairsUsed book sale with funds raised beinggiven to5,111.00 Book Aid Int’l5,111.00 ACET59
ASD Reaches Out20<strong>07</strong>/2008 was a very big year for ASD in terms <strong>of</strong> community service and sustainability. Teachers and students are empowered to bethe positive change our world so desperately requires. ASD EduCare, Hands Across <strong>Doha</strong>, Care Club and Global Issues are just a fewexamples <strong>of</strong> groups at ASD working towards a sustainable future. This academic year ASD has made huge positive strides towards trulycreating global citizens and will continue our quest in the years to come.Forty ASD teachers have formed the acclaimed and recognized EduCare committee. Thirty-five middle school and high school studentsmade up Hands Across <strong>Doha</strong>, a group reaching out to workers in our city. High school students took service-learning trips to Tanzaniaand Bolivia. <strong>The</strong> African Children’s Education Trust raised $22,000 to build a school in Ethiopia, and continues to support the growth <strong>of</strong>this school currently. National Honor Society members were busy raising money for Make-A-Wish and Nothing But Net, as well as doingprojects for ASD workers and hosting movie nights for our elementary students. <strong>The</strong> National Junior Honor Society has continued tosupport a school and orphanage in Sri Lanka. <strong>The</strong> elementary Care Club <strong>of</strong> thirty students undertook several environmental and petfriendlyinitiatives. Students from kindergarten to 12 th grade were involved in a Reduce, Reuse and Recycle campaign on the ASDcampus.60
Middle & High <strong>School</strong> CommunityServiceCommunity service is embedded into many <strong>of</strong> the activities that we have at ASD. NJHS and NHS annually raisefunds to pay for the teacher and teacher’s aide in our adopted school in Sri Lanka. Global Issues Network hasraised money to build a school in Ethiopia. Over thirty students traveled to Tanzania during spring break to workwith schools there. Our Hands Across <strong>Doha</strong> collected food and clothing for local work camps, and in our annualWeek Without Walls trip to Malaysia, working with local orphanages and schools is always part <strong>of</strong> the experience.This past year, four <strong>of</strong> our juniors, Nicole Sayers, Lauren Pratt, Chris Wallace, and Calvin Ullrich raised over$22,000 and traveled to Bolivia to use the money to build new restrooms and a library at a local school there.Learning to give is part <strong>of</strong> an ASD education.61
College Acceptances<strong>The</strong> chart below shows where our graduating seniors are attending colleges and universities. <strong>The</strong>biggest factor in this graph is the 21% <strong>of</strong> the seniors who have not informed ASD where they arematriculating. Coupled with that we see a 13% decline in US colleges and universities, a 10% drop inEuropean universities, and a five percent increase in students attending Education City. I imagine thedecreases are captured in the decreases that we see, but we will have to find a more accurate mannerto gather information from seniors in the future.60%50%40%30%20%US CollegesCanadian CollegesGulf CollegesEuropean UniversitiesEducation CityMilitaryAsian UniversitiesCommunity CollegesUnknown10%0%2003 2004 2005 <strong>2006</strong> 20<strong>07</strong> 200862
Matriculation to Top Colleges and UniversitiesEvery year US News and World <strong>Report</strong>s publishes a special college issue that ranks the topone hundred colleges and universities, both private and public in a common ranking.MacLeans and Gourman’s do a similar report in Canada. <strong>The</strong> chart below shows how ourstudents have fared in their applications to these prestigious schools. This past year 60% <strong>of</strong>the students who applied to US universities and colleges were accepted in the top 100 schools(exactly the same as last year), and 34% <strong>of</strong> students who applied to the top ten Canadianuniversities, were accepted. Of note is that we have one graduate attending Harvard andanother West Point, and 87% <strong>of</strong> our Canadian acceptances were to schools rated in the top25 within Canada.2002-03 2003-04 2004-05 2005-06 <strong>2006</strong>-<strong>07</strong> 20<strong>07</strong>-0870.00%60.00%50.00%40.00%30.00%20.00%10.00%0.00%% Attending: Top 100 USA % Accepted Top 100 USA % Accepted: Top 10 Canada63
EPILOGUEAs I collect and organize the data for this fifth annualreport, I am not only surprised by how much haschanged but also by how much has stayed the same.In a recent essay, one <strong>of</strong> our students wrote, “ ASD is aplace to learn, build friendships, and be in a greatcommunity.” <strong>The</strong>se ideas <strong>of</strong> learning, friendships, andcommunity are captured more in the photographs <strong>of</strong>this report than in the data.However, data is a good reminder to us about whatresearcher Jim Collins calls “the brutal facts.” Weneed to try and get an objective view <strong>of</strong> ourselves inorder to see how well we are really doing and to bebrave enough to face these facts and to seeimprovements.And that is what the annual report is reallyabout…improvements. We want to learn from our pastand continue to strive for excellence in all that we do inthe future.I am reminded every day about how blessed we are tolive in a community where excellence is expected,where children want to learn, and teachers love toteach, and the idea <strong>of</strong> community is not just a word buta way <strong>of</strong> life.64
2008 College MatriculationAbate, CandaceAbdallah, NorahAbou-jaoude, BadyAhern, VeronicaAkhter, ShehzeenAl Ani, OmarAl Beldawi, HusamAl Khori, NasserAl Khulaifi, AsmaAl Marri, NajdAl Thani, JaziAli, MaazAli, MaryamBadra, KarimBailey, TyBreutsch, MichaelCaleja, Sai AnCallens, ChrisCollins, BayleighDixon, ClaireDwimaryanto, BellaEl Attar, AhmedEl Waylly, TamaraFakhroo, AbdulaziFakhroo, MariamFarah, LibanGoucher CollegeNYUGeorgetown - QatarNYIT (Bahrain)Univ <strong>of</strong> Ontario-Inst <strong>of</strong> TechTexas A&M - QatarKings University College at Western OntarioCarnegie Mellon-QatarGeorgetown - QatarOxford Brooks-FoundationCarnegie Mellon-QatarTexas A&M - QatarArizona State UniversityGeorgetown - QatarUniv <strong>of</strong> Colorado- BoulderUNCW (NC)BYU - Intensive EnglishBlinn - BrenhamSMUMissouri StateLaSalle Col <strong>of</strong> Arts SingaporeDalhousieGeorge Washington UnivRoyal Holloway-FoundationWilliam & MaryCarletonGabrial, MariamGarcia-Benoche, IbraGroeneweg, AliciaHansen, VarHarty, KylaHasan, SyedHenson, JakeHumphries, KatieIskandar, DanaIskandarani, AlmaJansen, FrederikJohnson, BrianJohnson, HaleyKachchi, YusufKlaasen, KatKnox. KristiLopez, LyndsiLutton, MathewMackey, LaurenMackow, TaraMaili, AlkestaMasood, NabeelMenezes, SheldonNavo, SamanthaO'Brien, CooperOlson, LisaCornell- QatarCarnegie MellonUniversity <strong>of</strong> VictoriaImperial College LondonLeftbridge CollegeDrexelMount Vernon, OHStephen F AustinQatar UniversityCarletonSamordna Opptak (Norway)Univ <strong>of</strong> Colorado- BoulderWest PointWilfred LaurierUniv <strong>of</strong> VictoriaSt. Edwards UniversityUniv <strong>of</strong> Texas- San AntonioCarletonYork College, PAUniv <strong>of</strong> CalgaryBaylorTexas A&M - QatarDubai Aeropsace UnivGeorgetown - QatarRhode Island <strong>School</strong> DesignFransiscan (OH)65
20<strong>07</strong>-08 ASD HighlightsAugust:- Opening breakfast for ASD teachers, staff, and board was held in the new MS/HS dining hall- Carrie Ekey did literacy training for elementary teachersSeptember: - A new three floor purpose built facility opened for students in middle and high school- Data analysis training for MAPs testing was done by Kathy Stetson- NWEA MAPs testing was done for middle school- ES introduces new math coordinator position- New student database, Power <strong>School</strong>, used for the first timeOctober:November:- 8 th annual Halloween Carnival records a record turnout- “Hands Across <strong>Doha</strong>” fed 400 workers at Iftar- Middle school students took MAPs testing on line- Opening <strong>of</strong> the “Doves <strong>of</strong> Peace” Wall in elementary school- <strong>School</strong>wide wireless network opening in middle & high school- Erma Anderson consults on math and science- First EduCare Symposium hosted at ASD- Martin Skelton trains administrative team in “Focus on Learning “- Steven Leever was named as new middle school principal for the 2008-09 school year- ASD hosted the EMAC Swimming Invitational in the new ASD indoor pool- Sam Sawan became the first ASD student to be named as an <strong>of</strong>ficer at the prestigious THUIMUNDecember: -PTA Gala raised over QR 100,000- Booster Club held first ever Christmas Tour <strong>of</strong> Homes66
January:February:March:April:May:June:- <strong>The</strong> new ASD theater opens- “Antigone” was performed in the high school- International Week- ASD commits to building a school in rural Ethiopia following a visit from A-CET- Over 350 students and teachers participated in Week Without Walls- Madeleine Albright gives address to ASD community- Texas A&M Boot Scoot raised funds for microscopes- “Pippin” was the first musical performed in the new ASD theater- <strong>The</strong> new facilities are celebrated with a Grand Opening ceremony- Record crowds attended the PTA Friendship Festival- NJHS and NHS raised over QR 5000 to pay the salary for a teacher at our sister school inHamblatola, Sri Lanka- Elementary reached peak enrollment <strong>of</strong> 813 students- Julian Arambarri named as the winner <strong>of</strong> the NESA Hass-Hanson Award for student led community service,and gives remarks at the NESA Educators’ Conference in Bangkok- First elementary music concert held in new ASD theater- Thirty high school students traveled to Tanzania for a community service project- Completion <strong>of</strong> the first year <strong>of</strong> MAPS testing- Grade 5 students garner five <strong>of</strong> the top ten awards at the regional NESA Virtual Science Fair- ASD Track & Field Team wins the Cairo Invitation Track Meet- Haley Johnson becomes the first ASD graduate to attend West Point- Bolivia Project: Four juniors raised over $22,000 to build new restrooms and alibrary in a village school in Bolivia- ASD’s largest graduating class held graduation in the ASD theater- Official promotion ceremonies for grades 5 and 8 were held in the ASD theater67


