GeoVisual Analytics and Crisis Management - Purdue University
GeoVisual Analytics and Crisis Management - Purdue University
GeoVisual Analytics and Crisis Management - Purdue University

You also want an ePaper? Increase the reach of your titles
YUMPU automatically turns print PDFs into web optimized ePapers that Google loves.
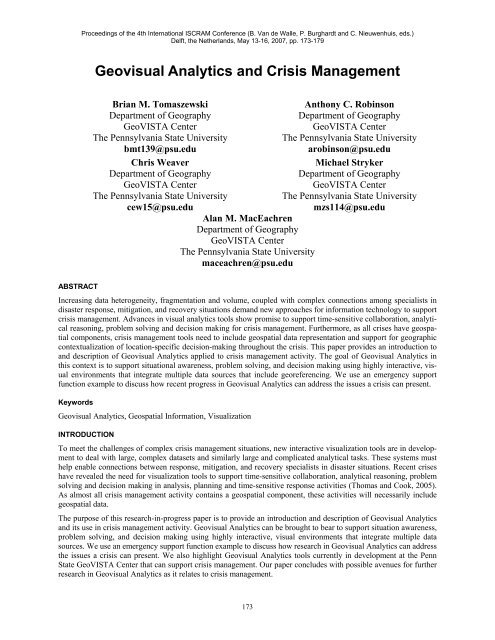
ABSTRACT<br />
Geovisual <strong>Analytics</strong> <strong>and</strong> <strong>Crisis</strong> <strong>Management</strong><br />
Brian M. Tomaszewski<br />
Department of Geography<br />
GeoVISTA Center<br />
The Pennsylvania State <strong>University</strong><br />
bmt139@psu.edu<br />
Anthony C. Robinson<br />
Department of Geography<br />
GeoVISTA Center<br />
The Pennsylvania State <strong>University</strong><br />
arobinson@psu.edu<br />
Chris Weaver<br />
Michael Stryker<br />
Department of Geography<br />
Department of Geography<br />
GeoVISTA Center<br />
GeoVISTA Center<br />
The Pennsylvania State <strong>University</strong><br />
The Pennsylvania State <strong>University</strong><br />
cew15@psu.edu<br />
mzs114@psu.edu<br />
Alan M. MacEachren<br />
Department of Geography<br />
GeoVISTA Center<br />
The Pennsylvania State <strong>University</strong><br />
maceachren@psu.edu<br />
Increasing data heterogeneity, fragmentation <strong>and</strong> volume, coupled with complex connections among specialists in<br />
disaster response, mitigation, <strong>and</strong> recovery situations dem<strong>and</strong> new approaches for information technology to support<br />
crisis management. Advances in visual analytics tools show promise to support time-sensitive collaboration, analytical<br />
reasoning, problem solving <strong>and</strong> decision making for crisis management. Furthermore, as all crises have geospatial<br />
components, crisis management tools need to include geospatial data representation <strong>and</strong> support for geographic<br />
contextualization of location-specific decision-making throughout the crisis. This paper provides an introduction to<br />
<strong>and</strong> description of Geovisual <strong>Analytics</strong> applied to crisis management activity. The goal of Geovisual <strong>Analytics</strong> in<br />
this context is to support situational awareness, problem solving, <strong>and</strong> decision making using highly interactive, visual<br />
environments that integrate multiple data sources that include georeferencing. We use an emergency support<br />
function example to discuss how recent progress in Geovisual <strong>Analytics</strong> can address the issues a crisis can present.<br />
Keywords<br />
Proceedings of the 4th International ISCRAM Conference (B. Van de Walle, P. Burghardt <strong>and</strong> C. Nieuwenhuis, eds.)<br />
Delft, the Netherl<strong>and</strong>s, May 13-16, 2007, pp. 173-179<br />
Geovisual <strong>Analytics</strong>, Geospatial Information, Visualization<br />
INTRODUCTION<br />
To meet the challenges of complex crisis management situations, new interactive visualization tools are in development<br />
to deal with large, complex datasets <strong>and</strong> similarly large <strong>and</strong> complicated analytical tasks. These systems must<br />
help enable connections between response, mitigation, <strong>and</strong> recovery specialists in disaster situations. Recent crises<br />
have revealed the need for visualization tools to support time-sensitive collaboration, analytical reasoning, problem<br />
solving <strong>and</strong> decision making in analysis, planning <strong>and</strong> time-sensitive response activities (Thomas <strong>and</strong> Cook, 2005).<br />
As almost all crisis management activity contains a geospatial component, these activities will necessarily include<br />
geospatial data.<br />
The purpose of this research-in-progress paper is to provide an introduction <strong>and</strong> description of Geovisual <strong>Analytics</strong><br />
<strong>and</strong> its use in crisis management activity. Geovisual <strong>Analytics</strong> can be brought to bear to support situation awareness,<br />
problem solving, <strong>and</strong> decision making using highly interactive, visual environments that integrate multiple data<br />
sources. We use an emergency support function example to discuss how research in Geovisual <strong>Analytics</strong> can address<br />
the issues a crisis can present. We also highlight Geovisual <strong>Analytics</strong> tools currently in development at the Penn<br />
State GeoVISTA Center that can support crisis management. Our paper concludes with possible avenues for further<br />
research in Geovisual <strong>Analytics</strong> as it relates to crisis management.<br />
173
WHAT IS GEOVISUAL ANALYTICS?<br />
Proceedings ISCRAM2007 (B. Van de Walle, P. Burghardt <strong>and</strong> C. Nieuwenhuis, eds.)<br />
Geovisual <strong>Analytics</strong> is an emerging interdisciplinary field that integrates perspectives from Visual <strong>Analytics</strong><br />
(grounded in Information <strong>and</strong> Scientific Visualization) <strong>and</strong> Geographic Information Science (growing particularly<br />
on work in geovisualization, geospatial semantics <strong>and</strong> knowledge management, geocomputation, <strong>and</strong> spatial analysis).<br />
Geovisual <strong>Analytics</strong> tools help identify relevant geospatial information, data, <strong>and</strong> knowledge by supporting<br />
analytical process that meld innate human abilities of vision <strong>and</strong> cognition with computer-based visual interfaces<br />
that provide flexible connections to relevant data <strong>and</strong> supporting knowledge, <strong>and</strong> that are specifically designed to<br />
provide support for analytical reasoning. Often the activities that Geovisual <strong>Analytics</strong> is directed toward involve<br />
recognizing relevant information in enormous datasets that make what is relevant difficult to determine using traditional<br />
methods. Geovisual <strong>Analytics</strong> is an increasingly important tool for activities ranging from counter-terrorism<br />
<strong>and</strong> crisis management, through environmental science, to strategic business decision making.<br />
Conceptually, Geovisual <strong>Analytics</strong> system design efforts for crisis management can build from the following guidelines<br />
for visual analytics generally, as outlined in Thomas <strong>and</strong> Cook (2005):<br />
• Use sense making, cognition, <strong>and</strong> perception foundations for tools that support reasoning for complex tasks<br />
• Address issues of analytical scale <strong>and</strong> the interplay between complexity <strong>and</strong> urgency that dictates <strong>and</strong> determines<br />
the scale<br />
• Synthesize different types of information from different sources into unified representations to find meaning<br />
• Integrate views of large-scale information spaces, coordinated views of information in context, <strong>and</strong> overviews <strong>and</strong><br />
details<br />
• Leverage innate human abilities to reason about time <strong>and</strong> space<br />
Geovisual <strong>Analytics</strong> investigation requires tools that are highly interactive <strong>and</strong> support exploration (Allendoerfer et<br />
al., 2005), that work with end-users previous experience <strong>and</strong> mental models, <strong>and</strong> that allow for evidence to be assessed<br />
<strong>and</strong> hypotheses to be easily evaluated. Thus far, Geovisual <strong>Analytics</strong> tool development has focused on information<br />
analysis relevant to domains such public health threat analysis (Proulx et al., 2006) <strong>and</strong> historical geography<br />
of fragmentary archival documents (Figure 1) (Weaver et al., 2006).<br />
Figure 1: The ‘Hotels Viz’, a Geovisual <strong>Analytics</strong> application built in the Improvise interactive visualization<br />
construction system (Weaver, 2004). Users can explore spatial <strong>and</strong> temporal aspects in past<br />
travel behavior based on historical registry entries from historic hotels.<br />
174
Tomaszewski et al. Geovisual <strong>Analytics</strong> <strong>and</strong> <strong>Crisis</strong> <strong>Management</strong><br />
The ultimate end goal of Geovisual <strong>Analytics</strong> investigation is the dissemination of results to decision makers who<br />
need a succinct communication of the interpretations made by an analyst or group of analysts. Geovisual <strong>Analytics</strong><br />
tools must support visual outputs that can be used as artifacts of persuasion in whatever medium is used to convey<br />
the story (Gershon <strong>and</strong> Page, 2001).<br />
PROBLEM DOMAIN<br />
In all phases of the disaster cycle, crisis management activity <strong>and</strong> real-world events generate huge volumes of data<br />
from heterogeneous sources such as news reports, video feeds, email, text messaging, RSS feeds, <strong>and</strong> cameraenabled<br />
cell phones. Most of these data contain an explicit geospatial component (e.g., derived from GeoRSS feeds),<br />
or implicit geospatial references (e.g., place names extracted from a news report) (Figure 2). For example, the Geovisual<br />
<strong>Analytics</strong> application shown in Figure 2 extracts <strong>and</strong> plots geographic place names <strong>and</strong> disaster concepts from<br />
news stories (shown on the bottom of the figure) to visually reveal potentially unknown geographical <strong>and</strong>/or conceptual<br />
relationships between places in Google Earth (shown on the top of the figure).<br />
In emergency response activities, information from trusted sources may be of critical importance in time sensitive<br />
situations. For example, the United States Senate Committee On Homel<strong>and</strong> Security And Governmental Affairs<br />
Photo Credits: Google Earth mapping service/© 2007 Europa Technolo- (hereafter “the Committee”)<br />
gies/Image © 2007 TerraMetrics<br />
investigation into the response<br />
to the Hurricane<br />
Katrina disaster of 2005 reported<br />
that the Department<br />
of Homel<strong>and</strong> Security<br />
(DHS) issued incomplete<br />
<strong>and</strong> contradictory situation<br />
reports during the event, <strong>and</strong><br />
in turn DHS, “…failed to<br />
recognize, or disregarded as<br />
unconfirmed, many of the<br />
reports that it did receive”<br />
(Committee On Homel<strong>and</strong><br />
Security And Governmental<br />
Affairs, 2006:19-2).<br />
Figure 2: The Context Discovery Application (Tomaszewski, 2007)<br />
175<br />
Another important (potential)<br />
input to crisis management<br />
activity is information<br />
about past (or hypothetical)<br />
events that can inform present<br />
situations. Examples of<br />
this include knowledge derived<br />
from response training<br />
exercises, post-hoc analyses<br />
of real responses to disasters,<br />
<strong>and</strong> vulnerability assessments<br />
that are used to<br />
formulate hazard mitigation<br />
strategies. An example of<br />
failure to use the first type of<br />
information effectively was<br />
found in the Committee’s<br />
investigation of the Hurricane<br />
Pam training exercise<br />
of 2004 that preceded Hurricane<br />
Katrina in 2005. Although<br />
some lessons from<br />
the Pam exercise were applied<br />
in Katrina, “…far too
Proceedings ISCRAM2007 (B. Van de Walle, P. Burghardt <strong>and</strong> C. Nieuwenhuis, eds.)<br />
many of the Hurricane Pam lessons were not applied. Despite this being ‘the storm we’ve always feared’, despite<br />
our being well aware of the impact of such a storm on New Orleans, <strong>and</strong> despite the fact that federal, state <strong>and</strong> local<br />
agencies came together in July 2004 to do a ‘live rehearsal’ of a response in such a circumstance…too little was<br />
done to act on the plans resulting from Hurricane Pam” (The Committe 2006:8-9).<br />
Some crisis situations inherently need to be examined from a geographic perspective over time. For example, with a<br />
phenomenon like the Avian Flu virus, information about where <strong>and</strong> when deaths <strong>and</strong> illnesses are occurring is relevant<br />
input to policy decisions for public officials internationally <strong>and</strong> not only for officials in the locations where the<br />
illnesses/deaths are occurring. Actors at multiple scales must be informed about the spread of the disease to prepare<br />
accordingly, be kept aware of the effectiveness of preventive strategies in use by others, <strong>and</strong> underst<strong>and</strong> the interconnected<br />
hierarchies of relevant events <strong>and</strong> information at many levels (Proulx et al., 2006).<br />
GEOVISUAL ANALYTICS AND CRISIS MANAGEMENT<br />
An example of a situation in which a Geovisual <strong>Analytics</strong> system can benefit crisis management activities can be<br />
found in Emergency Support Function (ESF) #5 - Emergency <strong>Management</strong> Annex from the United States National<br />
Response Plan 1 (NRP). The purpose of ESF #5 is listed as:<br />
“Emergency Support Function (ESF) #5 – Emergency <strong>Management</strong> is responsible for supporting overall activities<br />
of the Federal Government for domestic incident management.”<br />
The Planning section of ESF #5 indicates that it “…coordinates with the DHS Science <strong>and</strong> Technology Directorate<br />
<strong>and</strong> agencies with special technical capabilities to request support for geospatial intelligence, modeling, <strong>and</strong> forecasting.”<br />
The overall ESF is tasked with providing situation reports across multiple jurisdictional levels before, during,<br />
<strong>and</strong> after a crisis.<br />
Geovisual <strong>Analytics</strong> systems in particular can be used to support geospatial intelligence, situation awareness, <strong>and</strong><br />
any other tasks that require analysis <strong>and</strong> knowledge construction using geospatial information. For example, geovisualization<br />
of storm events, vehicle crashes, <strong>and</strong> vehicle movement can reveal patterns of response activity across<br />
multiple spatial <strong>and</strong> temporal scales. The ability to dynamically express queries through the manipulation of graphical<br />
components of a user interface can provide an intuitive means to discover relationships among activities <strong>and</strong><br />
objects for complex events that might span multiple jurisdictions (Figure 3).<br />
Figure 3: Another Improvise visualization, in which linked displays allow the cross-filtering of vehicle movement,<br />
crash events, <strong>and</strong> storm events in time series <strong>and</strong> multiple maps (Stryker, 2007).<br />
1 http://www.dhs.gov/xlibrary/assets/NRP_FullText.pdf<br />
176
Tomaszewski et al. Geovisual <strong>Analytics</strong> <strong>and</strong> <strong>Crisis</strong> <strong>Management</strong><br />
Furthermore, Geovisual <strong>Analytics</strong> can aid collaboration processes where dynamic, time critical response situations<br />
require actors to engage in tasks for which they may not have procedural training or experience or where information<br />
is fragmentary or incomplete (MacEachren, 2005). For example, the complexity of the NRP may create difficulties<br />
for on-the-ground responders during a crisis. Computational methods can be used to search <strong>and</strong> extract relevant<br />
information from large information spaces such as the NRP, planning reports or operation manuals created by government<br />
entities in order to build ontology-based representations (Mitra <strong>and</strong> Pan, submitted).<br />
Interactive tools can help users navigate these resources to construct meaning <strong>and</strong> derive alternative courses of action.<br />
This approach of distilling essential information <strong>and</strong> presenting it in an interactive visual format allows actors<br />
to take rapid action during a crisis situation by sharing, comparing <strong>and</strong> discussing ontologies created by individuals<br />
Photo Credits: Google Earth mapping service/© 2007 Europa Technologies/Image<br />
© 2007 TerraMetrics<br />
Figure 4: Linked concept map-geographic map applications.<br />
2 http://www.geovista.psu.edu/ConceptVISTA/index.jsp<br />
177<br />
or using ontologies created<br />
to externalize <strong>and</strong> share<br />
information that would not<br />
be readily accessible to the<br />
group.<br />
Ontologies created by users<br />
in a crisis situation can be<br />
visually rendered as concept<br />
maps that are linked to<br />
geographic maps (Figure<br />
4). In Figure 4, the application<br />
shown on the bottom<br />
right, ConceptVISTA 2 , is<br />
used to visually represent<br />
graph-based ontologies.<br />
Concepts from these graphbased<br />
ontologies can also<br />
be viewed in the Context<br />
Discovery Application<br />
(Tomaszewski, 2007) via<br />
Google Earth, shown on<br />
the top, which can represent<br />
non-spatial concepts<br />
that have relationships with<br />
geographical entities in a<br />
geographical display.<br />
Geovisual <strong>Analytics</strong> can<br />
also be used to evaluate<br />
how data <strong>and</strong> tools are used<br />
during the analytical process<br />
itself. Tools are now<br />
under development to track<br />
<strong>and</strong> visualize how interactions,<br />
tool arrangements,<br />
<strong>and</strong> data processing events<br />
in an information space<br />
facilitate analytical reasoning,<br />
sense making, <strong>and</strong><br />
hypothesis generation<br />
(Keel, 2006). Analytical<br />
environment states (like<br />
window layouts, visual
Proceedings ISCRAM2007 (B. Van de Walle, P. Burghardt <strong>and</strong> C. Nieuwenhuis, eds.)<br />
symbology, <strong>and</strong> mouse interactions) <strong>and</strong> contextual cues (like annotations <strong>and</strong> screenshots) can be captured, visualized,<br />
recalled <strong>and</strong> transferred so that analyses can be reused. These data can be used for training purposes to show<br />
new analysts how others have successfully (or unsuccessfully) attempted analyses. They can also be stored in an<br />
archive for analysts to revisit in order to inform a current analytical task, or to retrace the steps taken in a prior situation<br />
to underst<strong>and</strong> how a decision or hypothesis originated (Robinson <strong>and</strong> Weaver, 2006) (Figure 5).<br />
As seen in Figure 5, ReVise records interactions <strong>and</strong> allows users to examine these artifacts through an overlay on<br />
the visualization. Mouse clicks are symbolized with green diamonds, <strong>and</strong> mouse drags are symbolized with red dots.<br />
Interactions can be revisited <strong>and</strong> visualized to examine how tools <strong>and</strong> data were used during analysis. Interactions<br />
like key-presses <strong>and</strong> mouse movements are caught <strong>and</strong> reprojected into an interactive overlay that allows users to<br />
visually explore session activity. For example, during a serious snowstorm, emergency managers’ analysis sessions<br />
could be recorded to keep track of which maps were used, which spatial analysis tools were brought to bear, <strong>and</strong><br />
what workflows were common. Supervisors might evaluate these patterns after the fact to evaluate the decisions that<br />
were made, as well as the tools <strong>and</strong> data that were most relevant to the problem.<br />
Figure 5: The ReVise toolkit implements interaction capture <strong>and</strong> visualization to support Geovisual <strong>Analytics</strong>.<br />
FUTURE RESEARCH<br />
Additional research is needed to explore how Geovisual <strong>Analytics</strong> can support crisis management activity. Our research<br />
group is currently designing a small-world simulation-based experiment using the NeoCities platform<br />
(McNeese et al., 2005). NeoCities supports study of coordinated group work with map-based information systems<br />
for crisis management.<br />
CONCLUSION<br />
Geovisual <strong>Analytics</strong> is a new paradigm for how information technologies can be used to process complex geospatial<br />
information to facilitate decision making, problem solving, <strong>and</strong> insight into geographical situations. This paradigm is<br />
well suited for a variety of tasks in the crisis management domain. As we have described, Geovisual <strong>Analytics</strong> can<br />
178
Tomaszewski et al. Geovisual <strong>Analytics</strong> <strong>and</strong> <strong>Crisis</strong> <strong>Management</strong><br />
be used for situation awareness, supporting collaboration, decision making, <strong>and</strong> evaluating the analytical process<br />
itself. Further research in Geovisual <strong>Analytics</strong> will improve the efficacy of information systems designed for crisis<br />
management tasks.<br />
ACKNOWLEDGMENTS<br />
The research reported here has been supported by the National Science Foundation under Grant EIA-0306845. This<br />
work is also supported by the National Visualization <strong>and</strong> <strong>Analytics</strong> Center, a U.S Department of Homel<strong>and</strong> Security<br />
program operated by the Pacific Northwest National Laboratory (PNNL). PNNL is a U.S. Department of Energy<br />
Office of Science laboratory.<br />
REFERENCES<br />
1. Allendoerfer, K., Aluker, S., Panjwani, G., Proctor, J., Sturtz, D., Vukovic, M. <strong>and</strong> Chen, C. (2005) Adapting<br />
the Cognitive Walkthrough Method to Assess the Usability of a Knowledge Domain Visualization, Proceedings,<br />
IEEE Symposium on Information Visualization, Minneapolis, MN.<br />
2. Committee On Homel<strong>and</strong> Security And Governmental Affairs (2006) Hurricane Katrina: A Nation Still Unprepared,<br />
United States Senate, Washington, DC.<br />
3. Gershon, N. <strong>and</strong> Page, W. (2001) What Storytelling Can Do for Information Visualization, Communications Of<br />
The ACM, 44, 8, 31-37.<br />
4. Keel, P. E. (2006) Collaborative Visual <strong>Analytics</strong>: Inferring from the Spatial Organization <strong>and</strong> Collaborative<br />
Use of Information, IEEE Symposium on Visual <strong>Analytics</strong> Science <strong>and</strong> Technology, Baltimore, MD, USA.<br />
5. MacEachren, A. M. (2005) Moving geovisualization toward support for group work., in Exploring Geovisualization<br />
Dykes, J., MacEachren, A. <strong>and</strong> Kraak, M. J. (eds.) Elsevier, 445-461.<br />
6. McNeese, M., Bains, P., Brewer, I., Brown, C., Connors, E., Jefferson Jr, T., Jones, R. <strong>and</strong> Terrell, I. (2005)<br />
The Neocities Simulation: Underst<strong>and</strong>ing The Design And Experimental Methodology Used To Develop A<br />
Team Emergency <strong>Management</strong> Simulation, 49th Human Factors <strong>and</strong> Ergonomics Society Conference, Santa<br />
Monica, CA.<br />
7. Mitra, P. <strong>and</strong> Pan, C. (submitted) Extracting Semantic Networks among Named Entities from Websites, International<br />
Conference of the Association of Computational Linguistics,<br />
8. Proulx, P., T<strong>and</strong>on, S., Bodnar, A., Schroh, D., Harper, R. <strong>and</strong> Wright, W. (2006) Avian Flu Case Study with<br />
nSpace <strong>and</strong> GeoTime, IEEE Symposium on Visual <strong>Analytics</strong> Science <strong>and</strong> Technology, Baltimore, MD, USA.<br />
9. Robinson, A. C. <strong>and</strong> Weaver, C. (2006) Re-Visualization: Interactive Visualization of the Process of Visual<br />
Analysis, Workshop on Visualization, <strong>Analytics</strong> & Spatial Decision Support at the GIScience conference, Münster,<br />
Germany.<br />
10. Stryker, M. S. (2007) The Geovisualization Of Mobile Point Objects: A Task Based Design And Assessment,<br />
Department of Geography, The Pennsylvania State <strong>University</strong>, <strong>University</strong> Park, PA<br />
11. Thomas, J. J. <strong>and</strong> Cook, K. A. (2005) Illuminating the Path: The Research <strong>and</strong> Development Agenda for Visual<br />
<strong>Analytics</strong>, IEEE, Los Alametos, CA.<br />
12. Tomaszewski, B. (2007) Mapping Open-Source Information to Support <strong>Crisis</strong> <strong>Management</strong>, First Annual DHS<br />
<strong>University</strong> Network Summit on Research <strong>and</strong> Education, Washington, D.C.<br />
13. Weaver, C. (2004) Building highly-coordinated visualizations in Improvise, Proceedings of the IEEE Symposium<br />
on Information Visualization, Austin, TX.<br />
14. Weaver, C., Fyfe, D., Robinson, A., Holdsworth, D., Peuquet, D. <strong>and</strong> MacEachren, A. M. (2006) Visual Analysis<br />
of Historic Hotel Visitation Patterns, Proceedings of the IEEE Symposium on Visual <strong>Analytics</strong> Science <strong>and</strong><br />
Technology, Baltimore, MD.<br />
179