Marine Environment Impact Assessment Report dated ... - Tata Power
Marine Environment Impact Assessment Report dated ... - Tata Power
Marine Environment Impact Assessment Report dated ... - Tata Power

You also want an ePaper? Increase the reach of your titles
YUMPU automatically turns print PDFs into web optimized ePapers that Google loves.
NIO/SP-14/2009DISTRIBUTION RESTRICTED<strong>Marine</strong> <strong>Environment</strong>al <strong>Impact</strong> <strong>Assessment</strong> forDischarge Channel of 4000 MW Ultra Mega <strong>Power</strong>Project Near Mundra, Gulf of KachchhSPONSORED BYCoastal Gujarat <strong>Power</strong> Limited, New DelhiFEBRUARY 2009
<strong>Marine</strong> <strong>Environment</strong>al <strong>Impact</strong> <strong>Assessment</strong> forDischarge Channel of 4000 MW Ultra Mega <strong>Power</strong>Project Near Mundra, Gulf of KachchhProject LeaderSoniya SukumaranAssociate Project LeadersV.S.NaiduPrashant SharmaFEBRUARY 2009
CONTENTSProject teamList of tablesList of figuresiiiiv1 INTRODUCTION 11.1 Background 11.2 Objectives 21.3 Scope of work 21.4 Approach strategy 41.5 Studies undertaken 51.5.1 Period of study 51.5.2 Station locations 61.5.3 Sampling frequency 61.5.4 Physical processes 61.5.5 Water quality 71.5.6 Sediment quality 91.5.7 Flora and fauna 102 PROJECT INFORMATION 132.1 Need of the project 132.1.1 <strong>Power</strong> demand scenario 132.1.2 <strong>Power</strong> evacuation 142.1.3 Configuration and selection of unit sizes 142.2 Land availability and site selection 142.3 Features of selected site 152.3.1 Water 152.3.2 Fuel 152.3.3 Topographical and geological aspects 152.4 Plant layout configuration 152.5 Water requirement 162.5.1 Cooling water system 162.5.2 Desalination plant 162.6 Effluent disposal system 182.7 Disposal of dredged material 182.8 External Coal Handling System (ECHS) 192.8.1 Coal Handling at the Port 192.8.2 Conveying from port to plant stockpile 193 GULF OF KACHCHH 203.1 Land environment 203.2 Meteorological conditions 213.3 <strong>Marine</strong> environment 223.3.1 Physical processes 223.3.2 Water quality 233.3.3 Sediment quality 243.3.4 Flora and fauna 254 SITE SPECIFIC MARINE ENVIRONMENT 294.1 Area description 294.2 Physical processes 31
4.2.1 Tides 314.2.2 Currents 324.2.3 Circulation 324.3 Water quality 324.3.1 Temperature 324.3.2 pH 334.3.3 Suspended Solids 344.3.4 Salinity 354.3.5 DO and BOD 354.3.6 Nitrogen and phosphorous compounds 364.3.7 Phenols and PHc 374.4 Sediment quality 384.4.1 Texture 384.4.2 Heavy metals 384.4.3 Organic carbon and phosphorus 394.4.4 Phosphorus 404.4.5 Petroleum hydrocarbon 404.5 Flora and fauna 414.5.1 Seaweeds, seagrasses and mangrove ecosystem 424.5.2 Phytoplankton 444.5.3 Zooplankton 464.5.4 Macrobenthos 504.5.5 Fishery 524.5.6 Corals and associated biota 554.5.7 Birds 554.5.8 Reptiles 554.5.9 Mammals 565 EFFLUENT RELEASE 575.1 Modeling of temperature 576 POTENTIAL MARINE ENVIRONMENTAL IMPACTS 596.1 Construction phase of the effluent channel 596.1.1 Hydrodynamics characteristics 596.1.2 Water quality 596.1.3 Sediment quality 616.1.4 Flora and fauna 616.1.5 Miscellaneous 636.2 Operational phase of the effluent channel 646.2.1 Release of biocides 646.2.2 Water quality 656.2.3 Sediment quality 656.2.4 Flora and fauna 656.3 Dumping of dredged materials 666.4 Construction phase of the coal conveyer belt 676.4.1 <strong>Impact</strong> of air quality 676.4.2 Noise impact 676.4.3 Water quality 686.4.4 Land impact 686.5 Operational phase of the coal conveyer belt 69
7 MITIGATION MEASURES AND ENVIRONMENT MANAGEMENT PLAN 707.1 Construction phase of the effluent channel 707.2 Operational phase of the effluent channel 717.3 Construction phase of coal belt conveyer 727.4 Operational phase of the coal belt conveyer 737.4.1 Dust Suppression (DS) system 737.4.2 Coal Yard Drainage 747.5 <strong>Environment</strong>al Management Plan (EMP) 747.5.1 <strong>Environment</strong>al Management Cell 757.5.2 <strong>Environment</strong>al Monitoring Programme 757.5.3 Afforestation program 778 SUMMARY AND CONCLUSION 788.1 Project information 788.2 Gulf of Kachchh 798.3 Site specific marine environment 818.4 Effluent release 838.5 Potential marine environmental impacts 848.6 Mitigation measures and EMP 88
PROJECT TEAMSoniya SukumaranV.S.NaiduPrashant SharmaR.V.SarmaS.N.GajbhiyeA.N.KadamJiyalal Ram M.JaiswarAnirudh RamA.V.MandaliaM.A.RokadeRajvardhan KapshikarG.K.ChauhanD.S.BagdeB.G.PatelMohammed IlyasJairam G. OzaAjit AmbekarDeepak SinghRahul Kumar TailorRajashree SanadiS.SugandhiArchana MohiteSnehal ZopeSiddhesh KarangutkarUjwala D.PatilReshma JadhavSugandha ChavanJeju JPrakash SRupali NaikSunil KambleShashikant BhartiSnehal S.RawoolDhiraj KoliSnehal PatilMinaxi Patili
LIST OF TABLES3.2.1 Details of cyclonic storms along North Gujarat coast (1893-1999).3.3.1 Water quality of the Gulf during premonsoon (1993-2004).3.3.2 Water quality of the Gulf during postmonsoon (1993-2004)3.3.3 Subtidal sediment quality of the Gulf during premonsoon (1994-2005)3.3.4 Subtidal sediment quality of the Gulf during postmonsoon (1993-2004)3.3.5 List of algae recorded along the intertidal zone of the Gulf.3.3.6 Biological characteristics of the Gulf during premonsoon (1981-2005).3.3.7 Biological characteristics of the Gulf during postmonsoon (1984-2004).3.3.8 Mangrove areas and status of occurrence of major species of Gujarat.3.3.9 Distribution of corals in the Gulf3.3.10 List of water birds in the Gulf.4.3.1 Water quality at station 1 off Vandh during December 2008.4.3.2 Water quality at station 2 off Vandh during December 2008.4.3.3 Water quality at station 3 off Vandh during December 2008.4.3.4 Water quality at station 4 off Vandh during December 2008.4.3.5 Water quality at station 5 off Vandh during December 2008.4.3.6 Water quality at station 6 off Vandh during December 2008.4.4.1 Sediment quality off Vandh during December 2008.4.5.1 (a) Mangrove areas and status of occurrence of major species of Gujarat (b)Composition and ecological status of mangroves and obligatehalophytes off Mundra.4.5.2 Range and average (parenthesis) at different stations off Vandh duringDecember 2008.4.5.3 Range and average (parenthesis) of phytoplankton population at differentstations off Vandh during December 2008.4.5.4 Distribution of phytoplankton population at different stations off Vandh duringDecember 2008.ii
4.5.5 Range and average (parenthesis) of zooplankton production off Vandh duringDecember 2008.4.5.6 Distribution of zooplankton off Vandh during December 2008.4.5.7 Total counts, average (parenthesis) of decapod larvae, fish eggs and fishlarvae off Vandh during December 2008.4.5.8 Range and average (parenthesis) of intertidal macrobenthos at different waterlevel off Vandh during December 2008.4.5.9 Composition (%) of intertidal macrobenthic fauna in coastal water off Vandhduring December 2008.4.5.10 Range and average (parenthesis) of subtidal macrobenthic fauna off Vandhduring December 2008.4.5.11 Composition (%) of subtidal macrobenthos in coastal water off Vandh duringDecember 2008.4.5.12 <strong>Marine</strong> fish landings (t x 10 3 /y) of Gujarat State and districts adjoining theGulf.4.5.13 Composition of marine fish landings (t/y) of Kachchh District during 1997-98,1998-99, 2000-01, 2002-03, 2004-05 and 2005-06.4.5.14 Monthwise composition of marine fish landings (t) of Kachchh District during2002-03.4.5.15 <strong>Marine</strong> fish landings (t x 10 3 /y) of Kachchh District and its comparison with thelanding at Mundra.4.5.16 Composition of marine fish landings (t/y) at Mundra during 1994-2006.4.5.17 Monthwise marine fish landings (t) around Mundra during 2005-06.4.5.18 Composition of marine fish landings (t) around Mundra during 2005-06.4.5.19 Districtwise fishing villages, fishermen, boats and fishing gears (2003) ofKachchh District.4.5.20 Village wise fishermen, boats and fishing gears around Mundra.4.5.21 Species composition of fish catch off Tunda-Vamdh during April/May 20074.5.22 Species composition of fish catch off Tunda-Vandh during October/November2007.4.5.23 Check list of birds recorded in the study area (Mundra).iii
LIST OF FIGURES1.4.1 Gulf and the surrounding region.1.4.2 Sampling locations2.0.1 Satellite imagery of the Gulf segment off Mundra/Vandh.2.2.1 Photograph showing the proposed site for effluent channel (High water mark).2.2.2 Photograph showing the proposed site for effluent channel (Low water mark).2.4.1 Layout of the proposed development.4.2.1 Tide collected at Kotdi Creek during 4 to 12 January 2006.4.2.2 Observed tide at Kotdi Creek 1 to 30 April 2006.4.2.3 Current speed and components at station 2 during January 2006.4.2.4 Current speed and components at station 2 during April 2006.4.2.5 Current speed and direction at station 2 during December 2008.4.2.6 Drogue trajectory at station 2 (Ebb-Flood-Ebb) during January 2006.4.2.7 Drogue trajectory at station 2 (Flood-Ebb-Flood) during January 2006.4.2.8 Drogue trajectory at station 2 (Flood-Ebb) during December 2008.4.2.9 Drogue trajectory at station 2 (Ebb-Flood) during December 2008.4.3.1 Water quality (—•— S) and (—○— B) at station 2 during December 2008.4.5.1 Temporal variation of phytopigments at station 2 during December 2008.4.5.2 Temporal variation of zooplankton at station 2 during December 2008.6.1.1 Comparison of simulation and observed currents at Station 2 (Spring).6.1.2 Comparison of simulation and observed currents at Station 2 (Neap).6.1.3 Modeled temperature distribution during peak flood tide (Spring).6.1.4 Modeled temperature distribution during peak ebb tide (Neap).6.1.5 Modeled temperature distribution during peak lowest low water tide (Spring).6.1.6 Time series of temperature variations in intake channel.iv
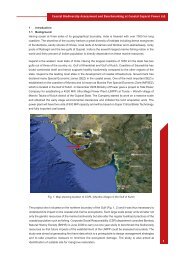
1 INTRODUCTION1.1 BackgroundGovernment of India is embarking on infrastructure developmentthrough private participation. Ministry of <strong>Power</strong>, Govt. of India along withCentral Electricity Authority, <strong>Power</strong> Finance Corporation Ltd. (a Govt. of IndiaUndertaking) has taken initiative for development of a number of coastalbased and pit-head coal-based Ultra Mega <strong>Power</strong> Plants (UMPP) of about4000 MW capacity each in the various locations in the country. CoastalGujarat <strong>Power</strong> Limited (CGPL) a wholly owned subsidiary of the <strong>Tata</strong> <strong>Power</strong>Company Limited, a body in the field of financing the power projects isdeveloping a 4000 MW thermal power project at Mundra, Kachchh District, inGujarat. M/s TCE Consulting Engineers Ltd., the technical consultants toCGPL, has earlier examined the feasibility of setting up a 4000 MW thermalpower station at Mundra by preparing a Detailed Project <strong>Report</strong> (DPR) duringJuly 2007.The CGPL had obtained CRZ clearance for intake and outfallchannels for their 4000 MW thermal power plant. It now proposes to drawwater to the tune of 6.3 x 10 5 m 3 /h for cooling purposes from the commonintake channel constructed by M/s. Adani <strong>Power</strong> Limited (APL) as suggestedby the NIO. As a result, due to engineering reasons CGPL requires to changethe discharge location. M/s CGPL has approached the National Institute ofOceanography (NIO) to obtain baseline data covering the new dischargelocation and to predict the marine environmental impacts based on themodeling reports by H.R. Wallingford that will be made available to NIO.NIO has recently conducted studies for a similar but smaller powerplant proposed by the APL in the same location and the oceanographic datacollected during that study as well as data available for the Gulf of Kachchhcollected over the last several years is adequate to conduct marineenvironment related studies like identification of discharge point for release ofwastewater and assessment of impact of proposed development on theadjoining marine ecology. Also field investigations were conducted duringDecember 2008, based on which this marine EIA report is prepared.
1.2 Objectivesa) To evaluate the prevailing hydrodynamics and ecological status of thecoastal waters adjacent to the project site.b) To assess the impact of effluent release and other project operationson marine ecology.c) To assess the impact of coal conveyer system on marine ecology.d) To recommend suitable marine environmental management plan tominimize any adverse impact on marine area due to the proposeddevelopments.1.3 Scope of workThe site of release of effluents meeting the norms of the GujaratPollution Control Board should be so identified that the contaminants areeffectively dispersed within a reasonable distance from the release site andthe effluent release system does not interfere with the operations of thenearby Mundra Port and intake facility.In well-planned coastal developments, the probable adverse impactsare identified in advance so that the mitigation measures can be integratedwithin the design itself. Reliable prediction of impacts on marine ecologyrequires detailed information on water quality, sediment quality and biologicalcharacteristics of the area likely to be impacted and their tidal and seasonalvariations. Ideally, the field data collection is required to be made in 3 seasonsviz. postmonsoon, monsoon and premonsoon, since the coastal environmentcan change significantly from season to season. However, due to thedynamics of the Gulf it is not possible to undertake field investigations duringmonsoon. Moreover, due to high turbulence and wave action during monsoon,the contaminants entering the sea are dispersed at a much faster rate thanduring fair seasons. Hence, monsoon observations are not critical whileconducting marine EIAs. The general area of the CGPL falls within the areainvestigated for APL power project for which data was recently acquired tostudy the EIA of common intake channel. It is therefore proposed to conduct2
field investigations during the postmonsoon season to undertake EIA studiesfor the discharge channel.NIO has conducted several studies in the coastal waters of Mundra inthe past several years. The studies have generated an extensive database forthe region, which can be usefully utilized to establish the baseline for thepresent studies. Based on the information available with NIO and the projectinformation made available by CGPL, the following scope of work wasfinalized.(a) Physical processesTides will be assessed with available data in the area. The currents willbe measured at the proposed release location for around one week. Droguestudies will be conducted to estimate the excursion length of the plume.Plume dilutions will be estimated using the model output generated by theH.R. Wallingford, UK.(b) Water qualityWater quality would be assessed at several locations to evolve ageneral background for the coastal sea off the project site. The samplescollected at the surface and bottom (wherever the depth exceeds 3 m) will beanalyzed for salinity, suspended solids (SS), pH, Dissolved Oxygen (DO),Biochemical Oxygen Demand (BOD), phosphate, nitrate, nitrite, ammonia,Petroleum Hydrocarbons (PHc) and phenols. One critical location will besampled temporally to assess tidal variability of selected water qualityparameters.(c) Sediment qualityIntertidal and subtidal sediments off the project site would be studiedfor texture, selected metals (chromium, iron, cobalt, nickel, copper, zinc, lead,cadmium and mercury), organic carbon (C org ), phosphorus and PHc.3
(d) Biological characteristicsThe status of flora and fauna off the project area would be establishedbased on phytoplankton pigments, population and generic diversity;zooplankton biomass, population and group diversity, macrobenthic biomass,population and group diversity, fisheries, mangroves and intertidal corals.(e) <strong>Assessment</strong>The data would be analysed to meet the objectives as stated above.Based on the environmental results and the probable perturbations due to theproposed project, the impact of various activities on marine ecology will beassessed during construction as well as operational phases of the project.Suitable mitigation measures in terms of marine environmental managementplan will be suggested to minimize the adverse impact identified.1.4 Approach strategySeverity of negative impacts of developments in the coastal zone onassociated marine ecology varies widely depending on many factors such asthe extent, period and type of disturbance, anthropogenic perturbations,capacity of the receiving water to assimilate contaminants and extent of itsecological sensitivity. Hence, the primary requirements for assessing suchimpacts are general baseline information for the Gulf as a whole and intensivesite-specific data for the Tunda-Vandh area. NIO has been conductinggeneral and site specific studies in the Gulf (Figure 1.4.1) since 1990 withmore frequent investigations in recent years due to several proposed andongoing developments bordering the Gulf, particularly along the southerncoast. Thus, the site specific studies as detailed below conducted from time totime has resulted in a fairly extensive database for the Gulf.Area PeriodMithapur 1990-2004Vadinar 1994-95, 1997, 1999, 2000, 2003, 2004,2005,2006Sikka 1993-94, 1997, 1999, 2002, 2004,2005,2007,Bedi 1997, 2002-03Navlakhi 1994, 2002Kandla 1996-98, 2004Luni 1997Mundra 1998-99, 2000, 2002, 2003, 2005,2006,20074
These sets of data were found adequate to describe the generalenvironmental setting of the Gulf and intensive field data acquisition offTunda-Vandh was considered sufficient to meet the objectives.The published scientific literature and available technical reportsindicated that apart from the studies conducted by NIO during 1998-2007detailed information related to the ecology off Mundra was rather scanty. Thisinformation was assessed to plan field data acquisition for the present study.Accordingly, subtidal stations covering an area of 100 km 2 off Tunda-Vandhwere considered for sampling. Intertidal area that would be used for effluentrelease channel was also considered for the study and the samples atselected intertidal transects were investigated. The sampling locations areillustrated in Figure 1.4.2.1.5 Studies undertakenSubtidal sampling stations were selected based on the location of theproposed development including probable capital dredging for effluentdisposal point. Bathymetry for the area is given in the Chart No. 2055 of theNaval Hydrographic Office (NHO) and local close grid mapping supplied byTCE. The locations of previous investigations were also considered to obtaincomparative information for offshore and onshore areas likely to be impactedby the proposed project as well as to create general ecological database forthe wider region. Intertidal macrobenthos and sediment quality particularly inthe areas likely to be disturbed due to dredging were studied at two transectsbetween the High Tide Line (HTL) and the Low Tide Line (LTL). These arealso shown in Figure 1.4.2.1.5.1 Period of studyThe field investigations as given below were planned in such a mannerso as to get a detailed picture of the aquatic environmental characteristicsduring December 2008 (postmonsoon).5
1.5.2 Station locationsA total of 6 stations selected for marine environmental investigationsare listed below and shown in Figure 1.4.2. Intertidal sediment was sampledalong each transect in the area between the Low Water Line (LWL) and theHigh Water Line (HWL).Station/TransectPositionLatitude (N) Longitude (E)1 22 o 46.285’ 69 o 25.804’2 22 o 46.239’ 69 o 28.756’3 22 o 46.258’ 69 o 31.658’4 22 o 43.532’ 69 o 25.819’5 22 o 43.532’ 69 o 28.731’6 22 o 43.532’ 69 o 31.657’T1 22 o 47.235’ 69 o 29.770’T2 22 o 48.291’ 69 o 24.467’1.5.3 Sampling frequencyWater quality and biological characteristics were assessed at station 2over a period of 12 h with 1 h sampling frequency for water quality and 2 h forbiological characteristics. Other stations were spot sampled in duplicate at aninterval of 30 min. Subtidal and intertidal sediments were collected once ateach station/transect wherever possible.1.5.4 Physical processesa) TideAvailable information on tides for Mundra and surrounding region wasassessed.b) CurrentsCurrents were measured by deploying an Aanderaa (RCM 9) currentmeter at station 2 for about 6 d.c) CirculationCirculation was estimated by deploying a neutrally buoyant biplanedrogue at prefixed location ( Station 2) and tracking it over the desired time.The position of the drogue was periodically fixed with a GPS (Garmin6
handheld GPS 12). These positions were then plotted to obtain thetrajectories.1.5.5 Water qualitya) Sampling procedureSurface water samples for general analyses were collected using aclean polyethylene bucket while an adequately weighted Niskin sampler witha closing mechanism at a desired depth was used for obtaining subsurfacewater samples. Sampling at the surface and bottom (I m above the bed) wasdone when the station depth exceeded 3 m. A glass bottle sampler (2.5 I) wasused for obtaining samples at a depth of 1 m below the surface, for theestimation of PHc.b) Methods of analysesMajority of the water quality parameters was analysed within 24 h ofcollection in the temporary shore laboratory established at Mundra.Colorimetric measurements were made on a Schimadzu (Model 1201)spectrophotometer. RF-5301 Schimadzu Spectrofluorometer was used forestimating PHc. The analytical methods of estimations were as follows:i) Temperature:Temperature was recorded using a mercury thermometer with anaccuracy of 0.1 o C.ii) pH:pH was measured on a microprocessor controlled pH analyser. Theinstrument was calibrated with standard buffers just before use.iii) SS:A known volume of water was filtered through a pre-weighed 0.45 µmMillipore membrane filter paper, dried and weighed again.7
at 30 o C under low pressure. Fluorescence of the extract was measured at360 nm (excitation at 310 nm) with Saudi Arabian crude residue as astandard. The residue was obtained by evaporating lighter fractions of thecrude oil at 100 o C.xi) Phenols:Phenols in water (500 ml) were converted to an orange colouredantipyrine complex by adding 4-aminoantipyrine. The complex was extractedin chloroform (25 ml) and the absorbance was measured at 460 nm usingphenol as a standard.1.5.6 Sediment qualitySurficial sediment for the determination of texture, heavy metals, C org ,phosphorus and PHc was collected at all water quality stations as well asintertidal transects.a) Sampling procedure:Subtidal sediment was obtained by a van Veen grab of 0.04 m 2 area.The samples after retrieval were transferred to polyethylene bags andpreserved for further analyses. Intertidal sediment was sampled usingquadrants.b) Methods of analyses:i) Texture: The sediment was dried at 60 o C and analysed for particle sizefollowing the procedure of Buchanan.ii) Metals: Sediment was brought into solution by treatment with conc HF-HClO 4 -HNO 3 -HCl and the metals were estimated on a Perkin Elmer (Analyst300/600) Atomic Absorption Spectrophotometer (AAS) by flame/graphitefurnace. Mercury was estimated by flameless AAS technique after digestingthe sediment with aquaregia.9
iii) C org :Percentage of C org in the dry sediment was determined by oxidisingorganic matter in the sample by chromic acid and estimating excess chromicacid by titrating against ferrous ammonium sulphate with ferroin as anindicator.iv) Phosphorus:Digested sample [Section b (ii) was used for estimating phosphorus inthe sediment. The method used was similar to that described under Section(V).v) PHc:Sediment after refluxing with KOH-methanol mixture was extractedwith hexane. After removal of excess hexane, the residue was subjected toclean-up procedure by silica gel column chromatography. The hydrocarboncontent was then estimated by measuring the fluorescence as describedunder Section (IX).1.5.7 Flora and faunaa) Sampling procedure:Polyethylene bucket and Niskin sampler respectively, were used forsampling surface and bottom waters for the estimation of phytoplanktonpigments and population. Sample for phytoplankton cell count was fixed inLugol’s iodine and a few drops of 3% buffered formaldehyde.Zooplankton were collected by oblique hauls using a Heron Tranter net(Mesh size 0.33 mm, mouth area 0.25 m 2 ) with an attached calibrated digitalflow meter (General Oceanic). All collections were of 5 min duration. Sampleswere preserved in 5% buffered formaldehyde.Sediment samples for subtidal macrobenthos were collected using avan-Veen grab of 0.04 m 2 area. Intertidal collections between the HTL and theLTL were done with quadrants . Samples were preserved in 5% bufferedformaldehyde - Rose Bengal.10
) Methods of analyses:i) Phytoplankton pigments:A known volume of water was filtered through a 0.45 µm Milliporemembrane filter paper and the SS retained on the filter paper were extractedin 90% acetone and refrigerated overnight in dark. For the estimation ofchlorophyll a and phaeophytin, the extinction of the acetone extract wasmeasured at 665 and 750 nm before and after treatment with dilute acid usinga fluorometer (Turner design, Trilogy).ii) Phytoplankton population:The cells in the sample preserved with Lugol’s solution were allowed tosettle and transferred into a Sedgwick Rafter slide. Enumeration andidentification of phytoplankton were done under a microscope.iii) Algae, seaweeds and mangrove ecosystem:Algal, seaweed and mangrove flora were assessed from the upper to thelower intertidal region along predecided transects.iv) Zooplankton:Volume (biomass) was obtained by displacement method. A portion ofthe sample (25-50%) was analysed under a microscope for faunalcomposition and population count.v) Fish eggs, fish larvae and decapod larvae:These groups were sorted out from zooplankton samples and counted.vi) Macrobenthos:Sediment was sieved through a 0.5 mm mesh sieve and animalsretained were preserved in 5% buffered Rose Bengal formaldehyde. Totalpopulation was estimated as number of animals in 1 m 2 area and biomasswas determined on wet weight basis (g/m 2 ).11
vii) Fishery:Fish landing data were obtained from the Department of Fisheries,Government of Gujarat (Jamnagar and Kachchh Districts) for assessingfishery potential.viii) Corals:The project domain area was carefully surveyed for corals on theintertidal segment during spring low tide.12
2 PROJECT INFORMATIONThe proposed project will be located at Tunda-Vandh villages inMundra Taluka, Kachchh district of Gujarat coastal area. The site is located inthe close vicinity of Mundra Port and Special Economic Zone (MPSEZ), whichis located 25 km west of Mundra Port and 1.5 km from the coast of Gulf ofKachchh. Tunda is accessible by road on NH-8A highway extension betweenGandhidham and Mandavi towns and state highway SH-6 near Kandagra.The satellite imagery of the region is given in Figure 2.0.1. An approach roadto the project site from the highway is under construction which will bypasstwo villages. The site is adjoining the first phase development of MPSEZ andadequate land for the project is totally acquired by CGPL. The proposedproject consists of five power plant units totaling to 4000 MW gross capacity,utilising imported coal as fuel.2.1 Need of the projectThe demand for power is increasing steadily and the power shortage isfelt everywhere. Mega power projects are the need of the day. With the <strong>Power</strong>grid in place it is possible to produce power at any location and feed it to thenational grid. But the availability of fuel and water, the basic raw materials forpower plant, are the important considerations. The site selected has both theattributes as coal can be imported through the nearest Mundra port andseawater can be used for cooling purposes. The area is under-developed andnon-agricultural land availability is obvious.2.1.1 <strong>Power</strong> demand scenarioThough the demand for power in the nearby areas is relatively smaller,demand on national scale exists for the power. The beneficiaries from theproposed project include Gujarat, Maharashtra, Punjab, Haryana andRajasthan. The existing power for evacuation and transmission network willbe strengthened to enable the transfer of the power to these identifiedbeneficiaries.13
2.1.2 <strong>Power</strong> evacuationThe feasibility study conducted by <strong>Power</strong> Grid Corporation of India Ltd.(PGCIL) revealed that the existing/planned inter state transmission network,which would be available by the year 2010 –11 may not be adequate forevacuation of 3500-3800 MW from the proposed power plant. Efforts aregoing on to strengthen the power evacuation and transmission network forfeeding power to the various beneficiary states.2.1.3 Configuration and selection of unit sizesThe selection of the configuration of the power plant/ unit size was leftto the bidders with the requirement to adopt supercritical technology forboilers. The successful bidder, M/s. <strong>Tata</strong> <strong>Power</strong> Company Ltd., has offered toinstall 5X800 MW units to be commissioned in about 48 months period fromeffective date.2.2 Land availability and site selectionThe region around the proposed project sites is scarcely populatedexcept in some clusters and a major part of the terrain is non-cultivated land.The site at Tunda is considered suitable for the project based on theadvantages that are enumerated herein below.Tunda site is accessible by road NH-8A extension betweenGandhidham and Mandvi towns. The nearest airlink is Bhuj Airport at adistance of about 60 kms from the project site. The site is adjoining thepresent phase of development of Mundra SEZ and adequate land for theproject is already acquired by CGPL. Mundra Port is constructing a coal jettynear to the project area to handle imported coal to the tune of 12-14 milliontones/ annum.The proposed site for discharge channel is represented by a span ofsandy beach with intermittent presence of seaweed in the high tide level(Figures 2.2.1 and 2.2.2). Also seawater could be drawn through an openchannel that will be more economical than an offshore pumping system andpipeline, considering the volume of water required.14
2.3 Features of selected site2.3.1 WaterThe source of cooling water will be from the sea. The cooling waterrequirement will be met from the seawater from the common intake channelshared with APL as recommended by NIO.2.3.2 FuelCoal from international market could be procured from countries likeIndonesia, South Africa, Australia, China and other possible sources.Imported coal received at Mundra coal jetty shall be transported to the projectsite by conveyer belt.2.3.3 Topographical and geological aspectsThe area however is not prone to inundation. Pile foundation will berequired for major equipment and structure foundations. The depth of pilesand the related aspects will be decided appropriately based on soilinvestigations.2.4 Plant layout configurationIn laying out the various facilities (Figure 2.4.1), consideration has beengiven to the following general principles.• <strong>Power</strong> evacuation corridor for connection to grid.• Raw water facilities• Imported coal handling facilities at Mundra coal jetty• Approach road to the power plant from the highway, rail link toAdipur and airport facility at Bhuj 60 kms away.• All facilities of the 4000 MW are laid out in close proximity toeach other to the extent practicable so as to accommodate allfacilities efficiently within the plant boundary.• The layout also facilitates communication of men and materialsbetween the various facilities both during initial construction andalso during subsequent operation and maintenance.15
• Availability of adequate space for fabrication / constructionequipment beyond the power plant boundary which can behired temporarily for the purpose.• Site located in plain and barren area with minimal cultivation andhabitation.• Minimal eco-sensitive spots in vicinity of project site• R&R issues not involved in absence of requirement fordisplacement of any villages/ houses2.5 Water requirementThe main requirement of water will be for power cycle condensercooling and for desalination plant. The cooling water requirement will be metfrom the seawater from the common intake channel shared with APL asrecommended by NIO. The seawater requirement will be about 6.3 x 10 5 m 3 /hof which about 6.27 x 10 5 m 3 /h will be for condenser cooling and 2796 m 3 /hwill be used for producing fresh water. Fresh water for the plant, potablewater, service water and feed water to the DM plant and other services will bemet by the desalination plant.2.5.1 Cooling water systemA once through cooling system with seawater is preferred for the plant.The circulating system would be so designed to attain discharge temperatureof +7 o C above ambient seawater temperature. The end weir will be located at22°47’24.65’’ N, 69° 30’1.26’’ E. The end of the outer discharge channel willbe situated at 22° 46’ 14.31’’N, 69° 28’45.396’’ E.2.5.2 Desalination plantIn absence of any reliable source of fresh water, desalination ofabundantly available seawater is the only feasible solution to cater to the freshwater demand. A total of 25 mld desalination capacity is being planned for thepower plant. Reverse Osmosis (RO) has been chosen as the technology fordesalination.16
The desalination plant will consist of the following systems:1. Intake pumping system for RO plant from intake channel;2. Clarification plant with sludge disposal systems;3. Chlorination for disinfection;4. Two-stage filtration consisting of pressure sand filters and dualmedia filters;5. I-pass RO plant to meet service water requirement and DM plantfeed requirement;6. I-pass RO treated water storage tank;7. II-pass RO to get DM water for SG Cycle;8. Chemicals storage, handling, preparation and dosing;9. Chemical laboratory;10. Instrumentation and control and;11. Reject disposal along with filter backwash and sludge.Seawater (approx. 3,000 m 3 /hr) for the 25 mld module of thedesalination plant will be drawn from intake channel. The PT (pre-treatment)plant will consist of 2 x 50% capacity lamella clarifiers to remove the heaviersuspended and settleable solids. The chemical treatment facility will beequipped with real-time flow-rate adjustment and adequate redundantcapacity. Chlorination will be done at inlet i.e. stilling chamber and then flowsinto flash mixers for coagulation and flocculation chambers. The sludge will beremoved and discharged into sludge sump.The clarified water will be then stored in a clarified water storage tankand this clarified water will be pumped through 5 x 50% capacity filter feedpumps. Two stage filtration is envisaged to achieve the required SDI (SiltDensity Index) for the RO plant. The first stage filtration is through dual mediafilters and second stage filtration will be done in horizontal pressure filters toremove suspended solids.The backwash requirement for these filters will be met from I-pass ROreject. The filter backwash and sludge from clarifiers will be mixed in the17
sludge sump and disposed to CW outfall channel. After the double stagefiltration, finer particles will be removed by micron cartridge filters. RO systemuses a semi-permeable composite polyamide membrane to separate andremove dissolved solids, organics, pyrogens, sub-micron colloidal matter,viruses and bacteria from water to the extent of 98 to 99.5%. I-pass RO plantwill have a permeate recovery of 40%. Suitable energy recovery devices willbe installed for I-pass RO high pressure pumps to achieve power saving.The desalinated water will be processed further through remineralizationand chlorination before it is used for potable water purposes. I-pass RO permeate will be stored in a permeate water storage tank of 20,000m3 capacity and will cater to the plant service water requirement. Part of the I-pass RO permeate will be fed to II-pass RO which will feed DM plant toproduce DM water for SG feed cycle make-up.The desalination plants will be fully automated plant with multiple PLC’sand SCADA control systems.2.6 Effluent disposal systemDesalination plant reject will be partly utilized for pretreatment plantbackwash and the balance will be led into the discharge channel. Thedesalination plant reject water (1727 m 3 /h) with high TDS will get diluted in theCW discharge channel. Pre-treatment plant filter backwash and clarifiersludge will be collected and disposed off to the discharge channel. The powerplant being once through cooling type, the seawater is led back to the sea atthe rate of about 6.28 x 10 5 m 3 /h. The discharge channel is designed to coolthe water over a length of about 1950 m and has a capacity of 6.30 x 10 5m 3 /h .2.7 Disposal of dredged materialThe quantity of material excavated in making the outfall channel wouldbe of the order of 2.0 million m 3 . This quantity will be disposed off as per theplan suggested by Mundra Port. No siltation is expected in the outerdischarge channel.18
2.8 External Coal Handling System (ECHS)The External Coal Handling system (ECHS) proposed for the UMPPconsists of coal receipt and stock pile system at the port jetty, reclaiming andconveying from the port jetty stockpile to the power plant. A brief descriptionof the coal handling system proposed is furnished below.2.8.1 Coal handling at the portCoal will be received at the terminal point from MPSEZL. MPSEZLshall unload the coal from the ship using grab unloaders and conveyers toCGPL’s conveying system, which in turn would convey this coal directly to thepower plant or to their port stock pile as per requirement. The stacker cumreclaimer machine mounted on the trunk conveyer shall be used to stock thecoal at the port. Rated conveying capacity from grab unloading station to portstockpile shall be 6000 TPH. The peak capacity of stacker cum reclaimer shallbe 6000 TPH while stacking and 4000 TPH while reclaiming.2.8.2 Conveying from port to plant stockpileOne stream of belt conveyer of 4000 TPH rated capacity shall beprovided to convey the coal directly to plant stockpile. Same stream would beused to convey coal reclaimed from port stock pile.19
3 GULF OF KACHCHHThe Tunda-Vandh and surrounding region forms an integral part of theGulf. Hence, the knowledge of general ecology of the Gulf is necessary forcomparing the site-specific environmental conditions with that of the parentbody.The Gulf (Figure 1.4.1), which occupies an area of 7300 km 2 , hasmaximum depth that varies from 20 m at the head (Kandla - Navlakhi) to 60 min the outer regions. The actual fairway however is obstructed due to thepresence of several shoals, needing periodic dredging in some areas, tofacilitate navigation to the Kandla Port. The tidal scour that follows the axis ofthe Gulf has steep slopes and rugged surfaces. A number of scraps withrelative elevation of 6 to 32 m occur on the sediment-free bed of the centralGulf.3.1 Land environmentThe coastal configuration of the Gulf is very irregular with numerousislands, creeks and bays. The coastal area of the Gulf (within 20 km from theshoreline) falls under the Kachchh (6749.77 km 2 ), Jamnagar (4863.53 km 2 )and Rajkot (576.71 km 2 ) Districts. Cotton is the dominant crop in the KachchhDistrict while it is oil seeds in the Jamnagar and Rajkot Districts. Bajra,pulses, wheat, sugarcane etc are the other common crops in the region. Thegeneral vegetation in the area is sparse and scattered and of tropical drymixed deciduous scrub and desert thorn type belonging to the xerophyticgroup.Due to extreme unreliability of rainfall in the region, ground water is amore reliable source of water for domestic as well as agricultural needs.However, uncontrolled and indiscriminate withdrawal of ground water hasresulted in a sharp decline in water table in the coastal belt causing ingress ofsalinity. The conditions are of considerable concern in Jodia and OkhamandalTalukas of the Jamnagar District and severe in Lakhpat and Anjar Talukas ofthe Kachchh District.20
The coastal region of the Gulf is industrially less developed and themajority of large-scale industries including the RIL refinery is located in theJamnagar District. Kachchh District is industrially backward and except forlignite mining, thermal power plant, fertilizer plant and Mundra and KandlaPorts, there are no major industries in the district. Okha and Bedi are the twoimportant intermediate ports in the Jamnagar District.3.2 Meteorological conditionsThe Gulf is a semi-arid region with weak and erratic rainfall confinedlargely to the June-October period. With a few rainfall days, the climate is hotand humid from April till October and pleasant during brief winter fromDecember to February. Rainfall alone forms the ultimate source of freshwaterresource to the region. The average rainfall at Mundra is 414 mm/y on thenorthern coast and 490 mm/y at Mithapur on the southern coast.The wind records at Okha indicate that (a) the speed varies between 0and 30 km/h during November-February; the predominant direction being NW- NE, (b) the speed marginally increases during March-April with the changein direction to NW-SW, (c) maximum speeds (40-50 km/h) occur during Maywith predominant SW-W direction and (d) maximum speeds can reach upto70 km/h with predominant SW-W direction during depressions in June -September.Cyclonic disturbances strike North-Gujarat, particularly the Kachchhand Saurashtra regions, periodically. These disturbances generally originateover the Arabian Sea and sometimes the Bay of Bengal. The details ofnumber of cyclonic storms, which struck the north Gujarat region during thelast 100 y, are given in Table 3.2.1. Generally during June, the storms areconfined to the area north of 15 o N and east of 65 o E. In August, in the initialstages, they move along the northwest course and show a large latitudinalscatter. West of 80 o E, the tracks tend to curve towards north. During Octoberthe direction of movement of a storm is to the west in the Arabian Sea.However, east of 70 o E some of the storms moves north-northwest and laterrecurve northeast to strike Gujarat-north Mekran coast.21
The relative humidity is generally high during June-September(60-85 %) and marginally decreases during rest of the year (30-80 %). Thesky is generally clear or lightly clouded except during monsoon period.Visibility is good throughout the year. However, average visibility of less than1 km can be expected for a few days during the winter months.3.3 <strong>Marine</strong> environmentWithin the Gulf, though water depths of 25 m exist in the broad centralportion upto the longitude 70 o E, the actual fairway in the outer Gulf isobstructed by the presence of several shoals. The high tidal influx covers thelow lying areas of about 1500 km 2 comprising a network of creeks and alluvialmarshy tidal flats in the interior region. The creek system consists of 3 maincreeks Nakti, Kandla and Hansthal, and the Little Gulf of Kachchhinterconnecting through many other big and small creeks. All along the coast,very few rivers drain into the Gulf and they carry only a small quantity offreshwater, except during the brief monsoon. They are broad-valleyed andtheir riverbed is mostly composed of coarse sand and gravel. The Gulf ischaracterised by numerous hydrographic irregularities like pinnacles, as muchas 10 m high. The southern shore has numerous islands and inlets coveredwith mangroves and surrounded by coral reefs. The northern shore ispredominantly sandy or muddy confronted by numerous shoals.3.3.1 Physical processesTides in the Gulf are of mixed, predominantly semidiurnal type with alarge diurnal inequality. The tidal front enters the Gulf from the west and dueto shallow inner regions and narrowing cross-section, the tidal amplitudeincreases considerably, upstream of Vadinar. The tidal elevations (m) alongthe Gulf are as follows:MHWS MHWN MLWN MLWS MSLOkha 3.47 2.96 1.20 0.41 2.0Sikka 5.38 4.35 1.74 0.71 3.0Rozi 5.87 5.40 1.89 1.0 3.6Kandla 6.66 5.17 1.81 0.78 3.9Navlakhi 7.21 6.16 2.14 0.78 4.2Navinal Pt 6.09 5.65 1.81 0.37 3.422
The phase lag between Okha and Kandla is 2 h to 2 h 25 min whilebetween Okha and Navlakhi it is 3 h to 3 h 20 min. Due to high tidal ranges inthe inner regions, the vast mudflats and coastal lowlands that get submergedduring high tide, are fully exposed during low tide.Circulation in the Gulf is mainly controlled by tidal flows andbathymetry, though wind effect also prevails to some extent. The maximumsurface currents are moderate (0.7-1.2 m/s) but increase considerably (2.0-2.5 m/s) in the central portion of the Gulf. The spring currents are 60 to 65 %stronger than the neap currents. The bottom currents are also periodic with avelocity normally 60-70 % of the surface currents. With high tidal range,negligible land run-off and irregular topography, the waters are verticallyhomogeneous in terms of salinity and temperature.3.3.2 Water qualityThe general water quality of the Gulf is illustrated in Tables 3.3.1 and3.3.2. The annual variation of water temperature is between 23 and 30 o Cthough localised higher temperatures upto 35 o C can result in isolated waterpools formed in shallow intertidal depressions, during low tide.SS is highly variable (5-700 mg/l), spatially as well as temporally, andlargely result from the dispersion of fine sediment from the bed and theintertidal mudflats, by tidal movements. Evidently, nearshore shallow regionsinvariably sustain higher SS as compared to the central portions. The regionbetween Okha and Sikka has low SS varying within a narrow range (10-50mg/l) whereas the inner Gulf areas contain markedly higher SS, sometimes inexcess of 100 mg/l.Average pH of the Gulf water is remarkably constant (8.0-8.3) and iswithin the range expected for the coastal tropical seas. The evaporationexceeds precipitation leading to salinities markedly higher than that of thetypical seawater. This is particularly evident in the inner Gulf where salinitiesas high as 40 ppt have been reported to commonly occur off Kandla andNavlakhi. Although the salinities decrease considerably for a brief period in23
3.3.4 Flora and faunaThe Gulf abounds in marine wealth and is considered as one of thebiologically richest marine habitat along the west coast of India. Quantitativeinformation for selected biological characteristics of the Gulf is given in Tables3.3.5 to 3.3.10The marine flora is highly varied, which includes sand dune vegetation,mangroves, seagrasses, macrophytes and phytoplankton. The dominantspecies of sand dune flora are Euphorbia caudicifolia, E.nerifolia, Aloevera sp,Ephedra foliata, Urochodra setulosa, Sporobolus maderaspatenus, Eragrostisunioloides, Calotropis procera, Fimbristylis sp, Indigofera sp and Ipomoeapescaprae. The common seagrasses found growing on the mud flats areHalophila ovata, H.beccarii and Zostrea marina.The most common marine algal species are Ulva fasciata, U.reticulata,Enteromorpha intenstinalis, Dictyota sp, Hypnea musciformis, Sargassumtennerimum, S.ilicifolium, Gracilaria corticata, Cystocera sp, Padinatetrastomatica, Corallina sp, Laurencia sp, Caulerpa racemosa, C.peltata,Bryopsis sp, Turbinaria sp, Ectocarpus sp, Acanthophora sp, Chondria sp,and Codium sp (Table 3.3.5).The primary production of the water column as assessed fromchlorophyll a concentrations is generally good in the outer Gulf but decreasesin the inner regions (Tables 3.3.6 and 3.3.7). The major phytoplanktongenera are Rhizosolenia, Synedra, Chaetoceros, Navicula, Nitzschia,Pleurosigma, Thalassiothrix, Biddulphia, Stauroneis, Coscinodiscus andSkeletonema.The Gulf has a vast intertidal area with rich biota. Sheltered bays,creeks and mud flats provide ideal sites for mangrove vegetation over anestimated area of about 1036 km 2 (Table 3.3.8). The formations are of openscrubby type, with isolated and discontinuous distribution from Kandla-Navlakhi in the northeast to Jodia, Jamnagar, Sikka, Salaya and Okha in thesouthwest, as also at Pirotan, Poshitra, Dohlani and Dwarka. Vast stretches25
of mangroves also exist along the northern shore of the Gulf. The dominantspecies of mangroves are Avicennia marina var acutissima, A officinalis,Bruguiera parviflora, B gymnorphiza, Rhizophora mucronata, R apiculata,Ageiceros corniculata and Sonneratia apetata along with the associatedspecies of Salicornia brachiata, Sueda fruticosa, Artiplex stocksii and a lichen,Rosella montana.The marine fauna of the Gulf is rich, both in variety and abundance.Sponges having an array of colours are seen, both in the intertidal andsubtidal biotopes. The common species of sponge is Adocia sp, associatedwith coral reef fauna. In sandy and silty mud shores, Tetilla dactyloidea(Carter) is common.The most frequently encountered hydrozoans are Sertularia sp andPlumularia sp. The giant sea anemone (Stoichactis gigantum) is a commonsight in the coral ecosystem. Sea anemones, belonging to Anemonia,Bunodactis, Paracondylactis, Anthopleura and Metapeachia, are wide spread.A zoantharian, Gemmaria sp, is found forming extensive hexagonal greenmats in the coral pools. Another interesting actiniarian is the Cerianthus spfound in tubes in the soft mud.One of the most interesting biotic features of the Gulf is the presence ofliving corals, thriving as patches, rather than reefs, either on the intertidalsand stones or on the surface of wave-cut, eroded shallow banks along thesouthern shore of the Gulf. The species diversity however is poor withidentification of 44 species of Scleractinian and 12 species of soft corals(Table 3.3.9).A number of polychaete worms, both sedentaria and errantia, with thedominant genera of Eurythoe, Terebella, Polynoe, Iphione and Nereis arerather common. Amongst a variety of sipunculid and echiuroid worms, thedominant species are Dendrosromum sp, Asphidosiphon sp and Ikadellamisakiensis (Ikeda). The intertidal crustacean fauna is very rich and equally26
diverse with spider crab (Hyas sp) and furry crab (Pillumnus sp), asspecialities.Amongst the invertebrate component of the marine fauna of the Gulf,the molluscs have the highest representatives. As many as 92 species ofbivalves, 55 species of gastropods, 3 species of cephalopods and 2 specieseach of scaphopods and amphineurans have been reported. The mostnotable members of the molluscan fauna are octopus, pearl oyster and avariety of chanks, including the sacred chank.The echinoderm fauna, represented by 4 classes and 14 genera havethe commonest genera of Palmpsis, Astropecten, Asteria, Temnopleura andHolothuria. The subtidal benthic fauna of the Gulf is dominated bypolychaetes, crustaceans, echinoderms, gastropods and bivalves, with anaverage biomass of 25 g/m 2 .The Gulf has a variety of exploitable species of finfishes andshellfishes. Sciaenids, polynemids, perches, eels, cat-fishes, elasmobranchsand prawns are the commercially important groups with an average catch of1.4x10 5 t/y. Fishing grounds for Ghol, Karkara, Khaga, Dhoma, Magra andMusi exist in the Gulf.The Gulf region offers plenty of facilities for feeding, breeding andshelter to a variety of birds (Table 3.3.10). In the mangrove forests lining theislands and along the coast, the birds find a near perfect environment. Inaddition, they are well placed to reach their food supply i.e. the shoals of fish,squids, mud-skippers and other animals, during low tide. All along the creeksand around islands, mangrove trees and mudflats are seen crowded withGrey Herons, Pond Herons, Painted Storks, Large and small Egrets, ReefHeron, Darters, Cormorants, Flamingos, Lesser Flamingos, etc during theperiods of seasonal migration (November-March).A large number of migratory birds pass through the Gulf and a smallpopulation of most species comprising mainly of juveniles and non-breeding27
adults take shelter in this area during summer. Salt works spread-out alongthe coast, are also important for feeding and breeding of birds. They act asalternate sites for them to roost during high tide.Though a detailed systematic survey of biota is lacking, followingnumber of species have been reported:Flora/Fauna Species (no)Algae 130Sponges 70Corals 37Fishes 200Sharks 8Prawns 27Crabs 30Molluscs 200Sea turtles 3Sea mammals 3Birds 200Because of its high biogeographical importance and rich flora andfauna, several areas along the southern Gulf are notified (Figure 1.4.1) underthe <strong>Marine</strong> National Park (16289 ha) and the <strong>Marine</strong> Sanctuary (45798 ha).28
4 SITE SPECIFIC MARINE ENVIRONMENT4.1 Area descriptionThe assessment domain of the present study involved the section ofthe Gulf off Tunda-Vandh. The coastal stretch of the Gulf has variegatedtopography with vast intertidal mudflats criss-crossed by numerous creeks,which transport seawater several kilometres inland due to high tidal ranges.In general, Bocha, Navinal, Baradi Mata and Kotdi creeks are the major tidalinlets in the vicinity of the Mundra Port area, which are broad but shallow andnavigable only during flood tide. Occurrence of a large number of creeks hascreated a number of islets; the prominent being the Navinal and BochaIslands. These two islands are separated by the Navinal Creek, which in theinterior joins the Bocha as well as the Baradi Mata Creeks. The intertidalmudflats and many of the creeks of the surrounding area harbour mangrovesand associated biota though several areas have suffered damage due toanthropogenic pressures. Large stretches of mangroves also suffereddestruction during the cyclone of June 1998.The region is semi-arid with average annual rainfall of
direction is SW-W with maximum speeds between 40 and 50 km/h, and (d)during monsoon (June-September) the wind direction is predominantly SW-Wand maximum speeds can reach 60 - 70 km/h.Nagmati, Bhukhi and Phat Rivers are the major drainage streams ofMundra Taluka, which originate from the slopes of the central highland.These rivers are however dry and carry land runoff to the Gulf in brief spellsonly during monsoon.The ground water is the major source for domestic use. The qualityand availability however is variable depending on the rainfall, topography andhydrological setting. The level of water suitable for drinking and irrigationranges from 5 to 35 m below the ground. The water at greater depths tendsto be saline. Increased rate of extraction and scanty rainfall in recent yearshas not only led to groundwater depletion but seawater ingress has occurredin many areas along the coast.The fertility of the coastal soil is affected by salinity. The vegetationmainly consists of trees, shrubs, under shrubs and climbers with stuntedgrowth with an admixture of xerophytes and thorny species. The dominantfloral species are of Phoenix sylvestris, Achras zapota, Prosopis juliflora,Acacia senegal, Mytenus emarginatea and Acacia nilotica. The shrubcommunity is dominated by the species of P. juliflora and Indigoferaoblongifolia.The region between Mundra and Mandvi on the northern coast of theGulf of Kachchh is interspersed with numerous creeks and islets. Some ofthese islets exhibit mangrove vegetation in their lower fringes where as someare made up of sand and sand dune vegetation.The area proposed for the development of power plant of CGPL islocated between two ephemeral rivulets namely Khari Nadi in the west andWae, a contributory of Nagavati river in the east. There are two moderate sizevillages Tunda and Vandh in the vicinity of the project site. The intertidal area30
of this region is devoid of mangroves. The bottom is sandy and the inlets arepartially sedimented. Tidal water enters the creek about 1-1.5 h after lowwater slack during spring and remains well connected, though not navigable,during neap and average low waters. Some of the sandy beaches are used bylocal fisher folk for beaching their shallow draft crafts and land above highwater line for drying fish. The prominent vegetation is mainly composed ofBabool (Presopsis julifolia). Mundra, the nearest major town is approximately28 km in the E-NE direction.4.2 Physical processes4.2.1 TidesTide levels recorded at Mundra port are compared with the predictedtide at Kandla Port in the following table:Mundra KandlaSpring high water (m) 6.09 7.04Neap high water (m) 5.65 6.84Neap low water (m) 1.81 2.50Spring low water (m) 0.37 0.17A comparison between the data sets for the two ports indicates that thetime of occurrence of flood and ebb tide at Mundra lead by 27 and 46 minrespectively with respect to the Kandla tide. The tidal range ratio (Mundra :Kandla) is 0.83 and 0.88 for spring and neap tides respectively.The mean sea level at the Mundra Port (Bocha Creek) is estimated at3.31 m (above CD) which is comparable to that reported for Navinal Point(3.38 m) in the Admiralty Tide Tables. Tide was also measured at Kotdi Creekduring January 2006 (Figure 4.2.1). The tidal ranges during this period varyfrom 1 to 3.5 m with the time lag of 5 to 10 min as compared to the phase ofthe tide at the Mundra Port. The tide recorded during April 2006 (Figure 4.2.2)at both the mouth of Kotdi creek and inside Kotdi creek indicates that the siteof measurement inside the creek is about 1.8 m above CD. During this periodthe spring low water at Kotdi mouth is 1.0 above CD which indicates that thetidal flow is not available in the Kotdi creek for about 1.5 h during end of thespring ebb and a similar duration in the beginning of the following flood. This31
enders the creek partially dry and partially stagnant for about 3 h in a floodtide. The neap tide is of comparable magnitude in the creek as well as themouth area of the creek.4.2.2 CurrentsThe currents in the Gulf and associated creeks are largely tide inducedand oscillations are mostly bimodal reversing in direction with the change inthe tidal phase. Influence of wind on variations in current is minor. Thecurrent reversals are quite sharp occurring within 30 - 60 min. Currents wererecorded at station 2 off Vandh (Figures 4.2.3 to 4.2.5). The U component ofthe currents (Northward) is stronger than the V component indicating weaklateral transport, as expected. The maximum current speed varied from 0.5 to1.2 m/s. The predominant direction of the current is 45 o during flood and 220 oduring ebb.4.2.3 CirculationThe drogue studies conducted from station 2 (Figures 4.2.6 to 4.2.9)indicate that the circulation is generally elliptical with the major axis in theeast-west direction. These trajectories suggest that the excursion lengths arein the range of 10 to 15 km depending on the tidal phase (neap or spring).4.3 Water qualityThe water quality was assessed around Tunda-Vandh at 6 subtidalstations during December 2008. Since the water quality can vary temporally inareas swept by strong tides, hourly measurements were conducted at station2 to assess tidal variability of selected water quality parameters and otherstations were monitored with spot sampling. These variations are presented inTables 4.3.1 to 4.3.6 and Figure 4.3.1.4.3.1 TemperatureTemperature of water is an important parameter and influenceschemical processes in water such as dissolution – precipitation, adsorption,desorption, emulsification, flocculation, oxidation etc. For instance dissolutionof gases such as ammonia and oxygen decreases with increase in32
temperature while some solids may precipitate out due to decrease insolubility at lower temperature. Some contaminants like PHc may absorb athigh temperature and concentration of some materials may enhance due toincrease in solubility at lower temperature. As a result of absorption of solarradiation, the water temperature of a well mixed water body varies inaccordance with air temperature while in a water body having a restrictedmixing, a thermal gradient may occur. Due to the natural changes in climaticconditions, the temperature of water fluctuates daily as well as seasonally.The temperature of the coastal waters around Vandh varied inaccordance with the air temperature. The range of temporal as well as spatialvariations were small (Tables 4.3.1 to 4.3.6). The water around Vandh wasvertically well mixed and comparable with earlier studies..Period Temperature(ºC)January 2006 19.0-23.0(20.8)April 2006 25.9-29.0(27.3)April 2007 27.5-29.1(28.4)October 2007 28.1-30.1(29.2)December 2008 24.5-27.5(26.0)4.3.2 pHpH is the measure of hydrogen ion activity in water. It is known as themaster variable in water since many properties, processes and reactions arepH dependent. The pH of seawater is largely controlled by the CO 2- 3 / HCO - 3 /CO 2 system. When the primary productivity is high CO 2 is consumed duringphotosynthesis, which shifts the equilibrium that favors higher pH.Comparable pH values from 2006 are given below for the area.PeriodpHJanuary 2006 8.0-8.3(8.1)April 2006 7.8-8.0(8.0)33
PeriodpHApril 2007 7.7-8.0(7.9)October 2007 8.1-8.3(8.2)December 2008 7.9-8.1( 8.0 )It is evident from the above table that the pH variations in the coastalsystem have been negligible. Temporal variations were also minor as evidentfrom the Figure 4.3.1.4.3.3 Suspended SolidsSS is the description term used for suspended / settleable particulatematter in the water column. SS of natural origin mostly contains clay, silt andsand derived bottom and shore sediment and plankton. For nearshore,coastal areas and estuaries, clay and vegetation matter form an importantcomponent of SS. Since the major contribution to SS comes from thedisturbance of bed and shore sediment, tidal currents is the vital influencingfactor for the level of SS and typically lead to high values in the bottomwaters. Anthropogenic discharges add a variety of SS depending upon thesource. The coastal waters around Vandh sustained low suspended solids(22-54 mg/l) when compared with earlier studies as is evident below.PeriodSS(mg/l)January 2006 30-214(57)April 2006 16-49(28)April 2007 28-252(70)October 2007 18-209(83)December 2008 22-54(34)SS is expected to be largely inorganic in nature and results from thedispersion of fine grained sediment from the bed as well as the banks by tidal34
currents. Hence the bottom water sustained marginally high SS as comparedto that at the surface (Tables 4.3.1 to 4.3.6).4.3.4 SalinitySalinity is an indicator of freshwater intrusion in nearshore coastalwaters as well as excursion of salinity in inland water bodies such asestuaries, creeks and bays. Normally seawater salinity is 35.5 ppt but mayvary depending on evaporation, precipitation and freshwater addition. Salinitylargely influences several processes such as dissolution, dispersion, dilutionetc in seawater due to high dissolved salt content and high density. The rangeand average salinities at different stations around Vandh are presented inTables 4.3.1 to 4.3.6. In the absence of fresh water inflow the salinity variedfrom 35.9 to 38.0 which compared well with earlier results as shown below.PeriodSalinity(‰)January 2006 36.5-37.8(37.2)April 2006 36.4-37.3(36.9)April 2007 35.0-36.9(35.8)October 2007 34.0-35.2(34.5)December 2008 35.9-38.0(36.6)Temporal as well as spatial variations were minor (Fig 4.3.1). Minorvariations in surface and bottom samples suggested that the water in thestudy area was vertically well mixed.4.3.5 DO and BODDO content of water is a vital water quality parameter influencing theaquatic biota. DO is an important constituent and is significant in theprotection of aesthetic qualities of water as well as maintenance of aquaticlife. Although there is considerable dispute on the minimum level of DOrequired for a healthy tropical marine environment, it is considered that theDO level should not fall below 3ml/l prolonged periods in creeks, estuaries35
and coastal waters for health of ecosystem. Hence, it is of considerableinterest in water quality investigations as its concentration in water is anindicator of prevailing water quality and ability of a water body to support awell balanced aquatic life. The sources of DO in seawater are photosynthesisand dissolution from the atmosphere at air-water interface. This vitalparameter is linked with the health of aquatic life including fishes. However,DO is consumed during microbial oxidation of organic substances which ismeasured in terms of BOD.The DO in the waters off Vandh varied from 2.9 to 5.4 ml/l and wasgenerally >3.0 ml/l (Tables 4.3.1 to 4.3.6). The average DO was 4.1 ml/l. Thepresent range and average DO values around Vandh are compared withearlier studies and presented below.Period DO (ml/l) BOD (mg/l)January 2006 1.8-5.6(4.4)0.5-4.0(1.5)April 2006 4.6-4.9(4.8)0.8-5.2(3.0)April 2007 2.9-5.0(2.6)0.2-4.5(2.0)October 2007 2.6-5.9(4.3)0.2-4.6(1.8)December 2008 2.9-5.4(4.1)
directly assimilated by algae. Hence, concentration of nitrite and ammonia areoften very low in natural waters. The concentrations of nitrogen andphosphorus compounds in the coastal waters of Vandh are presented inTables 4.3.1 to 4.3.6 and suggest that though the concentrations are variablebut are as expected for the coastal waters of the region as evident from thedata given below:.Period NO - 3 -N NO - 2 -N NH + 4 -N PO 3- 4 -PJanuary 2006 1.9-12.6(6.5)0.2-0.5(0.4)ND-6.1(0.4)0.4-2.3(1.6)April 2006 3.2-6.2(4.0)0.3-0.5(0.4)0.3-1.2(0.7)0.5-1.5(1.0)April 2007 2.7-10.1(5.6)0.2-.0.8(0.4)ND-0.7(0.3)0.4-2.3(1.4)October 2007 2.2-11.4(8.0)0.1-0.5(0.3)ND-4.3(0.8)0.5-2.1(1.2)December 2008 5.2-10.6(7.0 )0.2-0.6(0.4 )0.1-1.3(0.7)1.3-3.5(2.1)4.3.7 Phenols and PHcNatural water contains trace levels of PHc and phenols. However, theiroccurrence in high concentration is often due to external perturbations. Thecomparison with past levels of phenols and PHc in the coastal waters ofVandh are summarized in the table below.Period PHc (ug/l) Phenol (ug/l)January 2006 2.4-22.6(15.5)10-62(21)April 2006 9.8-28.1(20.3)10-64(28)April 2007 5.4-19.2(11.5)29-67(47)October 2007 30-79.4(50.5)14-103(58)December 2008 0.8-3.1(1.6)3.4-52.5(14.4 )These results indicate that such concentrations of PHc and phenols inthe coastal waters commonly occur which are not mainly influenced by theanthropogenic release in the system.37
4.4 Sediment qualityThe concentrations of several contaminants such as trace metals, PHcetc in aquatic sediment increases in areas receiving their anthropogenicfluxes. This is because these pollutants on entering water are absorbed by thesuspended particulate matter and some like heavy metals are also hydrolysedand precipitated before adsorption. The suspended load on settling enrichesthe bed material with these pollutants. Hence, the analysis of sedimentsserves as a useful indicator of pollution status with respect to thesecontaminants.4.4.1 TextureThe sediment texture along the open shore around Vandh and theintertidal areas were found to be generally sandy (Table 4.4.1).4.4.2 Heavy metalsDetermination of trace pollutants such as heavy metals and organiccompounds in water often reveals wide fluctuation as their concentrationsdepend on the location and time of sampling, nature of pollutants andchemical characteristics of water. Moreover, several trace pollutants getrapidly fixed to SS and thus get removed from the water column. It has beenobserved in several instances that even close to location of effluent releasethe metal content in water decreases to normal value making the assessmentof ambient concentration through analysis of water, a difficult task.The pollutants adsorbed on the SS are ultimately transferred to the bedsediment, on settling evidently, the concentrations of pollutants in sedimentincreases over a period of time in regions receiving their fluxes. Hence if thelevels of the pollutants in sediment are reliably known prior and after releaseof industrial effluent into marine environment the impact due to pollutants canbe identified and data may be used for future assessment.The concentration of heavy metals around Vandh in subtidal as well asintertidal sediments are presented in Table 4.4.1. The range in concentrationof metal content in sediment varied as follows:38
Elements Jan 2006 Apr 2006 Apr 2007 Oct 2007 Dec 2008Al (%) 1.2-9.0 1.0-6.8 1.2-6.6 0.6-7.6 0.4-1.3Cr (µg/g) 17-69 5-67 20-115 2-70 32-45Mn (µg/g) 296-928 677-1566 260-1244 296-1566 253-799Fe (%) 1.4-8.9 1.3-5.0 0.4-5.0 0.3-1.4 0.4-3.1Co (µg/g) 11-38 5-58 6-28 - 2-6Ni (µg/g) 9-61 6-58 11-58 3-39 5-9Cu (µg/g) 10-42 4-32 6-33 2-26 6-10Zn (µg/g) 94-767 162-242 21-80 3-91 18-28Hg (µg/g) - ND-0.04 0.01-0.04 0.01-0.03 -It is evident from the table that the concentrations of most metals arecomparable with earlier studies. In the absence of any anthropogenic releasesof metals to marine area the above concentrations can be considered as baseline for future assessments.4.4.3 Organic carbon and phosphorusGenerally organic matter in natural marine sediment originates from theterrestrial runoff. Anthropogenic organic inputs however can increase thecontent of organic matter to abnormal levels disturbing the equilibrium of theecosystem. Organic matter settling on the bed is scavenged by benthicorganisms to a large extent. The balance is decomposed in the presence ofDO by heterotrophic microorganisms. Hence, DO in sediment-interstitialwater is continuously consumed and anoxic conditions develop if the organicmatter is more than that can be oxidised through oxygen as an oxidant. Suchanoxic conditions are harmful to benthic fauna. The level of C org in thesediments around Vandh is presented in Table 4.4.1. Over all concentration ofC org (av 0.2%) shows that concentration of organic carbon is meagre offVandh. Comparison with available data given below also gives the conclusion39
that the levels are low and do not indicate any accumulation of the constituentin the sediment.Period Concentration(%)April 2006 0.6December 2008 0.24.4.4 PhosphorusLithogenic phosphorus in marine sediments is derived from thegeological sources through river flows, while, the anthropogenic phosphorusis the result of sewage and industrial discharges, agricultural runoff etc. Theconcentration of phosphorus (µg/g; dry wt) in sediments around Vandh arepresented in Table 4.4.1 and varied in the range of 381 to 724 µg/g. Theseconcentrations though variable, are comparable to those recorded in thesediment of other areas of the Gulf and do not indicate its enrichment in thesediments. The comparison of current levels of the element with that of April2006 does not show wide variation as depicted below.Period Concentration(µg/g)April 2006 188 -631December 2008 381 - 7244.4.5 Petroleum hydrocarbonNaturally occurring low PHc content is associated with vegetationdecay, erosion etc. PHc entering through the spillage on water partlyevaporates and the leftover residue eventually sinks to the bottom due toincrease in density or its incorporation with particulate matter. Thus bedsediment serve as a sink for PHc and its high level may indicate grosssediment contamination in the region. The concentration of PHc around studyarea is presented in Table 4.4.1. The PHc content (µg/g wet weight) in thesediment in the surrounding region varied in the following range and suggestsinsignificant accumulation in the sediment.40
Period Concentration(µg/g)April 2006 ND - 0.4December 2008 0.1-1.24.5 Flora and faunaWhenever probable implications of a coastal development on marineenvironment are assessed, it must be remembered that despite manychanges the development may cause in the physico-chemical properties ofthe coastal marine ecosystem including the bed sediments, the ultimateconcern is inevitably the biological resource. Hence, the assessment of statusof flora and fauna at the development site is very important. Floral and faunalcomponents in the coastal zone are highly diverse inhabiting a variety ofecosystems. However, it is not practical to include all components in amonitoring programme and EIA studies because of shear complexity ofecosystem. However, areas of high ecological importance such as zones ofrich biological productivity and feeding, breeding, spawning and fishinggrounds of economically important organisms which can be degraded due toa coastal activity should be studied in more detail and should be included inthe investigations of this nature.The living community of an ecosystem comprises of consumers,producers and decomposers and related non-living constituents interactingtogether and interchanging materials as a whole system. The basic process inan aquatic ecosystem is the primary productivity. The transfer of energy fromthe primary source through a series of organisms is defined as the foodchains, which are of two basic types; the grazing food chain and the detritusfood chain. The stress may cause the communities to exhibit low biomass andhigh metabolism. In addition, due to depressed functions of less tolerantpredators, there may be also a significant increase of dead organic matterdeposited in sediments of ecosystems modified under stress. Dependingupon the type, strength and extent of a stress factor, the ecosystem will reactto either re-establish the previous equilibrium or establish a new one, or it mayremain under prolonged disequilibrium.41
The biological parameters considered for the present monitoring studyare phytoplankton pigments and cell count, zooplankton standing stock andpopulation, macrobenthic biomass and population, mangroves and fisherystatus. The first two reflect the productivity of water column at the primary andthe secondary levels. Benthic organisms being sedentary animals associatedwith the seabed, provide information regarding the integrated effects of stress,if any, and hence are good indicators of early warming of potential damage.<strong>Assessment</strong> of mangroves and corals are considered as a part of overallecological evaluation. The aggregate data presented in Tables 4.5.1 to 4.5.23and Figures 4.5.1 and 4.5.2 is used to evaluate the status of flora and fauna inthe coastal system off Vandh.4.5.1 Seaweeds, seagrasses and mangrove ecosystem<strong>Marine</strong> flora like algae and mangrove play a significant role in enrichingnearshore sea, by adding dissolved organic matter, nutrients and detritusbesides serving as nursery areas for the larvae and juveniles of severalmarine animals.Coastal vegetation such as seaweeds, seagrasses and mangroveswere studied from the subtidal to the HTL within the proposed developmentsite where the intertidal region is largely sandy - silt. The marine algaEnteromorpha sp commonly occured in the intertidal area while seagrasseswere dominated by Halophila ovata and Halodule uninervis.Mangrove ecosystemMangroves are salt tolerant forest ecosystem of tropical andsubtropical intertidal regions of the world. Where conditions are sheltered andsuitable, the mangroves may form extensive and productive forests likearound Mundra, which are the reservoirs of a large number of species ofplants and animals. The role of mangrove forests in stabilizing the shorelineor coastal zone by preventing soil erosion and arresting encroachment onland by sea is well recognised thus minimising water logging and formation ofsaline banks.42
Vegetation of mangrove ecosystem can be divided into the followingbroad categories.(a) Mangroves(b) Salt marshes(c) Sand standsa) MangrovesMangrove forests are extensive along the coastal belt of KachchhDistrict occupying an area of 1067 km 2 as a dense forest; dominant speciesbeing Avicennia with almost pure stands at place. In some localities these areassociated with Avicennia officinalis, Rhizophora mucronata, Bruguieragymonorrhiza, Ceriops tagal, Aegiceras corniculatune and Sonneratiaapetala. Other associated mangrove flora includes species such asSalicornia brachiata, Sucieda fruticoa and Atriplex stocksii.The areas around Kandla-Nakti, Hansthal, Navinal-Bocha, BaradiMata-Kotdi Creek complex, Kori Creek etc represent the best mangroveformations along the northern shore of the Gulf. These mangrove areas areseen as red patches bordering the creeks in satellite imagery shown in Figure2.0.1. The composition and ecological status of mangroves and obligatehalophytes is given in Table 4.5.1. Mangroves are dominated by Avicenniamarina and are of fringing type in regularly inun<strong>dated</strong> zones along the waterways. Mangrove belts bordering short segments of Kotdi Creek/BaradimataCreek-2, are degraded and under pressure of camel grazing and cutting forfirewood. The stray plants of Rhizophora mucronata also occur amongAvicennia stands. Salvodora persica commonly occur in the supralittoralregions towards the HTL.Sesuvium portulacastrum is common at the HTL along the creeks.Beds of Salicornia brachiata commonly habit the areas inland of regularlyinun<strong>dated</strong> zones or above the mean high tide line. The Salicornia stands aremore dense towards waterways and become sparse in saline banks. Suedamaritima is sparsely distributed in the saline bank regions.43
The land portion proposed for the discharge channel falls under salinebank is devoid of mangrove vegetation. Very poor leaching of salts due to lowfrequency of inundation and poor rainfall result in salt encrustation of salinebanks rendering them unsuitable for vegetation to grow except for strayhalophytes like Sueda maritima. It may be mentioned here that it is acommon practice to utilize such saline banks or supralittoral regions of lowbiological productivity and diversity for salt works in the Gulf.Overall assessment indicates that the site proposed for thedevelopment largely falls under the category of saline banks devoid ofmangroves.b) Salt marshesThe vegetation of this zone consists predominantly of Aeluropeslagopoides, supported by Sporoblus sp. Cressa cretica also occur in driedsalt marshes and salt pans. Presence of species such as Cyperus pangorei,Bergia adorata and Oldenlandia umbellata is probably an indication ofretrogression due to the detrimental effect of salt works.c) Sandy standsIn the sandy patches between the rocks, a few species such asCyperus conglomerates and Asparagus demosus are identified.4.5.2 PhytoplanktonPhytoplankton forms the vast array of minute and microscopic plantspassively drifting in natural waters and mostly confined to the illuminatedzone. In an ecosystem these organisms constitute primary producers formingthe first link in the food chain. Phytoplankton long has been used asindicators of water quality. Some species flourish in highly eutrophic waterswhile others are very sensitive to organic and/or chemical wastes. Somespecies develop noxious blooms, sometimes creating offensive tastes andodours or anoxic or toxic conditions resulting in animal death or humanillness. Because of their short life cycles, plankton responds quickly toenvironmental changes. Hence their standing crop in terms of biomass, cell44
counts and species composition are more likely to indicate the quality of thewater mass in which they are found. Generally, phytoplankton standing cropis studied in terms of biomass by estimating chlorophyll a and primaryproductivity and in terms of population by counting total number of cells andtheir generic composition. When under stress or at the end of their life cycle,chlorophyll a in phytoplankton decomposes with phaeophytin as one of themajor products.Phytoplankton biomass is estimated in terms of concentration ofphytopigments. The levels of chlorophyll a (0.5 – 5.9 mg/m 3 ; av 1.6 mg/m 3 )and phaeophytin (0.2 – 2.0 mg/m 3 ; av 0.7 mg/m 3 ) varied in wide range in thecoastal ecosystem off Vandh (Tables 4.5.2). The variations from the surfaceto bottom were negligible indicating their uniform distribution throughout thewater column. This homogenous nature of the water mass perhaps providedstability for the biological processes. The comparison of their distribution inthe area from 2006 to 2008 (present study) is given in the table below.Year Chlorophyll a(mg/m 3 )January 2006 0.2-14.1(1.6)April 2006 0.2-1.5(0.7)April 2007 0.2-2.3(0.4)October 2007 0.9-3.0(1.8)December 2008 0.5 – 5.9(1.6)Phaeophytin(mg/m 3 )0.1-10.2(2.3)0.2-5.1(3.5)0.1-5.6(2.4)0.1-2.3(0.4)0.2-2.0(0.7)It is evident from the above table that average concentrations ofchlorophyll a and phaeophytin in the sea off Vandh have not changedsignificantly over the years, though high values had been occasionallyobserved in January 2006. The average concentration of phaeophytin wasoften lower or comparable with the concentration of chlorophyll a ascommonly observed for coastal waters of the Gulf. The temporal variation inphytoplankton pigment concentrations did not show any marked variation(Figure 4.5.1).45
In line with the high variability of pigments, the average cell count (no x10 3 /l) of phytoplankton also varied (Table 4.5.3) dramatically as evident fromthe following results.YearCell count(nox10 3 /l)Total genera(no)January 2006 415.2 13April 2006 18.2 16April 2007 53.3 20October 2007 88 15December 2008 861.7 19These results reveal variable phytoplankton cell counts and genericdiversity in the region with marked increase during recent years. Theseresults indicate no regular trend in the distribution pattern of phytoplankton.This can be due to high patchiness and uneven distribution of phytoplanktoncells in the coastal waters. The above table also indicates an increase ingeneric diversity since January 2006. Enhanced generic diversity inassociation with higher cell counts indicates good conditions for phytoplanktongrowth.In the present investigation the generic diversity varied between 13 to19 (av 17) in the area (Table 4.5.4). Overall, about 31 genera ofphytoplankton were recorded in the coastal waters off Vandh duringDecember 2008. The populations were dominated by Fragilaria,Thalassiosira, Thalassionema, Pleurosigma, Navicula, Nitzschia, Peridinium,Melosira and Thalassiothrix.4.5.3 ZooplanktonBy virtue of sheer abundance and intermediate role betweenphytoplankton and fish, zooplankton is considered as the chief index ofutilization of aquatic biotope at the secondary trophic level. Zooplanktonincludes arrays of organisms, varying in size from the microscopic protozoansof a few microns to some jelly organisms with tentacles of several metreslong.46
Zooplankton standing stock in terms of biomass (0.4 – 14.1 ml/100m 3 ;av 4.6 ml/100m 3 ) and population (2.3 – 86.2 x 10 3 /100m 3 ; av 25.3 x10 3 /100m 3 ) revealed good secondary production in the coastal waters offVandh (Tables 4.5.5) though the distribution indicated considerable spatialand tidal fluctuations. The temporal variations in distribution of zooplanktonstanding stock revealed no particular trend (Figure 4.5.2). The zooplanktonstanding stock in different segments of the study area recorded during thepresent study is comparable with the results of earlier studies as seen in thefollowing table.YearBiomass(ml/100m 3 )Population(nox10 3 /100 m 3 )Total groups(no)January20061.6-13.1(5.3)April 2006 1.2-11.0(4.5)April 2007 0.5-17.2(4.1)October 1.3-15.92007(9.1)December 0.4-14.12008(4.6)5.1-141(30.2)9.8-64.6(22.1)2.7-207.6(37.4)8.0-322.5(85.0)2.3-86.2(25.3)13-21(17)13-17(15)11-18(14)11-19(15)9-19(15)Wide spatial variation in zooplankton biomass and population offVandh is evident from the above results. These variations in zooplanktonstanding stock are invariably associated with factors like tide, patchiness intheir distribution, seasonal changes and grazing pressure within the foodchain. Such variations are common to dynamic coastal waters. The abovetable reveals insignificant seasonal fluctuations in zooplankton standing stock.The zooplankton community structure showed the dominance ofcopepods and decapod larvae in the study area as given Table 4.5.5. Theother common groups were foraminiferans, siphonophores, medusae,ctenophores, chaetognaths, polychaetes, ostracods, mysids, Lucifer,gastropods, lamellibranchs, fish eggs, fish larvae and appendicularians. Atotal of 23 faunal groups were identified (Table 4.5.6) though all of them didnot occur together at any given location. The group diversity of zooplanktonvaried from 9 to 19 (av 15 groups). It is also evident from the above that the47
faunal group diversity of zooplankton at different stations was closelycomparable.Breeding and spawningTo identify breeding grounds of fishes and crustaceans, extensive fieldobservations over a long duration are required. This approach was notpossible during the present short term investigations. Hence, alternatively,decapod larvae, fish eggs and fish larvae were studied from zooplanktoncollections and taken as indices of probable existence of spawning grounds.The adults, caught during trawling, were considered for comparison. Theavailable information on the breeding habits of the species found in the area isalso included as supportive literature.i) DecapodsThis group forms the major constituent of zooplankton and includes thelarval stages of commercially important shrimps. During December 2008, thepopulation density varied from 0.4 to 10.1 x 10 3 no/100 m 3 (av 5.7 x 10 3no/100 m 3 ) (Table 4.5.7). The average (nox10 3 /100m 3 ) population of thisgroup off Vandh are summarized here which varies in accordance with theseason in line with zooplankton distribution.Period Population(nox10 3 /100m 3 )January 2006 6.1April 2006 2.3April 2007 0.6October 2007 19.0December 2008 5.7All commercial penaeid prawns of the Indian waters breed in the sea inrelatively deeper waters in relation to the area of normal habitat of adultprawns. Penaeid prawns have high fecundity and the number of eggsproduced varies from species to species and size of the prawn. M.affinis,M.dobsoni, M.monoceros and P.stylifera breed throughout the year withindividually delineated peak breeding period. The eggs are released while48
swimming in the columnar waters or near the bottom. The early developmenttakes place in the open sea and post larvae enter thecreeks/estuaries/backwaters and attain all the adult characters includingsecondary sexual characters. They return to the sea where maturation of theovary and subsequent spawning takes place.Generally, the spawning grounds of penaeid prawns are away from thecoast. The spawning ground of M.dobsoni is reported to be at 20 - 30 m whilethat of M.affinis is at still deeper waters. Spawning ground of M.monoceros isreported to be at 50 - 65 m and that of P.stylifera at 18 - 25 m. M.affinis andP.stylifera prefer areas of soft mud and zones of rich plankton for mating andspawning.Acetes indicus are another common economically important species ofshrimps. During January-April they form conspicuous aggregations near theshore and are fished on a large scale. Fishing grounds of these shrimps aremostly located in calm muddy intertidal zones or waters shallower than 5 m.The life span of Acetes is 3 - 10 months and the adults die soon afterspawning. Breeding is continuous and surface water currents stimulateAcetes to swarm in shallow inshore waters when the wind blows moderatelytowards the coast.The Gulf has a varied representation of prawns and so far 27 speciesbelonging to Penaeidea and Caridea are recorded. Out of these, species likeP. penicillatus, M. brevicornis, M .kutchensis and Parapenaeopsis sculptilisare commercially important. M. brevicornis occur in high number along thenorthern shore of the Gulf between Mandvi and Luni where the substratum issandy. Higher percentage of M. kutchensis are generally confined to theinner Gulf area because the substratum predominantly contains clayey silt.The Gulf segment off Mundra is generally composed of sandy silt (Section4.4) which can influence the distribution of M.kutchensis a very hardy,euryhaline prawn with a probable preference for clayey silt substratum.Beside the substrate preference, another possible factor, which may controlthe distribution of prawns along the northern coast of the Gulf can be tidal49
currents which during the course of their movement (prawns) into and out ofthe Gulf, may act as a hydraulic barrier.ii) Fish eggs and larvaeFish eggs and larvae though less in number (0 - 239 no/100 m 3 ; av 18no/100 m 3 ) are fairly common among zooplankton (Table 4.5.7). The relativeabundance of the fish eggs and fish larvae from 2006 to 2008 aresummarized here.Period Fish eggs Fish larvae(no/100 m 3 ) (no/100 m 3 )January 2006 6 19April 2006 243 272April 2007 18 33October 2007 155 318December 2008 18 16The above table shows inconsistent pattern in fish eggs and larvaeproduction.4.5.4 MacrobenthosDepending upon their size, benthic animals are divided into threecategories, microfauna, meiofauna and macrofauna. Benthic communityresponses to environmental perturbations are useful in assessing the impactof anthropogenic perturbations on environmental quality. Macrobenthicorganisms which are considered for the present study are animal species withbody size larger than 0.5 mm. Samples for macrobenthos were collected fromintertidal segments as well as subtidal stations for the estimation ofmacrobenthic density, biomass and composition.a) Intertidal faunaThe intertidal macrobenthic standing stock in terms of population (440-12848/m 2 , av 3504/m 2 ) and biomass (0.27- 23.8 g/m 2 , av 7.7 g/m 2 wet wt)varied widely (Table 4.5.8). The present macrobenthic values which arecompared with the earlier studies are summarised here.50
PeriodPopulation(no/m 2 )Biomass(g/m 2 ; wet wt)Faunalgroups(no)Range Av Range Av Range AvJanuary 0 - 24464 3219 0 - 963.2 28.3 0 - 7 32006April 2006 0 - 13024 1354 0 - 103.0 10.0 0 - 8 3April 2007 0 - 28600 2457 0 - 422.6 30.2 0 - 7 3October 0 - 17116 2224 0 - 222.9 17.4 0 - 9 42007December2008440-12848 3504 0.27-23.8 7.7 3-8 5These results do not indicate any significant changes in themacrobenthic standing stock in terms of population though the biomassvalues in the current study are the lowest as compared to previous years.Though, the region in general, sustains rich intertidal benthos, significantvariation in the macrobenthic standing stock as well as group diversity isclearly evident. The faunal composition of intertidal macrobenthos of the areais given in Table 4.5.9. The intertidal macrofauna was constituted mainly byamphipods, polychaetes, gastropods and cumaceans. As evident from Table4.5.9 the total number of faunal groups in the intertidal transects varied from 3to 8 (av 5). Overall about 15 groups of intertidal macrobenthos were recordedoff Vandh during the present investigation.b) Subtidal macrobenthosDuring December 2008 the faunal standing stock in terms of populationand biomass ranged from 25-1100/m 2 and from 0.1-4.23 g/m 2 (wet wt)respectively (Table 4.5.10). The standing stock of subtidal macrobenthos atthe study area both in terms of biomass (av 0.7 g/m 2 ; wet wt) and population(315/m 2 ) was low and varied widely.The past values of subtidal macrobenthos production is given below.51
PeriodPopulation(no/m 2 )Biomass(g/m 2 ; wet wt)Faunal groups(no)Range Av Range Av Range AvJanuary 2006 0 - 2900 400 0 – 3.4 0.5 0 - 10 3April 2006 0 - 1800 1354 0 – 10.6 1.8 0 - 7 4April 2007 600- 1900 1200 0.3 – 3.4 2.3 4-9 7October 2007 0-3100 600 0 – 34.11 3.9 0 -10 4December200825-1100 315 0.1-4.23 0.7 1-9 4The above table indicates wide variations in the faunal standing stockin the region and no clear seasonal trend in the distribution is discernible,suggesting high patchiness in the distribution of subtidal macrobenthos.The faunal distribution (Table 4.5.11) revealed low diversity (av 4groups) with a low variability (1-9 groups). In general, about 10 groups ofsubtidal macrobenthos were recorded off Vandh during the presentinvestigation. The faunal composition indicated the dominance of polychaetes,brachyurans and amphipods.4.5.5 FisheryThe prevailing fishery status of the region off Vandh is evaluated on thebasis of data from the Department of Fisheries, Government of Gujarat andexperimental fishing undertaken in Gulf segments during earlier studies.Vandh forms a part of the Kachchh District. Evidently, no large scale ofcommercial fishing operations prevail off Tunda-Vandh and surroundingregion except for minor based hand-net and gill-net operations. However,along the northern coast of the Gulf, fishing by trawlers is common particularlyoff Mandvi, Modhwa, Mundra, Bhadreshwar and Tuna. Depending on thetopography of the coast and type of fishing, necessary modifications are madeto economise fishing operations by local operators. Small, plank built canoesand traditional crafts like the sail boat locally known as "Machuwa" are alsodeployed for fishing. The gear commonly used by these traditional crafts aredrift nets, gill nets and large bag nets.52
Gujarat is a leading state in marine fish landings and during 2005-06the total landings were 6.6 x 10 5 t (Table 4.5.12). Landings at various centresof Kachchh District contributed about 10% to the total landings of the state.The total fish landing in the district was around 8.1 x 10 4 t during 2002-03followed by a decrease during 2003-04, 2004-05 and 2005-06 (Table 4.5.13).Recent 6 y composition of fish catch indicated the incidence of 27 differentgroups (Table 4.5.13); the common groups being small sciaenids, Bombayduck, Coilia sp, ribbon fishes, sharks and prawns. Monthwise composition offish landings of the district indicated that October-December period is peakseason followed by January and September with March-July period as thelean season (Table 4.5.14). The landings at Mundra contributed about 0.6 to3.9% to the total landings of the district (Table 4.5.15). The composition offish catch at Mundra indicated incidence of 20 different groups (Table 4.5.16)with October to January as the peak landing period (Table 4.5.17).Navinal, Jarpara, Mundra, Chenkhedia, Luni, Bhadreshwar andKukadasar are the seven major fish landing centres in the Mundra region.However, their contribution to the district landing was meagre (Table 4.5.18).The composition of fish landings at these centres revealed the incidence of 26different groups (Table 4.5.18); the common groups being Bombay duck,Coilia sp, mullet, cat fish, ribbon fish, white pomfret, small sciaenids, shrimpsand prawns. During 2005-06, the total catch for Navinal, Jarpara, Mundra andBhadreshwar was 1071, 333, 1031 and 2160 t respectively and contributedless than 10% to the landings of the Kachchh District. Higher landingsoccurred at Mundra during March-April-May followed by January (Table4.5.17). This was due to heavy landings of Bombay duck and Coilia whichformed 33% and 22.8% respectively of the landings for 2005-06. The otherlanding centres also followed more or less similar pattern. District-wise detailsof fishing activities, total number of fishermen and fishing gears are given inTable 4.5.19 whereas total number of fishermen and fishing boats of Navinal,Jarpara, Dhrab, Mundra, Chenkhedia, Luni and Bhadreshwar are given inTable 4.5.20.53
During experimental fishing in April 2007 (Table 4.5.21) the fish catchrate varied between 5.0 and 14.5 kg/h (av 9.3 kg/h). This catch consisted of27 species of fishes, 9 species of prawns and 5 species of other specieswhich includes crabs, cephalopods and Squilla. Harpadon nehereus, Johniusglaucus, Coilia dussumieri, Arius caelatus, Otolithes sp, Pampus argenteus,Scoliodon laticaudus, Thryssa sp, Otolithus sp, Exhippolysmata ensirostris,Neptunus pelagicus and Metapenaeus sp were recorded as the dominantspecies. The other common species were Sillago sihama, Valamugil seheli,Polynemus tetradactylus, Scomberomorus guttatus, Thryssa hamiltoni,Lepturacanthus savala, Parapenaeopsis stylifera, Thryssa vitrirostris andCharybdis cruciata . During October 2007, the fish catch rate ranged between3.0 and 18.0 kg/hr (av 10.3 kg/h). This catch comprised of 31 species offishes, 11 species of prawn and 5 other species of crabs, cephalopods andsquilla. The fish catch was dominated by Johnius glaucus, Coilia dussumieri,Harpadon nehereus, Arius caelatus, Sillago sihama, Trichurus lepturus,Lepturocanthus savala, Pampus argenteus, Pampus chinensis, Ilishamegaloptera, Scoliodon laticaudus, Charybdis annulata, Exhippolysmataensirostris and Metapenaeus sp (Table 4.5.22).here:Available long term fishing data off Tunda/Vandh is summarizedPeriod Total catch Total species(kg/h)Min Max Av Min Max AvJanuary 2006 8.0 18.5 13.7 18 20 19April 2006 3.0 15.5 9.3 13 22 18April 2007 5.0 14.5 9.3 13 22 17October 2007 3.0 18.0 10.3 11 23 18The above data reveals wide fluctuation in fish catch aroundTunda/Vandh which may be due to prevailing natural variation in the coastalwaters in the Gulf.54
4.5.6 Corals and associated biotaThe Tunda/Vandh region also does not sustain reef building corals asthe intertidal area is largely sandy or muddy. Coral growth in the subtidalregion is also unlikely in view of the high suspended load in the water column,the conditions under which corals do not thrive. Reef building corals were alsonot sighted in the subtidal area off Tunda/Vandh.4.5.7 BirdsThe saltpans, islands and intertidal coastal system with mangroves offMundra offer plenty of facilities for feeding, breeding and shelter to a variety ofbirds. The mangroves were often seen crowded with Grey herons, Pondherons, Painted storks, Large and small egrets, Darters, Cormorants etc.During receding tide, hectic activity of various Gulls, Avocets, Whimbrel,Curlew, Terns, Egrets, Grebes, Plovers etc is common.A study carried out during November 1999 revealed high avifaunaldiversity in the Mundra region. On the whole, 140 species were documented;85 terrestrial and 55 aquatic. Out of these, 71 are resident species, 44migrants and another 25 resident migrant. Based on sightings, 21 speciesare reported to be abundant, 42 common, 51 rare and 26 very rare. Thescientific name, common name, abundance status etc of the aquatic birds aregiven in Table 4.5.23. Exotic species like Greater Flamingo (Phoenica pterusruber), Lesser Flamingo (P. minor) and Dalmatian Pelican (Pelecanus cripus)and Eurasian Spoon Bill (Platalea leucorodia) were commonly recorded, thusemphasising the importance of the study site. Dalmatian Pelican, GreaterFlamingo, Lesser Flamingo and Spoon Bills commonly occured in salt pans.4.5.8 ReptilesIn the Gulf, the reptiles are mainly represented by marine turtlesChelonia mydas and Lepidochelys olivacea which have their breeding andspawning ground on the sandy beaches along the coast as well as on theislands particularly along the southern Gulf. No turtle however was sighted inthe waters off Tunda-Vandh during the study period.55
4.5.9 MammalsThe mammals are chiefly represented by dolphin (Dolphinus delphis),whale (Balanoptera spp) and Dugong (Dugong dugon) in the Gulf especiallyalong the Jamnagar coast but not sighted during the study period.56
5 EFFLUENT RELEASEThe total 4000 MW power project envisages water drawl of about 6.3 x10 5 m 3 /h out of which 6.28x 10 5 m 3 /h will be discharged back to the sea fromthe condensers of the power plant. The intake channel that is developed atthe site towards east to the proposed plant location will be used for thecooling water requirement. The channel is located nearly 6 km away and tothe east of the proposed outfall channel.The effluent temperature would be 7 o C above ambient. The salinitywould insignificantly increase by 0.1 ppt. The thermal effluent should besufficiently diluted before it reaches intake during flood tide conditions to avoidrecirculation.5.1 Modeling of temperatureHR Wallingford was assigned with the modeling work for this purpose.A 2D model was used to estimate the plume movement in the vicinity of therelease location. Model bathymetry was selected based on the bathymetrysurvey conducted in April 2008. The eastern and western boundaryconditions (water levels) were taken from the regional model of Gulf ofKachchh. The other inputs are as followsAverage ambient temperature of seawater = 30 CAverage ambient temperature during monsoon = 28.5 CMaximum excess temp rise over ambient in pump house
The model was run giving input and outfall as specified earlier. Thethermal dispersion is presented in the Figures 6.1.3 to 6.1.5. The output ispresented for three scenarios, peak flood, peak ebb and low water conditions.During peak flood period the temperature rise would be around 5 o C aroundthe effluent channel, however the rise would be only 0.5 o C ( Figure 6.1.3) atthe intake channel. This shows that the recirculation is not possible in thepeak flood conditions. The Figure 6.1.4 where the peak ebb conditions areconsidered, the temperature rise at intake channel would be 1 o C aboveambient and the plume would spread around 2 km from the proposed outfalllocation. The results pertaining to lowest low water spring (Figure 6.1.5)denote that the area of the plume with high water temperature would be moreat outfall site as compared to the other two scenarios. However the rise atintake channel would remain 1 o C. From the above results it is found thatnear ambient conditions would be attained at the distance of 3 km from theoutfall channel alignment. The time series of the modeled temperatureindicate that the excess temperature of the seawater in the intake channelwould vary between 0.2 o to 1.4 o C (Figure 6.1.6).58
6 POTENTIAL MARINE ENVIRONMENTAL IMPACTSMajor potential negative marine environmental impacts due to theproposed activities would be largely associated with the (a) construction of theeffluent channel and the coal conveyer belt, (b) deterioration in ecologicalconditions due to operation of the effluent discharge channel and (c)operational activities of the proposed coal conveyer belt. Evidently, potentialnegative impacts on the coastal ecology can arise during the construction aswell as the operational phases of the proposed project.6.1 Construction phase of the effluent channelAdverse impacts of the proposed project on the marine environmentduring construction phase would be due to (a) modifications in thehydrodynamic characteristics of the area, (b) degradation in water andsediment qualities, and (c) loss of biota.6.1.1 Hydrodynamic characteristicsThe effluent release channel would tend to deepen as the waterequivalent to the tidal prism of the channel preferentially uses the deepenedchannel during ebb. As a consequence the intertidal areas around theproposed effluent channel may experience slow but steady deposition. Theoverall impact would be morphological change confined to the intertidal areanear the effluent channel.6.1.2 Water qualityExcavations in the intertidal and subtidal areas for making a channelhas high potential to disperse the bed sediment into the water column therebyincreasing the SS in water and degrading the water quality locally.From Section 4.4.1 it is evident that the subtidal and lower intertidalareas off Tunda-Vandh are composed of sediment with a fair percentage ofsand. Hence these patches may not particularly generate fine SS whendisturbed. The average SS in Tunda-Vandh region is in the range of 70 to 97mg/l. Moreover, SS in the Gulf is inherently high and variable (Section 4.4)rendering the water turbid and muddy. The local increase in SS would be59
confined only to the construction phase and the baseline conditions would bere-established when the construction activity is terminated.In areas where the bed sediment is contaminated, there isapprehension of release of pollutants entrapped in the sediment to the regionwhen the bed is disturbed thereby mixing interstitial water rich in contaminantswith the overlaying water; DO levels might be suppressed and the BOD canincrease because of the release of this interstitial water which also includesoxidisable organic compounds. However, as discussed in Sections 3.3.3 and4.4.2 the sediment off Mundra and Tunda/Vandh is uncontaminated and hasmarkedly low levels of C org . The levels of metals in sediment also largelyrepresent lithogenic contribution (Sections 3.3.3 and 4.4.2). Hence, theconcentrations of DO and BOD are unlikely to be altered due to thesuspension of sediment particles in water. Though the entry of SS has thehigh potential to enhance levels of nutrients and pollutants, since thesediment are low in organic pollutants, contamination of the disturbed watercolumn would not take place. The SS transferred to the water column isexpected to be dispersed and settled fairly quickly and transient pulses will besmothered soon.Several types of floating platforms such as barges, cranes, ships etcwill be deployed in the area during construction. An accident involving suchplatforms may lead to the loss of onboard construction material and fuel.While material may sink to the bed the fuel spill would deteriorate the waterquality of the affected area.The discharges from ships and shore based sources would introducepathogens, BOD, PHc etc to the coastal waters which may degrade the waterquality locally.From the foregoing discussion it is evident that the water quality offTunda/Vandh is unlikely to be adversely influenced during the constructionphase except for minor local perturbations which will level out as theconstructions are completed.60
The possibility of an increase in salinity ingress which is already aserious problem in the Mundra region due to seawater associated with thedredged spoil percolating into the sub-surface strata, is remote since as thesub-soil is already saline and the strata consists of compact soil.The sufficient distance (6 km) between the intake and dischargechannels minimizes the risk of effluent entering the intake channel beforeattaining near ambient conditions of temperature and salinity.6.1.3 Sediment qualityThe sediment excavated for constructing the channels would be redistributedby tidal circulation which may change the texture of the sedimentof nearby areas, particularly of the intertidal region. The impact howeverwould be minor.The dredging to excavate the channel would generate huge quantitiesof dredge spoil. This needs to be disposed off at a selected spoil ground orused for land filling of the site. However, this material should not be used innon-saline environments.Misuse of the intertidal area by workforce employed during constructionphase, can locally degrade the intertidal sediment by increasing BOD andpopulations of pathogens. The impact however would be minor andtemporary and recovery would be quick when the source of this contaminationis eliminated at the end of the construction phase.6.1.4 Flora and faunaHectic construction activities in the intertidal and subtidal areas wouldinfluence the local biotic communities, particularly the macrobenthos along thecorridors selected for seawater intake as well as release of effluent. As thesediment is not enriched in C org (Section 4.4.3), its suspension in the watercolumn is unlikely to deplete DO in this dynamic marine area and DOavailability would not be a constraint for the biotic processes. The danger ofbiota getting exposed to pollutants released from sediment porewater ,when61
the bed is disturbed, is minimal since the sediment of the coastal waters offVandh is free from anthropogenic contaminants (Section 4.4).The intertidal zone near the concerned area of activity is largely sandyand devoid of vegetation. An increase in turbidity due to enhanced levels ofSS can negatively influence the photosynthesis and hence the primaryproductivity. However, the impact if any would be local, temporary andreversible with the phytoplankton community structure quickly reestablishingonce the construction is completed.A temporary and minor reduction in phytoplankton standing stock, if atall, and increase in turbidity is unlikely to produce any negative impact onzooplankton though a localised and marginal change in the communitystructure and population alternations may occur confined to the project area.Such changes are temporary and irrelevant to the overall secondaryproductivity of the coastal system of Tunda-Vandh.Excavations for making the effluent channel would affect benthichabitats along the selected corridor. Based on the results presented inSection 4.5.4 and the area likely to be trenched/disturbed, the probable loss ofstanding stock of macrobenthos during the construction phase is estimated asgiven below.Activity Habitat Area(ha)Population(no x 10 6 )Biomass(kg)Effluent channel Intertidal 45.1 1623 2841.3Subtidal 1.6 3.1 1.1Total 46.7 1626.1 2842.4As evident from above the benthic habitat that would be affected duringthe construction phase would be around 46.7 ha depending on which thelosses were computed. Actual may vary slightly depending on the finalalignment of effluent channel. The loss of intertidal benthos both in terms ofpopulation and biomass would be more as compared to subtidal benthos dueto better representation of faunal standing stock at the intertidal regions as62
compared to subtidal zone. The major components of benthos which wouldbe affected are given below:Area of activity Polychaetes Crustaceans Molluscs(%)(%)(%)Intertidal 37.8 37.9 24.2Subtidal 77.3 22.7 -The above results indicate that polychaete is the major group whichwould be affected at the subtidal zone whereas polychaetes, molluscs andcrustaceans are the major intertidal components which would be affected.However, this loss would be temporary and the benthos wouldrecolonise in due course after the construction activities are terminated. Theoverall loss of benthos which would be temporary and minor compared to thebenthic potential of Gulf off Tunda-Vandh, and such temporary losses are notlikely to be reflected on the overall biopotential of the Gulf system.6.1.5 MiscellaneousAesthetics of the area would deteriorate due to the presence ofconstruction machinery and materials, make-shift huts for labour force, cabinsetc. Left over solid waste generated during construction would be a source ofnuisance if not cleared from the site.The extent of impact on the beach ecology would also depend on theduration of the construction phase. If the construction is prolonged due totime - overruns or improper planning, the adverse influence would increaseaccordingly.Mangrove forests around Mundra are among the best mangroveformations in the Gulf. These mangroves in association with vast mudflatsaround provide congenial environment for migratory as well as resident birds(Sections 3.3.4 and 4.5.1) particularly during November-March. Increase innoise level during construction can disturb these bird populations. Severalspecies of birds use salt pan areas for feeding as well as roosting during high63
tide when the mudflats are submerged under seawater. The adverse impacthowever, would not be serious since additional intertidal areas, mudflats andslat works exist in the region.<strong>Marine</strong> reptiles and mammals common to the area (Sections 3.3.4,4.5.8 and 4.5.9) would not be affected due to construction activities since theytend to migrate temporarily from such sites. Moreover major activity is inshallow areas, where marine and mammals were not sighted during fieldvisits.As mentioned in Section 4.5.5, there are not much commercial fishtrawling operations off Tunda-Vandh. However, drifts and other local nets arecommonly used by local fishermen community. Also some local beaches areused by migrated fishermen temporarily for landing and sun drying. Theseoperations would not be hampered much during the construction activities.The area off Mundra-Tunda/Vandh does not sustain corals thoughfringing corals occur in patches along the southern shore of the Gulf segmentoff Vadinar. These corals are atleast 25-30 km away from Mundra. The natureof circulation in the Gulf with predominant transport along east-west would notpermit the effect of localised perturbations along the northern shore to reachthese corals.6.2 Operational phase of the effluent channel<strong>Marine</strong> environmental implications during the operational phase of theproject would be essentially confined to the i) release of biocides added to thewater used in the plant and ii) adverse influence of release of effluent on thewater quality, sediment quality and flora and fauna of the Gulf.6.2.1 Release of biocidesThe return coolant will contain some residual chlorine used as biocidein the circulation system to prevent biofouling. Release of biocides and otherchemicals mainly chlorine used to control biofouling on heat exchangersurface poses a potential danger to coastal marine organisms because of64
their toxicity. Though they are known to effectively control biofouling, they caneasily kill non target organisms entrained in the cooling system.6.2.2 Water qualityProbable impact of release of treated effluent at the designated sitethrough an open channel on water quality is predicted based on probabledilution the effluent would attain and assuming conservative behaviour ofconstituents in the receiving water. The temperature is not a conservativeproperty and decay due to evaporative and sensible heat losses reduces theimpact outside the channel system. The temperature in a limited areacomprising the discharge channel and its immediate vicinity will however havetemperatures of 4-5 o C above ambient. This increase may not be lethal to theorganisms but proliferation of resistive organisms may change the communitystructure of the biota. The intertidal area however experiences suchtemperatures and salinities even in the normal course.6.2.3 Sediment qualitySome fraction of contaminants such as heavy metals, PHc, phenols etcif present in the effluent would be adsorbed onto the SS which is abundantlyavailable in the proposed area of release thereby enriching the bed sedimenton settling. However, due to high tidal dispersal and efficient advection bystrong currents, this SS would be scattered over a large area. Hence anincrease in the concentration of contaminants in the marine sediments tolevels that cause harm to biota is unlikely.6.2.4 Flora and faunaThe general water quality of the waters off the project domain wouldnot be affected adversely, though limited degradation would result in a smallarea around the discharge channel. Hence, by and large, the biologicalcharacteristics of the surrounding segments would not be affected adversely.Although the concentrations of some contaminants may remain higher in thevicinity of release, the predicted levels are sufficiently below the thresholdconcentrations to cause toxicity to flora and fauna of the effluent receivingsegment.65
Some marine organisms are sensitive to salinity changes and largevariations in salinity can cause harm to them. It is evident from Tables 4.3.1to 4.3.3 that the salinity in the segment between stations 1 and 3 varies from35.7 to 38.0 ppt. Hence, the marine biota in Gulf segment would haveadapted to such fluctuations which are larger than the predicted increase insalinity of 0.1 ppt at the discharge channel mouth. Hence, marine biota wouldnot be affected due to a small increase in salinity.Increase in temperature of the receiving water due to release of warmeffluent is another factor that needs evaluation. This is particularly importantfor the arid environment of the coastal zone off Tunda-Vandh. The high airtemperatures during May and October can increase the water temperature ofthe waters off Tunda-Vandh upto 35 o C (Section 4.3.1) which may adverselyaffect the survival of several marine organisms. Hence, it should be ensuredthat the heat associated with the effluent dissipates rapidly on release. Fromthe model studies it is estimated that the temperature of the water within 2 kmfrom the seaward end of the channel would increase by about 2-3 o C. Such anincrease in temperature is unlikely to adversely affect the biota of the effluentrelease site.The return coolant will contain some residual chlorine used as biocidein the circulation system to prevent biofouling. Free chlorine does not remainstable in seawater and decays on release. However if sufficient dilution is notattained, marine ecology will have a minor and localized impact.6.3 Dumping of dredged materialsThe quantity of material excavated in making the outfall channel wouldbe of the order of 2.0 million m 3 . This quantity will be disposed off as per theplan suggested by Mundra Port. No siltation is expected in the effluentdischarge channel.66
6.4 Construction phase of the coal conveyer beltDuring construction, activities like drilling, concreting, piling andinstallation of support structures, erection of conveyer belt etc will beperformed. Temporarily, some of the environmental parameters may getdisturbed during the construction phase. The impact of each of theseparameters is discussed below.6.4.1 <strong>Impact</strong> on Air qualityThe major source of air pollution during the construction period will befrom the movement of vehicles for construction activity. The emissions will befrom stationary sources like generator sets during emergency service only,and air borne dust emissions from cutting and filling of soil and vehicularmovements. The exhaust emission along with the dust emissions resultingfrom vehicles operating at site will also add to air impact. Dust suppression byspraying of water will reduce these impacts considerably. The emission fromvehicles will depend on the type and capacity of the vehicles used. Theimpact due to additional vehicles plying during the construction period is oftemporary nature and their impact on air quality will not be significant.6.4.2 Noise <strong>Impact</strong>Major sources of the noise pollution due to construction activity will befrom the earth moving, levelling and compacting, trucks for transportation ofconstruction materials, concrete mixers, asphalt mixing and laying equipmentwhich all add to the general noise level. The noise generated from allconstruction activities will be restricted to daytime working hours. Generallythe noise will be limited very much within the site boundary except noise ofpiling work for pile foundation, the trucks entering and leaving the site. Furtherthe noise impact during construction will be temporary in nature. The noiselevel will drop down to the acceptable level, once construction period will beover.67
6.4.3 Water qualityDuring construction, the runoff from the construction site will be asource of water pollution. Such pollution may persist entirely during the initialphase of construction when site grading and excavation for foundation andback filling would be in progress. During this stage the rainwater runoff wouldcarry more soil/silt than normal and this would cause siltation problem in thereceiving water bodies.The other source of water pollution is expected from the sanitary wastecoming from the temporary accommodation of the construction workers ifenvisaged. However, most of the construction workers will be made availablefrom the near by villages and no separate migration of workers is envisagedfor this project. The facilities presently available with the villages will continueto be used during construction activities and no sanitation problem isexpected during construction period. However, on site during working hoursadditional sanitation will be handled by septic tank/pit if required, thearrangement will be made available during the construction phase of theproject.The main source of marine pollution during project construction phasecould be the discharge of sewage into the marine water body, No otherimpacts are envisaged on marine ecology as all the activities of conveyer beltconstruction are on land and away from sea water. The construction activityfor this project component is temporary in nature and not likely to havesignificant impact on the quality of ground water.6.4.4 Land impactThe major impact of any project on land environment during projectconstruction phase generally occurs due to the acquisition of land,construction of approach roads and dumping of construction spoils. Theadverse impacts due to pre-construction activities, e.g. clearing and levelling,generation of construction waste, etc. are expected. However, consideringfootprint of the conveyer belt and the extent of construction activities, impactsare not expected to be significant on this account.68
During construction phase, temporary land acquisition is required forstorage of construction material, siting of construction equipment, storage ofconstruction waste, etc. The land is cleared once the construction phase isover. The proposed land to be utilized during construction phase, i.e. forstorage of construction equipment, construction material etc., shall be cleared,levelled, compacted, on completion of construction activities. The objective ofthe exercise is to obliterate to the extent possible all the visible impacts ofconstruction activities. Thus, no impacts on this account are anticipated.6.5 Operational phase of the coal conveyer beltConveyer belt will be used for conveying coal from Mundra jetty up tostock yard at CGPL. Conveyer belt will be operated on electromechanicalsystem, hence no impact is envisaged during operation phase of the project.There might be minor impact on air due to wind force during high windcondition. Fugitive emission is envisaged which will be very limited in nature.69
7 MITIGATION MEASURES AND ENVIRONMENT MANAGEMENT PLANThe region of Tunda-Vandh identified for effluent release facilities is atypical inshore marine zone of the Kachchh District. No endangered or rarespecies was encountered during field studies. Further, fragile and sensitivehabitats such as mangroves are absent in the vicinity of the proposeddevelopment site. Hence, conventional methods generally recommended formarine areas can be employed for setting-up the effluent release facilities andthe coal conveyer belt with standard mitigation measures to minimise theadverse impacts on marine ecology. The construction and operation phaseenvironmental management plan has been aimed to achieve the followingobjectives:• To ensure that the environmental control systems are installed and areoperating satisfactorily.• To ensure that quality of pollutants discharged if any are within thestipulated standards.• To ensure that pollutants concentration in the surrounding area does notexceed the National Ambient Air Quality Standards NAAQS.• To monitor impacts on the surrounding environment and the effectivenessof mitigation measures during the construction and operation.7.1 Construction phase of effluent channelConstruction of the return coolant discharge channel could change thepattern of littoral drift locally. This change should be minimized by suitablyorienting the channel and adequately designing the side slopes based onmodel studies. Such a study would also aid in incorporating structuralmodifications if required to minimise maintenance cost.Considering the sensitivity of the area, proper care is warranted whiledredging which should be in a controlled manner. Except for the temporarydestruction of macrobenthos along the corridor selected for dischargechannels the impact on the marine ecology during construction phase wouldbe largely confined to the duration over which the activities are spread.Hence, the key factor in minimising adverse impacts would be reduction in the70
construction period at the site and avoidance of spillage of activities beyondthe specified geographical area which should be kept to a minimum.There is a distinct advantage of reduction in time of marineconstruction operations by prefabricating the structures wherever possibleand transporting them to the site. However, the fabrication yard should belocated sufficiently away from the shore and transport of structures to the siteshould be through a predecided corridor. Similarly the movement ofconstruction vessels should be restricted to the operational area only throughproper supervisory controls.Work force employed during construction often misuses the intertidaland supratidal areas. This should be avoided by establishing the temporarycolonies of workers sufficiently away from the HTL and proper sanitationshould be provided to them to prevent abuse of the intertidal region.The noise level during transport and construction of marine facilitiesshould be kept to a minimum. The intertidal and nearshore subtidal areasshould be restored to their original contours once the construction activitiesare completed. General clean-up along the corridor areas should beundertaken and discarded materials including excavated soil should beremoved from the site and the aesthetic quality of surroundings restored oncompletion of the construction phase.The excavation of the channels will produce some amount of dredgespoil (approximately 2.0 million m 3 from discharge channel). This spoil shouldnot be dumped in the intertidal area. A suitable spoil ground is to be found orshould be used for site filling.7.2 Operational phase of effluent channelThe Gulf segment off Tunda-Vandh represents an unpolluted marineenvironment, which should be maintained in future also. Hence, it should beensured that the effluent released into the Gulf meets the prescribed GPCBcriteria at all times. Since, the Gulf segment already sustains high salinity and71
water temperatures, it should be ensured that their levels in the effluent aremaintained as prescribed.It is predicted that the effluent would attain near ambient temperaturesand salinities within 3-4 km when released through a channel based on themodel predictions. Such calculations are based on average environmentalconditions and a few assumptions which cannot be easily verified. Hence, theactual dilution attained should be measured through tracer studies after theeffluent channel becomes operational. Analysis of time series of the modeledtemperature by HRW indicated that the average excess temperature of theseawater in the intake channel under spring - neap cycle calm conditionswould be around 0 - 4 o C (typical time series of temperature variation in intakechannel under spring tide indicated in Figure 6.1.6).Use of the biocides should be kept at the minimum and theirconcentration at the outlet should be regularly tested. If required the useshould be regulated.7.3 Construction phase of coal belt conveyerThe following construction engineering practices are recommended tominimise construction phase environment impacts:a) Use of existing roads for transportation of material. Compaction ofaccess road to minimise dust pollution.b) Proper disposal of construction wastes generated during constructionof coal conveyer belt.c) Adequate erosion control plans to minimise soil erosion.d) Minimise noise by using appropriate noise control measures.e) Spraying of dust suppressants at regular intervals.72
f) Sedimentation pond and peripheral drains for the runoff water from theconstruction site.g) STP for workers colony.h) Afforestation program.i) Use of high quality equipments for construction.j) Ban on use of vehicles more than 15 years of age.7.4 Operational phase of the coal belt conveyerAll the equipment shall be suitable for handling wet and sticky coalduring monsoon season with moisture content of 35% and fines up to 40% sothat pollution due to jamming of conveyer can be avoided. All the equipmentsand conveyers shall be designed for handling coal of (-) 50mm to avoid dustpollution. Self aligning carrying and return idlers shall be provided at aninterval of 24m to avoid unnecessary spillage of coal from belt conveyer. Allthe chutes shall be constructed out of 20mm Tiscral/SAIL hard material. Thesize of the chute shall be sufficiently bigger to avoid any build up of coal withhigh moisture. All conveyers shall be provided with open galleries with hoodcovering the belt to avoid dust nuisance. The clear width of walkway shall be1200mm on one way and 800mm on the other side. Wind guard shall beprovided to avoid flapping/lifting of the belt. Inspection and maintenancedoors/poking holes at suitable location shall be provided for all chutes.Platform with ladder shall be provided to facilitate poking so that jamming andthus material spillage can be avoided.7.4.1 Dust suppression (DS) SystemThere shall be two (2) service water pumps (1 working + 1 Standby)which supply water to (a) local water storage tanks of DS system of stockyard, junction towers etc., (b) service water tap points for plant cleaning,toilets etc. Each DS system shall be provided with two (1 working + 1 standby)pumps. The quantity of water to be sprayed for the stockyard DS systemsshall be calculated for a section of 90 meter length wherein a set of sprinklersoperates simultaneously. The DS system at conveyer transfer points shall be73
dry fog type using compressed air. Globe valves shall be provided at eachsprinkler. The operation of each section of sprinklers shall be sequential.Service water piping with tap off points (with isolating valve and quickconnecting coupling) shall be provided for each floor of junction towers. Two(2) points per floor in junction tower shall be provided. Flexible hoses of 20mlong each shall be provided with storage boxes. Service water piping shall beprovided all along the galleries with tap off points at 30m interval with flexiblehose. Each tap off point shall contain isolating valve with quick connectingcoupling to enable fixing of hoses. Each water spray header in DS systemshall be provided with a solenoid valve to stop water spray when theconcerned pant and equipment of coal handling system do not operate.Each DS system shall be operated from local control panel and shallbe interlocked with the respective conveyer/ equipment. The pipes forstockpile dust suppression system shall be buried below ground and suitableprotection like wrapping shall be provided. Pipes at road crossing shall beprovided in RCC Hume pipes.7.4.2 Coal Yard DrainageAround the coal stock yard, drainage channels shall be constructed totake all the effluent from the coal stock yard which shall be ultimately led to acoal pile run off pit. Coal particles shall settle down in this sump. The overflowfrom the sump shall be lead to the plant drains. The coal pile run off pit shallbe suitable for storing about 10 hrs rainwater falling in the stockpile areabased on the climatologically data. This shall be RCC construction. Twopumps (1W+1S) shall be provided in this coal pipe run off pit to discharge thewater at final disposal point7.5 <strong>Environment</strong>al Management Plan (EMP)Important features of the <strong>Environment</strong> Management Plan are thefollowing:a) <strong>Environment</strong> management cellb) Ambient air and noise quality monitoringc) Water quality monitoring74
d) Meteorological data collectione) Afforestation programf) Periodic preventive maintenance & occupational safety and health7.5.1 <strong>Environment</strong>al Management CellThe major environmental considerations involved in the constructionand operation of the thermal power station and related accessories likeconveyer belt, intake outfall channel, transmission network, etc. are taken upby a full-fledged multi disciplinary <strong>Environment</strong>al Management Division (EMD)with key functions of environmental, safety and occupational health formanagement of the entire plant and surrounding environment. At CGPL EMDis already in place with team of environmental engineers, chemists,horticulturists, safety specialists and well-trained staff for operation andmaintenance of pollution control equipment. Staff training programmes in theareas of environment, ambient air, water quality monitoring, solid wastemanagement, noise abatement, safety and health aspects are conductedregularly.7.5.2 <strong>Environment</strong>al Monitoring ProgrammeAn environmental monitoring programme is already in place to providescientifically defensible information for determining the status of theenvironmental quality of the surrounding area and to check whether the levelsof critical pollutants are within the environmentally acceptable limits. This willhelp obtain an early warning of unacceptable environmental conditions so thatcontrol measures can be taken immediately. It also helps to determine in atimely fashion, changes in the local environmental quality. The environmentalmonitoring programme includes ambient air quality monitoring, meteorologicaldata collection, water quality monitoring, soil testing and sea water monitoring.It is necessary to monitor the marine environment periodically andidentify the perturbations if any to take appropriate follow-up action.a) Baseline quality75
To understand seasonal variations it is necessary to conduct periodicinvestigations, ideally monthly, but at least seasonally at carefully selectedmonitoring locations. These should include subtidal as well as intertidalsegments. In the present case, the station 2 should be adequate to representthe subtidal environment while intertidal transects in the vicinity of the plantutilities alongwith a transect sufficiently away from this area should beselected for evaluation of the intertidal ecology. Till a proper baseline isestablished, the data presented in this report can be considered for comparingthe results of future monitoring. The monitoring however should be confinedto the month in which the data are collected. Selected stations including theeffluent disposal location should be sampled diurnally during the monitoringprogramme. The parameters to be monitored are listed below:Physical processes: Tides, currents and circulation in the project domainshould be studied. Bathymetric surveys by echo sounding in both the intakeand discharge channels should be undertaken to delineate erosion anddeposition.Water quality: Water samples obtained from 2 levels in the vertical when thedepths exceed 3 m, should be studied for temperature, pH, SS, turbidity,salinity, DO, BOD, (or total organic carbon), nitrate, nitrite, ammonia,dissolved phosphate, PHc and phenols. For shallow waters, only surfacesamples can be analysed.Sediment quality: Sediment from subtidal and intertidal regions should beanalysed for texture, C org , phosphorus, chromium, nickel, copper, zinc,cadmium, lead, mercury, arsenic and PHc.Flora and fauna: Biological characteristics should be assessed based onprimary productivity, phytopigments, phytoplankton populations and theirgeneric diversity; biomass, population and group diversity of zooplankton;biomass, population and group diversity of benthos and fish quality.b) Post-project monitoring76
A comprehensive marine quality monitoring programme with periodic(premonsoon and postmonsoon) investigations at predetermined locations(these should coincide with those used for the baseline quality) by aspecialised agency is a practical solution to ensure quality data acquisition.This can be a continuation of the study designed for baseline quality andsome parameters listed above should be included in the post-projectmonitoring programme.The results of each monitoring should be carefully evaluated to identifychanges if any, beyond the natural variability identified through the baselinestudies. Gross deviation from the baseline may require a thorough review ofthe effluent disposal scheme to identify the causative factors leading to thesedeviations and accordingly, corrective measures to reverse the trend would benecessary.7.5.3 Afforestation programAfforestation is a key element in environment conservation andprotection. At CGPL afforestation programme is already in place, Theestablishment of a vegetation covering will result in many direct and indirectbenefits such as:(a)(b)(c)(d)(e)Vegetation can absorb dust pollution and also attenuates the noiselevels.Vegetation will be able to control the build-up of atmospheric pollutantsthat are emitted during construction.Afforestation will help restore the ecodynamics around the plant. Itchecks soil erosion.A green belt will also compensate the vegetation loss during theconstruction phase and will help in reclamation of land used for ashdisposal.Provision of one third land of the project area will help in complyingwith the statutory requirements.77
8 SUMMARY AND CONCLUSIONCGPL has embarked on developing the infrastructure for a 4000 MWthermal power project proposed to be set up at Mundra for which they hadobtained CRZ clearance for intake and outfall channels. It now proposes todraw water to the tune of 6.3 x 10 5 m 3 /h for cooling and other purposes fromthe common intake channel constructed by APL as suggested by the NIO. Asa result, due to engineering reasons CGPL requires to change the dischargelocation. M/s CGPL has approached the National Institute of Oceanography(NIO) to obtain baseline data covering the new discharge location and topredict the marine environmental impacts based on the modeling reports thatwill be made available to NIO.The studies presented in this report have been carried out by the NIOwith the objectives of evaluating the prevailing hydrodynamics and ecologicalstatus of the coastal water adjacent to the project site, assessing the impact ofeffluent release and coal conveyer system on marine ecology andrecommending suitable marine environmental management plan to minimizeany adverse impact on marine area.8.1 Project informationThe project site is in the vicinity of Mundra SEZ about 25 km from theMundra Port and 1.5 km from the coast of the Gulf of Kachchh. The proposedproject consists of five power plant units totaling to 4000 MW gross capacity,utilising imported coal as fuel. Fresh water for the plant, potable water, servicewater and feed water to the DM plant and other services will be met by thedesalination plant. A once through cooling system with sea water is preferredfor the plant. The circulating system will be designed to attain temperature ofless than +7 o C above the ambient seawater temperature.Desalination plant reject will be partly utilized for pretreatment plantbackwash and the balance will be led into the discharge channel. Thedesalination plant reject water (1727 m 3 /h) with high TDS will get diluted in theCW discharge channel. Pre-treatment plant filter backwash and clarifiersludge will be collected and disposed off to the discharge channel. The power79
plant being once through cooling type, the seawater is led back to the sea atthe rate of about 6.28 x 10 5 m 3 /h. The discharge channel is designed to coolthe water over a length of about 1950 m and has a capacity of 6.30 x 10 5m 3 /h . The quantity of material excavated in making the outfall channel wouldbe of the order of 2 million m 3 . This quantity will be disposed off as per theplan suggested by Mundra Port. No siltation is expected in the dischargechannel.8.2 Gulf of KachchhThe Gulf occupies an area of 7300 km 2 , has maximum depth thatvaries from 20 m at the head (Kandla - Navlakhi) to 60 m in the outer regions.Kachchh District is industrially backward with a few industrial establishments.Tides in the Gulf are of mixed, predominantly semidiurnal type with alarge diurnal inequality. The tidal front enters the Gulf from the west and dueto shallow inner regions and narrowing cross-section, the tidal amplitudeincreases considerably, upstream of Vadinar. The phase lag between Okhaand Kandla is 2 h to 2 h 25 min while between Okha and Navlakhi it is 3 h to 3h 20 min. Due to high tidal ranges in the inner regions, the vast mudflats andcoastal lowlands that get submerged during high tide are fully exposed duringlow tide. Circulation in the Gulf is mainly controlled by tidal flows andbathymetry, though wind effect also prevails to some extent. The maximumsurface currents are moderate (0.7-1.2 m/s) but increase considerably (2.0-2.5 m/s) in the central portion of the Gulf. With high tidal range, negligible landrun-off and irregular topography, the waters are vertically homogeneous interms of salinity and temperature.The annual variation of water temperature is between 23 and 30 o Cthough localised higher temperatures upto 35 o C can result in isolated waterpools formed in shallow intertidal depressions, during low tide. SS is highlyvariable (5-700 mg/l), spatially as well as temporally, and largely result fromthe dispersion of fine sediment from the bed and the intertidal mudflats, bytidal movements. Average pH of the Gulf water is remarkably constant (8.0-8.3) and is within the range expected for the coastal tropical seas. The80
evaporation exceeds precipitation leading to salinities markedly higher thanthat of the typical seawater. This is particularly evident in the inner Gulf wheresalinities as high as 40 ppt commonly occur off Kandla and Navlakhi. Theaverage DO is fairly high (3-5 ml/l) and the BOD is low (
Because of its high biogeographical importance and rich flora andfauna, several areas along the southern Gulf are notified under the <strong>Marine</strong>National Park (16289 ha) and the <strong>Marine</strong> Sanctuary (45798 ha).8.3 Site specific marine environmentThe assessment domain of the present study involved the section ofthe Gulf off Tunda-Vandh. The area proposed for the development of powerplant of CGPL falls between two ephemeral rivulets namely Khari Nadi in thewest and Wae a contributory of Nagavati river in the east. There are twomoderate size villages Tunda (in the east) and Vandh (in the west) in thevicinity of the project site. The prominent vegetation in the area is mainlycomposed of Babool (Presopsis julifolia) and stray mangroves. Local fishingcommunity uses the navigable creeks for their country crafts during high tideand use sandy beaches around for beaching their shallow draft crafts.The time of occurrence of flood and ebb tide at Mundra lead by 27 and46 min respectively with respect to the Kandla tide. The tidal range ratio(Mundra : Kandla) is 0.83 and 0.88 for spring and neap tides respectively. Thetidal range in the Kotdi Creek varied from 1 to 3.5 m with the time lag of 5 to10 min as compared to the phase of the tide at the Mundra Port. The tide offTunda-Vandh is comparable in amplitude to that of Mundra.The maximum current speed observed off the Kotdi Creek is 0.8 m/s.The U component of the currents (Northward) is stronger than the Vcomponent indicating weak lateral transport, as expected. The maximumcurrent speed varies from 0.5 to 1.2 m/s in the Gulf off the project site. Thepredominant direction of the current is 45 o during flood and 220 o during ebbtide conditions. The circulation off the project site is generally elliptical with themajor axis in the east-west direction. The excursion lengths vary in 10 to 15km range depending on the tidal phase (neap or spring).The water quality in the nearshore water off Tunda-Vandh wasassessed during December 2008.82
The water temperature varied in the range of 19 – 30.1 o C in the studyarea. Under the influence of buffering action of CO 2- 3 /HCO - 3 /CO 2 system thepH of water was fairly constant (av 8.0). The SS was variable; the maximumvalue recorded being 252 mg/l. In the absence of freshwater inflow the salinity(ppt) in the waters off Vandh was markedly high (35.9 to 38.0 ppt). Surface tobottom variations were minor and the waters are well-mixed vertically. TheDO varied from 2.9 to 5.4 ml/l and was generally >3.0 ml/l suggesting goodecological conditions. The nutrients such as phosphate, nitrate, nitrite andammonia as well as PHc and phenol are low and in the range expected forthe Gulf. The overall assessment indicates that the water quality off Vandhhas not measurably altered over the years.The surface 1.5 m layer of the intertidal segment typically containsaround 90% sand with silt and clay in minor proportions. The concentrationsof chromium, cobalt, nickel, copper, zinc, mercury, organic carbon,phosphorus and PHc were in the expected ranges for the Gulf indicatinguncontaminated nature of the sediment.The marine alga Enteromorpha sp commonly occured in the intertidalarea off the project site while seagrasses were dominated by Halophila ovataand Halodule uninervis. The major land portion proposed for the developmentfalls under saline bank which was devoid of mangrove vegetation. No dunesor dune vegetation occur around the proposed discharge channels.The levels of chlorophyll a and phaeophytin varied in wide range in thecoastal ecosystem off Vandh. The generic diversity of phytoplankton variedfrom 13 to 19 in the area. Overall, about 31 genera of phytoplankton arerecorded with the dominance of Fragilaria, Thalassiosira, Thalassionema,Pleurosigma, Navicula, Nitzschia, Peridinium, Melosira and Thalassiothrix.The zooplankton standing stock in terms of biomass and population revealsgood secondary production in the coastal waters. The zooplankton communitystructure reveals the dominance of copepods and decapod larvae. The othercommon groups are foraminiferans, siphonophores, medusae, ctenophores,83
chaetognaths, polychaetes, ostracods, mysids, Lucifer, gastropods,lamellibranches and appendicularian. The intertidal macrobenthic standingstock in terms of population (av 3504/m 2 ) and biomass (av 7.7 g/m 2 wet wt)varied widely. Total faunal groups are comparable both in creeks and Gulfsegment. The average standing stock of subtidal macrobenthos at the studyarea both in terms of biomass (av 0.7 g/m 2 ; wet wt) and population (315/m 2 ) islow.During experimental fishing in April 2007 off the project site the fishcatch rate varied between 5.0 and 14.5 kg/h. This catch consisted of 27species of fishes, 9 species of prawns and 5 species of other miscellaneousgroups. Harpadon nehereus, Johnius glaucus, Coilia dussumieri, Ariuscaelatus, Otolithes sp, Pampus argentius, Scoliodon laticaudus, Thryssa sp,Otolithus sp, Exhippolysmata ensirostris, Neptunus pelagicus andMetapenaeus sp were recorded as the dominant species. The Vandh regiondoes not sustain reef building corals as the intertidal area is largely sandy ormuddy. Coral growth in the subtidal region is also unlikely in view of the highsuspended load in the water column, the conditions under which corals do notthrive. The saltpans, islands and intertidal coastal system with mangroves offVandh offer plenty of facilities for feeding, breeding and shelter to a variety ofbirds. In the Gulf, the reptiles are mainly represented by marine turtlesChelonia mydas and Lepidochelys olivacea. No turtle however was sighted offMundra during the study period. The mammals are chiefly represented bydolphin (Dolphinus delphis), whale (Balanoptera spp) and Dugong (Dugongdugon) in the Gulf especially along the Jamnagar coast. These were notsighted during the study period off Vandh.8.4 Effluent releaseThe total 4000 MW power project envisages water drawl of about 6.30x 10 5 m 3 /h out of which 6.28 x 10 5 m 3 /h will be discharged back to the seafrom the condensers of the power plant. The intake channel, that isdeveloped at the site towards east to the proposed plant location, will be usedfor the cooling water requirement. The channel is nearly 6 km away from theproposed outfall channel. The effluent temperature would be 7 o C above84
ambient. The salinity would have a small increase of 0.1 ppt. The thermaleffluent should be sufficiently diluted before it reaches intake during ebb tideconditions to avoid recirculation.HR Wallingford was assigned with the modeling work for this purpose.A 2D model was used to estimate the plume movement in the vicinity of therelease location. Model bathymetry was selected basing on the bathymetrysurvey conducted in April 2008. The eastern and western boundaryconditions (water levels) were taken from the regional model of Gulf ofKachchh.From the model results it is found that near ambient conditions wouldattained at the distance of 3 km from the outfall channel alignment. The timeseries of the modeled temperature indicate that the excess temperature of theseawater in the intake channel would vary between 0.2 o to 1.4 o C. Analysis oftime series of the modeled temperature by HRW indicate that the averageexcess temperature of the sea water in the intake channel under spring –neapcycle calm conditions would be around 0.4 o C.8.5 Potential marine environmental impactsMajor potential negative marine environmental impacts due to theproposed activities would be largely associated with the (a) construction of theeffluent channel and the coal conveyer belt, (b) deterioration in ecologicalconditions due to effluent release and operational activities of the proposedcoal conveyer belt. Evidently, potential negative impacts on the coastalecology can arise during the construction as well as the operational phases ofthe proposed project.Construction phase of the effluent channelAdverse impacts of the proposed project on the Gulf environmentduring construction phase would be due to (a) modifications in thehydrodynamic characteristics of the area, (b) degradation in water andsediment qualities, and (c) loss of biota.85
Excavations in the intertidal and subtidal areas for making a channelhas high potential to disperse the bed sediment into the water column therebyincreasing the SS in water and degrading the water quality locally. Thesubtidal and lower intertidal areas off Tunda-Vandh are composed ofsediment with a fair percentage of sand. Hence these patches may notparticularly generate fine SS when disturbed. Moreover, SS in the Gulf isinherently high and variable rendering the water turbid and muddy. The localincrease in SS would be confined only to the construction phase and thebaseline conditions would be re-established when the construction activity isterminated. The dredging to excavate the channel would generate substantialquantities of dredge spoil which will have to be adequately disposed and notused in non-saline environments.Misuses of the intertidal area by workforce employed duringconstruction phase can locally degrade the intertidal sediment by increasingBOD and populations of pathogens. The impact however would be minor andtemporary and recovery would be quick when the source of this contaminationis eliminated at the end of the construction phase.Hectic construction activities in the intertidal and subtidal areas wouldinfluence the local biotic communities, particularly the macrobenthos along thecorridors selected for seawater intake as well as release of effluent. As thesediment is not enriched in C org , its suspension in the water column is unlikelyto deplete DO in this dynamic marine area and DO availability would not be aconstraint for the biotic processes. The danger of biota getting exposed topollutants released from sediment porewater, when the bed is disturbed, isminimal since the sediment off Vandh is free from anthropogeniccontaminants.An increase in turbidity due to enhanced levels of SS can negativelyinfluence the photosynthesis and hence the primary productivity. However,the impact if any would be local, temporary and reversible with thephytoplankton community structure quickly reestablishing once theconstruction is completed. A temporary and minor reduction in phytoplankton86
standing stock, if at all, and increase in turbidity is unlikely to produce anynegative impact on zooplankton though a localised and marginal change inthe community structure and population alternations may occur confined tothe project area. Such changes are temporary and irrelevant to the overallsecondary productivity of the region.Excavation for making the channel would have significant negativeimpact on benthic habitats which would be destroyed along the selectedcorridors. A total loss of 2842 kg of macrobenthic biomass is estimated fromthe dredging of the effluent channel. This loss would be temporary and thebenthos would recolonise in due course after the construction activities areterminated.Aesthetics of the area would deteriorate due to the presence ofconstruction machinery and materials, make-shift huts for labour force, cabinsetc. Left over solid waste generated during construction would be a source ofnuisance if not cleared from the site. The extent of impact on the marineecology would also depend on the duration of the construction phase. If theconstruction is prolonged due to time - overruns or improper planning, theadverse influence would increase accordingly. Since there are no commercialfishing operations off Tunda-Vandh except shore based local fishing, theimpact on fisheries would be minor and non-consequential.Operational phase of the effluent channel<strong>Marine</strong> environmental implications during the operational phase of theproject would be essentially confined to the adverse influence of release ofeffluent on the water quality, sediment quality and flora and fauna of the Gulf.The temperature in a limited area comprising the discharge channeland its immediate vicinity is predicted to be 4-5 o C above ambient. Thisincrease may not be lethal to the organisms but proliferation of resistiveorganisms may change the community structure of the localized zone. Theintertidal area however experiences such temperatures and salinities even inthe normal course.87
Some fraction of contaminants such as heavy metals, PHc, phenols etcif present in the effluent would be adsorbed onto the SS which is abundantlyavailable in the proposed area of release thereby enriching the bed sedimenton settling. However, due to high tidal dispersal and efficient advection bystrong currents, this SS would be scattered over a large area. Hence anincrease in the concentration of contaminants in the marine sediment to levelsthat cause harm to biota is unlikely.The quantity of material excavated in making the outfall channel wouldbe of the order of 2.0 million m 3 . This quantity will be disposed off as per theplan suggested by Mundra Port. No siltation is expected in the effluentdischarge channel.Construction phase of the coal conveyer beltThe major source of air pollution during the construction period will bethe emissions from stationary sources like generator sets during emergencyservice only, and air borne dust emissions from cutting and filling of soil andvehicular movements. Dust suppression by spraying of water will reducethese impacts considerably. The impact due to additional vehicles plyingduring the construction period is of temporary nature and their impact on airquality will not be significant.Major sources of the noise pollution due to construction activity will befrom the earth moving, levelling and compacting, trucks for transportation ofconstruction materials, concrete mixers, asphalt mixing and laying equipmentwhich all add to the general noise level. The noise generated from allconstruction activities will be restricted to daytime working hours. Noise impactduring construction will be temporary in nature. The noise level will drop downto the acceptable level, once construction period will be over.During construction, the runoff from the construction site will be asource of water pollution. The other source of water pollution is expected fromthe sanitary waste coming from the temporary accommodation of theconstruction workers if envisaged. However, most of the construction workers88
will be made available from the near by villages and no separate migration ofworkers is envisaged for this project. However, on site during working hoursadditional sanitation will be handled by septic tank/pit if required, thearrangement will be made available during the construction phase of theproject.Operational phase of the coal conveyer beltConveyer belt will be used for conveying coal from Mundra jetty up tostock yard at CGPL and will be operated on electromechanical system, henceno impact is envisaged during operation phase of the project.8.6 Mitigation measures and EMPThe segment of Gulf off Vandh proposed for the setting-up of effluentrelease facilities is a typical nearshore marine zone of the Kachchh District.No endangered or rare species was encountered during field studies orreported in these creeks. Further, fragile and sensitive habitats such asmangroves are absent in the immediate vicinity of the proposed developmentsite. Hence, conventional methods recommended for marine areas can beemployed for setting-up the effluent release facilities and the coal conveyerbelt with standard mitigation measures to minimise the adverse impacts onmarine ecology.Construction phase of the effluent channelExcept for the temporary destruction of macrobenthos along thecorridors selected for discharge channels the impact on the marine ecologyduring construction phase would be largely confined to the duration overwhich the activities are spread. Hence, the key factor in minimising adverseimpacts would be reduction in the construction period at the site andavoidance of spillage of activities beyond the specified geographical areawhich should be kept to a minimum. There is a distinct advantage of reductionin time of marine construction operations.Work force employed during construction often misuses the intertidaland supratidal areas. This should be avoided by establishing the temporary89
colonies of workers sufficiently away from the HTL and proper sanitationshould be provided to them to prevent abuse of the intertidal region. Thenoise level during transport and construction of marine facilities should bekept to a minimum.The intertidal and nearshore subtidal areas should be restored to theiroriginal contours once the construction activities are completed. Generalclean-up along the corridor areas should be undertaken and discardedmaterials including excavated soil should be removed from the site and theaesthetic quality of surroundings restored on completion of the constructionphase.The excavation of the channel will produce substantial amounts ofdredge spoil. This spoil should not be dumped in the intertidal area and asuitable strategy must be decided for disposal of the material.Operational phase of effluent channelThe Gulf segment off Tunda-Vandh represents an unpolluted marineenvironment, which should be maintained in future also. Hence, it should beensured that the effluent released into the Gulf meets the prescribed GPCBcriteria at all times.It is predicted that the effluent would attain near ambient temperaturesand salinities within 3-4 km when released through a channel based on themodel predictions. Such calculations are based on average environmentalconditions and a few assumptions which cannot be easily verified. Hence, theactual dilution attained should be measured through tracer studies after theoutfall becomes operational. The effluent release process can then beadequately modified to ascertain necessary dilution. Analysis of time series ofthe modeled temperature by HRW indicate that the average excesstemperature of the seawater in the intake channel under spring-neap cyclecalm conditions would be around 0.4°C. The surrounding segment of Gulf isnot an important navigational route though local craft and fishing vesselsoperate in the region. Hence, as a navigational safeguard, the seawater90
effluent release location should be adequately identified with marker buoys.Use of biocides should be kept at the minimum and their concentration at theoutlet should be regularly tested.Construction phase of coal belt conveyerEngineering practices such as proper disposal of construction wastes,adequate erosion control plans, noise control measures, spraying of dustsuppressants, STP, afforestation program and usage of high qualityequipments for construction are recommended to minimise constructionphase environmental impacts.Operational phase of coal belt conveyerAll the equipments and conveyers shall be designed for handling coalof (-) 50mm to avoid dust pollution. Self aligning carrying and return idlersshall be provided at an interval of 24m to avoid unnecessary spillage of coalfrom belt conveyer. All conveyers shall be provided with open galleries withhood covering the belt to avoid dust nuisance. Wind guard shall be providedto avoid flapping/lifting of the belt. Inspection and maintenance doors/pokingholes at suitable location shall be provided for all chutes. Platform with laddershall be provided to facilitate poking so that jamming and thus materialspillage can be avoided.An environmental monitoring programme is already in place to providescientifically defensible information for determining status of theenvironmental quality of the surrounding area and to check whether the levelsof critical pollutants are within the environmentally acceptable limits. Theenvironmental monitoring programme includes ambient air quality monitoring,meteorologically data collection, water quality monitoring, soil testing andseawater monitoring.A comprehensive marine quality monitoring programme with periodicinvestigations at predetermined locations must be undertaken. The results ofeach monitoring should be carefully evaluated to identify changes if any,beyond the natural variability identified through the baseline studies. Gross91
deviation from the baseline may require a thorough review of the effluentdisposal scheme to identify the causative factors leading to these deviationsand accordingly, corrective measures to reverse the trend would benecessary.The change in location of discharge point is expected to have nosignificant impact during the operational phase of the power plant on thesurrounding marine environment with the implementation of the proposedEMP.92
Table 3.2.1: Details of cyclonic storms along North Gujarat coast (1893-1999).Year Month Intensity Point ofOriginTrack followed1893 Nov Str-SStr Arabian Sea Veraval-Bhavnagar1894 Oct SStr Arabian Sea Jafarabad-S.Gujarat1896 Nov SStr Indian Ocean Off Jafarabad-Bhopal-Allahabad1897 Jul Depr Arabian Sea Off Jafarabad-Veraval-Gulf of Kachchh1897 Sep Depr Off Diu Veraval-Off Dwaraka-NW1903 Jul Str Arabian Sea Off Jafarabad-Veraval-North1909 Sep Depr Bay of Bengal Surat-Jafarabad-Kandla-NW1920 Jun SStr Arabian Sea Veraval-Ahmedabad1925 Jun Depr Arabian Sea Off Veraval-Kandla-Bhopal-Allahabad1925 Jun Depr Arabian Sea Bharuch-Bhavnagar-Okha1926 Sep Depr Off Veraval Veraval-N-W-N1933 May Depr Arabian Sea Veraval-N1934 Oct Depr Arabian Sea Dissipated Off Jafarabad1935 Jun Depr Bay of Bengal Gulf of Khambhat1944 Aug Str Bihar Ahmedabad-Kandla-Off Jafarabad-W1944 Oct Depr Bay of Bengal Pune-Mumbai-Off Jafarabad-Ahmedabad1947 Apr SStr Off Cochin Arabian Sea-Bharuch-along the Westcoast1948 Sep SStr Bay of Bengal Mumbai-Off Diu-Porbandar1954 Jul Depr Off Jafarabad Vadinar-Karachi1959 Oct Depr-Str Arabian Sea Jafarabad-Veraval-across the ArabianSea-Oman1960 Jul Depr Off Veraval Off Dwarka-Mandwa1962 Sep Depr Bay of Bengal Surat-Jafarabad-Dwarka-Mandwa
Table 3.2.1 (Contd.2)Year Month Intensity Point ofOriginTrack followed1964 Aug Str Arabian Sea Jafarabad1969 Jun Depr Arabian Sea Jafarabad-Bhavnagar1973 Jul Depr Off Diu Veraval-Porbandar-Vadinar-N1975 Jun Depr Off Jafarabad Okha-W1976 May-Jun SStr Arabian Sea Jafarabad-Ahmedabad1982 Nov Depr Arabian Sea Veraval-Ahmedabad-NE1983 Jun Depr Off Veraval Veraval-Rajkot1985 Oct Depr Off Mumbai Jafarabad-W of BhavnagarJafarabad-Surat-NE1989 Jun Depr Off Veraval Junagadh-Rajkot-Navlakhi-Vadinar-NW1996 Jun SStr Kandla Kandla-Rajkot1996 Oct SStr Arabian Sea Kandla-Veraval-Jafarabad1998 June SStr Arabian Sea Porbandar-Jamnagar-Kandla1999 June SStr Arabian Sea Porbandar-Dwarka-JakhauIntensity (Wind speed)Depression (Depr) : Upto 61 km/h.Storm (Str) : 62-87 km/h.Severe Storm (SStr) : 89-117 km/h.
Table 3.3.1: Water quality of the Gulf during premonsoon (1993-2004).Parameter Level Okha Salaya Vadinar SikkaFeb 1993 Mar 1995 Apr 2002 July 2004 Feb 1995 April 2002 Mar 1994 Mar 1996 Apr 1994 Apr 2002 Apr 2003Temp ( o C) S 25.5-26.5 25.3-25.5 24.9-27.5 31.0* 24.0-26.0 25.0-27.5 26.0-28.5 25.0-29.2 25.4-27.8 24.4-27.6 28.0-28.7(26.0) (25.4) (26.2) (25.0) (26.2) (27.0) (27.1) (26.8) (26.0) (28.4)B 25.8-26.5 24.9-25.0 24.9-27.5 30.4* 23.0-25.0 25.9-26.34 26.0-27.5 24.6-29.3 25.3-27.8 24.0-27.5 26.9-27.0(26.1) (25.0) (26.2) (24.0) (26.3) (27.0) (26.8) (26.6) (25.8) (27.0)pH S 8.0-8.3 8.0* 8.0-8.2 8.1* 7.9-8.2 8.2-8.4 7.8-8.0 8.0-8.3 8.0-8.1 8.0-8.4 8.1-8.1(8.2) (8.1) (8.1) (8.3) (7.9) (8.0) (8.0) (8.2) (8.1)B 8.2-8.3 8.0* 8.2-8.2 8.1* 8.0-8.3 8.3-8.4 7.8-8.0 8.0-8.3 8.0-8.1 8.2-8.4 8.2-8.2(8.3) (8.2) (8.2) (8.3) (8.0) (8.2) (8.1) (8.3) (8.2)SS (mg/l) S 27-31 17* 16-29 78 19-38 15-33 18-35 9-17 18-29 14-17 18-22(29) (23) (28) (24) (22) (13) (23) (16) (20)B 31* 16* 16-35 84 21-46 16-56 22-26 8-20 19-32 16-50 6-18(26) (33) (36) (24) (13) (21) (33) (12)Salinity (ppt) S 37.2-38.5 36.2* 37.5-38 35.7* 36.1-37.5 37.6-38.4 37.4-38.6 36.6-37.4 37.1-37.7 36.9-38.5 39.2-39.4(37.9) (37.7) (36.8) (38.0) (37.9) (37.0) (37.3) (37.7) (39.3)B 36.8-38.5 36.8* 37.5-38.0 35.6* 36.2-37.5 37.9-38.4 37.3-38.3 36.4-37.8 36.9-37.5 37.4-38.5 39.4-39.4(37.7) (37.7) (36.8) (38.1) (37.9) (37.2) (37.2) (37.9) (39.4)DO (ml/l) S 2.9-3.6 4.0-4.3 2.2-5.2 4.1* 4.3-5.4 1.8-5.6 3.4-5.3 3.8-5.3 3.2-4.8 1.8-5.6 4.6-4.8(3.3) (4.1) (2.3) (4.8) (3.7) (4.6) (4.6) (4.4) (3.7) (4.7)B 2.9-3.3 4.6 2.5-5.8 4.4* 2.9-5.0 1.8-5.6 3.8-4.9 4.0-5.5 3.4-4.8 1.6-5.4 4.6-4.8(3.1) (4.6) (4.1) (3.9) (3.7) (4.4) (4.7) (4.3) (3.5) (4.7)BOD (mg/l) S 1.4-3.7 1.5* 0.2-3.5 3.8* 1.1-4.3 1.0-4.3 1.7-3.3 1.0-1.7 2.7-3.8 1.0-4.1 -(2.5) (1.8) (2.7) (2.6) (2.5) (1.4) (3.2) (2.5)B 0.2* - 0.3-4.2 3.0* 0.3-0.6
Table 3.3.1 (Contd 2)Parameter Level Okha Salaya Vadinar SikkaFeb 1993 Mar 1995 Apr 2002 July2004 Feb 1995 Apr 2002 Mar 1994 Mar 1996 Apr 1994 Apr 2002 Apr 2003P Total (µmol/l) S - - - - - - 0.8-3.2 - - - -(2.0)B - - - - - - 1.4-3.2 - - - -(2.3)NO - 3 -N (µmol/l) S 1.2-4.4 6.9-7.9 4.2-10.7 13.0* 1.1-3.6 0.7-6.0 0.1-1.4 1.4-8.4 4.0-7.6 0.1-4.3 0.3-1.3(2.8) (7.4) (7.4) (2.3) (3.3) (0.6) (4.3) (5.3) (2.2) (0.8)B 1.4-4.1 5.4-6.1 3.3-6.8 11.8* 1.1-4.1 1.1-5.4 0.1-1.4 2.4-7.8 4.0-6.3 0.1-2.3 1.2-1.5(2.8) (5.8) (5.0) (2.6) (3.2) (0.9) (4.1) (5.1) (1.2) (1.4)NO - 2 -N (µmol/l) S 0.1-0.4 0.5-0.6 0.2-0.7 0.8* 0.1-0.6 0.1-0.5 0.1-0.3 ND-0.4 0.2-0.5 0.1-0.2 0.2-0.2(0.3) (0.5) (0.4) (0.4) (0.3) (0.2) (0.3) (0.3) (0.1) (0.2)B 0.2-0.4 0.2-0.4 0.2-0.9 0.9* 0.1-0.6 0.2-0.4 0.1-0.6 ND-0.4 0.1-0.5 0.1-0.2 0.2-0.2(0.3) (0.3) (0.5) (0.4) (0.3) (0.3) (0.3) (0.3) (0.1) (0.2)NH + 4 -N (µmol/l) S ND-2.9 0.1-0.4 0.1-0.2 2.4* ND-10.5 0.1-0.1 0.5-0.9 0.1-0.9 0.1-1.2 0.1-0.2 0.9-2.0(1.5) (0.3) (0.1) (5.2) (0.1) (0.7) (0.5) (0.4) (0.1) (1.5)B ND-2.0 ND-0.2 0.1-0.1 2.2* ND-5.0 0.1-0.1 0.5-0.9 ND-2.9 0.1-0.6 0.1-0.1 ND-ND(1.0) (0.1) (0.1) (2.5) (0.1) (0.7) (1.2) (0.4) (0.1) (ND)N Total (µmol/l) S - - - - - 13.4-26.6 - - - -(20.0)B - - - - - 13.8-15.9 - - - -(14.9)PHc (µmol/l) 1m - 13.3* 1.0-5.7 54.2* - 0.8-2.3 3.9-5.7 3-12 8-18 2.0-2.0 0.4-0.7(3.3) (1.5) (4.8) (7) (10) (2.0) (0.6)Phenols (µmol/l) S - - 134-190 89* - 68-132 9-20 31-48 5-13 61-168 24.5-32.6(163) (100) (15) (39) (9) (114) (28.6)
Table 3.3.1 (Contd 3)Parameter Level Bedi Navlakhi Kandla MundraMar1997Mar1996Apr2002Feb1998Apr2002Mar1997Feb1999Mar2000Apr2002June2003Temp ( o C) S 21.5-24.525.9-26.527.8-30.522.5-24.027.0-29.022.9-24.023.3-28.522.0-25.525.3-27.528.4-29.8(23.0) (26.0) (28.7) (23.1) (27.9) (23.6) (24.7) (24.1) (26.9) (29.3)B 22.0-23.925.0-25.926.0-29.522.5-25.526.5-29.022.8-23.523.2-25.822.0-25.524.0-29.828.7-29.7(23.0) (25.5) (28.5) (23.4) (27.7) (23.1) (24.2) (23.6) (27.0) (29.2)pH S 8.1-8.38.1-8.28.0-8.37.8-8.08.0-8.28.1-8.27.7-8.28.1-8.38.2-8.27.9-8.0(8.2) (8.2) (8.2) (8.0) (8.1) (8.2) (8.2) (8.3) (8.2) (8.0)B 8.0-8.38.1-8.28.1-8.37.9-8.08.0-8.28.1-8.28.1-8.28.2-8.38.1-8.28.0-8.0(8.2) (8.2) (8.2) (8.0) (8.1) (8.2) (8.2) (8.3) (8.2) (8.0)SS (mg/l) S 21-45 30-41 75-275105-21480-36625-33 22-32 20-72 16-25 178-190(27) (36) (149) (149) (162) (30) (25) (32) (24) (184)B 18-45 47-20480-385101-272115-41019-98 30-54 24-11817-35 260-440(28) (126) (214) (184) (217) (53) (40) (61) (27) (350)Salinity(ppt)S 37.5-38.639.3-40.141.0-44.437.5-38.038.4-39.935.8-38.635.9-38.137.4-38.337.6-38.237.7-38.6(38.1) (39.7) (42.7) (37.8) (39.4) (37.6) (37.3) (37.9) (38.0) (38.4)B 37.3-38.638.5-40.141.5-45.037.4-37.938.4-40.236.1-38.536.0-38.237.6-39.037.5-38.337.7-38.6(38.7) (39.3) (43.3) (37.6) (39.4) (37.9) (37.5) (38.0) (38.0) (38.3)DO (ml/l) S 4.2-5.32.9-5.01.8-4.52.5-5.01.6-5.24.1-5.31.8-5.71.7-5.12.5-6.01.5-4.6(4.6) (3.9) (3.1) (4.0) (3.6) (4.9) (3.9) (3.6) (3.9) (3.8)B 4.3-5.04.3-5.02.0-4.72.5-4.81.8-4.93.7-5.11.8-5.71.7-5.34.0-5.91.9-4.4(4.5) (4.6) (3.5) (3.9) (3.7) (4.9) (4.3) (4.0) (4.2) (3.8)BOD(mg/l)PO 4 3- -Pµmol/l)S 1.0-3.1
Table 3.3.1 (Contd 4)Parameter Level Bedi Navlakhi Kandla MundraMar1997Mar1996Nov2002Feb1998Apr2002Mar1997Feb1999Mar2000Apr2002June2003P Total(µmol/l)S 1.7-4.0- - - - 1.6-2.00.7-1.5- - 2.0-2.9(2.6) (1.8) (1.2) (2.5)B 1.8-5.4- - - - 1.7-1.81.1-1.7- 2.4-2.5(3.0) (1.7) (1.5) (2.5)NO 3 - -N(µmol/l)NO 2 - -N(µmol/l)NH 4 + -N(µmol/l)N Total(µmol/l)PHc(µmol/l)Phenols(µmol/l)S 3.2-15.10.6-4.33.3-7.38.0-10.75.5-12.11.4-6.9ND-3.41.1-4.918.0-18.51.0-5.1(6.7) (2.4) (5.3) (9.4) (7.7) (4.0) (2.1) (2.8) (18.3) (3.1)B 3.6-12.9ND-1.03.4-8.77.4-9.95.0-8.32.7-5.40.3-6.61.3-5.45.0-20.21.2-4.6(6.1) (0.5) (5.9) (8.6) (7.1) (3.7) (2.0) (3.0) (19.0) (3.0)S 0.2-0.60.1-0.40.3-0.70.4-0.60.5-0.90.2-0.90.1-0.90.2-0.9ND-0.20.2-0.5(0.4) (0.3) (0.5) (0.5) (0.7) (0.4) (0.4) (0.5) (0.1) (0.4)B 0.2-0.50.4-1.10.2-0.60.4-0.90.2-0.40.3-0.80.1-0.60.3-1.3ND-0.30.2-0.4(0.4) (0.7) (0.4) (0.6) (0.3) (0.5) (0.5) (0.5) (0.2) (0.4)S 0.1-1.20.9-1.20.2-0.50.2-0.90.2-1.90.5-1.70.4-6.4ND-0.60.1-0.2ND-1.9(0.6) (1.1) (0.3) (0.6) (0.5) (1.0) (1.9) (0.4) (0.2) (0.8)B 0.1-1.20.6-1.90.1-0.80.5-0.90.2-2.10.3-2.80.4-1.50.1-0.70.1-0.50.2-2.8(0.4) (1.2) (0.4) (0.7) (0.5) (1.4) (1.0) (0.5) (0.3) (1.4)S 3.2-16.7- - 16.4-59.3- 7.1-8.052.4-60.4- - 7.8-11.1(6.9) (29.6) (7.8) (55.9) (9.5)B 3.3-16.4- - 17.1-82.9- 5.6-8.637.6-57.1- - 7.3-8.5(7.1) (35.7) (7.0) (51.1) (7.9)1m 1.5-4.81.0-2.11.9-5.92.6-3.51.4* 2-3 0.7-4.41.3-9.93.3-4.14.5-4.7(2.7) (1.6) (3.9) (2.9) (1.4) (2) (1.8) (3.3) (3.7) (4.6)S 7-29 1-25 16- 39-60 73* ND- ND- ND- 1.9- 20-11423 176 92 3.5 23(17) (13) (37) (49) (73) (15) (83) (35) (2.7) (22)Average given in parenthesisND: Not Detected* Single value
Table 3.3.2 : Water quality of the Gulf during postmonsoon (1993-2004)ParameterOkha Vadinar SikkaLevelNov1995Nov1999Nov2002Jan2004Nov1994Nov1995Jan2000Jan2004Dec1993Oct1996Nov2002Temp ( o C) S 25.0-25.126.0-26.025.5-28.823.6-23.628.8-29.024.0-30.022.5-22.522.0-22.025.1-25.929.0-29.825.0-27.4(25.1) (26.0) (26.7) (23.6) (29.0) (26.8) (22.5) (22.0) (25.3) (29.4) (26.2)B 25.0-25.226.0-26.025.2-27.523.7-23.729.0-29.224.0-29.922.5-22.521.7-21.724.6-25.729.0-29.226.0-26.8(25.1) (26.0) (26.5) (23.7) (29.1) (26.7) (22.5) (21.7) (25.1) (29.1) (26.4)pH S 8.1-8.1 8.0-8.0 8.1-8.3 8.2-8.2 8.1-8.2 8.0-8.3 8.2-8.3 8.2-8.2 8.1-8.3 8.1*- 8.2-8.3(8.1) (8.0) (8.3) (8.2) (8.1) (8.2) (8.3) (8.2) (8.2) (8.2)B 8.0-8.1 8.0-8.1 8.2-8.3 8.2-8.2 8.0-8.2 8.0-8.3 8.2.-8.3 8.2-8.2 8.2-8.3 8.1* 8.3-8.3(8.1) (8.0) (8.3) (8.2) (8.1) (8.1) (8.3) (8.2) (8.3) (8.3)SS (mg/l) S 7-25 59* 4-10 22* 16-29 13-21 25-25 22* 15-23 40* 10-34(16) (7) (22) (16) (25) (19) (22)B 14-24 68* 6-308 90* 18-29 8-16 23-24 58* 17-24 36* 20-36(19) (69) (24) (12) (24) (21) (22)Salinity (ppt) S 35.4-35.736.8-36.937.1-38.436.0-36.234.3-34.636.2-37.837.4-38.037.0-37.037.1-38.536.3* 37.1-38.6(37.6) (36.8) (37.6) (36.1) (34.6) (36.9) (37.7) (37.0) (38.0) (37.8)B 37.4-37.736.7-36.837.1-38.235.7-35.934.3-34.636.6-37.437.4-39.637.0-37.035.5-37.836.5* 37.0-38.7(36.8) (34.6) (37.6) (35.8) (34.6) (37.0) (38.0) (37.0) (36.9) (37.8)DO (ml/l) S 4.3-4.7 3.6-3.8 2.5-4.9 4.5-4.5 4.1-4.8 4.0-5.5 5.3-5.7 4.5-4.8 3.6-5.4 4.3-4.5 2.6-4.7(4.5) (3.7) (4.2) (4.5) (4.3) (4.8) (5.4) (4.7) (4.2) (4.4) (3.6)B 4.3-4.5 3.2-3.8 2.7-4.8 4.5-4.8 4.3-5.0 4.0-5.3 5.0-5.3 4.8-5.0 3.5-5.5 4.3-4.5 2.1-4.4(4.4) (3.5) (4.2) (4.7) (4.4) (4.6) (5.3) (4.9) (4.1) (4.4) (3.2)BOD (mg/l) S 1.0-4.0 - 0.1-2.5 2.9* 1.5-2.5 0.8-1.8 2.9-3.6 1.0* 2.0-2.4 4.8*
Table 3.3.2 (Contd 2)Parameter Level Okha Vadinar SikkaNov1995Nov1999Nov2002Jan2004Nov 1994 Nov1995Jan2000Jan2004Dec1993Oct1996P Total (µmol/l) S - - - - - - - - - - -B - - - - - - - - - - -Nov2002NO 3 - -N(µmol/l)S 3.6-6.6 3.4-9.5 7.9-13.0 4.8-8.7 3.1-7.9 2.1-10.6 7.7-8.7 2.9-3.3 4.4-8.1 17.1- 8.0-12.318.1(5.1) (9.0) (9.5) (6.8) (5.5) (6.7) (8.2) (3.1) (6.5) (17.6) (10.1)B 4.6-7.2 9.3-9.7 7.1-12.1 6.5-6.9 3.3-7.3 4.2-11.1 7.2-10.0 2.7-3.6 3.7-8.1 16.5- 7.5-11.518.9(5.9) (9.5) (9.2) (6.7) (4.6) (8.0) (8.9) (3.2) (6.1) (17.7) (9.5)NO 2 - -N(µmol/l)S 0.6-0.7 0.3-0.4 0.4-0.5 0.3-0.3 0.4-1.1 0.1-0.5 0.3-0.3 0.3-0.3 0.2-1.1 0.2-0.6 0.2-0.4(0.7) (0.4) (0.4) (0.3) (0.8) (0.3) (0.3) (0.3) (0.4) (0.4) (0.3)B 0.6-0.7 0.2-0.2 0.4-0.6 0.2-0.3 0.6-0.9 0.1-0.4 0.3-0.4 0.2-0.3 0.1-2.8 0.4-0.6 0.1-0.7(0.7) (0.2) (0.5) (0.3) (0.8) (0.3) (0.4) (0.3) (0.4) (0.5) (0.4)NH 4 + -N(µmol/l)S ND 0.8-1.7 0.3-1.8 0.8-2.1 0.3-2.8 0.1-1.5 0.2-0.5 1.0-1.3 2.0-7.8 0.3-0.5 0.3-1.0(1.3) (0.6) (1.5) (1.1) (0.6) (0.3) (1.2) (3.7) (0.4) (0.6)B - 0.6-0.8 0.2-7.8 ND-0.2 0.4-4.9 ND-1.2 0.1-0.2 ND-1.2 1.6-4.8 - 0.1-0.8(0.7) (1.2) (0.2) (1.3) (0.6) (0.2) (0.6) (3.2) (0.5) (0.4)N Total (µmol/l) S - 56* - - 38.1-100.5(69.3)B - 62* - - 80.5-124.9(102.7)- - - - - -- - - - - -PHc (µg/l) 1m 0.5-0.7 1.8* 0.7-1.5 - 2-5 4-5 0.1-0.3 - 5-7 0.9-1.7(0.6) (1.2) (4) (5.0) (0.2) (6) (2.3)* (1.3)Phenols (µg/l) S 10-19 37* 1-15 - 28-34 18-42 11-31 - 19-22 ND-21(15) (8) (31) (31) (21) (21) (18)* (21)
Table 3.3.2 (Contd 3)Parameter Level Bedi Salaya Navlakhi Kandla MundraOct Nov Nov Nov Oct Nov Jan Sep 1999 Nov 2002 Oct 2003 Dec 20041997 2002 1994 2002 1996 2002 2004Temp ( o C) S 28.0- 23.0- 25.5- 23.0- 29.5- 24.8- 20.1- 28.5-31.0 24.0-27.0 28.5-30.0 24.0-24.030.1 27.9 26.1 27.5 29.5 30.0 20.1(29.2) (25.4) (25.8) (25.7) (29.5) (27.2) (20.1) (29.9) (25.5) (28.8) (24.0)B 28.0- 23.0- 24.7- 24.0- 29.5- 24.9- 19.9- 28.5-31.6 23.2-26.9 28.0-29.9 23.5-23.530.9 26.4 26.5 27.0 30.5 29.0 19.9(29.1) (24.7) (25.2) (25.6) (30.0) (26.9) (19.9) (30.1) (25.5) (28.7) (23.5)pH S 8.2-8.4 8.1-8.3 7.8-7.9 8.3-8.6 8.0-8.2 7.9-8.3 8.2-8.2 7.9-8.3 8.0-8.3 8.1-8.2 8.4-8.4(8.3) (8.2) (7.9) (8.5) (8.1) (8.2) 8.2 (8.2) (8.1) (8.1) 8.4B 8.2-8.4 8.2-8.3 8.3-8.6 8.0-8.1 8.1-8.3 8.2-8.2 7.9-8.3 8.1-8.3 8.1-8.2 8.4-8.4(8.3) (8.2) (7.9)* (8.5) (8.0) (8.2) (8.2) (8.2) (8.2) (8.2) 8.4SS (mg/l) S 32-63 28-304 16-110 156- 28-104 164* 49-170 30-162 38-86 44*336(44) (166) (698)* (742) (244) (60) (108) (96) (62)B 26-136 208-80-190 252- 42-94 178* 70-207 108-214 72-166 60*490373(78) (349) (689)* (126) (312) (72) (128) (161) (95)Salinity(ppt)S 36.3- 41.2- 32.1- 37.3- 40.0- 36.5- 38.2- 36.9-39.2 40.7-42.4 36.5-37.0 37.2-37.837.8 46.3 32.8 39.0 40.4 40.1 38.2(37.1) (43.7) (32.4) (38.1) (40.2) (38.3) (38.2) (38.2) (41.5) (36.7) (37.5)B 36.3- 41.6- 32.1- 37.5- 40.2- 37.4- 38.0- 37.1-39.0 41.0-42.3 36.2-37.0 37.4-37.637.8 45.8 32.1 39.0 40.2 40.1 38.0(37.3) (43.7) (32.1) (38.0) (40.2) (38.4) (38.0) (38.2) (41.6) (36.7) (37.5)DO (ml/l) S 3.7-4.9 3.0-5.1 4.8-4.8 4.8-7.6 4.3-4.7 6.1-7.8 4.5-4.5 1.5-5.7 2.2-5.0 3.8-5.4 4.9-4.9(4.3) (4.0) (4.8) (6.2) (4.5) (6.9) (4.5) (3.6) (3.6) (4.5) (4.9)B 3.5-4.7 2.6-5.0 4.8-5.0 3.6-7.6 4.7-4.7 5.8-8.0 4.5-4.8 2.0-5.1 2.2-5.3 2.9-5.2 4.7-4.9(4.1) (3.8) (4.8) (5.7) (4.7) (7.0) (4.7) (3.5) (3.7) (4.1) (4.8)BOD (mg/l) S 2.2-6.3 0.9-1.4 0.1-2.5 3.9-4.1 0.2-5.9 0.6*
Table 3.3.2 (Contd 4)Parameter Level Bedi Salaya Navlakhi Kandla MundraOct1997Nov2002Nov1994Nov2002Oct1996Nov2002Jan2004Sep1999Nov2002Oct2003Dec2004PO 3- 4 -PS 1.0-3.0 0.2-2.0 1.5-2.0 0.9-2.2 0.8-1.3 0.4-3.1 1.8-1.8 0.5-2.5 1.0-1.6 0.5-1.3 1.3-1.4(µmol/l)(2.1) (1.1 (1.7) (1.9) (1.1) (1.7) (1.8) (1.4) (1.3) (0.9) (1.4)B 1.3-5.2 1.2-4.1 2.0-2.1 0.8-2.3 1.2-1.6 1.9-2.6 2.0-2.1 0.7-3.0 1.6-2.1 0.8-1.3 1.5-1.7(2.9) (2.6) (2.0) (1.9) (1.4) (2.2) (2.1) (1.7) (1.8) (1.1) (1.6)P Total (µmol/l) S 1.6-3.8 - - - - - - - - - -(2.7)B 1.8-5.7 - - - - - - - - - -(4.2)NO 3 - -N(µmol/l)NO 2 - -N(µmol/l)NH 4 + -N(µmol/l)S 2.9-16.7 6.9-15.2 25.4- 8.8-12.3 7.3-9.9 5.4-18.7 10.5- 0.7-10.0 6.9-28.6 1.3-3.7 4.3-5.438.412.1(7.4) (11.0) (31.9) (10.6) (9.6) (10.4) (11.3) (4.3) (17.7) (2.5) (4.9)B 2.4-15.1 8.1-12.2 30.4- 8.0-12.3 10.9- 5.9-18.4 12.6- 0.3-7.1 17.0- 0.2-3.3 3.1-4.230.811.512.725.9(8.9) (10.1) (30.6) (9.8) (11.2) (10.4) (12.7) (4.0) (21.4) (2.0) (3.7)S 0.1-1.5 0.3-0.7 0.1-0.2 0.1-0.3 0.8-0.9 0.1-0.5 ND-0.1 0.1-0.9 0.3-0.6 0.2-0.6 0.3-0.3(0.9) (0.5) (0.1) (0.2) (0.9) (0.3) (0.1) (0.4) (0.4) (0.4) (0.3)B 0.3-1.6 0.2-0.9 0.1-0.1 0.1-0.3 0.6-0.9 0.2-0.5 ND-ND 0.2-1.0 0.2-0.8 0.1-0.3 0.3-0.3(1.1) (0.5) (0.1) (0.2) (0.8) (0.3) (ND) (0.4) (0.5) (0.2) (0.3)S 0.4-2.1 0.5-2.4 0.8-3.0 0.3-1.5 0.5-1.1 0.2-1.3 2.1-2.6 ND-3.6 1.1-5.4 0.2-3.9 0.5-1.3(1.2) (1.4) (1.9) (0.6) (0.8) (0.7) (2.4) (0.6) (3.2) (1.6) (0.9)B 0.4-3.9 ND-3.1 1.1-1.3 0.2-1.0 0.5-0.9 0.2-1.1 2.3-2.7 ND-2.1 0.7-2.1 0.1-1.4 0.1-0.2(2.1) (1.5) (1.2) (0.6) (0.7) (0.5) (2.5) (0.5) (1.4) (0.5) 0.2N Total (µmol/l) S 3.7-17.9 - - - - - - - - 8.7-12.8 -(10.0) (10.8)B 7.1-17.1 - - - - - - - - 6.1-8.0 -(13.3) (7.1)PHc (µmol/l) 1m 1.2-8.0 1.3-3.0 - 0.9-1.4 1.6-2.0 0.7-1.9 - 0.3-2.5 1.3-4.6 8.6-19.4 26.3*(5.1) (2.1) (1.1) (1.8) (1.1) (1.1) (2.9) (14.0)PhenolsS 6-32 ND-53 9-13 11-16 ND-44 - ND-133 4-23 2-10 57*(µmol/l)(20) (27) (15) (14) (31) (38) (13) (6)Average given in parenthesis, ND: Not Detected, * Single value
Table 3.3.3 : Subtidal sediment quality of the Gulf during premonsoon (1994-2005)PremonsoonConstituentsOkha Vadinar Sikka BediMar 1999 Apr 2002 Apr 1994 Mar 1996 Apr 1994 Mar 1997 Apr 2002 Apr 2003 Mar 1997Al (%) 0.8-2.0 1.8-8.1 3.7-9.6 5.0-6.2 - 1.5-5.7 4.7 0.4-8.4 2.9-6.6(1.6) (4.9) (7.0) (5.5) (3.4) (5.2) (4.4)Cr (µg/l) 12-39 20-112 30-87 41-59 27-127 28-112 68 6-51 48-189(20) (67) (63) (47) (48) (75) (23) (133)Mn (µg/l) 257-1696 425-726 517-1229 287-512 443-936 408-987 590 508-3065 493-775(639) (580) (802) (399) (633) (692) (1450) (664)Fe (%) 0.9-1.1 0.8-4.4 1.4-4.3 3.6-4.9 2.0-6.1 1.0-4.6 2.3 0.1-9.8 2.0-5.2(1.0) (2.5) (3.2) (4.1) (3.0) (3.2) (3.3) (3.8)Co (µg/g) 20-29 1-29 24-44 2-78 37-65 11-36 9 12-47 28-53(24) (10) (36) (44) (38) (25) (26) (41)Ni (µg/g) 11-17 10-60 31-61 59-70 21-75 11-67 29 32-112 24-67(15) (33) (47) (64) (34) (51) (68) (51)Cu (µg/g) 8-16 5-34 32-70 41-51 24-90 9-52 19 11-97 16-72(12) (16) (51) (44) (32) (34) (44) (40)Zn (µg/g) 17-25 13-92 44-134 48-94 39-101 15-84 23 109-401 39-122(22) (43) (92) (77) (59) (50) (227) (72)Hg (µg/g) 0.04-0.12 0.009-0.04 - - - 0.09-0.40 0.009 ND-0.26 0.1-0.3(0.07) (0.02) (0.17) (0.07) (0.2)Pb (µg/g) - - 1-12 17-21 ND-5 - - - -(7) (20) (1.2)C (%) 0.1-0.8 0.2-0.7 - - - 0.1-0.8 0.4 0.2-1.0 -(0.3) (0.7) (0.4) (0.6)P (µg/g) 425-736 349-545 - - - 580-832 470 210-953 -(646) (455) (731) (525)PHc (µg/g) ND-3.1 0.7-1.4 0.2-2.3 0.2-0.4 0.3-1.0 0.08-0.33 0.7 0.1 0.3-1.0(1.2) (1.0) (0.6) (0.3) (0.5) (0.20) (0.1) (0.4)
Table 3.3.3 (Contd. 2)PremonsoonConstituentsKandla Mundra Salaya NavlakhiMar 1996 Feb 1998 Apr 2002 Mar 1999 Mar 2000 Apr 2002 Jun 2003 April 2002 Apr 2002Al (%) 1.7-6.9 1.7-7.9 7.5 0.5-9.3 2.4-8.5 8.7 1.4-9.6 6.8 7.3(4.6) (5.4) (5.7) (4.6) (4.9)Cr (µg/l) 9-103 26-76 98 7-175 26-139 140 27-123 87 113(63) (45) (110) (86) (73)Mn (µg/l) 594-1321 428-757 623 431-900 316-837 681 536-1182 677 808(985) (597) (700) (603) (767)Fe (%) 0.9-4.7 1.2-6.2 3.6 1.1-5.0 1.5-46 5.0 1.3-5.1 3.7 5.0(2.9) (4.1) (3.5) (38) (3.6)Co (µg/g) 9-31 16-32 18 15-70 15-39 27 ND-20 20 24(23) (26) (35) (29) (8)Ni (µg/g) 15-58 9-60 45 ND-68 15-59 64 7-59 48 65(41) (38) (39) (38) (35)Cu (µg/g) 11-45 6-51 31 6-47 6-44 54 5-44 29 50(28) (32) (24) (26) (19)Zn (µg/g) 18-89 12-77 50 14-106 33-92 76 31-151 61 74(60) (58) (62) (70) (87)Hg (µg/g) 0.13-0.26 0.07-0.13 0.04 0.07-0.66 0.19-0.76 0.02 ND-0.05 0.05 0.05(0.18) (0.11) (0.62) (0.34) (0.03)Pb (µg/g) 6.8-17.2 - - - - - - - -(12.3)C (%) - - 0.7 0.1-0.9 0.1-0.7 0.9 ND-0.8 0.5 0.8(0.5) (0.4) (0.4)P (µg/g) - - 417 341-882 493-755 589 465-1822 581 629(607) (633) (751)PHc (µg/g) 0.2-21.6 0.1-0.4
Table 3.3.4 : Subtidal sediment quality of the Gulf during postmonsoon (1993-2004)PostmonsoonConstituentsOkha Vadinar SikkaNov 95Nov 99 Nov Nov Nov 94 Nov 95 Nov 2004 Dec 93 Oct 96 Nov2002 20042002Al (%) 0.8-3.4 1.6-4.3 0.4-5.1 3.7-6.1 4.1-9.6 4.7-5.8 2.1-11.0 - 4.8-5.2 5.0-7.8(2.2) (2.5) (2.8) (4.5) (6.9) (5.2) (6.9) (5.0) (6.4)Cr (µg/g) 18-49 ND-55 9-92 36-68 30-69 38-65 40-118 29-104 80-137 154-197(31) (19) (51) (48) (52) (49) (94) (68) (102) (176)Mn (µg/g) 340-700 290-470607-610 365-497 743-1222 720-1010 210-1103 497-9001117-1539817-1054(592) (389) (609) (415) (924) (815) (596) (775) (1258) (936)Fe (%) 1.5-3.0 0.9-2.6 0.3-3.3 1.4-2.1 1.4-3.5 1.9-3.6 0.8-5.6 2.0-6.5 4.1-4.7 4.7-5.8(2.4) (1.5) (1.8) (1.7) (2.7) (2.7) (3.8) (4.8) (4.7) (5.3)Co (µg/g) 7-27 21-38 ND-8 4-96 24-44 20-70 6-23 37-65 31-48 ND-18(19) (30) (4) (35) (34) (45) (17) (54) (37) (9)Ni (µg/g) 13-29 10-28 ND-34 14-28 38-61 33-50 35-73 21-75 65-86 58-67(20) (17) (17) (19) (49) (38) (55) (58) (70) (63)Cu (µg/g) 8-26 5-24 5-43 20-21 33-70 36-65 7-59 27-90 50-85 64-92(16) (12) (24) (21) (52) (48) (41) (73) (62) (78)Zn (µg/g) 21-32 15-44 62-69 27-63 79-134 69-131 63-154 39-101 88-93 83-85(28) (25) (66) (41) (110) (101) (126) (75) (91) (84)Hg (µg/g) 0.01-0.10- 0.06-0.090.05-0.17- - ND-0.02 - - 0.09-0.11(0.04) (0.07) (0.09) (0.01) (0.10)Pb (µg/g) 2-15 - - - 6-12 6-10 - ND 3.5-11.8 -(10) (9) (8) (8.5)C (%) - 0.1-1.6 0.2-0.6 0.4-0.7 - - - - - 0.5-0.8(0.5) (0.4) (0.6) (0.7)P (µg/g) - 410- 626-688 594-738 694-815 - 76-985 - - 650-704709(555) (657) (657) (771) (701) (677)PHc (µg/g) ND-0.3 0.3-0.8 - 0.4-1.0 ND-0.9 0.2-1.0 0.2-1.0 0.3-1.0 0.3-0.5 -(0.1) (0.4) (0.7) (0.4) (0.3) (0.4) (0.6) (0.4)
Table 3.3.4 (Contd 2)PostmonsoonConstituents Bedi Navlakhi Kandla Mundra SalayaOct 97 Nov 94 Nov2002Oct 96 Nov2002Sep 99 Nov2002Oct2003Dec2004Nov2002Al (%) 2.9-6.6 - 6.6 2.9-6.3 7.0 2.5-6.7 0.4 1.3-4.8 1.4-9.6 5.9(4.4) (4.4) (5.6) (3.1) (4.3)Cr (µg/g) 48-189 75-194 94 50-103 83 18-80 12 18-41 27-123 86(133) (100) (69) (53) (30) (73)Mn (µg/g) 493- 549- 834 797- 838 361-832 353 312- 536- 611775 11881321490 1182(664) (944) (1033) (684) (401) (766)Fe (%) 2.0-5.2 1.4-3.6 3.8 1.6-3.4 3.5 1.5-4.7 0.5 0.8-2.4 1.3-5.1 3.3(3.8) (2.4) (2.6) (3.8) (1.6) (3.6)Co (µg/g) 28-53 34-39 7 14-29 10 11-34 ND 2-8 ND-20 8(41) (36) (23) (28) (5) (8)Ni (µg/g) 24-67 37-63 47 20-58 41 15-59 ND 6-21 7-59 39(51) (51) (40) (46) (14) (35)Cu (µg/g) 16-72 24-46 36 11-36 34 3-39 7 10-16 5-44 41(46) (34) (25) (27) (13) (20)Zn (µg/g) 39-122 33-157 96 34-88 93 13-79 15 20-48 31-151 68(72) (78) (61) (61) (34) (87)Hg (µg/g) 0.1-0.3 Nd-0.40 0.11 0.13- 0.08 0.3-0.69 0.08 - ND-0.01 0.120.26(0.2) (0.20) (0.18) (0.44) (0.01)Pb (µg/g) - 7.0-11.0 - 8.6-17.2 - - - - -(10.0) (12.9)C (%) - - 0.7 - 0.6 0.1-0.8 0.1 0.1-0.2 ND-0.2 1.0(0.6) (0.2) (0.1)P (µg/g) - - 786 - 703 337- 327 102- 469- 10491402275 1822(1027) (189) (812)PHc (µg/g) 0.3-1.0 0.2-1.2 - 0.7-1.4 - 0.1-0.4 - - ND-0.2 -(0.4) (0.5) (1.0) (0.3) (0.1)Dry wt basis except PHc which is wet wt basis, ND : Not Detected, Average in parenthesis
Table 3.3.5 : List of algae recorded along the intertidal zone of the GulfNameStatus*ChlorophyceaeBoodlea compositaCBryopsis indicaCB. plumose CB. ramulosa CCaulerpa crassifoliaCC. cupressoides CC. racemosa CC. scalpelliformis CC. sertularioides CC. taxiformes CC. verticillata CChaetomorpha indicaCChamaedoris auirculataCCladophora glomerataCC. prolifera CCodium decorticatumRC. dwarkensis CC. elongatum CDictyosphaeria cavernosaCEnteromorpha intenstinalisCHalideda tunaCPseudobryopsis mucronataRSpongomorpha sp.CUdoea indicaCUlva fasciataCU. lactuca CU. reticulata RValonia utricularisRValloniopsis spachynemaR
Table 3.3.5 (Contd 2)Valonia utricularisNameValloniopsis spachynemaStatus*RRPhaeophyceaeColpomenia sinuosaCCystoceira indicaCDictyota atomariaCD. bartayrisiana RD. cervicornis RD. ciliolate CD. dichotoma CD. divaricata RDictyopteris australisCD. woodwardii CEctocarpus sp.CHinskia mitchelleCHormophysa triquetraRHydroclathrus clathratusRIyengaria stellataCMyriogloea sciurusRNemacystus decipiensRPadina gymnosporaRP. tetrastromatica CPocockiella sp.CRosenvingia intricataRSargassum johnstoniiCS. tenerrimum CS. plagiophyllum RS. swartzii CS. wisghtii RSpathoglossum asperumRS. variabile C
Table 3.3.5 (Contd 3)NameStatus*Stoechospermum marginatumCSpathoglossum asperumRS. variabile CStoechospermum marginatumCTurbinaria ornataRRhodophyceaeAcanthophora delileiCA. specifera RAmphiroa fragilissimaRAsparogopsis taxiformisCBotroycladia leptapodaCCalaglossa bombayanceRCeramium sp.CChampia indicaCChondria ornataRC.dasyphyllaRCoelarthrum opuntiaCCorallina officinalisCCorynomorpha prismaticaRCryptopleur sp.RDasya sp.RDesmia hornmanniRGastroclonium iyengariiRGalaxaura oblongataCGelidiella acerosaCGelidiospsis gracilisCGigartina spRGracilaria corticataRG. pygmaea CGastroclonium iyengariiRGalaxaura oblongataCGelidiella acerosaC
Table 3.3.5 (Contd 4)NameStatus*Gelidiospsis gracilisCGigartina spRGracilaria corticataRG. pygmaea CG. verrucossa RGrateloupia inicaCG. felicina RHaloplegma sp.RHalymenia floresiaRH. porphyroides CH. venusta CHelminthocladia clayadosiiCHeterosiphonia muelleriCHypnea cervicornisCH. musciformis CHypoglossum spathulatumRLaurencia papillosaCL. pedicularioides CLiagora cerenoidesRLophocladia lallemandiRNeurymenia fraxinifoliaRPolysiphonia sp.CRhodymenia australisCR. palmate CScinaia indicaCS. furcellata RSebdenia polydactylaCSpyridia alternansCSoleria robustaC*C: common; R : rareSource: Saurashtra University (1991)
Table 3.3.6 : Biological characteristics of the Gulf during premonsoon(1981-2005).ParameterPhytoplanktonChlorophyll a(mg/m 3 )April19811.1-6.9(4.3)March19950.5-1.1(0.7)OkhaMarch 1999 April 2002 April 20030.5-1.1(0.6)0.5-2.7(1.1)0.1-0.2(0.2)Phaeophytin(mg/m 3 )- 0.4-1.3(0.7)0.4-1.3(0.7)0.1-0.6(0.2)0.5-0.8(0.6)Cell counts(nox10 3 /l)- 36.6-45.6(41.1)49.2-775.2(412.2)16.5-116.5(48.5)15.3-24.0(20.5)Total genera(no)- 8-8(8)7-8(8)14-21(17)15-19(18)ZooplanktonBiomass(ml/100m 3 )0.3-0.6(0.5)0.4-0.7(0.5)6.9-7.2(7.0)0.3-7.5(2.7)1.5-4.5(3.2)Population(nox10 3 /100m 3 )- 0.2-0.4(0.3)0.4-1.0(0.7)2.0-29.3(14.1)6.5-13.0(8.5)Total groups(no)- 6-8(7)10-11(11)9-20(15)12-13(13)MacrobenthosBiomass(g/m 2 , wet wt)Population(no/m 2 )Total groups(no)- 0.1
Table 3.3.6(Contd 2)ParameterChlorophyll a(mg/m 3 )April 19941.1-1.1(1.1)VadinarMarch April 20021996Phytoplankton1.1-2.7(1.3)0.5-1.6(0.8)May20050.2-0.6(0.3)Phaeophytin(mg/m 3 )0.8-1.6(1.0)0.1-3.8(1.5)0.2-1.3(0.8)0.1-1.7(0.5)Cell counts(nox10 3 /l)47.2(47.2)15.8-42.8(29.4)2.5-29.6(11.9)6.1-71.2(21.8)Total genera(no)25(25)9-11(10)8-21(13)10-22(17)Biomass(ml/100m 3 )12.1-18.9(15.5)Zooplankton3.0(3.0)
Table 3.3.6(Contd 3)ParameterChlorophyll a(mg/m 3 )April1994March19971.1-2.7 (1.6) 0.5-1.1(0.8)May2001Phytoplankton0.5-4.8(1.6)SikkaApril 20020.5-1.1(0.6)April20031.1-0.2(0.2)February20050.2-0.4(0.3)April20050.2-0.4(0.2)Phaeophytin(mg/m 3 )0.3-3.1 (1.2) 0.1-0.6(0.3)0.1-6.2(1.0)0.2-1.3(0.8)0.5-0.8(0.6)0.5-1.2(0.7)0.1-0.7(0.3)Cell counts(nox10 3 /l)35.0-61.0 (58.0) 25.2-41.2 (33.2) 0.5-719(122)6.2-28.0(14.6)15.3-24.0(20.5)10.8-51.6(28.4)4.0-54.4(10.1)Total genera(no)4-18(9)6-7(7)5-21(18)12-23(18)15-19(18)11-16(14)8-20(12)Biomass(ml/100m 3 )0.8-13.3 (3.3) 1.5-1.5(1.5)Zooplankton1.8-28.2(8.4)0.3-8.5(4.1)1.5-4.5(3.2)0.1-10.0(2.0)0.3-22.8(6.8)Population(nox10 3 /100m 3 )1.9-44.8 (9.9) 3.4-4.7(4.1)6.9-118(31.9)1.9-49.3(22.8)6.5-13.0(8.5)0.2-28.8(5.6)2.4-13.2(19.1)Total groups(no)7-14(12)10-14(12)11-15(14)11-20(16)12-13(13)4-15(12)6-16(10)Biomass(g/m 2 , wet wt)Macrobenthos25.5 116.0
Table 3.3.6(Contd 4)Parameter Bedi NavlakhiMarch 1997 February 1987 April 2002Chlorophyll a(mg/m 3 )0.5-5.9(1.5)Phytoplankton0.5-3.8(1.6)0.5-1.1(0.7)Phaeophytin(mg/m 3 )0.1-7.6(1.5)0.1-0.8(0.4)0.2-1.3(0.8)Cell counts(nox10 3 /l)Total genera(no)38.0-936.0(159.0)7-15(10)- 1.7-13.5(7.2)- 7-19(11)Biomass(ml/100m 3 )0.5-25.5(6.4)Zooplankton18.8-95.0(53.3)0.5-3.2(1.9)Population(nox10 3 /100m 3 )1.6-220.0(48.1)59.0-192.0(117.3)2.8-34.1(16.9)Total groups (no) 5-15(10)- 11-20(15)Biomass(g/m 2 , wet wt)Population(no/m 2 )Total groups(no)Macrobenthos7.8
Table 3.3.6(Contd 5)ParameterChlorophyll a(mg/m 3 )Phaeophytin(mg/m 3 )Cell counts(nox10 3 /l)Total genera(no)Biomass(ml/100 m 3 )Population(nox10 3 /100 m 3 )Total groups(no)Biomass(g/m 2 , wet wt)Population(no/m 2 )Total groups(no)February1987KandlaMarch February1996 1998Phytoplankton0.5-0.5 0.5-2.1(0.5) (1.1)0.2-0.6 0.1-1.7(0.3) (1.0)4.6-170.0 30.2-45.1(67.7) (36.2)7-156-8(11)(7)April20020.1-0.5(0.4)0.5-2.1(1.1)0.1-1.70.3-1.3(1.0)(0.8)8.4-22.4(14.5)9-19(13)Zooplankton17.0-56.3 4.4-18.5 3.8-24.1 1.6-6.3(37.0) (11.5) (14.3) (3.2)31.0-98.5 4.2-18.7 13.7-117.1 11.8-139(67.0) (11.4) (42.4) (40.0)- 10-11 7-13 11-17(11)(10) (14)Macrobenthos6.4 0.4
Table 3.3.6(Contd 6)ParameterChlorophyll a(mg/m 3 )March19970.3-1.1(0.8)MundraMarch March1999 2000Phytoplankton0.5-2.7(0.9)0.5-1.6(0.8)April20020.5-1.6(0.9)June20030.2-4.1(1.0)Phaeophytin(mg/m 3 )0.2-0.8(0.4)0.1-1.7(0.6)0.1-0.6(0.4)0.1-1.3(0.7)0.1-1.6(0.5)Cell counts(nox10 3 /l)62.4-293.0(189.4)33.6-133.2(79.6)14.0-196.0(57.0)16.6-82.8(45.8)12.9-427(90.8)Total genera(no)7-14(12)6-14(10)8-14(11)20-26(24)8-13(10)Biomass(ml/100m 3 )0.4-72.7(32.0)Zooplankton0.8-8.0(4.3)0.2-28.2(6.4)0.2-25.3(9.1)0.9-9.6(2.7)Population(nox10 3 /100m 3 )1.6-144.1(74.8)2.1-40.4(19.6)1.9-145.1(25.0)2.2-156(45.5)7.7-58.9(18.7)Total groups(no)9-16(12)6-16(12)6-17(10)9-21(15)12-18(15)Biomass(g/m 2 , wet wt)4.4 0.2-2.0(0.8)Macrobenthos0.1-43.1(4.3)12.8 0-4.5(0.4)Population(no/m 2 )5700 302-515(380)100-20600(2100)3494 0-1300(240)Total groups(no)7 5-5(5)2-7(4)15 0-6(3)Average given in parenthesis
Table 3.3.7 : Biological characteristics of the Gulf during postmonsoon.ParameterOkhaDecember1981November1995November1999November2002January2003January2004PhytoplanktonChlorophyll a(mg/m 3 )2.7-4.3(3.5)1.1-1.1(1.1)1.1-1.1(1.1)0.5-1.6(0.7)0.5-0.5(0.5)0.2-0.4(0.3)Phaeophytin(mg/m 3 )- 0.2-0.6(0.3)0.1-0.4(0.2)0.1-1.4(0.6)0.2-1.0(0.5)0.1-0.3(0.2)Cell counts(nox10 3 /l)- 27.0-54.8(41.8)68.0-80.0(74.0)- 1.2-54(21.0)3.1-60.0(19.0)Total genera(no)- 13-16(15)10-11(11)- 9-19(12)10-17(12)ZooplanktonBiomass(ml/100m 3 )0.5-0.9(0.7)0.4-0.8(0.6)0.4-1.0(0.7)0.2-2.6(1.6)2.2-8.2(4.6)1.0-56/9(25.2)Population(nox10 3 /100m 3 )- 0.5-0.5(0.5)6.9-7.2(7.0)0.6-22.8(8.3)26.1-86(54.9)20.5-69.4(45.8)Total groups(no)- 7-14(12)10-11(11)10-19(16)15-21(16)12-20(15)Biomass(g/m 2 , wet wt)Population(no/m 2 )Total groups(no)Macrobenthos-
Table 3.3.7 (Contd 2)ParameterVadinarNovember1994November1995January2000November2002January2003January2004November2004PhytoplanktonChlorophyll a(mg/m 3 )0.5-0.5(0.5)0.5-1.1(0.7)0.5-1.1(0.8)0.5-1.6(0.6)0.5-0.5(0.5)0.2-0.2(0.2)0.2-0.2(0.2)Phaeophytin(mg/m 3 )0.2-1.0(0.6)0.1-0.6(0.4)0.1-0.6(0.4)0.1-1.3(0.4)0.2-1.0(0.6)0.1-0.2(0.2)0.2-1.0(0.5)Cell counts(nox10 3 /l)Total genera(no)- 9.4-32.7(17.1)- 10-12(11)17.2-28.8(22.0)8-13(11)3.8-26.4(9.9)10-18(14)9.6-70.0(36.6)9-21(14)2-20.1(11.7)11-18(15)2.0-36.0(7.6)7-18(12)ZooplanktonBiomass(ml/100m 3 )2.1-6.4(4.6)1.6(1.6)0.6-7.3(4.0)0.4-2.5(1.3)4.2-11.9(8.2)0.1-1.9(1.0)0.3-6.7(1.7)Population(nox10 3 /100m 3 )3.7-52.7(23.7)7.2(7.2)8.7-41.1(24.9)2.5-12.2(7.4)23.4-125(66.5)0.2-9.6(6.8)1.4-37.1(12.5)Total groups(no)11-15(13)10(10)7-8(8)9-20(16)20-23(22)8-12(9)11-17(14)Biomass(g/m 2 , wet wt)Population(no/m 2 )Macrobenthos- 1.2 0.2 1.26 0.0-35.5(10.0)- 339 126 1163 0-7425(2581)>0.1-7.2(2.6) (2.0)25-1826(471) 570Total groups(no)1 3 3 9 0-9(5) (2) 5
Table 3.3.7 (Contd 3)ParameterChlorophyll a(mg/m 3 )SikkaDecember1993December2000November2002Phytoplankton0.5-4.3 0.5-3.7 0.5-1.1(1.8) (1.3) (0.6)November20030.2-0.6(0.3)Phaeophytin(mg/m 3 )0.1-2.8(0.9)0.1-1.5(0.6)0.2-1.0(0.4)0.1-1.0(0.6)Cell counts(nox10 3 /l)4.0-252(90.0)8.0-267(85.4)- 3.6-59.2(21.4)Total genera(no)4-12(7)8-13(11)- 7-10(9)Biomass(ml/100m 3 )3.9-29.9(11.0)Zooplankton5.0-32.4(20.7)0.5-5.7(2.5)2.4-11.4(7.8)Population(nox10 3 /100m 3 )1.93-71.3(44.5)12.8-83.4(43.3)2.3-37.0(13.5)27.8-91(67.5)Total groups(no)10-13(12)13-19(16)11-20(16)13-17(15)Biomass(g/m 2 , wet wt)Population(no/m 2 )Total groups(no)Macrobenthos12.8 0.02-2.1(1.0)10914 150-777(483)11 2-9(4)14.4 2.2-3.7(3.2)544 375-1250(828)8 3-8(6)
Table 3.3.7 (Contd 4)Parameter Bedi NavlakhiOctober1997November2002November1986November1994PhytoplanktonChlorophyll a(mg/m 3 )0.5-1.6(1.0)0.5-1.6(1.0)1.1-4.6(2.2)0.5-1.6(0.9)November20020.5-1.6(0.6)Phaeophytin(mg/m 3 )1.3-1.6(1.4)0.1-0.5(0.4)0.1-1.9(1.0)0.1-0.8(0.4)0.1-0.8(0.4)Cell counts(nox10 3 /l)0.2-14.8(7.5)3.8-56.1(22.5)- 9.0-18.9(13.1)6.0-31.4(14.5)Total genera(no)6-7(7)10-16(13)- 7-9(8)8-20(13)Biomass(ml/100m 3 )1.8-7.5(4.6)Zooplankton3.9-8.9(6.6)13.2-55.2(30.4)1.8-13.5(5.6)0.8-5.4(3.5)Population(nox10 3 /100m 3 )9.9-14.9(12.4)12.8-24.5(19.4)2.0-13.0(6.8)4.4-31.4(14.5)5.5-38.3(15.1)Total groups(no)10-11(11)16-19(17)- 10-15(12)12-19(16)Biomass(g/m 2 , wet wt)Population(no/m 2 )Total groups(no)Macrobenthos0.1 5.7 0.1-43.1(4.3)125 1125 100-20600(2100)1 12 2-7(4)0.1
Table 3.3.7 (Contd 5)ParameterKandlaNovember1986October1996November2002January2003December2004January2004PhytoplanktonChlorophyll a(mg/m 3 )0.5-1.1(0.8)2.1-4.3(3.2)0.5-1.1(0.8)0.5-1.1(0.9)0.2-0.2(0.2)0.2-0.2(0.2)Phaeophytin(mg/m 3 )1.0-1.3(0.6)0.1-0.6(0.8)0.2-1.9(0.6)1.2-2.3(1.6)0.2-1.0(0.6)0.1-0.5(0.3)Cell counts(nox10 3 /l)- 25.2-37.5(30.4)3.6-28.1(17.6)37.4-138.4(103.0)0.8-45.2(31.8)3-11.2(6.0)Total genera(no)- 5-9(7)5-14(10)9-11(10)2-14(7)8-12(11)ZooplanktonBiomass(ml/100m 3 )8.2-13.7(11.8)1.8-5.2(3.5)3.1-9.9(5.2)3.3-6.1(4.7)2.1-8.8(5.9)1.2-1.7(1.5)Population(nox10 3 /100m 3 )21.0-32.9(25.5)1.2-63.6(32.4)16.6-102.1(40.7)61.0-63.7(62.4)4.5-89.0(42.6)4.1-6.7(5.4)Total groups(no)- 8-12(10)12-21(18)17-17(17)14-19(17)9-10(10)Biomass(g/m 2 , wet wt)Population(no/m 2 )Total groups(no)Macrobenthos0.2 0.4 0.1 0.1 1.2 0.1-1.1(0.6)60 276 6.9 75 177 100-138(119)2 3 4 2 2 3-5(4)
Table 3.3.7 (Contd 6)ParameterChlorophyll a(mg/m 3 )September19991.1-3.7(2.6)MundraNovember January2002 2003Phytoplankton0.5-1.1(0.5)0.5-1.6(1.0)October20030.2-3.4(1.0)January20040.2-0.2(0.2)Phaeophytin(mg/m 3 )0.4-2.8(1.3)0.2-0.6(0.3)0.1-4.2(1.8)0.1-1.5(0.4)0.1-0.8(0.3)Cell counts(nox10 3 /l)96.0-169.0(150.0)4.2-24.1(11.2)13-148(53.8)26-337(111)3.7-34.0(14.6)Total genera(no)6-12 (9) 7-17(11)12-18(15)9-22(15)12-18(14)Biomass(ml/100m 3 )0.1-2.5(0.8)Zooplankton4.5-15.4(7.2)4.0-6.8(5.7)1.1-21.8(5.2)0.8-3.0(1.8)Population(nox10 3 /100m 3 )0.1-11.0(2.7)7.5-60.6(29.3)58.2-150.3(84.3)11.7-81.5(38.1)6.3-22.0(13.6)Total groups(no)9-19 (12) 13-19 (15) 16-17(17)12-17(15)8-14(10)Biomass(g/m 2 , wet wt)Population(no/m 2 )Total groups(no)Macrobenthos0.6 0.3 0.1-15.5(4.6)713 325 125-14256522 8 2-6(4)1.4 1.4-2.7(2.0)350 550-1450(75)2 4-6(5)Average given in parenthesis
Table 3.3.8 : Mangrove areas and status of occurrence of major speciesof GujaratDistrict 1992 1998Mangroves areas (km 2 )Kachchh 601.8 938.0Jamnagar 13.12 98.3Junagad 0.8 0.3Bhavnagar 14.5 6.2Bharuch 10.9 17.1Surat 7.8 5.0Valsad - 5.0Total 767.0 1066.9Status of occurrence of major speciesSpecies 1950 1998Avicennia sp Common CommonRhizosolenia Common VulnerableAegiceras sp Common EndangeredCeriops tagal Common VulnerableSonneratia apetala Common VulnerableBruigeria sp. Common Absent* Based on satellite data
Table 3.3.9: Distribution of corals in the GulfSpecies 1 2 3 4 5 6 7 8 9 10 11 12 13 14 15Esammocora digitata - - - - - - - + - - - - - - -Acropora humilis - - + + - - + + - - - - - - -A.squamosa - - - + - - - - - - - - - - -Montipora explanata + - + + - + + - + + + + + + +M.venosa - - - + - - + - - - - - - - -M.turgescons - - - - - - + - - - - - - - -M.hispida + + - + + - + + + + + - - - +M.foliosa - - - + - - + - - - - - - - -M.monasteriata - - - + - - + - - - - - - - -Coscinaraea monile + + + + + + + + + - - - - - +Siderastrea savignyana + - - - - - - - - - - - - - -Pseudosiderastrea tayami + - - - - - + + + + + + + + +Goniopora planulata + + - - + + + - + + - + - - +G.minor - - - + - - + - - - - - - - +G.nigra + + - + + + + - - + - - - - +Porites leutea + + + + - - + - - - - + - - +P.lichen + - - - - - + - + - - + - + +P.compressa + + - - - - - - - - - - - - +Favia speciosa - - - - - - - - - - - - - - +F.favus + + + + + + + + + + + + + + +Favites complanata + + + + + + + - - + - - - + +
Table 3.3.9 (Contd 2)Species 1 2 3 4 5 6 7 8 9 10 11 12 13 14 15F.melicerus + - + - - - - - + - - - - + +Goniastrea pectinata + + + + + + + - + + + - + + +Platygyra sinensis + + + + - - - - - + - - - + +Hydnophora exesa + + + + - - - - - + - - + - +Plesiastrea versipora - + - - - - + - - - - - - - -Leptastrea purpurea - - - - - - - - - - - Sikka pointCyphastrea serailia + + + + + + + + + + - - + + +Symphyllia radian - + - + - + - - + - - - - - -Acanthastrea simplex + + + + - - - - + + - - - - +Mycediumelephantotus- - - + - - - - - - - - - - -Paracyathus stokesi + - - - - - - - - - - - - 10 mPolycyathus verrilli + - + - - - + - - - - - - - -Tubastraea aurea + + + + + - - - + + - - - - -Turbinaria crater + + - + - - + - - - - - - - +T.peltata - + + + + + + - - + - - + + +1 : Okha 2 : Dholio Gugar 3 : Dona4 : Boria 5 : Mangunda 6 : Savaj7 : Paga 8 : Manmarudi Langamarudi 9 : Ajad10: Bural reef 11 : Dhani 12 : Kalumbhar reef13: Narara reef 14 : Goose reef 15 : Pirotan islandSource: Pillai, C.S.G. and M.I. Patel (1988)
Table 3.3.10 : List of water birds in the GulfEnglish name Scientific name Status in habitat*Salt pans GulfPodicipedidaeGreat Crested Grebe Podiceps cristatus LM -Blacknecked Grebe Podiceps nigricollis M -PelecanidaeWhite Pelican Pelecanus onocrotalus LM LMDalmatian Pelican Pelecanus crispus M MPhalacrocoracidaeCormorant Phalacrocorax carbo LM LMIndian Shag Phalacrocorax fuscicolli LM LMLittle Cormorant Phalacrocorax niger LM RDarter Anhinga rufa LM RArdeidaeGrey Heron Ardea cinerea LM RPurple Heron Ardea purpurea LM -Little Green Heron Ardeola striatus LM RPond Heron Ardeola grayii LM RCattle Egret Bubulcus ibis - LMLarge Egret Ardea alba LM RSmaller Egret Egretta intermedia LM -Little Egret Egretta garzetta LM -Indian Reef Heron Egretta gularis LM RNight Heron Nycticorax mycticorax LM RCiconiidaePainted Stork Mycteria leucocephala LM RBlacknecked Stork Ephippiorhynchus asiaficus LM LMThreskiornithidaeWhite Ibis Threskiornis aethiopica LM RBlack Ibis Pseudibis papillasa - RSpoonbill Platalea leucorodia LM R
Table 3.3.10 (Contd 2)English name Scientific name Status in habitat*Salt pans GulfPhoenicopteridaeFlamingo Phoenicopterus roseus LM LMLesser Flamingo Phoeniconatas minor LM RAnatidaeRuddy Shel duck Tadorna ferruginea - MPintail Anas acuta M MCommon Teal Anas crecca M -Spotbill Duck Anas poecilorhyncha LM LMShoveller Anas clypeata M -AccipitridaeBrahminy Kite Haliastur indus LM RMarsh Harrier Circus aeruginosus M MOsprey Pandian haliaetus M MGruidaeCommon Crane Grus grus M MDemoiselle Crane Anthropoides virgo M MRallidaeCoot Fulica atra LM LMJacanidaePheasant - tailed Jacana Hydrophasianus chirurgus LM -HaematopodidaeOystercatcher Haematopus stralegus M MCharadriidaeRedwattled Lapwing Vanellus indicus R RGrey Plover Pluvialis sugotarola M MEastern Golden Plover Pluvialis dominica - M
Table 3.3.10 (Contd 3)English name Scientific name Status in habitat*Salt pans GulfLarge Sand Plover Charadrius leschenaultii M MRinged Plover Charadrius hiaticula R -Kentish plover Charadrius alexandrinus R RLesser Sand Plover Charadrius mongolus M MWhimbrel Numenius phaeopus M MCurlew Numenius arquata M MBlacktailed Godwit Limosa limosa M -Bartailed Godwit Limosa lapponica M MSpotted Redshank Tringa erythropus M MCommon Redshank Tringa totanus M MMarsh Sandpiper Tringa stagnatilis M MGreenshank Tringa nebularia M MGreen Sandpiper Tringa ochropus M MWood Sandpiper Tringa glareola M -Terek Sandpiper Tringa terek M MCommon Sandpiper Tringa hypoleucos M MTurnstone Arenaria interpres M MKnot Calidris carutus - MEastern Knot Calidris tenuirostris - VSanderling Calidris alba - MEastern Little Stint Calidris ruficollis - VLittle Stint Calidris minuta M MDunlin Calidris alpina M MCurlew-Sandpiper Calidris testacea M MBroadbilled Sandiper Limicola falcinellus M MRuff and Reeve Philomachus pugnax M MRednecked Phalarope Phalaropus lobatus M MRecurvirostidaeBlackwinged Stilt Himantopus himantopus R -Avocet Recurvirostra avosetta LM -
Table 3.3.10 (Contd 4)English name Scientific name Status in habitat*Salt pans GulfDromadidaeCrab Plover Dromas ardeola M MBurhinidaeGreat Stone Plover Esacus magnirostris LM RLaridaeHerring Gull Larus argentatus M MLesser BlackbackedGull Larus fuscus M MBlackheaded Larus ichthyaetus M MBrownheaded Gull Larus brunnicephalus M MBlackheaded Gull Larus ridibunds M MSlenderbilled Gull Larus genei M MWhiskered Tern Chiildonias hybrida M MWhitewinged Black Chiildonias leucopterus M MTernGullbilled Tern Gelochelidon nilotica M MCaspian Tern Hdroprogne caspia LM LMCommon Tern Sterna hirunda M MWhitecheeked Tern Sterna repressa M MBrownwinged Tern Sterna anaethetus M MLittle Tern Sterna albitrons M MSaunders Little Tern Sterna saundersi LM RLarge Crested Tern Sterna bergii M MIndian Lesser Crested Tern Sterna bengalenis M MSandwich Tern Sterna sandvicensis M MIndian skimmer Rynchops albicollis LM LM
Table 3.3.10 (Contd 5)English name Scientific name Status in habitat*Salt pans GulfAlcedinidaeCommon Kingfisher Alcedo atthis LM LMWhitebreast Halcyon smyrnensisq LM LMBlackcapped kingfisher Halcyon pileata M MR : Resident, has been recorded breeding during the study.LM : Local migrant, has not been recorded breeding during thestudy, but is known to nest within the state.M : Migrant, does not breed in this area, spends the winter hereand also sometimes the summer.V : Not normally found in the area, one to few records only.Source : Saurashtra University (1991).
Table 4.3.1 Water quality at station 1 off Vandh duringDecember 2008Parameter Level Min Max AvTemperature ( o C) S 24.6 24.6 24.6B 24.8 24.8 24.8(26.5) (26.5) (26.5)pH S 8.0 8.1 8.1B 8.0 8.0 8.0SS (mg/l) S - - 32*B - - 38*Salinity (ppt) S 35.7 35.9 35.8B 36.1 36.1 36.1DO (ml/l) S 3.8 4.0 3.9B 4.0 4.3 4.1BOD (mg/l) S - - 2.9*B - - 1.6*PO 4 3- -P (µmol/l) S 1.3 1.3 1.3B 1.8 1.8 1.8NO 3 - -N (µmol/l) S 5.2 7.5 6.3B 6.5 7.1 6.8NO 2 - -N (µmol/l) S 0.6 0.6 0.6B 0.5 0.5 0.5NH 4 + -N (µmol/l) S 0.4 0.5 0.4B 0.7 1.0 0.9PHc (µg/l) 1m - - 1.3*Phenols (µg/l) S - - 20.2*Air temperature ( o C) given in parenthesis* Single value
Table 4.3.2 Water quality at station 2 off Vandh duringDecember 2008Parameter Level Min Max AvTemperature ( o C) S 25.0 26.5 25.7B 24.5 26.0 25.5(23.0) (27.6) (26.5)pH S 7.9 8.1 8.0B 7.9 8.1 8.0SS (mg/l) S 20 24 22B 18 26 22Salinity (ppt) S 36.7 38.0 37.2B 36.7 37.2 37.0DO (ml/l) S 4.5 5.4 4.9B 4.0 5.2 4.6BOD (mg/l) S 0.3 2.4 1.4B 0.3 0.3 0.3PO 4 3- -P (µmol/l) S 2.5 3.5 2.8B 2.0 3.5 2.6NO 3 - -N (µmol/l) S 5.5 10.6 8.0B 6.9 9.6 7.8NO 2 - -N (µmol/l) S 0.3 0.5 0.4B 0.3 0.5 0.4NH 4 + -N (µmol/l) S 0.1 1.3 0.7B 0.4 1.2 0.8PHc (µg/l) 1m 3.1 1.8 2.5Phenols (µg/l) S 18.9 52.5 35.7Air temperature ( o C) given in parenthesis
Table 4.3.3: Water quality at station 3 off Vandh duringDecember 2008Parameter Level Min Max AvTemperature ( o C) S 26.0 26.0 26.0B 26.0 26.0 26.0(29.8) (29.8) (29.8)pH S 8.0 8.0 8.0B 8.1 8.1 8.1SS (mg/l) S - - 26*B - - 34*Salinity (ppt) S 36.5 36.8 36.7B 37.2 37.4 37.3DO (ml/l) S 4.3 4.5 4.4B 4.3 4.3 4.3BOD (mg/l) S - - 3.2*B - - 3.8*PO 4 3- -P (µmol/l) S 1.5 2.1 1.8B 2.4 2.5 2.5NO 3 - -N (µmol/l) S 5.3 5.4 5.3B 5.9 5.9 5.9NO 2 - -N (µmol/l) S 0.4 0.5 0.5B 0.3 0.4 0.3NH 4 + -N (µmol/l) S 0.3 0.5 0.4B 0.7 0.7 0.7PHc (µg/l) 1m - - 1.6Phenols (µg/l) S - - 16.0*Air temperature ( o C) given in parenthesis* Single value
Table 4.3.4: Water quality at station 4 off Vandh duringDecember 2008Parameter Level Min Max AvTemperature ( o C) S 27.5 27.5 27.5B 27.5 27.5 27.5(27.0) (27.0) (27.0)pH S 8.0 8.0 8.0B 8.0 8.0 8.0SS (mg/l) S - - 38*B - - 34*Salinity (ppt) S 35.9 35.9 35.9B 35.9 35.9 35.9DO (ml/l) S 3.1 3.4 3.2B 2.9 2.9 2.9BOD (mg/l) S - - 1.9*B - -
Table 4.3.5: Water quality at station 5 off Vandh duringDecember 2008Parameter Level Min Max AvTemperature ( o C) S 26.5 26.5 26.5B 26.0 26.0 26.0)(28.2) (28.2) (28.2)pH S 8.0 8.1 8.1B 8.0 8.1 8.1SS (mg/l) S - - 30*B - - 54*Salinity (ppt) S 36.8 37.2 37.0B 36.7 36.7 36.7DO (ml/l) S 4.0 4.3 4.1B 4.3 4.3 4.3BOD (mg/l) S - - 3.2*B - - 3.8*PO 4 3- -P (µmol/l) S 1.9 2.2 2.0B 2.5 2.5 2.5NO 3 - -N (µmol/l) S 6.4 6.5 6.4B 6.0 6.8 6.4NO 2 - -N (µmol/l) S 0.2 0.3 0.3B 0.3 0.3 0.3NH 4 + -N (µmol/l) S 0.5 0.8 0.6B 0.7 1.0 0.9PHc (µg/l) 1m - - 0.8*Phenols (µg/l) S - - 6.3*Air temperature ( o C) given in parenthesis* Single value
Table 4.3.6: Water quality at station 6 off Vandh duringDecember 2008Parameter Level Min Max AvTemperature ( o C) S 26.0 26.0 26.0B 24.8 26.5 25.7(29.0) (29.0) (29.0)pH S 8.0 8.0 8.0B 8.1 8.1 8.1SS (mg/l) S - - 32*B - - 44*Salinity (ppt) S 36.5 36.7 36.6B 36.5 36.7 36.6DO (ml/l) S 4.5 4.5 4.5B 4.3 4.5 4.4BOD (mg/l) S - - 3.2*B - - 3.5*PO 4 3- -P (µmol/l) S 1.9 2.1 2.0B 2.3 2.5 2.4NO 3 - -N (µmol/l) S 7.9 8.2 8.0B 6.8 8.9 7.9NO 2 - -N (µmol/l) S 0.3 0.3 0.3B 0.2 0.2 0.2NH 4 + -N (µmol/l) S 0.6 0.8 0.7B 0.5 0.5 0.5PHc (µg/l) 1m - - 1.1*Phenols (µg/l) S - - 5.0*Air temperature ( o C) given in parenthesis* Single value
Table 4.4.1: Sediment quality off Vandh during December 2008SrNoStationCodeSand(%)Silt(%)Clay(%)Al(%)Cr(µg/g)Mn(µg/g)Fe(%)Co(µg/g)Ni(µg/g)Cu(µg/g)Zn(µg/g)Hg(µg/g)C org(%)P(µg/g)PHc(µg/g)Subtidal1 1 98.4 0.4 1.2 0.4 34 327 0.4 2 5 6 25 ND 0.1 415 1.22 2 98.2 1.0 0.8 1.1 45 253 0.7 3 5 7 18 ND 0.2 381 0.33 3 98.6 0.8 0.6 1.3 32 799 3.1 6 9 10 28 ND 0.3 640 0.1Intertidal1 T1 98.8 0.8 0.4 4.7 66 357 2.4 11 27 13 66 ND 0.2 724 0.32 T2 99.6 0.4 0 3.3 67 328 1.4 6 18 9 35 ND 0.2 591 1.0*Dry wt basis except PHc which is in wet wt
Table 4.5.1: (a) Mangrove areas and status of occurrence of major speciesoff Gujarat.(b) Composition and ecological status of mangroves and obligatehalophytes off Mundra.(a)*District 1992 1998Mangroves areas (km 2 )Kachchh 601.8 938.0Jamnagar 13.12 98.3Junagad 0.8 0.3Bhavnagar 14.5 6.2Bharuch 10.9 17.1Surat 7.8 5.0Valsad - 5.0Total 767.0 1066.9Status of occurrence of major speciesSpecies 1950 1998Avicennia Common CommonRhizosolenia Common VulnerableAegiceras sp Common EndangeredCeriops tagal Common VulnerableSonneratia apetala Common VulnerableBruigeria sp. Common Absent* Based on satellite data(b)*Species Habit Habitat EcologicalstatusMangrovesAvicennia marina Tree, shrubs Intertidal DominantRhizophora mucronata Tree Intertidal StraySalvodora persica Tree, shrubs Supralittoral CommonObligate HalophytaSesuvium portulacastrum Runner LowerCommonSupralittoralSalicarnia brachiata Shrub Supralittoral CommonSueda maritime Shrub Supralittoral Rare
Table 4.5.2: Range and average of phytopigment (parenthesis) at different stations offVandh during December 2008.Station Chlorophyll a Phaeophytin Chl a/Phaeo(mg/m 3 )(mg/m 3 )S B S B S B1 2.8-2.9 2.5-2.6 1.3-1.5 1.0* 1.8-2.2 2.5*(2.9) (2.6) (1.4)(2.0)2 1.0-4.7(2.8)1.0-5.9(2.9)0.7-1.7(1.0)0.2-2.0(1.0)1.6-5.3(3.1)1.6-4.9(3.5)3 1.6* 1.7-1.9(1.8)0.4* 0.2* 3.7-4.4(4.0)7.2-9.0(8.1)4 0.8-0.9(0.9)0.7-0.8(0.8)0.3-0.5(0.4)0.2-0.4(0.3)1.7-2.9(2.3)1.9-3.7(2.8)5 0.7-0.9(0.8)0.9-1.0(1.0)0.3-0.4(0.4)0.5-0.6(0.6)2.0-2.1(2.1)1.7-1.8(1.8)6 0.6-0.7(0.7)0.5-0.6(0.6)0.3* 0.2-0.5(0.4)1.9-2.3(2.1)1.3-2.4(1.9)Note: - * Indicate similar value for all replicates.
Table 4.5.3: Range and average (parenthesis) of phytoplankton population at different stations off Vandh duringDecember 2008.Station Date Cell countTotal generaMajor genera(nox10 3 /l)(no)S B S B S B1 02.12.08 656.0* 473.6* 16* 15* FragilariaThalassiosiraThalassionemaNaviculaFragilariaThalassionemaNaviculaThalassiosira2 03.12.08 148.0-1922.4(1035.2)118.4-6432.8(3275.6)14-16(15)13-16(15)FragilariaThalassiosiraPeridiniumNitzschia3 04.12.08 165.6* 172.0* 17* 15* FragilariaThalassiosiraSkeletonemaNavicula4 02.12.08 40.0* 39.6* 18* 16* FragilariaPeridiniumThalassiosiraThalassiothrix5 04.12.08 32.8* 36.8* 15* 15* FragilariaThalassiosiraPleurosigmaNavicula6 04.12.08 62.4* 40.0* 19* 18* FragilariaMelosiraThalassionemaLeptocylindrusNote: - * Indicate similar value for all replicates.FragilariaThalassiosiraNaviculaNitzschiaFragilariaThalassiosiraNitzschiaBacteriastrumFragilariaPeridiniumMelosiraThalassiosiraFragilariaMelosiraThalassionemaBiddulphiaFragilariaMelosiraThalassionemaThalassiosira
Table 4.5.4: Distribution of phytoplankton populationat different stations off Vandh duringDecember 2008Algal GeneraSTATION1 2 3 4 5 6Amphiprora + - - - - -Amphora - + + - - +Bacteriastrum - + + + + +Biddulphia + + + + + +Campyloneis - + - - + +Ceratium - - - - + +Ceratoulina + - - - - -Corethron - + + + + +Coscinodiscus + + + + - +Cyclotella + + + + + +Diploneis - - - - + +Ditylium + + - - - -Fragillaria + + + + + +Guinardia - + + + - +Leptocylindrus - + + + + +Licmophora - - + - - -Lithodesmium + + + + + +Melosira + - - + + +Navicula + + + + + +Nitzschia + + + + - +Peridinium + + + + + +Planktoniella - + + + - +Pleurosigma + + + + + +Prorocentrum + + + + + +Rhizosolenia + + - + + +Skeletonema - - + - - -Streptotheca - + + + + +Surirella + + + - + +Thalassionema + + + + + +Thalassiosira + + + + + +Thalassiothrix + + + + + +Total genera 19 24 23 21 21 26
Table 4.5.5: Range and average (parenthesis) of zooplankton production off Vandhduring December 2008.Station(Date)1(02.12.08)2(31.12.08)3(04.12.08)Biomass(ml/100 m 3 )7.3-11.8(9.6)1.1-8.6(3.6)1.8-2.9(2.4)Population(nox10 3 /100 m 3 )83.3-86.2(84.8)2.3-27.8(11.8)11.3-21.7(16.5)Total groups(no)14-18(16)12-19(16)14-14(14)Major group(%)Copepods (82.4)decapod larvae (9.4)chaetognaths (2.5)foraminiferans (2.1)polychaetes (1.3)gastropods (1.3)appendicularians (0.6)ostracods (0.2)siphonophores (0.1)others (0.1)Copepods (65.6),decapod larvae (22.0),chaetognaths (3.0),polychaetes (2.4)foraminiferans (2.1),gastropods (1.1)appendicularians (1.1)siphonophores (0.8)fish eggs (0.6)heteropods (0.4)ostracods (0.4)lucifer sp. (0.2)fish larvae (0.1)lamellibranchs (0.1),others (0.1)Copepods (67.5),decapod larvae (25.9)gastropods (4.1),chaetognaths (1.0),foraminiferans (0.7),siphonophores (0.3),polychaetes (0.1),appendicularians (0.1)lamellibranchs (0.1),ostracods (0.1),others (0.1).
Table 4.5.5 (Contd.2)Station(Date)4(21.12.08)5(04.12.08)6(04.12.08)Biomass(ml/100 m 3 )1.6-14.1(7.9)1.6-2.1(1.9)0.4-3.7(2.1)Population(nox10 3 /100 m 3 )4.3-39.3(21.8)11.4-12.7(12.1)3.6-6.2(4.9)Total groups(no)16-17(17)14-17(16)9-11(10)Major group(%)Copepods (65.5),decapod larvae (24.1),appendicularians (3.3)foraminiferans (3.1)chaetognaths (2.3),gastropods (0.5)ostracods (0.5),lucifer sp. (0.2),fish larvae (0.1),heteropods (0.1),polychaetes (0.1),fish larvae (0.1),others (0.1).Decapod larvae (68.3)copepods (27.8)chaetognaths (1.2)gastropods (0.9),foraminiferans (0.7)polychaetes (0.3),ostracods (0.3),siphonophores (0.2)stomatopods (0.1),fish larvae (0.1),Copepods (47.5),decapod larvae (46.6),chaetognaths (2.7),foraminiferans (1.5),stomatopods (0.7),fish larvae (0.5),ostracods (0.1)gastropods (0.1),siphonophores (0.1),polychaetes (0.1)others (0.1).
Table 4.5.6: Distribution of zooplankton off Vandhduring December 2008Faunal group(+: Present; - : Absent)Station1 2 3 4 5 6Foraminiferans + + + + + +Siphonophores + + + + + +Medusae + + + + - -Ctenophores - + - + - -Chaetognaths + + + + + +Polychaetes + + + + + +Ostracods + + + + + +Copepods + + + + + +Cumaceans + + - - - -Amphipods + + - + + -Mysids - + - - + -Lucifer sp. + + + + + +Decapod larvae + + + + + +Stomatopods + + + + + +Heteropods - + - + + -Cephalopods - - - - + -Gastropods + + + + + +Lamellibranchs + + + + + -Appendicularians + + + + + -Fish eggs + + + + + +Fish larvae + + + + + +Isopods + - - + - -<strong>Marine</strong> insects - + - - - -
Table 4.5.7: Total counts and average (parenthesis) of decapod larvae,fish eggs and fish larvae off Vandh during December 2008Stations Decapod larvae Fish eggs Fish larvaeCounts (no/100m 3 ) Counts (no/100m 3 ) Counts (no/100m 3 )1 6486-9462(7974)2-31(17)5-12(9)2 670-7411(2606)0-239(68)0-78(13)3 6486-9462(7974)2-3(3)1-3(2)4 408-10101(5255)1-25(13)7-56(32)5 7149-9356(8253)4-6(5)6-15(11)6 1270-3316(2293)0-1(1)7-48(28)Over allAverage408-10101(5726)0-239(18)0-78(16)
Table 4.5.8: Range and average (parenthesis) of intertidal macrobenthos atdifferent water level off Vandh during December 2008.TransectIHWMWLWBiomass(g/m 2 ; wet wt.)5.19-15.1(11.3)0.69-15.27(6.9)0.27-.093(0.6)Population(no/m 2 )3124-12848(6666)792-10332(3551)440-660(583)Faunal groups(no)4-7(6)4-7(5)3-4(4)Major groupPolychaetes,amphipods.Gastropods,polychaetes,amphipods.Polychaetes,amphipods.IIHWMWLWOver allAverage6.82-23.75(17.5)4.87-10.77(7.1)1.62-4.16(2.8)0.27-23.75(7.7)1408-3080(2090)2332-4312(3113)2552-9240(5018)440-12848(3504)5-6(5)5-6(6)5-6(6)3-8(5)Amphipods,polychaetes,tanaids.Polychaetes,amphipods,cumaceans.Amphipods,cumaceans,polychaetes.Amphipods,polychaetes,gastropods,cumaceans.
Table 4.5.9: Composition (%) of intertidal macrobenthic fauna in coastal water off Vandhduring December 2008Faunal groups Transect I Transect II AvHW MW LW HW MW LWPhylum CnidariaHydrozoans 0.4 0.4 0.14Anthozoans 0.2 0.1Phylum MolluscaGastropods 69.1 1.9 1.4 0.7 12.1Pelecypods 1.9 0.6 0.5 2.1 0.2 1.1Phylum AnnelidaPolychaetes 48 14.2 64.2 26.8 42.4 12.3 31.3Phylum ArthropodaTanaids 6.4 2.5 7.5 14.2 2.5 1.8 4.9Cumaceans 0.2 0.9 3.8 1.1 20.8 31.4 10.9Amphipods 41.9 11.2 20.8 43.2 27.9 51.3 36.4Isopods 0.3 0.6 3.2 0.5 0.6Anomurans 0.2 0.04Mysids 0.7 0.1Pycnogonids 0.5 0.1Brachyurans 0.9 0.9 1.9 11.1 1.8 0..5 1.9Ostracods 0.2 0.04Penaeids 0.2 0.04
Table 4.5.10: Range and average (parenthesis) of subtidal macrobenthicfauna off Vandh during December 2008SubtidalBiomass(g/m 2 ; wet wt.)1 0.1-
Table 4.5.11: Composition (%) of subtidal macrobenthos in coastal water off Vandh during December 2008Faunal GroupsStations1 2 3 4 5 6Phylum CnidariaHydrozoans 1.8 * * *Phylum MolluscaGastropods 4.3Pelecypods 11.2Phylum AnnelidaPolychaetes 76 77.3 10.3Phylum ArthropodaOstracods 9.8 3.4Brachyurans 31Pycnogonids 5.9Tanaidaceans 8.7Amphipods 24 12.9 21.5Cumaceans 1.8Note: - * Indicates rocky bottom.
Table 4.5.12: <strong>Marine</strong> fish landings (t x10 3 /y) of Gujarat State and districtsadjoining the GulfYear State Jamnagar Rajkot Kachchh Total contributionBy districts (%)1965-66 109.9 4.2 -- 2.4 6.01966-67 115.2 2.8 -- 3.0 5.01967-68 124.9 3.8 -- 3.3 5.71968-69 131.7 2.8 -- 2.3 3.81969-70 140.0 2.9 -- 2.7 4.01970-71 151.2 4.7 -- 3.9 5.71971-72 147.0 5.5 -- 4.1 6.51972-73 151.2 4.6 -- 4.8 6.21973-74 177.6 6.8 -- 6.9 7.71974-75 157.4 3.0 0.3 4.3 4.81975-76 208.3 5.1 2.2 3.8 5.31976-77 225.4 21.7 1.3 5.4 12.61977-78 176.9 14.5 0.4 6.3 12.01978-79 230.0 21.8 2.7 6.3 13.41979-80 206.7 24.8 0.6 5.7 15.01980-81 218.9 32.3 1.7 4.4 17.51981-82 220.6 34.2 2.0 6.3 19.31982-83 192.7 29.7 0.5 13.8 22.81983-84 223.3 27.4 1.3 23.3 17.31984-85 290.7 31.5 0.7 34.3 22.9
Table 4.5.12 (contd.2)Year State Jamnagar Rajkot Kachchh TotalcontributionBy districts (%)1985-86 306.6 25.2 1.7 35.4 20.31986-87 315.9 28.0 0.5 31.3 18.91987-88 327.6 40.2 0.5 29.7 21.51988-89 414.1 44.2 2.8 46.9 22.71989-90 432.4 45.4 2.5 49.6 22.51990-91 500.5 54.3 1.8 65.4 24.31991-92 530.0 63.5 2.7 61.8 24.11992-93 609.1 66.2 1.1 63.0 21.41993-94 619.8 58.9 1.5 63.2 19.91994-95 645.3 58.9 1.5 76.8 21.01995-96 598.4 68.1 1.0 72.6 23.71996-97 660.1 76.2 0.9 76.7 23.31997-98 702.4 56.0 0.8 71.8 18.31998-99 551.7 28.6 0.2 69.7 17.91999-00 671.0 71.7 0.8 75.0 22.02000-01 620.5 72.6 1.7 64.7 22.42001-02 650.8 83.4 2.1 80.0 25.42002-03 743.4 102.8 1.5 80.7 24.92003-04 609.1 37.9 1.7 72.0 18.32004-05 585.0 45.9 1.9 64.7 19.22005-06 663.9 66.5 1.5 62.4 19.6Source: Department of Fisheries, Government of Gujarat
Table 4.5.13: Composition of marine fish landings (t/y) of Kachchh district during 1997-98,1998-99, 2000-01, 2002-03, 2004-05 and 2005-06Name of fish 1997-98 1998-99 2000-01 2002-03 2003-04 2004-05 2005-06White pomfret 1110 801 924 1022.4 1103.9 725.3 1673Black pomfret 35 33 140 45.5 74.9 77.3 49Bombay duck 15011 12354 13547 14152.0 12264.2 10021.4 8436Thread fin 737 944 351 1331.9 1048.5 380.5 434Jew fish 1124 1372 520 1780.4 1496.0 802.1 742Hilsa 225 208 142 221.9 181.2 36.9 194Other clupeids 2116 1762 1947 2242.2 2380.0 2240.8 2406Coilia 5603 6028 3829 5801.2 6088.2 6117.8 3980Shark 3415 2686 2118 3817.7 2986.1 1629.6 1837Mullet 2132 1864 878 786.9 1361.9 1348.7 2557Cat fish 1367 1782 1030 2428.6 1896.2 1476.3 1834Eel 79 134 153 236.5 146.0 299.0 156Leather jacket 113 88 144 161.8 93.6 158.9 479Seer fish 238 406 192 345.5 421.3 316.1 354Indian salmon 201 329 158 223.8 149.1 241.4 257Ribbon fish 3294 1950 2556 3076.9 2964.4 2601.2 2392Silver bar 518 453 528 796.9 1324.3 1517.6 1253Perches 254 215 298 728 409.3 408.9 244Small sciaenids 23848 26742 22685 4432..0 4435.6 4545.7 4253Shrimp 4810 5512 5008 6659.1 6351.2 5364.3 6281Prawns(medium)1732 1302 1260 1226.3 1631.9 780.1 1025Prawns (Jumbo) 166 191 372 239.7 292.8 215.8 212Lobster 33 43 88 120.1 49.0 23.1 89Crabs 140 42 229 40.6 37.0 44.2 121Mud Skipper 1 0 20 0.4 - - 11Squid 22 14 38 22.1 19.0 18.1 40Others 3463 2429 5541 28778.7 22789.9 23162.3 21045Total 71787 69685 64696 80714.3 71995 64680.2 62394Source: Department of Fisheries, Government of Gujarat
Table 4.5.14: Month-wise composition of marine fish landings (t) of Kachchh district during 2002-03Name of fish April 02 May June July Aug Sep Oct Nov Dec Jan 03 Feb Mar TotalWhite pomfret 74.5 74.5 - - 0.8 192.3 79.0 104.6 136.8 99.2 93.9 96.6 952.0Black pomfret 5.3 - - - - 4.0 3.6 7.7 5.5 15.7 1.8 1.8 45.5Bombay duck 844.5 1009.0 - - - 93.2 1429.6 3101.3 2527.7 2606.5 2047.9 1146.9 14806.5Thread fin 237.2 47.4 - - - 22.1 29.0 66.4 109.2 160.5 226.6 404.8 1301.2Jew fish 245.8 44.2 - - 1.7 48.6 103.3 108.5 150.4 302.8 321.7 417.7 1744.6Hilsa 11.2 - - - - 8.6 18.1 26.1 32.9 30.6 50.1 44.2 221.9Other clupeids 140.3 67.7 0.7 - 17.2 87.6 154.7 450.4 313.4 182.5 182.8 677.5 2274.9Coilia 260.1 424.5 - - 2.2 60.7 412.3 1139.0 1004.0 1165.1 1095.8 514.6 6078.3Shark 294.2 42.4 0.2 - 20.5 133.6 261.3 590.9 689.7 889.8 450.9 425.1 3798.5Mullet 61.5 47.1 6.3 - 74.8 125.5 125.2 95.6 54.7 92.2 40.6 55.0 778.4Cat fish 257.0 95.5 1.7 - 24.5 93.8 175.4 253.5 224.7 387.2 273.4 701.8 2445.3Eel 32.1 - - - - 0.6 13.5 43.8 50.0 27.4 44.6 24.6 236.5Leather jacket 5.3 - - - - 9.5 19.8 20.9 26.4 43.2 16.7 20.0 161.8Seer fish 15.6 - - - - 23.6 54.4 61.2 64.5 51.1 46.6 28.5 345.5Indian salmon 8.9 4.7 - - - 17.1 30.4 28.3 32.1 34.9 39.8 27.6 223.8
Table 4.5.14 (Contd 2)Name of fishApril02May June July Aug Sep Oct Nov Dec Jan 03 Feb Mar TotalRibbon fish 203.7 - - - 2.1 100.6 169.1 590.7 618.7 641.0 510.1 241.4 3077.3Silver bar 143.0 90.4 0.1 - 0.2 18.1 83.7 85.6 71.0 85.3 96.9 185.2 859.5Perches 24.7 14.0 - - 0.5 32.8 263.0 105.9 112.5 58.1 71.0 45.5 728.0Small scienides 308.8 32.7 - - 5.8 496.1 399.7 691.8 794.8 541.3 706.3 447.1 4424.5Shrimps 454.5 206.7 1.0 - 16.7 540.5 532.8 1132.7 1161.5 1051.4 1010.1 689.7 6797.5Prawns(medium)144.6 48.9 1.6 - 1.7 158.4 67.2 190.6 230.3 105.3 181.2 114.2 1243.9Prawns (jumbo) 11.1 - - - 0.2 29.8 12.0 36.9 34.6 63.7 30.3 21.3 239.7Lobster 2.0 - - - - 7.4 22.5 25.6 24.0 16.7 12.1 9.7 120.1Crabs 14.8 0.2 - - - 2.1 3.9 5.1 5.1 3.4 3.5 2.5 40.6Levta 0.4 - - - - - - - - - - - 0.4Squid fish 1.2 - - - - 1.4 2.3 3.7 4.3 4.2 3.2 1.7 22.1Miscellaneous 2047.9 83.3 2.9 - 23.3 1790.3 2560.4 4713.3 5359.9 4619.5 4622.0 2988.4 28811.2Total 5849.9 2333.0 14.4 - 192.2 4098.1 6981.2 13679.8 13838.5 13278.7 12980.1 933.4 81779.4Source: Department of Fisheries, Government of Gujarat
Table 4.5.15: <strong>Marine</strong> fish landings (t x 10 3 /y) of Kachchh district and itscomparison with the landing at Mundra.YearKachchhDistrictMundraPercentage of districtlandings1991-92 61.8 2.4 3.91992-93 63.0 0.4 0.61993-94 63.2 0.8 1.21994-95 76.8 0.6 0.81995-96 72.7 2.7 3.81996-97 76.7 - -1997-98 71.8 1.3 1.81998-99 69.7 1.7 2.41999-00 75.0 - -2000-01 64.7 0.4 0.62001-02 80.2 1.4 1.72002-03 81.8 1.6 2.02003-04 72.1 1.6 2.22004-05 64.7 1.6 2.52005-06 62.4 1.0 1.6Source: Department of fisheries, Government of Gujarat
Table 4.5.16: Composition of marine fish landings (t/y) at Mundra during 1994-2006Name of fish 94-95 95-96 97-98 2000-01 01-02 02-03 05-06White pomfret 19.2 68.4 18.0 10.5 11.5 15.8 8.3Black pomfret 3.3 13.0 - - - 2.5 -Bombay duck 205.1 1040.0 540.5 122.6 602.7 737.5 344.1Jew fish 14.8 43.3 6.2 - 13.2 36.9 -Other clupeids -- -- 9.3 19.3 9.1 18.1 59.9Coilia 171.3 549.4 323.3 52.7 219.0 292.5 235.8Shark 12.7 25.4 6.3 8.5 32.9 42.2 0.2Mullet 17.2 -- 24.9 17.5 5.0 19.0 28.9Cat fish 9.0 9.6 11.9 23.7 68.6 80.7 22.8Eel -- -- -- - 2.3 - -Leather jacket -- -- 2.2 - 1.8 2.5 -Seer fish 7.1 14.1 12.7 4.0 12.1 21.1 4.3Indian salmon - - - - - - 5.6Ribbon fish 2.1 -- 3.3 10.6 6.5 24.3 28.8Silver bar 2.6 6.9 5.6 2.3 19.4 47.6 15.0Small sciaenids 7.3 5.5 13.2 3.8 7.9 2.4 60.3Shrimps - - - - - - 73.1Prawns(medium)13.9 6.6 10.0 24.2 208.8 132.2 22.6Lobster -- 0.5 1.1 1.9 2.9 - 5.8Crabs 8.5 1.0 0.9 3.1 - - 2.2Levta -- 1.8 -- - - - -Others 73.8 212.5 227.4 47.3 158.2 170.0 113.0Total 623.5 2730.4 1263.9 351.7 1381.6 1645.3 1030.7Source: Department of Fisheries, Government of Gujarat
Table 4.5.17: Month-wise marine fish landings (t) around Mundra during 2005-06LandingcentreApril 05 May June July Aug Sept Oct Nov Dec Jan 06 Feb Mar TotalNavinal 39.0 74.4 9.0 6.9 18.1 20.7 8.6 267.1 226.5 178.6 86.4 134.8 1070.1Jarpara 18.6 2.3 12.4 6.6 18.3 33.1 0 15.3 26.2 70.8 90.9 38.2 3327.0Mundra 205.3 151.9 16.9 17.6 20.2 30.1 17.5 45.9 46.8 180.7 138.2 159.5 1031.0Bhadreshwar 145.7 93.4 9.4 9.6 19.2 94.7 344.8 350.7 332.0 222.5 284.1 253.4 2159.5Source: Department of Fisheries, Government of Gujarat
Table 4.5.18: Composition of marine fish landings (t) around Mundra during 2005-06Name of fish Mundra Jarpara Navinal BhadreshwarWhite pomfret 8.3 0.7 14.4 49.5Black pomfret - - - -Bombay duck 344.1 30.7 379.1 707.9Jew fish - - 17.0 7.5Hilsa - 7.1 3.0 1.3Other clupeids 59.9 46.8 35.2 156.8Coilia 235.8 3.8 197.1 288.6Shark 0.2 12.6 34.6 22.8Mullet 28.9 19.3 31.9 46.9Cat fish 22.8 23.9 46.8 70.0Eel - - 5.3 -Seer fish 4.3 4.7 12.5 3.1Indian salmon 5.6 10.9 17.4 0.7Leather jacket - 12.6 12.0 -Ribbon fish 28.8 7.6 22.8 112.9Silver bar 15.0 3.2 12.8 50.3Small sciaenids 60.3 23.8 71.6 159.2Shrimps 73.1 58.0 60.8 180.5Prawns (medium) 22.6 6.3 13.0 38.0Lobster 5.8 2.7 5.7 -Crabs 2.2 - 3.9 4.8Miscellaneous 113.0 57.9 73.5 258.7Total 1030.7 332.6 1070.5 2159.5Source : Department of Fisheries, Government of Gujarat
Table 4.5.19: District-wise fishing villages, fishermen, boats and fishinggears (2003) of Kachchh districtParameterLength of coast line (km) 406Percentage of the coast line of Kachchhdistrict25.4Fishing villages/cities (no) 73Fishermen families (no) 3650Total fishermen population (no) 18664Active fishermen (no) 10615Fishing boats (mechanised) (no) 1219Fishing boats (non-mechanised) (no) 291Total fishing gears (nets) (no) 25917Trawlers (no) 11Gill netters (no) 188Others (no) 1019Source: Department of Fisheries, Government of Gujarat.
Table 4.5.20: Village-wise fishermen, boats and fishing gears around MundraVillage Total fishermen Fishing boatsFamilies Gents Ladies Total Mechanised Non-mechanised TotalNavinal 22 62 53 115 9 - 9Jarpara 101 307 278 585 20 - 20Dharab 16 54 47 101 - - -Mundra 71 180 146 326 80 - 80Chenkhedia 74 248 230 478 24 - 24Luni 227 619 660 1279 65 1 66Bhadreshwar 194 541 554 1095 95 - 95Total 705 2011 1968 3979 293 1 294Source: Department of Fisheries, Government of Gujarat.
Table 4.5.21: Species compositions of fish catch off Tunda-Vandh during April/May 2007Station/(Date)KotdiCreek(30.4.07)Time (h)/(Tide)1030(Fl)CatchKg/hrTotal Species(no)5.3 F-8P-3O-2Fishes:Prawns:Common SpeciesHarpadon nehereus, Sillago sihama, Johnius glaucus, Arius caelatus,Ilisha sp., Coilia dussumieri, Otolithes sp., Thryssa sp.Exhippolysmata ensirostris, Metapenaeus sp., ParapenaeopsisstyliferaOthers:Neptunus pelagicus, Matuta planipesKotdiCreek(2.5.07)1300(Fl)5.0 F-9P-2O-2Fishes:Sillago sihama, Johnius glaucus, Harpadon nehereus, Thryssa sp.,Arius caelatus, Coilia dussumieri, Valamugil seheli, Ambassidae,Arius sp.Prawns:Metapenaeus sp., Exhippolysmata ensirostrisOthers:Neptunus pelagicus, SquillaKotdi Off(29.4.07)1200(Fl)12.0 F-13P-4O-3Fishes:Harpadon nehereus, Johnius glaucus, Coilia dussumieri, Arius jella,Polynemus tetradactylus, Scomberomorus guttatus, Otolithes sp., Ilishasp., Pampus argentius, Scoliodon laticaudus, Thryssa hamiltoni,Lepturocanthus savala, Terapon therapsPrawns:Exhippolysmata ensirostris, Metapenaeus sp., Metapenaeus dobsoni,Exopalaemon styliferaOthers:Neptunus pelagicus, Loligo, Squilla
Table 4.5.21 (Contd 2)Station/(Date)Kotdi Off(30.4.07)Time (h)/(Tide)1300(Fl)CatchKg/hr14.5 F-14P-4O-4Total Species(no)Fishes:Common SpeciesHarpadon nehereus, Thryssa setiostris, Thryssa vitrirostris,Pampus argentius, Synaptura commersoniana, Caranx para,Coilia dussumieri, Arius caelatus, Scoliodon laticaudus,Ilisha sp., Otolithus brunneus, Johnius sp., Otolithus sp.,Lepturocanthus savalaPrawns:Penaeus indicus, Parapenaeopsis sculptilis, Exhippolysmataensirostris, Metapenaeus sp.Others:Charybdis cruciata, Neptunus pelagicus, Loligo, SquillaKotdi Off(2.5.07)1600(Eb)9.8 F-11P-4O-4Fishes:Harpadon nehereus, Pampus argentius, Ilisha megaloptera,Thryssa vitrirostris, Caranx para, Coilia dussumieri, Johniusglaucus, Arius caelatus, Arius sp., Otolithes sp. ,Scomberomorus guttatusPrawns:Exhippolysmata ensirostris, Metapenaeus brevicornis,Penaeus merguiensis, Metapenaeus sp.Others:Charybdis cruciata, Neptunus pelagicus, Loligo, Squilla
Table 4.5.22: Species compositions of fish catch off Tunda-Vandh during October/November 2007Station/(Date)Kotdi CreekTime (h)/(Tide)1000Catch Total SpeciesKg/hr (no)5.5 F-10Fishes:Common SpeciesJohnius glaucus, Coilia dussumieri, Ilisha megaloptera, Terapon(9.10.07)(Fl)P-3jarbua, Trichurus lepturus, Polynemus tetradactylus, Liza parsia,O-2Valamugil seheli, Sillago sihama, Arius sp.Prawns:Penaeus indicus, Parapenaeopsis sculptilis, metapenaeopsis sp.Others:Charybdis annulata, SquillaKotdi Creek15007.0 F-11Fishes:Trichurus lepturus, Coilia dussumieri, Harpadon nehereus,(14.10.07)(Fl)P-3Opisthopterus tardoore, Pseudomecanthus strigelliter, AriusO-4caelatus, Johnius glaucus, Terapon theraps,, Sillago sihama,Arius sp.Prawns:Parapenaeopsis sculptilis, Exhippolysmata ensirostris,Metapenaeus sp.Others:Matuta planipes , Charybdis cruciata, Loligo, SquillaKotdi Creek09003.0 F-7Fishes:Harpadon nehereus, Johnius glaucus, , Sillago sihama, Trichurus(14.10.07)(Eb)P-2sp., Arius caelatus, Mugil sp., Coilia dussumieriO-2Prawns:Metapenaeus brevicornis, Metapenaeus sp.Others:Charybdis annulata,Squilla
Table 4.5.22 (Contd 2)Station/(Date)Kotdi offTime (h)/(Tide)1500Catch Total SpeciesKg/hr (no)15.5 F-13Fishes:Common SpeciesTrichurus lepturus, Coilia dussumieri, Harpadon nehereus,(16.10.07)(Fl)P-3Johnius glacus, Arius caelatus, Sillago sihama, LepturocanthusO-3savala, Terapon theraps, Pampus argentius, Pampus chinensis,Otolithes sp., Ilisha megaloptera, Thryssa sp.Prawns:Exopalaemon ensirostris, Metapenaeus sp., Penaeus sp.Others:Charybdis annulata, Neptunus pelagicus, SquillaKotdi Off160018.0 F-14Fishes:Johnius glacus, Trichurus lepturus, Coilia dussumieri, Harpadon(18.10.07)(Fl)P-3nehereus, Pampus argentius, Pampus chinensis, IlishaO-4megaloptera, Thryssa hamiltoni, Scoliodon laticadus, Otolithusbrunneus, Thryssa sp., Sillago sihama, Arius sp., Otolithus sp.Prawns:Penaeus indicus, Parapenaeopsis sculptilis, Metapenaeus sp.Others:Neptunus pelagicus, Charybdis annulata, Squilla, LoligoKotdi Off100013.0 F-15Fishes:Coilia dussumieri, Trichurus lepturus, Harpadon nehereus,(18.10.07)(Eb)P-4Pampus argentius, Pseudomecanthus strigelliter, OpisthopterusO-4tardoori, Johnieopsis vogleri, Drepane longimana, Oligoplitessp., Terapon puta, Ilisha megaloptera, Arius caelatus, Johniusglacus, Scoliodon laticaudus, Otolithes sp.Prawns:Solenocera crassicornis, Exhippolysmata ensirostris,Parapenaeopsis stylifera, Penaeus sp.Others:Matuta planipes, Charybdis cruciata, Squilla, Loligo
Table 4.5.23: Check list of birds recorded in the study area (Mundra)No Scientific name Common English name T/W AbundancestatusFamily & speciesPhasianidae1 FrancolinuspondicerianusMigratorystatusGrey francolin T C R2 Pavo cristatus Indian peafowl T C RPicidae3 DendrocoposmahrattensisUpupidaeYellow-crownedwoodpeckerT VR R4 Upupa epops Common hoopoe T R RCoraciidae5 Coracias garrulus European roller T R M6 Coracias benghalensis Indian roller T C RAlcedinidae7 Alcedo hercules Common kingfisher W R R8 Halcyon amayroptera White throated kingfisher W R RMeropidae9 Merops orientalis Green bee-eater T A R10 Merops persicus Blue-cheeked bee-eater T R RMCuculidae11 EudynamysscolopaceaCentropodidaeIndian Koel T C R12 Centropus sinensis Greater coucal T R RPsittacidae13 Psittacula krameri Rose-ringed parakeet T C RApodidae14 Apus affinis House swift T R RStrigidae15 Bubo nipalensis Spot-bellied eagle-owl T R R16 Athene brama Spotted owlet T C R
Table 4.5.23 (Contd 2)No Scientific name Common English name T/W AbundancestatusCaprimulgidaeMigratorystatus17 Caprimulgus indicus Sykes’s nightjar T R RM18 Caprimulgus asiaticus Indian nighjar T R RColumbidae19 Columba livea Blue rock pigeon T A R20 Streptopeliasenegalensis21 StreptopeliatranquebaricaLaughing dove T A RRed collared-dove T R R22 Streptopelia decaocto Eurasian collared-dove T C ROtididae23 Chlamydotis macqueeni Houabara bustrad T VR MGruidae24 Grus leucogeranus Common crane W/T C MPteroclidae25 Pterocles alchata Chestnut-belliedsandgrouseScolopaciadaeT C R26 Limosa limosa Black-tailed godwit W R M27 Limosa lapponica Bar-tailed godwit W C M28 Numenius phaeopus Whimbrel W A M29 Numenius arquata Eurasian curlew W A M30 Tringa erythropus Spotted redshank W R M31 Tringa totanus Common redshank W A RM32 Tringa stagnatilis Marsh sandpiper W C M33 Tringa nebularia Common greenshank W C R34 Tringa glareola Wood sandpiper W R M35 Xenus cinereus Terek sandpiper W C W36 Actitis hypoleucos Common sandpiper W A RM
Table 4.5.23 (Contd 3)No Scientific name Common English name T/W Abundance statusMigratory status37 Calidris tenuirostris Sanderling W C M38 Calidris minuta Little stint W R M39 Calidris temminckii Temminck’s stint W R M40 Calidris alpina Dunlin W C M41 Philomachus pugnax Ruff W R M42 Phalaropus lobatus Red-necked phalarope W R M43 Vanellus malarbaricus Yellow-wattled lapwing T R R44 Vanellus indicus Red-wattled lapwing W/T A RCharadriidae45 Haematopusostralegus46 HimantopushimantopusEurasian oystercatcher W R MBlackwinged stilt W R R47 Recurvirostra avosetta Pied avocet W R RM48 Pluvialis apricaria Eurasian golden plover W R M49 Pluvialis squatarola Grey plover W R M50 Charadrius hiaticula Common ringed plover W C RM51 Charadriusalexandrinus52 CharadriusleschenaultiiGlareolidaeKentish plover W C RMGreater sand plover W C M53 Dromas ardeola Crab-plover W R MLaridae54 Rynchops albicollis Indian skimmer W VR R55 Larus argentatus Herring gull W VR R56 Larus brunnicephalus Brown-headed gull W R RM57 Larus genei Slender Billed tern W A RM58 Gelochelidon nilotica Gull-billed tern W A RM59 Sterna caspia Capian tern W R RM
Table 4.5.23 (Contd 4)No Scientific name Common English name T/W AbundancestatusMigratorystatus60 Sterna aurantia River tern W C R61 Sterna bergii Great crested tern W R R62 Sterna albifrons Little tern W R R63 ChlidoniashybridusAcipitridaeWhiskered tern W C RM64 Pandion haliaetus Osprey W/T VR RM65 Pernis ptilorhyncus Oriental honey buzzard T VR RM66 Elanus caeruleus Black-shouldered kite T VR R67 Haliastur indus Brahminy kite T VR R68 Circaehr gallicus Shorat-toed snake-eagle69 Circus aeruginosus Eurasian marsh harrier T/W VR M70 Circus macrourus Pallid harrier T VR M71 Accipiter nisus Eurasian sparrowhawk T R M72 Aquila rapax Tawny eagle T VR R73 Hieraaetus fasciatus Bonelli’s eagle T VR RFalconidae74 Falco tinnunculus Common kestrel T VR RM75 Falco chicquera Red-headed merlin T VR R76 Falco subbuteo Northern hobby T VR RM77 Falco jugger Lagger falcon T VR RMArdeidae78 Egretta garzetta Little egret W C R79 Egretta gularis Western reef heron W RM80 Ardea cinerea Grey heron W RM81 Casmerodius albus Great egret W RM82 Mesophoyx intermedia Intermediate egret W RM83 Bubulcus ibis Cattle egret T R84 Ardeola grayii Indian pond-heron W R
Table 4.5.23 (Contd 5)No Scientific name Common English name T/W AbundancestatusMigratorystatus85 Phoenicopterus ruber Greater flamingo W R86 Phoenicopterus minor Lesser flamingo W RThreskiornithidae87 ThreskiornismelanocephalusAsian white ibis W R88 Pseudibis papillosa Black ibis W/T R89 Platalea leucorodia Eurasian spoonbill W RMPelecanidae90 Pelecanus crispus Dalmatian pelican W MCiconiidae91 Mycteria leucocephala Painted stork W RMLaniidae92 Lanius collurio Rufous-tailed shrike T M93 Lanius vittatus By-backed shrike T R94 Lanius schach Long-tailed shrike T R95 Lanius excubitor Great grey shrike T RMCorvidae96 Corvus slendens House crow T R97 Corvus macrorhynchosJungle crow T R98 PericrocotuscinnamomeusSmall minivet T R99 Dicrurus macrocercus Black drongo T R100 Aegithina tiphia Marshall’s lora T R101 TephrodornispondicerianusMuscicapidaeLesser woodshrike T R102 Ficedula zanthopygia Red-throated flycatcher T M103 Saxicoloides fulicate Indian robin T R104 Phoenicurus ochruros Black redstart T M105 Oenanthe pleschanka Pied wheatear T M
Table 4.5.23 (Contd 6)No Scientific name Common English name T/W AbundancestatusMigratorystatus106 Oenanthe deserti Desert wheather T M107 Oenanthe isabellina Isabelline wheather T MSturnidae108 Strunus pagodarum Brahminy starling T R109 Strunus roseus Rosy starling T M110 Acridotheres tristis Common myna T R111 AcridotheresginginianusBank myna T RHirundinidae112 Hirundo rustica Barn swallow T R RM113 Hirundo smithii Wire-tailed swallow T R R114 Hirundo daurica Red-rumped swallow T C RPycnonotidae115 Pycnonotus leucotis White-eared bulbul T A R116 Pycnonotus cafer Red-ventled bulbul T C RCisticolidae117 Prinia buchanani Rufous-fronted prinia T C R118 Prinia sylvatica Jungle prinia T R RZosterops119 ZosteropspalpebrosusSylviidae120 Acrocephalusdumetorum121 AcrocephalusarundinaceusOriental white-eye T C RBlyth’s reed warbler T C MGreat reed warbler T C M122 Hippolais caligata Booted warbler T VR M123 Orthotomus sutorius Common tailorbird T A R124 Turdoides caudatus Common babbler T A R125 Sylvia curruca Lesser whitethroat T A M
Table 4.5.23 (Contd 7)No Scientific name Common English name T/W AbundancestatusMigratorystatus126 Sylvia hortensis Orphean warbler T R MAlaudidae127 Mirafra cantillans Singing bush- lark T R R128 Eremopterix grisea Ashy- crowned sparrowlarkT R R129 Calandrella cheleensis Asian short- toed lark T C M130 Calandrella raytal Sand short-toed lark T C M131 Galerida cristata Crested lark T R R132 Alauda gulgula Eastern skylark T VR RNectariniidae133 Nectarinia asiatica Purple sunbird T A RPasseridae134 Passer domesticus House sparrow T A R135 Passer sp. Yellow throated sparrow136 Motacilla cinerea Grey wagtail137 Motacilla alba White wagtail W/T VR M138 Anthus campestris Tawny pipit T VR M139 Ploceus philippinus Baya weaver T C R140 Lonchura malabarica Plain munia T A RT/W T: Terrestrial bird, W: Water bird, Abundance status – A: Abundance,C: Common, R: Rare, VR: Very rare.Migratory status – R: Resident, M: Migrant, RM: Resident with migrant population.