Economic Survey of Singapore - Ministry of Trade and Industry
Economic Survey of Singapore - Ministry of Trade and Industry
Economic Survey of Singapore - Ministry of Trade and Industry

You also want an ePaper? Increase the reach of your titles
YUMPU automatically turns print PDFs into web optimized ePapers that Google loves.
<strong>Economic</strong> <strong>Survey</strong> <strong>of</strong><strong>Singapore</strong>First Quarter 2009
ECONOMICSURVEYOF SINGAPOREFIRST QUARTER 2009<strong>Ministry</strong> <strong>of</strong> <strong>Trade</strong> <strong>and</strong> <strong>Industry</strong>Republic <strong>of</strong> <strong>Singapore</strong>May 2009
ISSN 0376-8791May 2009<strong>Ministry</strong> <strong>of</strong> <strong>Trade</strong> <strong>and</strong> <strong>Industry</strong>Republic <strong>of</strong> <strong>Singapore</strong>website: http://www.mti.gov.sgemail: mti_email@mti.gov.sgAll rights reserved. No part <strong>of</strong> thispublication may be reproduced, storedin a retrieval system or transmitted inany form or by any means, electronic,mechanised, photocopying, recording orotherwise, without the prior permission<strong>of</strong> the copyright holder.
ECONOMIC SURVEY OF SINGAPOREFIRST QUARTER 2009CONTENTSPageMain Indicators <strong>of</strong> the <strong>Singapore</strong> EconomyiChapter 1The <strong>Singapore</strong> Economy 1Box 1.1: Explaining the Greater Impact <strong>of</strong> <strong>Trade</strong> on GDP: Comparisonwith the 2001 Recession7Box 1.2: Trends in <strong>Singapore</strong>’s Unit Labour Cost During Recessions 11Chapter 2Performance <strong>of</strong> Selected Sectors 17Chapter 3<strong>Economic</strong> Outlook 20Feature ArticleHow Reliant are East Asian Economies on Final Dem<strong>and</strong> in China <strong>and</strong> theG-3?21Statistical Appendix 31NOTATION na not applicable or not availablenie not included elsewhereYOY Year-on-year percentage changeQOQ Quarter-on-quarter percentage changeNOTE 1 The data for the current quarter are preliminary.2 Except for headline numbers like GDP growth, numbersbeyond single digits have been rounded to whole numbers.
<strong>Economic</strong> <strong>Survey</strong> <strong>of</strong> <strong>Singapore</strong> First Quarter 2009Main IndicatorsMAIN INDICATORS OF THE SINGAPORE ECONOMYOverall EconomyGDP at 2000 Market PricesGDP at Current Market PricesLabour MarketNet Job Creation 1Unemployment Rate (SA)RetrenchmentLabour ProductivityUnit Business Cost <strong>of</strong> ManufacturingUnit Labour Cost <strong>of</strong> ManufacturingPricesConsumer Price IndexDomestic Supply Price IndexExternal <strong>Trade</strong>ExportsDomestic ExportsNon-Oil Domestic ExportsRe-ExportsImports$myoy%saaqoq%$myoy%thous%thousyoy%2000=100yoy%saqoq%2000=100yoy%saqoq%2004=100yoy%saqoq%2006=100yoy%$myoy%saqoq%$myoy%saqoq%$myoy%saqoq%$myoy%saqoq%$myoy%saqoq%Balance <strong>of</strong> PaymentsOverall Balance$mCurrent Account Balance$mCapital <strong>and</strong> Financial Account Balance $mOfficial Foreign Reserves$mImport Covermonths2008 20091st Qtr 2nd Qtr 3rd Qtr 4th Qtr Annual 1st Qtr59,1156.712.265,18011.773.21.92.3-2.9106.42.8-1.397.3-4.3-10.9108.46.62.3106.611.6118,69011.56.161,96012.75.442,4640.61.656,73010.36.9109,94221.55.911,96511,2572,796244,9047.158,4522.5-7.763,2924.271.42.21.8-7.1108.011.48.998.914.319.3109.87.51.4114.415.0124,77813.21.364,31111.2-1.139,239-5.5-5.560,46715.53.9118,50021.45.64,2919,182-5,129240,4186.6yoy% : Year-on-year percentage change.saaqoq% : Seasonally adjusted annualised quarter-on-quarter percentage change.saqoq% : Seasonally adjusted quarter-on-quarter percentage change.1 Compared to the previous period.59,3760.0-2.164,6380.455.72.32.3-9.0107.412.20.998.019.13.0111.16.60.9117.015.3130,20011.4-0.769,35914.52.240,518-8.6-3.560,8428.1-3.7122,40522.21.5-2,14111,037-12,277242,2306.356,582-4.2-16.464,309-5.621.32.57.5-11.9117.311.52.6114.615.45.0111.85.40.693.4-10.8103,094-12.0-17.551,989-15.5-20.535,871-17.8-10.951,105-8.1-14.3100,046-7.1-18.24,4176,702-1,649250,3466.7233,5251.11.1257,4192.3221.62.213.9-7.8109.89.49.4102.210.510.5110.36.56.5107.87.5476,7625.85.8247,6185.45.4158,092-7.9-7.9229,1446.26.2450,89313.913.918,53138,177-16,259250,3466.753,121-10.1-14.658,903-9.6-1.03.210.8-15.4118.711.6-0.8126.530.01.1110.72.1-0.887.8-17.785,735-27.8-12.042,685-31.1-13.631,585-25.6-7.443,050-24.1-10.379,607-27.6-16.4-3,7475,998-11,309253,1227.2MINISTRY OF TRADE AND INDUSTRYi
<strong>Economic</strong> <strong>Survey</strong> <strong>of</strong> <strong>Singapore</strong> First Quarter 2009Main IndicatorsMAIN INDICATORS OF THE SINGAPORE ECONOMY (CONT’D)ManufacturingValue Added at 2000 PricesIndex <strong>of</strong> Industrial ProductionConstructionValue Added at 2000 PricesContracts AwardedCertified PaymentsWholesale <strong>and</strong> Retail <strong>Trade</strong>Value Added at 2000 PricesRetail Sales at Constant PricesTransport <strong>and</strong> StorageValue Added at 2000 PricesSea Cargo H<strong>and</strong>ledTotal Container ThroughputAir Cargo H<strong>and</strong>ledHotels <strong>and</strong> RestaurantsValue Added at 2000 PricesVisitor ArrivalsHotel Occupancy RateInformation <strong>and</strong> CommunicationsValue Added at 2000 PricesMobile Subscribers$myoy%saaqoq%2007=100yoy%saqoq%$myoy%saaqoq%$myoy%$myoy%$myoy%saaqoq%2005=100yoy%saqoq%$myoy%saaqoq%mil Tonnesyoy%thous TEUsyoy%thous Tonnesyoy%$myoy%saaqoq%thousyoy%saqoq%%$myoy%saaqoq%thousyoy%millionyoy%2008 20091st Qtr 2nd Qtr 3rd Qtr 4th Qtr Annual 1st Qtr15,70312.660.2104.412.38.42,22113.1-9.69,629145.25,34039.59,4995.47.9112.7-0.91.55,2165.54.5131.513.37,33111.4467.84.09963.1-1.42,6096.80.083.72,5237.15.75,92423.71,83026.513,766-5.6-45.991.8-5.6-12.3International Telephone CallMinutesyoy% : Year-on-year percentage change.saaqoq% : Seasonally adjusted annualised quarter-on-quarter percentage change.saqoq% : Seasonally adjusted quarter-on-quarter percentage change.2,31023.759.98,84627.55,86151.99,7316.03.8110.6-2.9-0.55,4485.84.6136.613.17,69411.7478.53.29862.00.72,486-0.2-2.982.02,5938.411.46,16023.52,05335.514,371-11.0-5.295.9-11.00.12,61726.023.58,26961.26,93047.710,0344.5-0.8107.22.8-1.25,4763.8-3.2130.77.37,9269.2487.70.49990.0-0.42,518-4.5-4.579.82,5987.75.96,25818.52,26941.113,671-10.7-21.391.2-10.7-5.82,72518.510.37,875-6.97,40134.79,007-5.3-27.1106.1-5.4-4.25,195-2.4-14.2116.5-6.76,967-3.3427.4-14.51,040-0.10.62,503-7.8-0.678.52,5625.4-0.96,34012.82,30533.057,511-4.1-4.195.8-4.2-4.29,87320.320.334,61941.525,53142.938,2712.62.6109.1-1.7-1.721,3343.13.1515.46.629,9187.11,861.4-2.04,0201.21.210,116-1.6-1.681.010,2747.27.26,34012.88,45734.211,603-26.1-26.677.2-26.1-8.42,76224.49.64,165-56.77,36738.08,060-15.1-30.4100.7-10.7-4.74,693-10.0-24.5113.3-13.86,018-17.9362.1-22.6947-4.9-18.62,252-13.7-5.571.72,5691.8-7.76,4158.32,30826.2iiMINISTRY OF TRADE AND INDUSTRY
<strong>Economic</strong> <strong>Survey</strong> <strong>of</strong> <strong>Singapore</strong> First Quarter 2009Main IndicatorsMAIN INDICATORS OF THE SINGAPORE ECONOMY (CONT’D)Financial ServicesValue Added at 2000 PricesLoans <strong>and</strong> Advances to Non-BankCustomersPrime Lending RateExchange Rate (Average)Straits Time IndexBusiness ServicesValue Added at 2000 prices$myoy%saaqoq%$myoy%% per annumPer US$ST Index$myoy%saaqoq%2008 20091st Qtr 2nd Qtr 3rd Qtr 4th Qtr Annual 1st Qtr7,52414.88.2249,32723.85.381.40933,0076,7788.53.47,65911.27.4261,14324.95.381.36622,9486,9447.710.17,3945.6-13.1272,93124.85.381.39682,3597,0858.28.46,782-8.1-29.2272,17516.65.381.48691,7627,0705.2-0.829,3605.55.5272,17516.65.381.41481,76227,8777.47.46,909-8.27.7270,7058.65.381.51201,7007,0534.1-1.0Property Price IndicesPrivate ResidentialOffice SpaceShop SpaceFactory Space<strong>Economic</strong> OutlookComposite Leading IndexGeneral Business Expectations 2ManufacturingWholesale & Retail <strong>Trade</strong>Transport & StorageHotels & CateringInformation & CommunicationsFinancial ServicesReal EstateBusiness Services1998 Q4=100yoy%qoq%1998 Q4=100yoy%qoq%1998 Q4=100yoy%qoq%1998 Q4=100yoy%qoq%2000=100saqoq%177.229.83.7119.728.61.1117.714.32.6109.122.93.9120.4-2.7-7+5-9+26+23-4+9+7177.520.10.2120.518.80.7118.510.00.7114.219.14.7120.2-0.2+1-4+8+3+12-3-17+17173.38.3-2.4115.85.7-3.9118.26.6-0.3114.916.20.6119.4-0.7-18-11-25+17+9-34-41+6162.8-4.7-6.1110.1-7.0-4.9112.5-1.9-4.8107.22.1-6.7111.7-6.4-57-47-66-65-30-61-52-49162.8-4.7-4.7110.1-7.0-7.0112.5-1.9-1.9107.22.12.1nananananananananana139.9-21.0-14.796.9-19.0-12.0107.8-8.4-4.296.6-11.5-9.9yoy% : Year-on-year percentage change.saaqoq% : Seasonally adjusted annualised quarter-on-quarter percentage change.saqoq% : Seasonally adjusted quarter-on-quarter percentage change.2 Figures refer to the net balance <strong>of</strong> firms in percentage terms. A plus sign indicates a positive balance or net upward trend <strong>and</strong> aminus sign denotes a negative or net down trend for the next six months.109.8-1.7-33-43-52-55-26-52-58-55MINISTRY OF TRADE AND INDUSTRYiii
<strong>Economic</strong> <strong>Survey</strong> <strong>of</strong> <strong>Singapore</strong> First Quarter 2009<strong>Singapore</strong> EconomyCHAPTER 1THE SINGAPORE ECONOMYOVERVIEWIn the first quarter <strong>of</strong> 2009,• Output contracted by 10.1 per cent compared to the same period last year.• Manufacturing was the key contributor to the contraction in output. This was only partially <strong>of</strong>fsetby the performance <strong>of</strong> construction, business services <strong>and</strong> information <strong>and</strong> communications.• Employment declined marginally by 1,000.• The consumer price index increased by 2.1 per cent.OVERALL PERFORMANCE• The economy contracted by 10.1 per centin the first quarter <strong>of</strong> 2009, after a 4.2per cent decline in the fourth quarter <strong>of</strong>2008. On an annualised quarter-onquarterbasis, the economy contracted by14.6 per cent, compared to a 16.4 percent contraction in the previous quarter.• Manufacturing output fell by 26 per centcompared to the same quarter last year.Wholesale <strong>and</strong> retail trade also fell by 15per cent.• The services producing industries fell by5.2 per cent, following a 1.3 per centdecline in the fourth quarter <strong>of</strong> 2008.• The construction, information <strong>and</strong>communications, <strong>and</strong> business servicessectors were the only major sectors thatshowed positive growth.Exhibit 1.1: GDP <strong>and</strong> Sectoral GrowthRates in 1Q 2009ConstructionBusiness ServicesInformation & CommsHotels & RestaurantsFinancial ServicesTransport & StorageGDP GrowthWholesale & RetailManufacturing-4.9-8.2-10.0-10.1-15.1-26.14.11.824.4-40 -30 -20 -10 0 10 20 30Per CentContribution to Growth• The construction, business services <strong>and</strong>information <strong>and</strong> communication sectorscontributed 1.5 percentage points togrowth.• However, overall growth was draggeddown by declines in the remainingsectors.Exhibit 1.2: Percentage Point Contribution toGrowth in Real GDP in 1Q 2009 (By <strong>Industry</strong>)ConstructionBusiness ServicesInformation & CommsHotels & RestaurantsTransport & StorageFinancial ServicesWholesale & RetailManufacturingGDP Growth-10.1-6.90.90.50.1-0.1-0.9-1.0-2.4-15 -10 -5 0 5Per CentMINISTRY OF TRADE AND INDUSTRY 1
<strong>Economic</strong> <strong>Survey</strong> <strong>of</strong> <strong>Singapore</strong> First Quarter 2009<strong>Singapore</strong> EconomySOURCES OF GROWTH• Total dem<strong>and</strong> declined by 17 per cent,mainly led by the decline in externaldem<strong>and</strong>. Domestic dem<strong>and</strong> growth alsocontracted.• Gross fixed capital formation fell by 15per cent, weighing down on totaldomestic dem<strong>and</strong>.• Private consumption expenditurecontracted by 5.1 per cent, contributingtowards the decline in total dem<strong>and</strong>.Exhibit 1.3: Percentage Contribution to TotalDem<strong>and</strong> GrowthPer Cent2008 2009II III IV Annual ITotal Dem<strong>and</strong> 8.0 5.3 -5.6 4.4 -16.9External Dem<strong>and</strong> 4.2 1.7 -7.3 1.0 -16.3Total DomesticDem<strong>and</strong>ConsumptionExpenditure3.8 3.6 1.7 3.4 -0.60.7 0.6 -0.1 0.5 -0.7Public 0.2 0.3 0.1 0.2 -0.1Private 0.5 0.3 -0.1 0.3 -0.6Gross FixedCapitalFormationChanges inInventories1.9 1.1 -0.8 1.1 -1.31.2 2.0 2.6 1.8 1.3LABOUR MARKETEmployment• Employment declined marginally by 1,000in the first quarter <strong>of</strong> 2009.• The manufacturing sector shed 19,900jobs. Employment in the services <strong>and</strong>construction sectors increased by 10,300<strong>and</strong> 8,500 respectively, lower than theprevious quarter.Exhibit 1.4: Changes in Total EmploymentThous<strong>and</strong>806040200-20I II III IV I2008 2009Unemployment• The overall unemployment rate rose from2.5 per cent in December 2008 to 3.2 percent in March 2009.• The seasonally adjusted residentunemployment rate increased from 3.6per cent in December 2008 to a five-yearhigh <strong>of</strong> 4.8 per cent in March 2009.• An estimated 87,800 residents wereunemployed in March 2009. Theseasonally adjusted figure was 95,600,compared to 71,800 in December 2008.Exhibit 1.5: Seasonally Adjusted Overall <strong>and</strong>Resident Unemployment RatePer Cent543210I II III IV I2008 2009Overall Resident2 MINISTRY OF TRADE AND INDUSTRY
<strong>Economic</strong> <strong>Survey</strong> <strong>of</strong> <strong>Singapore</strong> First Quarter 2009<strong>Singapore</strong> EconomyCOMPETITIVENESSProductivity• Following a 12 per cent drop in theprevious quarter, productivity declined by15 per cent in the first quarter <strong>of</strong> 2009 asthe sharp fall in output continued tooutpace labour adjustments.• Overall <strong>and</strong> sector productivity growthwere negative except for the constructionsector.Exhibit 1.6: Changes in Labour Productivity forthe Overall Economy <strong>and</strong> Sectors in 1Q 2009ConstructionBusiness ServicesInformation & CommsHotels & RestaurantsFinancial ServicesTransport & StorageOverall ProductivityWholesale & RetailManufacturing-12.4-12.6-14.0-15.4-17.9-25.9-4.0-4.43.8-40 -30 -20 -10 0 10Per CentUnit Labour Cost <strong>and</strong> UnitBusiness Cost• Overall unit labour costs (ULC) for thewhole economy rose by 9.2 per centcompared to the corresponding quarterlast year. This is slower than the 12 percent registered in the last quarter <strong>of</strong>2008.• Manufacturing ULC rose 30 per cent, asharp increase from 15 per cent in thelast quarter <strong>of</strong> 2008. The markedincrease in Manufacturing ULC is largelydue to the plunge in manufacturinglabour productivity.Exhibit 1.7: Changes in Unit Labour CostPer Cent35302520Manufacturing ULC15105Overall ULC0-5I II III IV I2008 2009• Unit business costs (UBC) inManufacturing increased by 12 per cent,slightly higher than the previous quarter.• The increase in manufacturing UBC wasentirely driven by increases in themanufacturing ULC, <strong>of</strong>fsetting the declinein services cost <strong>and</strong> Government rates<strong>and</strong> fees.Exhibit 1.8: Percentage Contribution to Change inUnit Business Cost for ManufacturingPer Cent151050-5I II III IV I2008 2009Services CostLabour CostGovt Rates & FeesUBCMINISTRY OF TRADE AND INDUSTRY 3
<strong>Economic</strong> <strong>Survey</strong> <strong>of</strong> <strong>Singapore</strong> First Quarter 2009<strong>Singapore</strong> EconomyInvestment Commitments 1Exhibit 1.9: Fixed Asset Investments by <strong>Industry</strong>Clusters in 1Q 2009• Investment commitments in terms <strong>of</strong>total fixed asset investments (FAI) <strong>and</strong>total business spending (TBS) amountedto $3.2 billion <strong>and</strong> $2.1 billion respectivelyin the first quarter.• For FAI, the electronics cluster attractedstrong foreign interest, garnering $1.5billion in commitments. This was followedby the chemicals cluster which attracted$1.1 billion in commitments, mainly fromthe petrochemicals sector.Electronics47%Others20%Chemicals33%• For TBS, the electronics cluster attracted$628 million worth <strong>of</strong> commitments,followed by headquarters <strong>and</strong>pr<strong>of</strong>essional services ($432 million) <strong>and</strong>logistics ($425 million).• The US was the biggest contributor toboth FAI <strong>and</strong> TBS, committing 59 percent <strong>and</strong> 46 per cent <strong>of</strong> total FAI <strong>and</strong> TBSrespectively. This was followed byEurope, which accounted for 17 per cent<strong>and</strong> 32 per cent <strong>of</strong> total FAI <strong>and</strong> TBSrespectively.• When fully realised, these commitmentsare expected to generate value-added <strong>of</strong>$3.2 billion <strong>and</strong> more than 4,000 skilledjobs.Exhibit 1.10: Total Business Spending by <strong>Industry</strong>Clusters in 1Q 2009PrecisionEngineering17%Others14%Logistics20%Electronics29%HQ &Pr<strong>of</strong>essional Services20%PRICESConsumer Price Index• CPI increased by 2.1 per cent in the firstquarter, slower than the 5.4 per centincrease in the previous quarter.• On a quarter-on-quarter basis, theseasonally-adjusted CPI declined by 0.8per cent, compared to an increase <strong>of</strong> 0.6per cent in the previous quarter.Exhibit 1.11: Changes in CPIPer Cent8YOY Growth642QOQ Growth (SA)0-2I2008II III IV I20091 EDB has been using fixed asset investments (FAI) to measure the level <strong>of</strong> manufacturing investments <strong>and</strong> total business spending(TBS) as the indicator for services investments. With the increasing overlap between manufacturing <strong>and</strong> services activities, FAI <strong>and</strong>TBS are better presented for the combined manufacturing <strong>and</strong> services sectors. Additionally, to reflect the nature <strong>of</strong> jobs which aretargeted, the number <strong>of</strong> skilled jobs will be used as an indicator for employment creation.4 MINISTRY OF TRADE AND INDUSTRY
<strong>Economic</strong> <strong>Survey</strong> <strong>of</strong> <strong>Singapore</strong> First Quarter 2009<strong>Singapore</strong> Economy• Housing cost was the largest contributorto the increase in CPI as a result <strong>of</strong>higher accommodation costs.• The higher prices <strong>of</strong> cooked food, rice &other cereals, vegetables, fresh pork, milkproducts, fruits <strong>and</strong> fresh fish alsocontributed to the rise in CPI.• Higher cost <strong>of</strong> holiday travel <strong>and</strong> salaryfor foreign maids contributed to anincrease in CPI.• Meanwhile, cheaper petrol, lower roadtaxes <strong>and</strong> car prices helped <strong>of</strong>fset theincrease in CPI.Exhibit 1.12: Percentage Point Contribution toChange in Overall CPI in 1Q 2009-1.1Overall CPIHousingFoodRecreation & OthersHealth CareClothing & FootwearEducation & Stationery0.00.30.21.21.42.10.0Transport & Communications-2 -1 0 1 2 3Per CentEXTERNAL BALANCE<strong>Trade</strong>• Total trade in nominal terms declined by28 per cent in the first quarter. In volumeterms, total trade shrank by 19 per cent,following the 3.5 per cent decrease in theprevious quarter.• Total exports continued to record adouble-digit decline. Domestic exportsdeclined at a faster 31 per cent, while reexportsregistered a 24 per cent decreasefollowing the previous quarter’s 8.1 percent decline.• Within domestic exports, both oil <strong>and</strong>non-oil domestic exports decreased. Nonoildomestic exports decreased in thisquarter, following the contraction in theprevious quarter.Exhibit 1.13: Growth Rates <strong>of</strong> Total <strong>Trade</strong>,Exports <strong>and</strong> Imports (In Nominal Terms)Per Cent2008 2009I II III IV Annual ITotal <strong>Trade</strong> 16.1 17.1 16.4 -9.6 9.6 -27.7Exports 11.5 13.2 11.4 -12.0 5.8 -27.8DomesticExports12.7 11.2 14.5 -15.5 5.4 -31.1Oil 52.6 53.4 77.4 -10.0 41.5 -43.1Non-Oil 0.6 -5.5 -8.6 -17.8 -7.9 -25.6Re-Exports 10.3 15.5 8.1 -8.1 6.2 -24.1Imports 21.5 21.4 22.2 -7.1 13.9 -27.6Oil 75.6 69.4 87.5 0.7 54.5 -36.8Non-Oil 9.1 8.0 5.6 -9.4 3.0 -24.2• Total imports decreased at a faster rate,as both oil <strong>and</strong> non-imports decreased.Within non-oil imports, the decrease wasmainly led by electronics imports.MINISTRY OF TRADE AND INDUSTRY 5
<strong>Economic</strong> <strong>Survey</strong> <strong>of</strong> <strong>Singapore</strong> First Quarter 2009<strong>Singapore</strong> EconomyBalance <strong>of</strong> Payments• The overall balance <strong>of</strong> payments reversedto a deficit position <strong>of</strong> $3.7 billion in thefirst quarter <strong>of</strong> 2009, from a surplus <strong>of</strong>$4.4 billion in the preceding quarter.• This was largely accounted for by thesurge in net outflow from the financialaccount. The current account surplus alsonarrowed slightly.Current Account• The surplus in the goods accountincreased, as the contraction in exportswas matched by an even sharper fall inimports.Exhibit 1.14: Balance <strong>of</strong> Payments$ Billion20151050-5-10-15I II III IV I20082009Overall Balance Current Account Capital Flows• However, the reduction in the servicessurplus <strong>and</strong> larger deficit in the incomebalance more than <strong>of</strong>fset the increase inthe goods account, thus resulting in asmaller current account surplus.• The decline in services exports wasgreater than that <strong>of</strong> imports, particularlyin the other business services sector,which comprises mainly <strong>of</strong> trade-relatedservices. There was also a discernible fallin the export <strong>of</strong> financial services.Capital <strong>and</strong> Financial Account• The rise in net outflow from the financialaccount was largely driven by the declinein direct investments into <strong>Singapore</strong>, aswell as the turnaround in “otherinvestment” from a net inflow to netoutflow position.• There was also an increase in netportfolio outflows but to a smaller extent,as the rise in banking sector net outflowwas largely balanced by the reduction innet outflow from the <strong>of</strong>ficial <strong>and</strong> privatenon-bank sectors. In particular, thepullback <strong>of</strong> foreign funds from thedomestic equity <strong>and</strong> debt markets seen inlate 2008 had moderated in the firstquarter <strong>of</strong> 2009.6 MINISTRY OF TRADE AND INDUSTRY
<strong>Economic</strong> <strong>Survey</strong> <strong>of</strong> <strong>Singapore</strong> First Quarter 2009<strong>Singapore</strong> EconomyBox 1.1: Explaining the Greater Impact <strong>of</strong> <strong>Trade</strong> on GDP:Comparison with the 2001 RecessionFluctuations in <strong>Singapore</strong>’s real GDP are closely correlated to changes in trade figures, because <strong>of</strong><strong>Singapore</strong>’s nature as an externally-oriented <strong>and</strong> open economy. In the first quarter <strong>of</strong> 2009, nominaltrade fell by a sharp 24 per cent. Although this decline was similar to the decline experienced at thebottom <strong>of</strong> the 2001 recession (-21 per cent), the decline in real GDP in the first quarter <strong>of</strong> 2009 (-10per cent) was more severe than its corresponding decline in 2001 (-6.4 per cent) (Exhibit 1).To some extent, the sharper decline in GDP in recent months reflects the broad-based nature <strong>of</strong> thecurrent recession. In 2001, sectors not directly related to trade, such as financial services <strong>and</strong>information & communications, still managed to contribute positively to GDP growth, thereby partly<strong>of</strong>fsetting the impact <strong>of</strong> the decline in exports. In 2009, however, there has been no such <strong>of</strong>fsettingeffect. Some non-trade related sectors, in particular financial services, have experienced sharp declinesas well.But it has also become clear that trade-related activities have had a bigger impact on the economysince 2001. This box seeks to explain the greater impact <strong>of</strong> trade on real GDP in the current recession,by examining its impact on the manufacturing <strong>and</strong> services sectors in turn.Exhibit 1: Growth in GDP <strong>and</strong> Non-Oil <strong>Trade</strong>Per Cent3020100-10-20-30Total Non-Oil <strong>Trade</strong>Overall GDPNODXManufacturing VAI II III IV I II III IV I II III IV I II III IV I II III IV I II III IV I II III IV I II III IV I II III IV I2000 2001 2002 2003 2004 2005 2006 2007 2008 2009Source: <strong>Singapore</strong> Department <strong>of</strong> Statistics <strong>and</strong> International Enterprise <strong>of</strong> <strong>Singapore</strong>Impact on ManufacturingAs illustrated in Exhibit 1, although the fall in nominal Non-Oil Domestic Exports (NODX) in the firstquarter <strong>of</strong> 2009 was similar to its fall in the third quarter <strong>of</strong> 2001, the decline in manufacturing realvalue-added (VA) was significantly larger (-26 per cent in the first quarter <strong>of</strong> 2009 vs. -19 per cent inthe third quarter <strong>of</strong> 2001). There are two main reasons for this.First, unlike the 2001 recession, the decline in nominal NODX in the current recession wasunderpinned by a decline in real NODX.As observed in earlier studies published in the <strong>Economic</strong> <strong>Survey</strong> <strong>of</strong> <strong>Singapore</strong>, a decline in export pricesin 2001 had led to a divergence between real <strong>and</strong> nominal NODX. 1 For instance, the decline in realNODX during the third quarter <strong>of</strong> 2001 was 19 per cent on-year, smaller than the 28 per cent declinein nominal NODX. In contrast, the first quarter <strong>of</strong> 2009 saw similar declines in real <strong>and</strong> nominal NODXat around 25 per cent on-year (Exhibit 2).1See for example, “<strong>Singapore</strong>’s <strong>Trade</strong> <strong>and</strong> Investment Trends: A Comparison With Past Downturns” in <strong>Economic</strong> <strong>Survey</strong> <strong>of</strong><strong>Singapore</strong> 2008, <strong>and</strong> “Explaining the Divergence Between GDP <strong>and</strong> <strong>Trade</strong> Growth” in the <strong>Economic</strong> <strong>Survey</strong> <strong>of</strong> <strong>Singapore</strong> 2007.MINISTRY OF TRADE AND INDUSTRY 7
<strong>Economic</strong> <strong>Survey</strong> <strong>of</strong> <strong>Singapore</strong> First Quarter 2009<strong>Singapore</strong> EconomyThis implies that, unlike the third quarter <strong>of</strong> 2001, the decline in headline NODX in the first quarter <strong>of</strong>2009 was largely due to an adjustment in real output rather than an adjustment in prices. Thiscorresponded with a more severe fall in manufacturing output during the first quarter <strong>of</strong> 2009.Exhibit 2: Previous declines in NODX were magnified by price effectsPer Cent4030NODX at 2006 Prices2010NODX at Current Prices0-10-20-30-40I II III IV I II III IV I II III IV I II III IV I II III IV I II III IV I II III IV I II III IV I II III IV I2000 2001 2002 2003 2004 2005 2006 2007 2008 2009Source: International Enterprise <strong>of</strong> <strong>Singapore</strong>Second, the higher share <strong>of</strong> pharmaceuticals in total NODX may have increased the realvalue-added content <strong>of</strong> exports.Within <strong>Singapore</strong>’s NODX, pharmaceutical exports have one <strong>of</strong> the highest direct value-added content.Based on the 2000 Input-Output tables for <strong>Singapore</strong>, every dollar <strong>of</strong> pharmaceutical outputcontributed 62 cents <strong>of</strong> direct value-added to the <strong>Singapore</strong> economy, compared to 26 cents for everydollar <strong>of</strong> non-oil manufacturing output (Exhibit 3A) . This means that declines in pharmaceuticalexports would have a much larger impact on <strong>Singapore</strong>’s GDP compared to a similar decline in nonpharmaceuticalexports.The share <strong>of</strong> pharmaceuticals in NODX has increased. In 2001, pharmaceuticals comprised 4.8 per cent<strong>of</strong> NODX; this share had grown to 9.7 per cent in 2008 (Exhibit 3B). Swings in pharmaceutical exportswould therefore have a more discernible impact on NODX. In fact, half <strong>of</strong> the decline in total NODX in2008 resulted from a steep decline in pharmaceutical exports. This decline, combined with the highdirect VA <strong>of</strong> pharmaceuticals, amplified the effect <strong>of</strong> the NODX decline on overall GDP.Exhibit 3: Pharmaceutical share <strong>of</strong> NODX doubled from 2001, with larger impact on GDP(A) Direct Value-Added Coefficient <strong>of</strong> Selected (B) % Share <strong>of</strong> Nominal NODXSectorsPer CentDirect VA100MultiplierManufacturing (Oil) 0.07780Manufacturing (Non-Oil) 0.259Electronics 0.20460Pharmaceuticals 0.619Source: 2000 Input-Output Tables4020Machinery & TransportEquipmentMiscellaneousManufactured GoodsChemicals – NonPharmaceuticalPharmaceuticalManufactured GoodsFood, Beverages &TobaccoOthers02001 2008Source: International Enterprise <strong>of</strong> <strong>Singapore</strong>8 MINISTRY OF TRADE AND INDUSTRY
<strong>Economic</strong> <strong>Survey</strong> <strong>of</strong> <strong>Singapore</strong> First Quarter 2009<strong>Singapore</strong> EconomyImpact on ServicesThe impact <strong>of</strong> trade on <strong>Singapore</strong>’s real VA in services is also larger now compared to the 2001recession because <strong>of</strong> two reasons.First, trade-related services now constitute a larger share <strong>of</strong> our economy.The share <strong>of</strong> trade-related service sectors in our economy has increased since 2001. The share <strong>of</strong> thewholesale <strong>and</strong> retail sector has grown from 13 per cent <strong>of</strong> GDP in 2001 to 17 per cent in 2008. Eventhough transport <strong>and</strong> storage’s share <strong>of</strong> GDP has remained stable, transport- <strong>and</strong> trade-related serviceexports have increased as a proportion <strong>of</strong> nominal GDP. From 2000 to 2008, transport-related serviceexports increased from 13 per cent to 16 per cent <strong>of</strong> nominal GDP, while trade-related service exportsrose from 5.4 per cent to 11 per cent <strong>of</strong> nominal GDP (Exhibit 4).Exhibit 4: Larger Role <strong>of</strong> <strong>Trade</strong>-Related Sectors(A) GDP Share <strong>of</strong> Transport & Storage <strong>and</strong>Wholesale & Retail <strong>Trade</strong> SectorsPer Cent201510502000 2001 2002 2003 2004 2005 2006 2007 2008Transport & StorageWholesale & Retail <strong>Trade</strong>Source: <strong>Singapore</strong> Department <strong>of</strong> Statistics(B) Services Exports as % <strong>of</strong> Nominal GDPPer Cent504030201002000 2001 2002 2003 2004 2005 2006 2007 2008Total Services ExportsTransport & <strong>Trade</strong>-Related Services ExportsSource: <strong>Singapore</strong> Department <strong>of</strong> StatisticsSecond, disruptions in trade finance <strong>and</strong> global manufacturing activity have been moresevere in this recession, thus affecting trade-related services more negatively.Unlike 2001, this recession is characterised by a global disruption in trade finance as well as a muchsharper collapse in manufacturing activity around the world. As <strong>Singapore</strong> is an internationaltransport hub, this has had a severe impact on the transport <strong>and</strong> storage sector. The year-on-yearcontraction in container throughput <strong>and</strong> air cargo in the first quarter <strong>of</strong> 2009 reached 18 per cent <strong>and</strong>23 per cent respectively, exceeding the declines recorded during 2001 as well as the SARS Crisis in2003 (Exhibit 5). Growth in air passengers h<strong>and</strong>led also fell sharply by 7.8 per cent in the first quarter<strong>of</strong> 2009, contributing to the sector’s overall decline.Exhibit 5: Decline in Key Cargo IndicatorsPer Cent3020100-10-20Air CargoContainer Throughput-30I II III IV I II III IV I II III IV I II III IV I II III IV I II III IV I II III IV I II III IV I II III IV I II III IV I1999 2000 2001 2002 2003 2004 2005 2006 2007 2008 2009Source: Civil Aviation Authority <strong>of</strong> <strong>Singapore</strong> <strong>and</strong> Maritime <strong>and</strong> Port Authority <strong>of</strong> <strong>Singapore</strong>MINISTRY OF TRADE AND INDUSTRY 9
<strong>Economic</strong> <strong>Survey</strong> <strong>of</strong> <strong>Singapore</strong> First Quarter 2009<strong>Singapore</strong> EconomySimilar factors affected the wholesale <strong>and</strong> retail trade sector in the first quarter <strong>of</strong> 2009, whichalso saw a more severe contraction compared to the trough in 2001. In particular, both <strong>of</strong>fshore <strong>and</strong>re-export (NORX) trade were significantly affected during this downturn. Real NORX contracted by 25per cent in the first quarter <strong>of</strong> 2009, much sharper than the 15 per cent contraction during the troughin the fourth quarter <strong>of</strong> 2001. Compared to the 2001 recession, the decline in real NORX has also beenmore broad-based, with sharp drops seen in all product segments (Exhibit 6).Exhibit 6: Sharper <strong>and</strong> Broader-based Declines in NORX(A) Real NORX versus Wholesale <strong>and</strong>(B) Decline in Real NORX Across KeyRetail <strong>Trade</strong> VASegmentsPer Cent3020100-10-20Real NORXWholesale <strong>and</strong>Retail <strong>Trade</strong> VA-3020002001 200220032004 200520062007 2008 2009Source: <strong>Singapore</strong> Department <strong>of</strong> Statistics <strong>and</strong>International Enterprise <strong>of</strong> <strong>Singapore</strong>Per Cent6050403020100-10-20-30-40Real NORXChemicalsManufactured GoodsMachinery & Transport Equipment2000 2001 2002 2003 2004 2005 2006 2007 2008 2009Source: International Enterprise <strong>of</strong> <strong>Singapore</strong>ConclusionAlthough the decline in nominal trade figures in the first quarter <strong>of</strong> 2009 was broadly comparable tothe decline during the trough <strong>of</strong> the 2001 recession, the contraction in real GDP in 2009 has beenlarger than the contraction in 2001. This article suggests a few possible reasons for this. In 2001, adecline in export prices contributed to the decline in NODX, but this time, the decline in NODX resultedfrom a steep decline in manufacturing output, reflecting the sharp collapse in external dem<strong>and</strong>. Thevalue-added content <strong>of</strong> NODX is likely to have increased since 2001 due to the greater share <strong>of</strong>pharmaceuticals in NODX. Finally, the contribution <strong>of</strong> trade-related activities, in particular wholesaletrade, to the service sector has also grown. These factors have increased the correlation between trade<strong>and</strong> overall GDP. While this stronger correlation has affected <strong>Singapore</strong> negatively in the downturn, italso increases the likelihood <strong>of</strong> a faster recovery once global trade recovers.Contributed by:Dominic Soon, EconomistTee Koon Hui, Economist<strong>Economic</strong>s <strong>and</strong> Strategy Division<strong>Ministry</strong> <strong>of</strong> <strong>Trade</strong> <strong>and</strong> <strong>Industry</strong>10 MINISTRY OF TRADE AND INDUSTRY
<strong>Economic</strong> <strong>Survey</strong> <strong>of</strong> <strong>Singapore</strong> First Quarter 2009<strong>Singapore</strong> EconomyBox 1.2: Trends in <strong>Singapore</strong>’s Unit Labour Cost During RecessionsAimThis box presents recent trends in unit labour cost 1 (ULC) for the overall economy <strong>and</strong> themanufacturing sector, <strong>and</strong> compares them with the trends during past recessions. It also examines thedrivers <strong>of</strong> ULC growth over the period 1992-2008 by decomposing it into the contribution <strong>of</strong> (theinverse <strong>of</strong>) productivity growth <strong>and</strong> increases in labour cost per worker.BackgroundIn 2008, overall ULC increased by 9.6 per cent, a sharp rise from the 5.2 per cent <strong>and</strong> 1.3 per centrecorded in 2007 <strong>and</strong> 2006 respectively. Similarly, the manufacturing ULC rose by 11 per cent in 2008,a marked increase from the 3.9 per cent <strong>and</strong> -3.6 per cent in the previous two years (Exhibits 1A <strong>and</strong>1B). The ULC has continued its upward trend in 2009. Latest data shows that overall ULC rose by 9.2per cent <strong>and</strong> manufacturing ULC by 30.0 per cent in the first quarter <strong>of</strong> 2009.Exhibit 1A Overall ULC, 1992-2008Index, 2000=10013012011010090801992 1994 1996 1998 2000 2002 2004 2006 2008Source: <strong>Singapore</strong> Department <strong>of</strong> StatisticsExhibit 1B Manufacturing ULC, 1992-2008Index, 2000=10013012011010090801992 1994 1996 1998 2000 2002 2004 2006 2008Source: <strong>Singapore</strong> Department <strong>of</strong> StatisticsNote: Shaded areas in Exhibits 1A <strong>and</strong> 1B represent years <strong>of</strong> negative overall GDP growth <strong>and</strong> negative manufacturing valueaddedgrowth respectively.The sharp increase in ULC in 2008 <strong>and</strong> in the first quarter <strong>of</strong> 2009 is consistent with the experienceduring past recessions in 1998 <strong>and</strong> 2001. During those periods, ULC also spiked, by 4.0 per cent <strong>and</strong>6.4 per cent respectively, <strong>and</strong> came down only in the year after the recessions.As the ULC is defined as total labour cost 2 relative to output, it is not just a measure <strong>of</strong> labour cost butalso provides some notion <strong>of</strong> efficiency or productivity. To determine the extent to which ULC hasbeen driven by productivity or labour cost changes over the years, we decompose ULC growth into itscomponent factors for both the overall economy <strong>and</strong> the manufacturing sector.1The unit labour cost (ULC) is defined as the total labour cost per unit <strong>of</strong> real output.2Total labour cost comprises wages <strong>and</strong> salaries, benefits, CPF contr butions by employers, foreign workers’ levy <strong>and</strong> skilldevelopment levy.MINISTRY OF TRADE AND INDUSTRY 11
<strong>Economic</strong> <strong>Survey</strong> <strong>of</strong> <strong>Singapore</strong> First Quarter 2009<strong>Singapore</strong> EconomyMethodologyThe ULC is defined as total labour cost (TLC) per unit <strong>of</strong> output, <strong>and</strong> can be decomposed into TLC perworker <strong>and</strong> the inverse <strong>of</strong> productivity as follows:ULC = Total Labour Cost / Real Value-Added [Equation 1]ULC = (Total Labour Cost / Worker) * (Workers / Real Value-Added) [Equation 1’]└───────────┘ └───────────┘| |Total Labour Cost per worker Inverse <strong>of</strong> ProductivityFrom Equation 1’, the growth in ULC can be approximated as the sum <strong>of</strong> the growth in TLC per worker<strong>and</strong> the growth in the inverse <strong>of</strong> productivity:%ΔULC = %Δ (TLC / Worker) + %Δ (Workers / Real Value-Added) [Equation 2]└───────┘ └──────────────┘| |Growth in TLC per worker Growth in Inverse <strong>of</strong> ProductivityIn other words, increases in ULC are driven by an increase in the TLC per worker or a decline inproductivity (which is equivalent to an increase in the inverse <strong>of</strong> productivity). On the other h<strong>and</strong>,declines in ULC are driven by a fall in TLC per worker or an increase in productivity.Decomposition ResultsAnnual DataThe results <strong>of</strong> the decomposition exercise are presented graphically in Exhibits 2A <strong>and</strong> 2B. They showclearly the strong inverse relationship between ULC growth <strong>and</strong> labour productivity growth for both theoverall economy <strong>and</strong> the manufacturing sector. However, the impact <strong>of</strong> TLC per worker on ULCgrowth is less obvious, suggesting that it is less important than productivity as a driver <strong>of</strong> changes inthe ULC. In particular, it can be observed that the rise in overall ULC during the 1998 <strong>and</strong> 2001recessions as well as the downturn in 2008 was driven by the pro-cyclical decline in productivity, ratherthan labour cost increases.Exhibit 2A: Overall ULC, 1992-2008Exhibit 2B: Manufacturing ULC, 1992-2008Per Cent105TLC perWorkerLabour Productivity(Basic Prices)Per Cent2010TLC perWorkerLabourProductivity(Basic Prices)00-5ULC-10ULC-101992 1994 1996 1998 2000 2002 2004 2006 2008Source: <strong>Singapore</strong> Department <strong>of</strong> Statistics<strong>Ministry</strong> <strong>of</strong> Manpower-201992 1994 1996 1998 2000 2002 2004 2006 2008Source: <strong>Singapore</strong> Department <strong>of</strong> Statistics<strong>Ministry</strong> <strong>of</strong> ManpowerNote: Shaded areas in Exhibits 2A <strong>and</strong> 2B represent years <strong>of</strong> negative overall GDP growth <strong>and</strong> negative manufacturing valueaddedgrowth respectively.12 MINISTRY OF TRADE AND INDUSTRY
<strong>Economic</strong> <strong>Survey</strong> <strong>of</strong> <strong>Singapore</strong> First Quarter 2009<strong>Singapore</strong> EconomyExhibits 3A <strong>and</strong> 3B show the percentage point contributions <strong>of</strong> productivity <strong>and</strong> labour cost per workerto overall ULC <strong>and</strong> manufacturing ULC growth respectively. For overall ULC, productivity changesaccounted for 55 per cent <strong>of</strong> the total impact <strong>of</strong> TLC per worker <strong>and</strong> workers per unit <strong>of</strong> output (i.e.,the inverse <strong>of</strong> productivity) on ULC over the entire period <strong>of</strong> 1992-2008. Within the period, wehighlight the ULC trends in three phases <strong>of</strong> the business cycle:a) Recessionary <strong>and</strong> downturn years (i.e., 1998, 2001 <strong>and</strong> 2008). ULC tended to risesharply during these periods. Around 80-95 per cent <strong>of</strong> the rise in ULC during these recessionswas driven by the decline in productivity. Labour productivity is typically pro-cyclical (i.e., fallsduring downturns). 3 One explanation given in the academic literature is that firms may hoardlabour during downturns. 4 Due to adjustment costs, some firms may find it optimal to hoard“excess labour” if they expect the downturn to be relatively short, so that they would be ableto ramp up production quickly when the economy recovers. 5 On the other h<strong>and</strong>, thecontribution <strong>of</strong> TLC per worker to ULC growth was small as labour costs tended to moderatedownwards, albeit slowly, during downturns.b) Recovery years (i.e., 1999-2000 <strong>and</strong> 2002-2004). The ULC tended to fall during theserecovery periods, with labour productivity improvements accounting for 60-70 per cent <strong>of</strong> thetotal impact on ULC. Firms could ramp up output quickly by using existing labour moreintensively, especially given hiring lags. However, as the labour market tightened, growth inTLC per worker partially <strong>of</strong>fset the impact <strong>of</strong> the rise in labour productivity.c) Periods <strong>of</strong> sustained strong GDP growth (i.e., 1992-1997 <strong>and</strong> 2005-2007). Withsustained growth after the initial recovery periods, ULC tended to rise again due to strongincreases in TLC per worker arising from a tight labour market. In contrast to the recoveryyears, the rise in TLC per worker was large enough to outstrip the impact <strong>of</strong> continuedproductivity improvementsExhibit 3A: Decomposition <strong>of</strong> Overall ULC Growth, 1992-2008Per CentULC TLC / Worker Workers / VA (1) Contribution <strong>of</strong>Average GrowthProductivity (2)(a) = (b)+(c) (b) (c) |c| / (|b|+|c|) (3)1992-2008 1.2 3.7 -2.4 551992-1997 1.7 6.0 -4.0 381998 4.0 0.2 3.7 951999-2000 -3.6 2.9 -6.3 622001 6.4 0.5 5.9 922002-2004 -3.5 2.3 -5.7 712005-2007 2.5 3.7 -1.2 342008 9.6 2.1 7.4 78Notes:1) Calculated based on Gross Value Added (VA) at 2000 basic prices. As Workers / VA is the inverse <strong>of</strong> productivity, anegative (positive) rate <strong>of</strong> growth in Workers / VA implies a rise (decline) in productivity.2) The average contribution <strong>of</strong> productivity to the ULC changes for the different periods is computed as the average <strong>of</strong>the productivity contributions for the individual years within the period.3) |x| = absolute value <strong>of</strong> x3The pro-cyclical behaviour <strong>of</strong> labour productivity has achieved the status <strong>of</strong> a stylised fact <strong>of</strong> macroeconomics. It has beenconfirmed by studies at levels <strong>of</strong> aggregation ranging from the firm to the national economy, <strong>and</strong> for a variety <strong>of</strong> countries <strong>and</strong>sample periods. See,Bernanke <strong>and</strong> Parkinson (1991).4This explanation is favoured by Keynesians. Other explanations include pro-cyclical technological shocks favoured by realbusiness cycle theorists; <strong>and</strong> increasing returns to scale.5See for example DeLong, J. Bradford <strong>and</strong> Waldmann, Robert J. (1997).MINISTRY OF TRADE AND INDUSTRY 13
<strong>Economic</strong> <strong>Survey</strong> <strong>of</strong> <strong>Singapore</strong> First Quarter 2009<strong>Singapore</strong> EconomyFor the manufacturing sector, the contribution <strong>of</strong> productivity changes to the total impact <strong>of</strong> TLC perworker <strong>and</strong> workers per unit <strong>of</strong> output on its ULC over the period 1992-2008 was larger, at 70 per cent(Exhibit 3B). The trends in manufacturing ULC over the business cycle are similar to those observed forthe trends for overall ULC explained above. However, there were two key differences:a) 1998 recession. Unlike in the case <strong>of</strong> the overall ULC, manufacturing ULC fell during the1998 recession. The 1998 recession came on the back <strong>of</strong> two previous years <strong>of</strong> slow growth inthe manufacturing sector due to a global semiconductor slowdown. With sentiments alreadyweak, the onset <strong>of</strong> the Asian Financial Crisis led to record high retrenchments (18,900) in themanufacturing sector in 1998. This large adjustment in labour caused manufacturingproductivity growth to remain positive in 1998, despite negative output growth. Productivitygrowth in turn helped to lower the manufacturing ULC.b) Post-2001 recession. Unlike in the case <strong>of</strong> overall ULC, manufacturing ULC continued to fallthroughout the period after the 2001 recession up to the 2008 downturn, although the pace <strong>of</strong>decline slowed in the second half <strong>of</strong> the period. Much <strong>of</strong> the fall was due to productivityimprovements as manufacturing output growth outstripped employment growth, while theimpact due to the increase in TLC per worker remained muted. With strong output <strong>and</strong>employment growth in the run-up to the 2008 downturn, the subsequent collapse in output<strong>and</strong> labour adjustment lags caused productivity to plunge in 2008. This decline far outpacedthe reduction in TLC per worker, thus resulting in a sharp rise in manufacturing ULC in 2008.Exhibit 3B: Decomposition <strong>of</strong> Manufacturing ULC Growth, 1992-2008Per CentULC TLC / Worker Workers / VA (1) Contribution <strong>of</strong>Average GrowthProductivity (2)(a) = (b)+(c) (b) (c) |c| / (|b|+|c|) (3)1992-2008 -0.7 3.2 -3.7 701992-1997 0.6 7.2 -6.2 441998 -1.0 0.2 -1.2 831999-2000 -9.3 3.4 -12.4 752001 17.0 1.4 15.6 932002-2004 -7.0 1.0 -7.9 882005-2007 -0.5 0.7 -1.1 832008 10.5 -1.5 12.2 89Notes:1) Calculated based on Gross Value Added (VA) at 2000 basic prices. As Workers / VA is the inverse <strong>of</strong> productivity.Hence, a negative (positive) rate <strong>of</strong> growth in Workers / VA implies a rise (decline) in productivity.2) The average contribution <strong>of</strong> productivity to the ULC changes for the different periods is computed as the average <strong>of</strong>the productivity contributions for the individual years within the period.3) |x| = absolute value <strong>of</strong> xQuarterly DataQuarterly analysis <strong>of</strong> ULC trends reinforces the conclusions from the annual analysis. Exhibits 4A <strong>and</strong>4B show the percentage point contributions <strong>of</strong> productivity changes to changes in the overall <strong>and</strong>manufacturing ULCs.14 MINISTRY OF TRADE AND INDUSTRY
<strong>Economic</strong> <strong>Survey</strong> <strong>of</strong> <strong>Singapore</strong> First Quarter 2009<strong>Singapore</strong> EconomyExhibit 4: Growth <strong>of</strong> ULC <strong>and</strong> Contribution <strong>of</strong> Productivity, 1Q 1992-4Q 2008(A) Overall Economy(B) ManufacturingPer Cent151050-5Overall ULC-10 Inverse <strong>of</strong> OverallProductivity-15'92 '94 '96 '98 '00 '02 '04 '06 '08Source: <strong>Singapore</strong> Department <strong>of</strong> Statistics<strong>Ministry</strong> <strong>of</strong> ManpowerPer Cent3020100ManufacturingULC-10Inverse <strong>of</strong>Manufacturing-20 Productivity'92 '94 '96 '98 '00 '02 '04 '06 '08Source: <strong>Singapore</strong> Department <strong>of</strong> Statistics<strong>Ministry</strong> <strong>of</strong> ManpowerNotes:1) Shaded areas in Exhibits 4A <strong>and</strong> 4B represent quarters <strong>of</strong> negative overall GDP growth <strong>and</strong> negative manufacturing valueaddedgrowth respectively.2) The blue bars show the percentage point contributions <strong>of</strong> changes in the inverse <strong>of</strong> labour productivity to the respective ULCchanges. A negative contribution implies positive labour productivity growth, while a positive contribution implies negativelabour productivity growth. Changes in ULC that are not attributed to labour productivity changes can be attributed to changesin TLC per worker.It is clear from the charts that productivity changes were the key contributors to the rise inoverall <strong>and</strong> manufacturing ULCs during the downturns, <strong>and</strong> also their subsequent declinesduring recovery periods. During the period <strong>of</strong> sustained strong growth in the early to mid-1990s,overall ULC rose on the back <strong>of</strong> increases in TLC per worker. While the annual data had suggestedthat this was also true in the subsequent growth period <strong>of</strong> 2005-2007, analysis <strong>of</strong> the quarterly datahas shown that the rise in overall ULC was increasingly driven by the fall in productivity rather thanincreases in TLC per worker. Compared to the overall ULC, TLC per worker was relatively lessimportant as a driver <strong>of</strong> the manufacturing ULC even during periods <strong>of</strong> strong sustained growth.ConclusionThe analyses above suggest that ULC is heavily influenced by productivity changes, especially duringdownturns <strong>and</strong> recovery years. Given the pro-cyclical nature <strong>of</strong> productivity, ULC has a tendency torise during downturns, including the current one. This is especially so since the downward adjustment<strong>of</strong> labour cost per worker (e.g., wages) takes time, <strong>and</strong> is not likely to <strong>of</strong>fset the impact <strong>of</strong> the fall inproductivity. However, in periods <strong>of</strong> strong sustained growth, labour costs become a more importantdriver <strong>of</strong> ULC increases for the overall economy.Recent labour market initiatives such as the Skills Programme for Upgrading <strong>and</strong> Resilience (SPUR) <strong>and</strong>the Jobs Credit Scheme (JCS) will help to keep local workers employed during the current downturn.These schemes are therefore likely to contribute to further declines in productivity, since output isunlikely to grow strongly. On the other h<strong>and</strong>, the JCS, which is akin to a wage subsidy for localworkers, may also help firms to lower their labour costs per worker. While the net effect <strong>of</strong> the newschemes on the ULC is unclear at this juncture, past experience suggests that the productivity effectmay dominate. This implies that the ULC will continue to rise, at least in the first half <strong>of</strong> 2009.Contributed by:Ms Rita Kaonang, EconomistEdward Teo, Senior Economist<strong>Economic</strong>s <strong>and</strong> Strategy Division<strong>Ministry</strong> <strong>of</strong> <strong>Trade</strong> <strong>and</strong> <strong>Industry</strong>MINISTRY OF TRADE AND INDUSTRY 15
<strong>Economic</strong> <strong>Survey</strong> <strong>of</strong> <strong>Singapore</strong> First Quarter 2009<strong>Singapore</strong> EconomyReferences:Bernanke, Ben S. <strong>and</strong> Parkinson, Martin L. (1991), ”Procyclical Labour Productivity <strong>and</strong> CompetingTheories <strong>of</strong> the Business Cycle: Some Evidence from Interwar U.S. Manufacturing Industries”, Journal<strong>of</strong> Political Economy 99, pp 439-59.Bordo, Michael D. <strong>and</strong> Evans, Charles L. (1993), “Labor Productivity during the Great Depression”,NBER Working Paper 4415.Delong, Bradford J. <strong>and</strong> Waldmann, Robert J. (1997), "Interpreting Procyclical ProductivityMovements: Evidence from a Cross-Nation Cross-<strong>Industry</strong> Panel", Federal Reserve Bank <strong>of</strong> SanFrancisco <strong>Economic</strong> Review 1997:1 (Spring), pp. 33-52.16 MINISTRY OF TRADE AND INDUSTRY
<strong>Economic</strong> <strong>Survey</strong> <strong>of</strong> <strong>Singapore</strong> First Quarter 2009Performance <strong>of</strong> Selected SectorsCHAPTER 2PERFORMANCE OF SELECTED SECTORSOVERVIEW• The impact <strong>of</strong> the global economic downturn was felt across most sectors. The manufacturing sectorcontracted sharply with particularly steep declines in the electronics, biomedical, <strong>and</strong> chemicalclusters.• Wholesale <strong>and</strong> retail trade fell sharply in the first quarter <strong>of</strong> 2009, in t<strong>and</strong>em with decline in exports<strong>and</strong> regional trade.• The transport <strong>and</strong> storage sector weakened sharply in the first quarter, with a decline in both air <strong>and</strong>sea transport growth.• A decline in visitor arrivals <strong>and</strong> poorer consumer sentiments weighed on the performance <strong>of</strong> thehotels <strong>and</strong> restaurants sector.MANUFACTURING• The manufacturing sector contracted 26per cent in the first quarter <strong>of</strong> 2009,compared to the 11 per cent contractionin the last quarter <strong>of</strong> 2008.• Reduced product orders led to substantialoutput decline in the electronics <strong>and</strong>precision engineering clusters.• The electronics cluster recorded acontraction <strong>of</strong> almost 39 per cent withlower output across all segments. Inparticular, the infocomms & consumerelectronics segment fell by 54 per centdue to lower output <strong>of</strong> mobile devices.• The 29 per cent decline in the biomedicalmanufacturing cluster arose from thedifferent product-mix produced thisquarter compared to a year ago. Thechemicals cluster shrank 23 per cent dueto decreased output, as production wasaffected by a number <strong>of</strong> plantmaintenance shutdowns during thequarter.• The output <strong>of</strong> the general manufacturingindustries declined 11 per cent, primarilydue to declines in the printing <strong>and</strong> food,beverages & tobacco industries.• In contrast, the transport engineeringcluster grew 6.9 per cent. The marine &<strong>of</strong>fshore engineering <strong>and</strong> aerospacesegments increased output by 12 percent <strong>and</strong> 8.1 per cent respectively to fulfillexisting orders.Exhibit 2.1: Manufacturing Growth RatesPer Cent2012.6100-10-20-30-5.6-11.0-10.7-26.1I II III IV I2008 2009Exhibit 2.2: Percentage Point Contribution toManufacturing Sector’s Growth in 1Q 2009Transport EngineeringGeneral ManufacturingChemicalsPrecision EngineeringBiomedicalManufacturingElectronicsTotal Manufacturing-26.1-11.5-8.3-1.0-2.8-3.20.7-40 -30 -20 -10 0 10Per CentMINISTRY OF TRADE AND INDUSTRY 17
<strong>Economic</strong> <strong>Survey</strong> <strong>of</strong> <strong>Singapore</strong> First Quarter 2009Performance <strong>of</strong> Selected SectorsWHOLESALE AND RETAILTRADE• The wholesale <strong>and</strong> retail trade sector fell15 per cent after contracting 5.3 per centin the previous quarter. The decline inwholesale trade reflected the sharpdecline in trade around the world.• Retail sales volume declined 11 per cent,worse than the 5.4 per cent declineregistered in the previous quarter.Excluding motor vehicle sales, the declinein the first quarter was smaller, at 6.7 percent.• The sharpest declines in retail salesvolume were posted by big-ticket retailsegments such as motor vehicles (-19 percent), watches <strong>and</strong> jewellery (-23 percent) <strong>and</strong> furniture <strong>and</strong> householdequipment (-21 per cent). Departmentstores (-0.4 per cent) <strong>and</strong> supermarkets(0.1 per cent) turned in slightly betterperformances.Exhibit 2.3: Changes in Wholesale & Retail <strong>Trade</strong>,NODX <strong>and</strong> NORXPer Cent20Real NORX100-10-20Real NODXWholesale &Retail <strong>Trade</strong> VA-30I II III IV I2008 2009Exhibit 2.4: Changes in Retail Sales Index atConstant PricesPer Cent1050Total (excludingMotor Vehicles)-5Total-10-15I II III IV I2008 200918 MINISTRY OF TRADE AND INDUSTRY
<strong>Economic</strong> <strong>Survey</strong> <strong>of</strong> <strong>Singapore</strong> First Quarter 2009Performance <strong>of</strong> Selected SectorsTRANSPORT AND STORAGE• The first quarter <strong>of</strong> 2009 saw a sharpdecline in growth in the transport <strong>and</strong>storage sector from -2.4 per cent in thefourth quarter <strong>of</strong> 2008 to -10 per cent inthe first quarter. Both air <strong>and</strong> seatransport sectors saw strong declines,while l<strong>and</strong> transport growth was slightlynegative.• In the sea transport sector, containerthroughput fell by 18 per cent comparedto a decline <strong>of</strong> 3.3 per cent in the fourthquarter <strong>of</strong> 2008. Growth was weak for allthree months <strong>of</strong> the first quarter,although there was a slight pickup inthroughput in March.• In the air transport sector, air passengergrowth also fell from -0.4 per cent in thefourth quarter <strong>of</strong> 2008 to -7.8 per cent inthe first quarter. During the quarter,dem<strong>and</strong> for both business <strong>and</strong> leisuretravel fell sharply while airlines across theworld announced reductions in capacity.HOTELS AND RESTAURANTS• The hotels <strong>and</strong> restaurants sector fell 4.9per cent, down from the decline <strong>of</strong> 0.1per cent in the previous quarter.• Visitor arrivals declined 14 per cent. As aresult, the hotel average occupancy ratedropped 12 percentage points to reach 72per cent in the first quarter <strong>of</strong> 2009. Hotelaverage room rates declined 17 per centin the first quarter <strong>of</strong> 2009, marking thefirst decline since the fourth quarter <strong>of</strong>2003.• The catering trade index at constantprices contracted 4.9 per pent in the firstquarter, led by declines across allsegments except fast food outlets.Exhibit 2.5: Changes in Container Throughput <strong>and</strong>Air Passenger H<strong>and</strong>ledPer Cent20100-10Air PassengerContainer Throughput-20I II III IV I2008 2009Exhibit 2.6: Average Hotel Room RateDollar280260240220200180YOY Change (RHS)I II III IV I2008 2009Exhibit 2.7: Changes in Catering <strong>Trade</strong> atConstant PricesPer Cent4 3.5Per Cent40200-20-40-6021.80-20.00.0-4-6-4.9I II III IV I2008 2009MINISTRY OF TRADE AND INDUSTRY 19
<strong>Economic</strong> <strong>Survey</strong> <strong>of</strong> <strong>Singapore</strong> First Quarter 2009<strong>Economic</strong> OutlookCHAPTER 3ECONOMIC OUTLOOKLEADING INDICATORS• The composite leading index (CLI)declined at a slower pace by 1.7 per centin the first quarter, compared to the 6.4per cent decline in the previous quarter.• Of the nine components within the index,six components experienced declines,two components experienced increaseswhile one component remainedunchanged.• The two indicators that have improvedare money supply <strong>and</strong> the number <strong>of</strong>new companies formed. The indicator fordomestic liquidity remained flat while theother indicators declined.Exhibit 3.1: Composite Leading Index Levels <strong>and</strong>Growth Rate2000=100 Per Cent130 QOQ Change (RHS)4125120115110105100-8I2006II III IV I2007II III IV I2008II III IV I200920-2-4-6CONCLUSIONIn April 2009, the <strong>Ministry</strong> <strong>of</strong> <strong>Trade</strong> <strong>and</strong> <strong>Industry</strong> lowered the 2009 GDP growth forecast from -5.0 to-2.0 per cent to -9.0 to -6.0 per cent, taking into account the sharp deterioration in economic activity inthe first quarter <strong>of</strong> 2009 <strong>and</strong> the weak global outlook for the rest <strong>of</strong> the year.Since then, tentative signs <strong>of</strong> stabilization in global economies have emerged, especially in the US <strong>and</strong>Asia. Significantly, the pace <strong>of</strong> job losses in the US started to level <strong>of</strong>f in April, while consumerconfidence within the economy continued to improve in the month. The contraction in the USmanufacturing sector also appears to have moderated based on the latest Purchasing Managers’ Index.In Asia, export volumes are showing tentative signs <strong>of</strong> recovery in recent months, in particular for SouthKorea <strong>and</strong> Japan. China’s economy exp<strong>and</strong>ed by a better-than-expected 6.1 per cent in the first quarter<strong>of</strong> 2009 on the back <strong>of</strong> strong retail sales <strong>and</strong> fixed asset investment over the period.Domestically, the <strong>Singapore</strong> economy remains weak, with GDP contracting by 10.1 per cent on a yearon-yearbasis in the first quarter, worse than the 4.2 per cent contraction in the preceding quarter.Forward-looking indicators like the composite leading index point to a less pessimistic outlook for<strong>Singapore</strong> as compared to the preceding quarter. <strong>Singapore</strong>’s exports declined marginally in Aprilfollowing two months <strong>of</strong> sequential month-on-month improvement. Meanwhile, the PurchasingManagers’ Index edged up in April. Overall, economic indicators for <strong>Singapore</strong> remain mixed.At this juncture, the global <strong>and</strong> domestic economies still face significant uncertainties. The recovery <strong>of</strong>the global economy in the rest <strong>of</strong> 2009 remains susceptible to a number <strong>of</strong> risks, in particular the health<strong>of</strong> the US banking <strong>and</strong> automobile sectors <strong>and</strong> the possible emergence <strong>of</strong> a second <strong>and</strong> more virulentwave <strong>of</strong> H1N1. The impact <strong>of</strong> the US fiscal stimulus still remains uncertain.In view <strong>of</strong> the uncertain outlook for the global external environment <strong>and</strong> the economic situation in<strong>Singapore</strong> in the first quarter, the <strong>Ministry</strong> <strong>of</strong> <strong>Trade</strong> <strong>and</strong> <strong>Industry</strong> maintains the 2009 GDP growthforecast at -9.0 to -6.0 per cent.20 MINISTRY OF TRADE AND INDUSTRY
FEATUREARTICLEHOW RELIANT ARE EAST ASIAN ECONOMIESON FINAL DEMAND IN CHINA AND THE G-3?
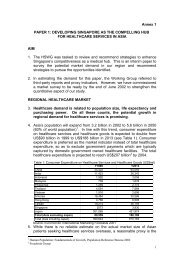
<strong>Economic</strong> <strong>Survey</strong> <strong>of</strong> <strong>Singapore</strong> First Quarter 2009Feature ArticleHOW RELIANT ARE EAST ASIAN ECONOMIES ONFINAL DEMAND IN CHINA AND THE G-3?The views expressed in this paper are solely those <strong>of</strong> the author <strong>and</strong> do not necessarily reflect those <strong>of</strong> the<strong>Ministry</strong> <strong>of</strong> <strong>Trade</strong> <strong>and</strong> <strong>Industry</strong> or the Government <strong>of</strong> <strong>Singapore</strong>.BACKGROUNDAfter thirty years <strong>of</strong> economic transformation, China has become one <strong>of</strong> the largest economies in theworld, accounting for an estimated 11 per cent <strong>of</strong> the world’s economic output (in purchasing powerparity terms) <strong>and</strong> contributing nearly 27 per cent to global growth in 2007 (IMF, 2008). Exp<strong>and</strong>ing at anaverage rate <strong>of</strong> 9.6 per cent per annum over the past decade, China’s economy was driven by a rapidbuildup in physical capital, robust growth in export-oriented industrial production <strong>and</strong> a steady rise inconsumption. In particular, supported by rising income levels, total consumption expenditure in Chinagrew significantly by an average <strong>of</strong> 7.4 per cent per annum between 1997 <strong>and</strong> 2007, contributing anaverage <strong>of</strong> 4.1 percentage points to annual GDP growth over this period.Leveraging on China’s rapid economic growth, many East Asian economies have intensified their effortsto reach China’s consumers or plug themselves into China’s production processes through supplying rawmaterials <strong>and</strong> intermediate goods. These efforts have strengthened trade flows between China <strong>and</strong> EastAsian economies in recent years. As a result, the export exposure <strong>of</strong> many East Asian economies toChina has increased significantly (Exhibit 1).Exhibit 1: Direct Exports to China, EU <strong>and</strong> US as a Percentage <strong>of</strong> Total Exports (2003 <strong>and</strong> 2007)China EU US2003 2007 2003 2007 2003 2007<strong>Singapore</strong> 6.3 9.7 12.8 10.7 12.0 8.8Malaysia 6.5 8.8 12.6 12.8 19.6 15.6South Korea 18.1 22.1 14.0 15.1 17.7 12.3Taiwan 15.2 25.3 13.2 10.9 17.6 13.0Hong Kong 42.6 48.7 13.8 13.5 18.6 13.7Indonesia 6.2 8.5 13.7 11.7 12.1 10.2Philippines 6.1 11.4 16.7 17.0 19.6 17.0Thail<strong>and</strong> 7.1 9.7 15.3 14.0 17.0 12.6Source: Various <strong>of</strong>ficial sourcesThe rising importance <strong>of</strong> China as a key export destination for East Asian economies has led to someconclusions that China had become a new engine <strong>of</strong> growth for Asia. Pointing to the continued resilience<strong>of</strong> Asian economies in the second half <strong>of</strong> 2007 when the US economy started to cool, proponents <strong>of</strong> this“decoupling” view argued that Asia had reduced its reliance on the US <strong>and</strong> other developed economies<strong>and</strong> could weather adverse external conditions more effectively compared to the past.However, this “decoupling” thesis has unraveled. The recession in the US evolved in 2008 into a fullblown global crisis which has led to a severe deterioration in consumption dem<strong>and</strong> <strong>and</strong> trade in mostparts <strong>of</strong> the world, including China. Many recent studies now provide compelling evidence that suggeststhat the G-3 economies (i.e., US, EU <strong>and</strong> Japan), rather than China, are still the dominant force drivingeconomic growth in Asia, even in the face <strong>of</strong> China’s apparent economic ascendance.22 MINISTRY OF TRADE AND INDUSTRY
<strong>Economic</strong> <strong>Survey</strong> <strong>of</strong> <strong>Singapore</strong> First Quarter 2009Feature ArticleFor example, the Asian Development Bank (ADB) (2007) estimated that a significant 61 per cent <strong>of</strong> Asia’stotal exports were eventually consumed in the G-3, while only 6.4 per cent <strong>of</strong> Asia’s exports went tomeet final dem<strong>and</strong> in China. A study by the Hong Kong Monetary Authority (HKMA) (2007) estimatedthat a 10 per cent decline in the US’ imports could lead to a 2.9 per cent decline in NIE-4’s total exports<strong>and</strong> a 3.0 per cent decline in ASEAN’s total exports, reflecting the vulnerability <strong>of</strong> emerging Asia todem<strong>and</strong> shocks from the US notwithst<strong>and</strong>ing their greater exposure to China. A more recent study bythe European Central Bank (2009) found that final dem<strong>and</strong> in China only accounted for 7.2 per cent <strong>of</strong>the value-added in the NIE-3 (Korea, <strong>Singapore</strong> <strong>and</strong> Taiwan) <strong>and</strong> ASEAN-4 (Indonesia, Malaysia, thePhilippines <strong>and</strong> Thail<strong>and</strong>).This article deepens the existing analysis by examining:a. China’s final dem<strong>and</strong> for different categories <strong>of</strong> imported goods originating from East Asianeconomies; <strong>and</strong>b. the extent <strong>of</strong> reliance individual East Asian economies have on final dem<strong>and</strong> within China <strong>and</strong>the G-3.ANALYSIS OF CHINA’S IMPORTSData on China’s imports can be generally disaggregated into two broad categories:a. Imports for processing trade. These refer to imports that are intended to be assembled ortransformed, <strong>and</strong> subsequently re-exported. These imports are generally exempted from importduties <strong>and</strong> taxes.b. Imports for ordinary trade. These refer to imports that are geared towards meeting domesticconsumption <strong>and</strong> which are subjected to general tariff rates. A small portion <strong>of</strong> such importscould be used in the production <strong>of</strong> export goods which are based mostly on local Chinesecontent 1 .An analysis <strong>of</strong> the data for 2006/2007 is given below.Breakdown by Type <strong>of</strong> <strong>Trade</strong> <strong>and</strong> Product CategoryImports for processing trade 2 in China accounted for a significant 46 per cent <strong>of</strong> the economy’s totalimports in 2007. In other words, China’s imports <strong>of</strong> intermediate goods <strong>and</strong> equipment used in itsexport-oriented manufacturing activities make up nearly half <strong>of</strong> the economy’s total imports. The other54 per cent <strong>of</strong> China’s imports were classified under ordinary trade which we assume to be generallygeared towards meeting domestic dem<strong>and</strong> within China.1 For example, it is possible that some oil imports or capital equipment that are classified as imports under ordinary trade may beused in the production <strong>of</strong> goods destined for export markets. This means that there could be some overlaps between imports forprocessing <strong>and</strong> ordinary trade. Hence, the distinction between the two types <strong>of</strong> imports may not be so clear.2 This refers mainly to imports <strong>of</strong> goods that are intended to be assembled or transformed in China, <strong>and</strong> subsequently re-exported.It also includes imports <strong>of</strong> equipment used predominantly for export-oriented manufacturing activities. In comparison, ordinarytrade refers primarily to imports intended for China’s domestic market <strong>and</strong> may include some exports that are mostly based onlocal Chinese input. Apart from processing <strong>and</strong> ordinary trade, there are other less significant components <strong>of</strong> trade classified underChina’s custom regime (e.g. custom warehousing trade, goods on lease or consignment, aids <strong>and</strong> donations) which are notconsidered in our analysis due to their relatively small share in China’s imports <strong>and</strong> lack <strong>of</strong> detailed statistics on such tradecomponents.MINISTRY OF TRADE AND INDUSTRY 23
<strong>Economic</strong> <strong>Survey</strong> <strong>of</strong> <strong>Singapore</strong> First Quarter 2009Feature ArticleKey imports which were intended primarily for processing trade included Electronics (80 per cent),Miscellaneous Items (e.g., optical, photographic equipment <strong>and</strong> parts) (76 per cent) <strong>and</strong> Textile goods(71 per cent) (Exhibit 2). Those that were geared towards meeting domestic dem<strong>and</strong> included TransportEquipment, Mineral Fuels as well as Food, Beverage <strong>and</strong> Tobacco. Falling in the middle <strong>of</strong> the range wereMetals <strong>and</strong> Wood & Other Non-oil Items. Details on the composition <strong>of</strong> each product category areprovided in Annex 1.Exhibit 2: Breakdown in China’s Imports by Product Category & Type <strong>of</strong> <strong>Trade</strong>, 2006Per Cent100806040200ElectronicsMiscellaneousItemsTextilesWood & OtherNon-Oil ItemsProcessing <strong>Trade</strong>Ordinary <strong>Trade</strong>Source: China <strong>Trade</strong> <strong>and</strong> External <strong>Economic</strong> Statistical Yearbook 2007MetalsMachineryChemicalsFood,Beverage &TobaccoMineral FuelsTransportEquipmentBreakdown by Product Category <strong>and</strong> Source CountryElectronics products dominated China’s imports from the Philippines <strong>and</strong> Malaysia (76 per cent <strong>and</strong> 58per cent respectively). It also accounted for a significant share <strong>of</strong> China’s imports from the NIE-4(ranging from 34 per cent to 41 per cent for individual economies). In contrast, such products accountedfor a relatively smaller share <strong>of</strong> China’s imports from Thail<strong>and</strong> (25 per cent) <strong>and</strong> Indonesia (9.2 per cent)(Exhibit 3).Exhibit 3: Breakdown in China’s Imports from Various Economies by Product Categories, 2007Per Cent100806040200Philippines Malaysia Taiwan <strong>Singapore</strong> Hong Kong South Thail<strong>and</strong> IndonesiaKoreaElectronics Machinery Food, Beverage & TobaccoMineral Fuels Chemicals Wood & Other Non-Oil ItemsTextiles Metals Transport EquipmentMiscellaneous ItemsSource: CEIC24 MINISTRY OF TRADE AND INDUSTRY
<strong>Economic</strong> <strong>Survey</strong> <strong>of</strong> <strong>Singapore</strong> First Quarter 2009Feature ArticleAt the other extreme, Mineral Fuels accounted for 36 per cent <strong>of</strong> China’s imports from Indonesia, whileMachinery accounted for around 31 per cent <strong>and</strong> 20 per cent <strong>of</strong> China’s imports from Thail<strong>and</strong> <strong>and</strong><strong>Singapore</strong> respectively. Miscellaneous Items accounted for close to 20 per cent <strong>of</strong> China’s imports fromTaiwan. The other product categories – Food, Beverage <strong>and</strong> Tobacco, Chemicals, Textiles, Metals,Transport Equipment, Wood & Other Non-oil Items – separately accounted for less than 20 per cent <strong>of</strong>China’s imports from individual East Asian economies, reflecting their limited penetration into the Chinesemarket.Exposure <strong>of</strong> East Asian Economies to Final Dem<strong>and</strong> in ChinaWe can now make the argument that economies which had large exposures to electronics exports were,on balance, less plugged into China’s final domestic dem<strong>and</strong>. For example, after taking into account thePhilippines’ <strong>and</strong> Taiwan’s significant exposure to electronics exports, we found that only about 30 percent <strong>and</strong> 35 per cent <strong>of</strong> their exports to China catered to China’s domestic dem<strong>and</strong> (Exhibit 4). As aresult, these economies are likely to be more vulnerable to weak external dem<strong>and</strong> conditions outsideChina.On the other h<strong>and</strong>, economies such as Indonesia, which is more geared towards supplying China’sdomestic dem<strong>and</strong>, could be better shielded from the sharp contraction in global dem<strong>and</strong>. As shown inExhibit 4, a significant 70 per cent <strong>of</strong> Indonesia’s exports to China were oriented towards meetingdomestic dem<strong>and</strong> in China.<strong>Singapore</strong> falls somewhere in the middle <strong>of</strong> the range in terms <strong>of</strong> the extent <strong>of</strong> exposure to China’sdomestic dem<strong>and</strong>. <strong>Singapore</strong>’s large exposure to Electronics (39 per cent) was balanced out by itsexposures to products geared towards meeting China’s domestic dem<strong>and</strong>, most notably Mineral Fuels.Consequently, about 46 per cent <strong>of</strong> <strong>Singapore</strong>’s exports to China catered to China’s domestic dem<strong>and</strong>.However, if Mineral Fuels, comprising mainly oil <strong>and</strong> related products, were excluded, then only about 41per cent <strong>of</strong> <strong>Singapore</strong>’s exports to China catered to the economy’s domestic dem<strong>and</strong>. If we furtherconsider <strong>Singapore</strong>’s total exports to the world, then only 3.9 per cent to 4.5 per cent 3 <strong>of</strong> such exportswere estimated to be consumed in China.Exhibit 4: Share <strong>of</strong> Exports that Catered to China’s Domestic Dem<strong>and</strong> (2007)As a percentage <strong>of</strong> totalexports to ChinaAs a percentage <strong>of</strong> totalexports to the worldPer CentPhilippines 30.2 3.4Taiwan 34.7 8.8Hong Kong 35.9 17.5Malaysia 39.5 3.5South Korea 42.1 9.3<strong>Singapore</strong> 46.5* 4.5*Thail<strong>and</strong> 51.2 5.0Indonesia 70.1 5.9* Excluding Mineral Fuels, an estimated 41.2 per cent <strong>of</strong> <strong>Singapore</strong>’s exports to China <strong>and</strong> 3.9 per cent <strong>of</strong> <strong>Singapore</strong>’stotal exports to the world were oriented towards meeting consumption dem<strong>and</strong> in China.3 In comparison, Citigroup (2008) estimated that <strong>Singapore</strong>’s exports catering to China’s domestic dem<strong>and</strong> accounted for at most4.2 per cent <strong>of</strong> <strong>Singapore</strong>’s total domestic exports. The HKMA (2008), on the other h<strong>and</strong>, estimated that <strong>Singapore</strong>’s exportscatering to China’s domestic dem<strong>and</strong> (including <strong>Singapore</strong>’s exports to China through Hong Kong) accounted for 10 per cent <strong>of</strong><strong>Singapore</strong>’s total exports.MINISTRY OF TRADE AND INDUSTRY 25
<strong>Economic</strong> <strong>Survey</strong> <strong>of</strong> <strong>Singapore</strong> First Quarter 2009Feature ArticleEXPOSURE TO FINAL DEMAND IN THE G-3 VIA PROCESSINGTRADE IN CHINAA significant portion <strong>of</strong> East Asia’s exports to China is likely to be used as intermediate inputs to beassembled into final goods in China <strong>and</strong> subsequently shipped to the G-3. Hence, in estimating theexport exposure among East Asian economies to final dem<strong>and</strong> in the G-3, we need to account for theirindirect exposures to the G-3 via processing trade in China.One key challenge in making such estimations was that data on the exact flow <strong>of</strong> goods from individualeconomies through China to the other parts <strong>of</strong> the world was not available. To overcome this, weassumed that China’s imports for processing trade were pooled <strong>and</strong> assembled into homogenous finalproducts <strong>and</strong> then distributed to China’s export markets (e.g., US, EU <strong>and</strong> Japan) in proportion to therelative size <strong>of</strong> these markets. While simplistic, this method does provide some rough indications <strong>of</strong> theextent <strong>of</strong> exposure to final dem<strong>and</strong> in various economies. A summary <strong>of</strong> the estimates is provided inExhibit 5 below.Exhibit 5: Bilateral Export Exposures for Selected East Asian Economies in 2007Source Country Export market Share <strong>of</strong> totalexports goingdirectly torespectivemarkets(a)Share <strong>of</strong> total exports usedas intermediate inputs forChina’s exports to respectivemarkets(b)Per CentTotal exportexposure(c) = (a) + (b)<strong>Singapore</strong>Hong KongTaiwanSouth KoreaPhilippinesMalaysiaThail<strong>and</strong>G-3 24.3 2.5 26.8China 9.7 -5.2* 4.5G-3 31.7 15.3 47.0China 48.7 -31.2* 17.5G-3 30.4 8.1 38.5China 25.3 -16.5* 8.8G-3 34.5 6.2 40.7China 22.1 -12.8* 9.3G-3 48.5 3.9 52.4China 11.4 -8.0* 3.4G-3 37.5 2.6 40.1China 8.8 -5.3* 3.5G-3 38.4 2.3 40.7China 9.7 -4.7* 5.0G-3 42.6 1.2 43.8IndonesiaChina 8.5 -2.5* 6.0* Refers to the share <strong>of</strong> exports to China (out <strong>of</strong> total exports) that was used for processing trade. This portion should bestripped out from the direct export exposure to China to derive the actual exposure to China’s domestic dem<strong>and</strong>.As shown, the indirect export exposure to the G-3 via China was significant for most economies, with adifference <strong>of</strong> as much as 15 percentage points in the case <strong>of</strong> Hong Kong 4 . If we account for such indirectexport exposures, the export patterns for Hong Kong, Taiwan <strong>and</strong> South Korea would be significantlyaltered.4 In other words, 15 per cent <strong>of</strong> Hong Kong’s total exports to the world were exported to China <strong>and</strong> used as intermediate inputs forthe manufacture <strong>of</strong> final goods that China subsequently exported to the G-3.26 MINISTRY OF TRADE AND INDUSTRY
<strong>Economic</strong> <strong>Survey</strong> <strong>of</strong> <strong>Singapore</strong> First Quarter 2009Feature ArticleHong Kong provides a useful case in point. If we considered only direct export exposure, China would beHong Kong’s largest export market, accounting for 49 per cent <strong>of</strong> Hong Kong’s total exports, while the G-3 collectively accounted for 32 per cent <strong>of</strong> Hong Kong’s total exports. But after adjusting for Hong Kong’sindirect export exposure to the G-3 via processing trade in China, the situation becomes reversed. TheG-3 has become Hong Kong’s largest export market, accounting for 47 per cent <strong>of</strong> Hong Kong’s exports,while China only accounted for about 18 per cent. This finding should not come as a surprise given theimportance <strong>of</strong> outward processing activities in the Hong Kong-China trade, with finished productsdestined for export markets in the US <strong>and</strong> other advanced economies. More importantly, this findingsuggests that conventional measures for trade linkages based on bilateral trade statistics could bemisleading in the light <strong>of</strong> how fragmented global production chains have become.Most <strong>of</strong> the selected East Asian economies’ export exposures to the G-3 (after including indirectexposures via China) were around 40 per cent or higher. This lends weight to the argument that EastAsian economies generally remain reliant on <strong>and</strong> susceptible to dem<strong>and</strong> conditions in the G-3. <strong>Singapore</strong>appears to be an exception, with 27 per cent <strong>of</strong> total exports going to the G-3 (even after accounting forindirect exposures via China). However, the large volume <strong>of</strong> re-export trade through <strong>Singapore</strong> probablydistorts the figure, especially given that a significant part <strong>of</strong> such trade are in oil <strong>and</strong> electroniccomponent products which are likely to be used in outward processing activities in other parts <strong>of</strong> Asia.When we remove re-exports <strong>and</strong> consider only <strong>Singapore</strong>’s non-oil domestic exports, our exportexposure to the G-3 would be significantly higher at about 42 per cent, comparable to other East Asianeconomies.CONCLUSIONOur findings are generally in line with those <strong>of</strong> recent studies by ADB (2007), HKMA (2007) <strong>and</strong> ECB(2009). They consistently point towards the conclusion that China has not become a key source <strong>of</strong> finaldem<strong>and</strong> for the exports <strong>of</strong> many East Asian economies. Instead, China appears to be serving as the finalnode <strong>of</strong> global supply chains, assembling <strong>and</strong> re-exporting a significant portion <strong>of</strong> its imports to otherparts <strong>of</strong> the world. The advanced economies, on the other h<strong>and</strong>, are probably still the biggest consumermarkets in the world <strong>and</strong> continue to play a key role in driving the business cycles <strong>of</strong> most Asianeconomies.Based on these findings, it can be concluded that external dem<strong>and</strong> remains an important source <strong>of</strong>economic growth for the region <strong>and</strong> that Asia is unlikely to weather a significant slowdown in the USeconomy, even with China’s rise as an economic powerhouse.Recent trade data lends further support to these arguments. In the first quarter <strong>of</strong> 2009, China’s exportsto the US, EU <strong>and</strong> Japan fell sharply by 15 per cent, 22 per cent <strong>and</strong> 16 per cent year-on-yearrespectively, in t<strong>and</strong>em with the sharp contraction in dem<strong>and</strong> in these economies. At the same time,China’s imports from the eight selected East Asian economies fell by between 25 per cent (<strong>Singapore</strong>)<strong>and</strong> 61 per cent (the Philippines) year-on-year, suggesting that the dem<strong>and</strong> shock from the G-3 to Chinahad transmitted to the rest <strong>of</strong> Asia. Put together, the evidence from various sources implies that Asia’sexports are still very much reliant on dem<strong>and</strong> from external economies like the G-3 <strong>and</strong> less so on China.Contributed by:Jason TeoEconomist<strong>Economic</strong>s <strong>and</strong> Strategy Division<strong>Ministry</strong> <strong>of</strong> <strong>Trade</strong> <strong>and</strong> <strong>Industry</strong>MINISTRY OF TRADE AND INDUSTRY 27
<strong>Economic</strong> <strong>Survey</strong> <strong>of</strong> <strong>Singapore</strong> First Quarter 2009Feature ArticleREFERENCESAsian Development Bank (2007), “Uncoupling Asia: Myth <strong>and</strong> Reality”, Asian Development Outlook 2007.Citigroup Global Markets (2008), “<strong>Singapore</strong> Market Weekly: China’s Domestic Dem<strong>and</strong> – Asia’s Saviour?”European Central Bank (2009), “Has Emerging Asia Decoupled? An Analysis <strong>of</strong> Production <strong>and</strong> <strong>Trade</strong>Linkages using the Asian International Input-output Table”Hong Kong Monetary Authority (2007), “Sense <strong>and</strong> Nonsense about Asia’s Export Dependency <strong>and</strong> theDecoupling Thesis”, Hong Kong Monetary Authority Quarterly Bulletin, June 2007.Hong Kong Monetary Authority (2008), “Can Dem<strong>and</strong> from China Shield East Asian Economies fromGlobal Slowdown?”, Working Paper 19/2008, December 2008.International Monetary Fund (2008), “Global Growth Estimates Trimmed After PPP Revisions”, IMF<strong>Survey</strong> Magazine.28 MINISTRY OF TRADE AND INDUSTRY
<strong>Economic</strong> <strong>Survey</strong> <strong>of</strong> <strong>Singapore</strong> First Quarter 2009Feature ArticleANNEX 1: CLASSIFICATION OF CHINA’S IMPORTS BY BROADPRODUCT CATEGORIESBroad Product CategoryFood, Beverage & TobaccoMineral FuelsChemicalsWood <strong>and</strong> Other Non-oil ItemsTextilesMetalsElectronicsMachineryTransport EquipmentMiscellaneous ItemsSpecific Products (classified based on the Harmonised System - HS)Live animals, animal products; vegetable products; animal orvegetable fats <strong>and</strong> oils; prepared foodstuffs, beverage <strong>and</strong> tobaccoMineral fuels, mineral oils <strong>and</strong> other mineral productsProducts <strong>of</strong> chemical or allied industries (including pharmaceuticalproducts, fertilizers, organic <strong>and</strong> inorganic chemicals)Plastics, rubber <strong>and</strong> articles there<strong>of</strong>; raw hides <strong>and</strong> skins, leather <strong>and</strong>articles; wood <strong>and</strong> articles charcoal, pulp <strong>of</strong> wood; paper <strong>and</strong>paperboard; articles <strong>of</strong> stone, cement, glassTextiles <strong>and</strong> textile articles; footwear, headgear, umbrellasPrecious stone <strong>and</strong> metals; base metals <strong>and</strong> articlesElectrical machinery <strong>and</strong> equipment <strong>and</strong> parts there<strong>of</strong>; soundrecorders <strong>and</strong> reproducers; television image <strong>and</strong> sound recorders <strong>and</strong>reproducersNuclear reactors, boilers, machinery <strong>and</strong> mechanical appliances; partsthere<strong>of</strong>Vehicles, aircraft, vessels <strong>and</strong> transport equipmentOptical, photographic, musical instruments; arms <strong>and</strong> ammunition,parts & accessories; miscellaneous manufacturing articles; works <strong>of</strong>art, collectors' pieces, antiques; items not classified according to kindMINISTRY OF TRADE AND INDUSTRY 29
STATISTICALAPPENDIX
STATISTICAL APPENDIXOUTPUT, EXPENDITURE AND NATIONAL INCOMETable A1.1 Gross Domestic Product by <strong>Industry</strong> 35Table A1.2 Gross Domestic Product by <strong>Industry</strong>, Seasonally Adjusted 37Table A1.3 Percentage Contribution to Growth in Real GDP 38Table A1.4 Gross Domestic Product Deflators by <strong>Industry</strong> 39Table A1.5 Expenditure on Gross Domestic Product 40Table A1.6 Changes <strong>and</strong> Contribution to Growth in Total Dem<strong>and</strong> 41Table A1.7 Gross Fixed Capital Formation 42EMPLOYMENT, PRODUCTIVITY AND BUSINESS COSTSTable A2.1 Changes in Employment by Sector 43Table A2.2 Labour Productivity by <strong>Industry</strong> 44Table A2.3 Indices <strong>of</strong> Unit Business Cost <strong>and</strong> Unit Labour Cost 45PRICESTable A3.1 Consumer Price Index 46Table A3.2 Price Indices 47Table A3.3 Domestic Supply Price Index 48EXCHANGE RATESTable A4.1 Exchange Rates 49INTEREST RATESTable A5.1 Interest Rates 51TRADETable A6.1 External <strong>Trade</strong> 52Table A6.2 Imports by Commodity 53Table A6.3 Exports by Commodity 54Table A6.4 Domestic Exports by Commodity 55Table A6.5 Non-Oil Domestic Exports by Major Products 56Table A6.6 Re-Exports by Commodity 57Table A6.7 Non-Oil Domestic Exports by Major Country/Region 58BALANCE OF PAYMENTSTable A7.1 Balance <strong>of</strong> Payments 59MANUFACTURINGTable A8.1 Index <strong>of</strong> Industrial Production 61Table A8.2 Investment Commitments in Manufacturing <strong>and</strong> Services by<strong>Industry</strong> Cluster 63Table A8.3 Investment Commitments in Manufacturing <strong>and</strong> Services byCountry <strong>of</strong> Origin 64CONSTRUCTIONTable A9.1 Building <strong>and</strong> Construction Activities 65
STATISTICAL APPENDIX (Continued)RETAIL SALESTable A10.1 Retail Sales Index 66TOURISMTable A11.1 Visitor Arrivals by Country <strong>of</strong> Residence 68TRANSPORT AND COMMUNICATIONSTable A12.1 Transport <strong>and</strong> Communications 69MONEY AND BANKINGTable A13.1 Money Supply 70Table A13.2 Monetary <strong>Survey</strong> 71Table A13.3 Assets <strong>of</strong> Banks 72Table A13.4 Liabilities <strong>of</strong> Banks 73Table A13.5 Bank Loans <strong>and</strong> Advances to Non-Bank Customers by <strong>Industry</strong> 74Table A13.6 Assets <strong>and</strong> Liabilities <strong>of</strong> Asian Currency Units 75ECONOMIC OUTLOOKTable A14.1 Quarterly Composite Leading Index 76Table A14.2 Business Expectations for the Manufacturing Sector 77Table A14.3 Business Expectations for the Services Sector 78PUBLIC FINANCETable A15.1 Government Operating Revenue 79Table A15.2 Government Operating Expenditure 80Table A15.3 Government Development Expenditure 81
35GROSS DOMESTIC PRODUCT BY INDUSTRY [TABLE A1.1]2005 2006 2007 2008 I II III IV I II III IV IGDP AT CURRENT MARKET PRICES 201,313.3 221,142.8 251,610.1 257,418.5 58,359.5 60,728.6 64,370.7 68,151.3 65,179.7 63,292.0 64,637.7 64,309.1 58,903.1Goods Producing Industries 61,896.9 68,024.9 71,912.8 67,438.1 16,794.7 17,480.5 18,692.4 18,945.2 17,958.9 16,109.1 16,717.4 16,652.7 15,083.5Manufacturing 51,123.4 56,549.3 58,564.3 50,275.2 13,594.6 14,470.0 15,324.2 15,175.5 14,125.0 12,034.3 12,253.0 11,862.9 10,255.4Construction 7,226.6 7,595.8 9,242.9 13,255.8 2,141.8 2,016.0 2,354.5 2,730.6 2,810.3 3,056.5 3,574.8 3,814.2 3,961.9Utilities 3,381.1 3,695.2 3,925.1 3,729.2 1,013.8 949.5 968.8 993.0 977.9 973.4 844.6 933.3 822.1Other Goods Industries 1 165.8 184.6 180.5 177.9 44.5 45.0 44.9 46.1 45.7 44.9 45.0 42.3 44.1Services Producing Industries 130,603.9 144,051.3 165,187.0 178,074.8 38,605.6 39,846.9 41,552.1 45,182.4 44,133.0 43,919.1 44,554.0 45,468.7 42,204.6Wholesale & Retail <strong>Trade</strong> 33,939.8 39,537.3 43,444.0 44,347.7 9,786.6 10,582.0 11,134.2 11,941.2 10,192.5 11,142.1 11,619.6 11,393.5 8,818.1Transport & Storage 19,930.7 20,172.9 22,844.8 23,317.5 5,525.0 5,426.9 5,643.2 6,249.7 5,894.0 5,566.6 5,589.2 6,267.7 5,049.2Hotels & Restaurants 3,789.1 4,316.7 4,900.8 5,433.5 1,145.6 1,178.3 1,245.4 1,331.5 1,339.4 1,341.3 1,364.1 1,388.7 1,223.7Information & Communications 7,875.8 8,478.4 9,121.2 9,612.7 2,164.1 2,256.4 2,348.8 2,351.9 2,359.7 2,355.1 2,416.5 2,481.4 2,435.0Financial Services 21,994.2 24,796.3 31,117.5 33,789.4 7,150.8 7,551.8 7,893.2 8,521.7 8,719.3 8,702.2 8,339.2 8,028.7 8,795.3Business Services 22,658.6 25,171.6 30,600.1 36,295.6 7,099.3 7,363.0 7,735.8 8,402.0 8,882.0 8,960.8 9,153.5 9,299.3 8,877.3Other Services Industries 20,415.7 21,578.1 23,158.6 25,278.4 5,734.2 5,488.5 5,551.5 6,384.4 6,746.1 5,851.0 6,071.9 6,609.4 7,006.0Ownership <strong>of</strong> Dwellings 6,940.0 8,628.7 11,067.6 13,373.3 2,419.8 2,589.1 2,963.8 3,094.9 3,125.8 3,300.4 3,457.8 3,489.3 3,261.1Less: FISIM 2 9,076.4 10,811.8 13,068.0 16,730.1 3,085.1 3,234.9 3,361.7 3,386.3 3,859.1 3,997.8 4,121.2 4,752.0 4,770.3Gross Value Added At Basic Prices 190,364.4 209,893.1 235,099.4 242,156.1 54,735.0 56,681.6 59,846.6 63,836.2 61,358.6 59,330.8 60,608.0 60,858.7 55,778.9Add: Taxes on Products 10,948.9 11,249.7 16,510.7 15,262.4 3,624.5 4,047.0 4,524.1 4,315.1 3,821.1 3,961.2 4,029.7 3,450.4 3,124.2GDP AT CURRENT MARKET PRICES 8.6 9.9 13.8 2.3 10.9 13.2 15.7 15.1 11.7 4.2 0.4 -5.6 -9.6Goods Producing Industries 5.8 9.9 5.7 -6.2 5.8 2.7 6.6 7.7 6.9 -7.8 -10.6 -12.1 -16.0Manufacturing 6.5 10.6 3.6 -14.2 4.3 0.9 4.9 4.2 3.9 -16.8 -20.0 -21.8 -27.4Construction 5.3 5.1 21.7 43.4 14.0 16.7 21.0 33.5 31.2 51.6 51.8 39.7 41.0Utilities -3.1 9.3 6.2 -5.0 9.9 5.4 3.1 6.5 -3.5 2.5 -12.8 -6.0 -15.9Other Goods Industries 1 -0.9 11.3 -2.2 -1.4 -3.1 0.4 0.4 -6.3 2.7 -0.2 0.2 -8.2 -3.5Services Producing Industries 11.3 10.3 14.7 7.8 12.2 15.7 15.5 15.2 14.3 10.2 7.2 0.6 -4.4Wholesale & Retail <strong>Trade</strong> 23.4 16.5 9.9 2.1 8.1 9.4 8.1 13.6 4.1 5.3 4.4 -4.6 -13.5Transport & Storage 6.6 1.2 13.2 2.1 10.4 16.3 15.4 11.4 6.7 2.6 -1.0 0.3 -14.3Hotels & Restaurants 12.0 13.9 13.5 10.9 11.6 12.7 14.6 15.0 16.9 13.8 9.5 4.3 -8.6Information & Communications 6.8 7.7 7.6 5.4 5.9 8.0 8.2 8.0 9.0 4.4 2.9 5.5 3.2Financial Services 10.6 12.7 25.5 8.6 24.9 27.6 31.2 19.4 21.9 15.2 5.7 -5.8 0.9Business Services 9.7 11.1 21.6 18.6 17.8 20.3 22.2 25.5 25.1 21.7 18.3 10.7 -0.1Other Services Industries 3.1 5.7 7.3 9.2 3.6 11.7 7.1 7.4 17.6 6.6 9.4 3.5 3.9Ownership <strong>of</strong> Dwellings 3.0 24.3 28.3 20.8 28.2 21.6 30.2 32.5 29.2 27.5 16.7 12.7 4.3Less: FISIM 2 9.6 19.1 20.9 28.0 27.8 20.4 21.1 15.4 25.1 23.6 22.6 40.3 23.6Gross Value Added At Basic Prices 9.2 10.3 12.0 3.0 10.0 11.4 12.9 13.6 12.1 4.7 1.3 -4.7 -9.1Add: Taxes on Products -1.2 2.7 46.8 -7.6 27.3 45.6 71.0 44.9 5.4 -2.1 -10.9 -20.0 -18.21Comprise Agriculture, Fishing <strong>and</strong> Quarrying. Source: <strong>Singapore</strong> Department <strong>of</strong> Statistics2Refers to Financial Intermediation Services Indirectly Measured.Note: The industries are classified according to SSIC 2005.2007 2008Million DollarsPercentage Change Over Corresponding Period Of Previous Year2009
36GROSS DOMESTIC PRODUCT BY INDUSTRY - Cont'd [TABLE A1.1]2005 2006 2007 2008 I II III IV I II III IV IGDP AT 2000 MARKET PRICES 197,720.6 214,233.5 230,871.4 233,524.5 55,424.3 57,018.2 59,350.4 59,078.5 59,114.8 58,451.9 59,376.0 56,581.8 53,120.8Goods Producing Industries 60,945.3 67,442.7 72,293.0 71,556.3 16,899.8 17,493.0 19,262.7 18,637.5 18,927.8 17,143.9 18,065.4 17,419.2 15,342.9Manufacturing 50,592.0 56,623.4 59,987.4 57,510.5 13,952.1 14,574.8 16,145.2 15,315.3 15,703.1 13,765.8 14,370.8 13,670.8 11,603.0Construction 6,703.1 6,942.5 8,208.1 9,872.8 1,963.5 1,867.4 2,077.4 2,299.8 2,221.1 2,309.9 2,616.9 2,724.9 2,762.3Utilities 3,489.2 3,690.9 3,917.2 4,000.0 939.1 1,006.2 995.3 976.6 958.6 1,024.1 1,033.4 983.9 934.0Other Goods Industries 1 161.0 185.9 180.3 173.0 45.1 44.6 44.8 45.8 45.0 44.1 44.3 39.6 43.6Services Producing Industries 125,689.7 135,411.3 146,386.0 153,292.4 35,248.8 36,226.3 37,120.5 37,790.4 37,901.1 38,930.9 39,165.7 37,294.7 35,921.6Wholesale & Retail <strong>Trade</strong> 31,477.1 34,719.0 37,302.7 38,271.1 9,010.2 9,178.2 9,604.7 9,509.6 9,499.1 9,731.1 10,034.2 9,006.7 8,060.4Transport & Storage 18,566.8 19,703.2 20,695.9 21,334.4 4,945.6 5,147.6 5,277.2 5,325.5 5,215.6 5,447.6 5,475.9 5,195.3 4,692.9Hotels & Restaurants 3,524.1 3,785.9 3,970.9 4,019.8 965.6 965.9 999.0 1,040.4 995.7 985.7 998.8 1,039.6 947.2Information & Communications 8,445.1 8,999.3 9,587.1 10,274.4 2,355.3 2,390.9 2,411.2 2,429.7 2,522.6 2,592.5 2,597.8 2,561.5 2,568.9Financial Services 21,535.9 24,053.6 27,820.9 29,359.6 6,555.6 6,886.7 7,000.4 7,378.2 7,524.2 7,659.3 7,394.3 6,781.8 6,908.8Business Services 22,597.6 23,798.3 25,965.7 27,876.9 6,248.4 6,448.4 6,546.9 6,722.0 6,778.2 6,943.5 7,084.9 7,070.3 7,053.2Other Services Industries 19,543.1 20,352.0 21,042.8 22,156.2 5,168.1 5,208.6 5,281.1 5,385.0 5,365.7 5,571.2 5,579.8 5,639.5 5,690.2Ownership <strong>of</strong> Dwellings 7,838.3 7,980.1 8,069.4 8,120.8 2,007.8 2,018.7 2,023.2 2,019.7 2,021.0 2,029.2 2,033.9 2,036.7 2,032.5Less: FISIM 2 9,939.8 10,500.4 11,495.6 13,074.8 2,741.1 2,775.0 2,892.2 3,087.3 3,181.8 3,195.8 3,284.8 3,412.4 3,343.4Gross Value Added At Basic Prices 184,533.5 200,333.7 215,252.8 219,894.7 51,415.3 52,963.0 55,514.2 55,360.3 55,668.1 54,908.2 55,980.2 53,338.2 49,953.6Add: Taxes on Products 13,187.1 13,899.8 15,618.6 13,629.8 4,009.0 4,055.2 3,836.2 3,718.2 3,446.7 3,543.7 3,395.8 3,243.6 3,167.2GDP AT 2000 MARKET PRICES 7.3 8.4 7.8 1.1 7.6 8.6 9.5 5.5 6.7 2.5 0.0 -4.2 -10.1Goods Producing Industries 8.0 10.7 7.2 -1.0 7.2 8.4 11.9 1.7 12.0 -2.0 -6.2 -6.5 -18.9Manufacturing 9.5 11.9 5.9 -4.1 6.4 7.4 11.8 -1.2 12.6 -5.6 -11.0 -10.7 -26.1Construction 0.7 3.6 18.2 20.3 13.7 18.3 17.0 23.5 13.1 23.7 26.0 18.5 24.4Utilities 2.8 5.8 6.1 2.1 6.6 6.5 5.0 6.5 2.1 1.8 3.8 0.7 -2.6Other Goods Industries 1 -1.2 15.5 -3.0 -4.0 -0.9 1.1 -2.2 -9.3 -0.2 -1.1 -1.1 -13.5 -3.1Services Producing Industries 7.0 7.7 8.1 4.7 7.6 8.3 8.2 8.3 7.5 7.5 5.5 -1.3 -5.2Wholesale & Retail <strong>Trade</strong> 9.8 10.3 7.4 2.6 8.1 8.5 6.9 6.3 5.4 6.0 4.5 -5.3 -15.1Transport & Storage 5.8 6.1 5.0 3.1 4.3 5.5 4.9 5.5 5.5 5.8 3.8 -2.4 -10.0Hotels & Restaurants 7.6 7.4 4.9 1.2 5.2 4.8 5.9 3.7 3.1 2.0 0.0 -0.1 -4.9Information & Communications 5.3 6.6 6.5 7.2 6.7 6.8 6.9 5.7 7.1 8.4 7.7 5.4 1.8Financial Services 8.4 11.7 15.7 5.5 12.4 15.5 17.4 17.1 14.8 11.2 5.6 -8.1 -8.2Business Services 6.0 5.3 9.1 7.4 8.9 8.6 8.5 10.4 8.5 7.7 8.2 5.2 4.1Other Services Industries 4.3 4.1 3.4 5.3 3.6 2.7 3.6 3.7 3.8 7.0 5.7 4.7 6.0Ownership <strong>of</strong> Dwellings 2.7 1.8 1.1 0.6 0.9 1.6 1.3 0.7 0.7 0.5 0.5 0.8 0.6Less: FISIM 2 1.4 5.6 9.5 13.7 8.7 7.4 8.2 13.4 16.1 15.2 13.6 10.5 5.1Gross Value Added At Basic Prices 7.5 8.6 7.4 2.2 7.1 8.1 9.2 5.5 8.3 3.7 0.8 -3.7 -10.3Add: Taxes on Products 4.9 5.4 12.4 -12.7 13.6 15.7 14.2 6.0 -14.0 -12.6 -11.5 -12.8 -8.11Comprise Agriculture, Fishing <strong>and</strong> Quarrying. Source: <strong>Singapore</strong> Department <strong>of</strong> Statistics2Refers to Financial Intermediation Services Indirectly Measured.Note: The industries are classified according to SSIC 2005.2007 2008Million DollarsPercentage Change Over Corresponding Period Of Previous Year2009
GROSS DOMESTIC PRODUCT BY INDUSTRY AT 2000 PRICES, SEASONALLY ADJUSTED [TABLE A1.2]2006I II III IV I II III IV I II III IV IGDP AT 2000 MARKET PRICES 52,340.6 52,963.1 53,668.3 55,220.2 56,302.6 57,498.6 58,655.0 58,411.6 60,115.5 58,923.1 58,618.4 56,047.8 53,872.7Goods Producing Industries 16,410.9 16,520.8 16,868.1 17,574.7 17,596.4 17,950.1 18,803.1 17,929.8 19,693.8 17,624.4 17,589.5 16,827.9 15,873.4Manufacturing 13,757.2 13,886.7 14,137.3 14,777.7 14,654.2 14,947.2 15,728.8 14,649.3 16,481.5 14,132.8 13,944.1 13,133.9 12,157.0Construction 1,702.3 1,673.7 1,752.6 1,810.5 1,931.6 1,982.1 2,051.5 2,237.2 2,181.6 2,453.2 2,586.0 2,650.4 2,711.8Utilities 906.8 914.9 932.5 936.4 966.4 974.8 978.1 997.8 986.6 992.9 1,015.2 1,004.3 961.8Other Goods Industries 1 44.6 45.5 45.7 50.1 44.2 46.0 44.7 45.5 44.1 45.5 44.2 39.3 42.8Services Producing Industries 33,060.5 33,570.2 34,007.5 34,790.4 35,569.8 36,301.3 36,778.7 37,738.7 38,259.8 38,967.8 38,801.0 37,259.4 36,258.8Wholesale & Retail <strong>Trade</strong> 8,516.1 8,542.2 8,775.6 8,906.8 9,188.1 9,253.0 9,357.8 9,511.5 9,694.8 9,785.0 9,764.4 9,022.8 8,242.7Transport & Storage 4,874.9 4,863.5 4,936.9 5,027.3 5,083.7 5,126.2 5,181.0 5,302.9 5,361.7 5,421.7 5,377.3 5,175.1 4,824.3Hotels & Restaurants 924.0 940.8 948.8 971.4 972.7 985.2 1,004.7 1,007.2 1,003.6 1,005.4 1,004.4 1,005.8 955.4Information & Communications 2,179.8 2,218.3 2,265.8 2,334.7 2,330.8 2,369.5 2,420.4 2,466.1 2,500.5 2,568.7 2,605.8 2,599.6 2,548.0Financial Services 5,831.0 5,960.4 5,961.9 6,300.3 6,555.6 6,886.7 7,000.4 7,378.2 7,524.2 7,659.3 7,394.3 6,781.8 6,908.8Business Services 5,736.2 5,936.2 6,036.4 6,089.5 6,248.4 6,448.4 6,546.9 6,722.0 6,778.2 6,943.5 7,084.9 7,070.3 7,053.2Other Services Industries 4,998.5 5,108.8 5,082.1 5,160.4 5,190.5 5,232.3 5,267.5 5,350.8 5,396.8 5,584.2 5,569.9 5,604.0 5,726.4Ownership <strong>of</strong> Dwellings 1,989.8 1,987.8 1,997.1 2,005.4 2,007.8 2,018.7 2,023.2 2,019.7 2,021.0 2,029.2 2,033.9 2,036.7 2,032.5Less: FISIM 2 2,522.5 2,584.2 2,672.0 2,721.7 2,741.1 2,775.0 2,892.2 3,087.3 3,181.8 3,195.8 3,284.8 3,412.4 3,343.4Gross Value Added At Basic Prices 48,938.7 49,494.6 50,200.7 51,648.8 52,432.9 53,495.1 54,712.8 54,600.9 56,792.8 55,425.6 55,139.6 52,711.6 50,821.3Add: Taxes on Products 3,401.9 3,468.5 3,467.6 3,571.4 3,869.7 4,003.5 3,942.2 3,810.7 3,322.7 3,497.5 3,478.8 3,336.2 3,051.4GDP AT 2000 MARKET PRICES 6.5 4.8 5.4 12.1 8.1 8.8 8.3 -1.6 12.2 -7.7 -2.1 -16.4 -14.6Goods Producing Industries 3.8 2.7 8.7 17.8 0.5 8.3 20.4 -17.3 45.6 -35.9 -0.8 -16.2 -20.8Manufacturing 4.1 3.8 7.4 19.4 -3.3 8.2 22.6 -24.8 60.2 -45.9 -5.2 -21.3 -26.6Construction -1.1 -6.6 20.2 13.9 29.6 10.9 14.8 41.4 -9.6 59.9 23.5 10.3 9.6Utilities 7.7 3.6 7.9 1.7 13.4 3.5 1.4 8.3 -4.4 2.6 9.3 -4.2 -15.9Other Goods Industries 1 30.9 8.3 1.8 44.4 -39.4 17.3 -10.8 7.4 -11.8 13.3 -10.9 -37.5 40.7Services Producing Industries 8.9 6.3 5.3 9.5 9.3 8.5 5.4 10.9 5.6 7.6 -1.7 -15.0 -10.3Wholesale & Retail <strong>Trade</strong> 13.7 1.2 11.4 6.1 13.2 2.9 4.6 6.7 7.9 3.8 -0.8 -27.1 -30.4Transport & Storage 10.7 -0.9 6.2 7.5 4.6 3.4 4.3 9.7 4.5 4.6 -3.2 -14.2 -24.5Hotels & Restaurants 14.2 7.5 3.4 9.9 0.5 5.2 8.2 1.0 -1.4 0.7 -0.4 0.6 -18.6Information & Communications 2.7 7.3 8.8 12.7 -0.7 6.8 8.9 7.8 5.7 11.4 5.9 -0.9 -7.7Financial Services 21.7 9.2 0.1 24.7 17.2 21.8 6.8 23.4 8.2 7.4 -13.1 -29.2 7.7Business Services -3.7 14.7 6.9 3.6 10.9 13.4 6.3 11.1 3.4 10.1 8.4 -0.8 -1.0Other Services Industries 3.0 9.1 -2.1 6.3 2.4 3.3 2.7 6.5 3.5 14.6 -1.0 2.5 9.0Ownership <strong>of</strong> Dwellings 2.4 -0.4 1.9 1.7 0.5 2.2 0.9 -0.7 0.3 1.6 0.9 0.6 -0.8Less: FISIM 2 0.3 10.1 14.3 7.7 2.9 5.0 18.0 29.8 12.8 1.8 11.6 16.5 -7.8Gross Value Added At Basic Prices 7.3 4.6 5.8 12.0 6.2 8.4 9.4 -0.8 17.1 -9.3 -2.0 -16.5 -13.6Add: Taxes on Products -5.0 8.1 -0.1 12.5 37.8 14.6 -6.0 -12.7 -42.2 22.8 -2.1 -15.4 -30.01 Comprise Agriculture, Fishing <strong>and</strong> Quarrying. Source: <strong>Singapore</strong> Department <strong>of</strong> Statistics2007Million DollarsAnnualised Percentage Change Over Preceding Quarter20082009372 Refers to Financial Intermediation Services Indirectly Measured.Note: The industries are classified according to SSIC 2005.
38PERCENTAGE CONTRIBUTION TO GROWTH IN REAL GDP [TABLE A1.3]2007 200820092005 2006 2007 2008 I II III IV I II III IV IPer CentGDP AT 2000 MARKET PRICES 7.3 8.4 7.8 1.1 7.6 8.6 9.5 5.5 6.7 2.5 0.0 -4.2 -10.1Goods Producing Industries 2.5 3.3 2.3 -0.3 2.2 2.6 3.8 0.5 3.7 -0.6 -2.0 -2.1 -6.1Manufacturing 2.4 3.1 1.6 -1.1 1.6 1.9 3.1 -0.3 3.2 -1.4 -3.0 -2.8 -6.9Construction 0.0 0.1 0.6 0.7 0.5 0.6 0.6 0.8 0.5 0.8 0.9 0.7 0.9Utilities 0.1 0.1 0.1 0.0 0.1 0.1 0.1 0.1 0.0 0.0 0.1 0.0 0.0Other Goods Industries 1 0.0 0.0 0.0 0.0 0.0 0.0 0.0 0.0 0.0 0.0 0.0 0.0 0.0Services Producing Industries 4.5 4.9 5.1 3.0 4.8 5.3 5.2 5.2 4.8 4.7 3.4 -0.8 -3.3Wholesale & Retail <strong>Trade</strong> 1.5 1.6 1.2 0.4 1.3 1.4 1.1 1.0 0.9 1.0 0.7 -0.9 -2.4Transport & Storage 0.5 0.6 0.5 0.3 0.4 0.5 0.5 0.5 0.5 0.5 0.3 -0.2 -0.9Hotels & Restaurants 0.1 0.1 0.1 0.0 0.1 0.1 0.1 0.1 0.1 0.0 0.0 0.0 -0.1Information & Communications 0.2 0.3 0.3 0.3 0.3 0.3 0.3 0.2 0.3 0.4 0.3 0.2 0.1Financial Services 0.9 1.3 1.8 0.7 1.4 1.8 1.9 1.9 1.7 1.4 0.7 -1.0 -1.0Business Services 0.7 0.6 1.0 0.8 1.0 1.0 0.9 1.1 1.0 0.9 0.9 0.6 0.5Other Services Industries 0.4 0.4 0.3 0.5 0.3 0.3 0.3 0.3 0.4 0.6 0.5 0.4 0.5Ownership <strong>of</strong> Dwellings 0.1 0.1 0.0 0.0 0.0 0.1 0.0 0.0 0.0 0.0 0.0 0.0 0.0Less: FISIM 2 0.1 0.3 0.5 0.7 0.4 0.4 0.4 0.7 0.8 0.7 0.7 0.6 0.3Add: Taxes on Products 0.3 0.4 0.8 -0.9 0.9 1.0 0.9 0.4 -1.0 -0.9 -0.7 -0.8 -0.51Comprise Agriculture, Fishing <strong>and</strong> Quarrying. Source: <strong>Singapore</strong> Department <strong>of</strong> Statistics2Refers to Financial Intermediation Services Indirectly Measured.Note: The industries are classified according to SSIC 2005.
GROSS DOMESTIC PRODUCT DEFLATORS BY INDUSTRY [TABLE A1.4]2005 2006 2007 2008 I II III IV I II III IV IGDP AT MARKET PRICES 101.8 103.2 109.0 110.2 105.3 106.5 108.5 115.4 110.3 108.3 108.9 113.7 110.9Goods Producing Industries 101.6 100.9 99.5 94.2 99.4 99.9 97.0 101.7 94.9 94.0 92.5 95.6 98.3Manufacturing 101.1 99.9 97.6 87.4 97.4 99.3 94.9 99.1 90.0 87.4 85.3 86.8 88.4Construction 107.8 109.4 112.6 134.3 109.1 108.0 113.3 118.7 126.5 132.3 136.6 140.0 143.4Utilities 96.9 100.1 100.2 93.2 108.0 94.4 97.3 101.7 102.0 95.0 81.7 94.9 88.0Other Goods Industries 1 103.0 99.3 100.1 102.8 98.7 100.9 100.2 100.7 101.6 101.8 101.6 106.8 101.1Services Producing Industries 103.9 106.4 112.8 116.2 109.5 110.0 111.9 119.6 116.4 112.8 113.8 121.9 117.5Wholesale & Retail <strong>Trade</strong> 107.8 113.9 116.5 115.9 108.6 115.3 115.9 125.6 107.3 114.5 115.8 126.5 109.4Transport & Storage 107.3 102.4 110.4 109.3 111.7 105.4 106.9 117.4 113.0 102.2 102.1 120.6 107.6Hotels & Restaurants 107.5 114.0 123.4 135.2 118.6 122.0 124.7 128.0 134.5 136.1 136.6 133.6 129.2Information & Communications 93.3 94.2 95.1 93.6 91.9 94.4 97.4 96.8 93.5 90.8 93.0 96.9 94.8Financial Services 102.1 103.1 111.8 115.1 109.1 109.7 112.8 115.5 115.9 113.6 112.8 118.4 127.3Business Services 100.3 105.8 117.8 130.2 113.6 114.2 118.2 125.0 131.0 129.1 129.2 131.5 125.9Other Services Industries 104.5 106.0 110.1 114.1 111.0 105.4 105.1 118.6 125.7 105.0 108.8 117.2 123.1Ownership <strong>of</strong> Dwellings 88.5 108.1 137.2 164.7 120.5 128.3 146.5 153.2 154.7 162.6 170.0 171.3 160.4Less: FISIM 2 91.3 103.0 113.7 128.0 112.5 116.6 116.2 109.7 121.3 125.1 125.5 139.3 142.7Gross Value Added At Basic Prices 103.2 104.8 109.2 110.1 106.5 107.0 107.8 115.3 110.2 108.1 108.3 114.1 111.7Add: Taxes on Products 83.0 80.9 105.7 112.0 90.4 99.8 117.9 116.1 110.9 111.8 118.7 106.4 98.6GDP AT MARKET PRICES 1.2 1.4 5.6 1.1 3.1 4.2 5.6 9.1 4.7 1.7 0.4 -1.5 0.6Goods Producing Industries -2.1 -0.7 -1.4 -5.3 -1.4 -5.3 -4.7 5.9 -4.5 -6.0 -4.6 -6.0 3.6Manufacturing -2.7 -1.2 -2.2 -10.5 -2.0 -6.1 -6.1 5.4 -7.7 -11.9 -10.2 -12.4 -1.7Construction 4.5 1.5 2.9 19.2 0.2 -1.3 3.5 8.1 16.0 22.6 20.5 17.9 13.4Utilities -5.7 3.3 0.1 -7.0 3.2 -1.0 -1.8 0.0 -5.5 0.7 -16.0 -6.7 -13.7Other Goods Industries 1 0.3 -3.6 0.8 2.7 -2.2 -0.7 2.7 3.3 2.9 0.9 1.4 6.1 -0.4Services Producing Industries 4.0 2.4 6.1 2.9 4.2 6.9 6.7 6.3 6.3 2.6 1.6 2.0 0.9Wholesale & Retail <strong>Trade</strong> 12.4 5.6 2.3 -0.5 0.0 0.8 1.1 6.9 -1.2 -0.7 -0.1 0.7 2.0Transport & Storage 0.8 -4.6 7.8 -1.0 5.8 10.3 10.0 5.7 1.2 -3.1 -4.6 2.8 -4.8Hotels & Restaurants 4.1 6.0 8.2 9.5 6.0 7.6 8.3 10.9 13.4 11.5 9.6 4.4 -4.0Information & Communications 1.4 1.0 1.0 -1.7 -0.7 1.1 1.2 2.2 1.8 -3.7 -4.5 0.1 1.3Financial Services 2.0 0.9 8.5 2.9 11.1 10.5 11.7 2.0 6.2 3.6 0.0 2.5 9.9Business Services 3.5 5.5 11.4 10.5 8.2 10.7 12.7 13.7 15.3 13.0 9.3 5.2 -3.9Other Services Industries -1.1 1.5 3.8 3.7 0.0 8.7 3.4 3.6 13.3 -0.3 3.5 -1.1 -2.1Ownership <strong>of</strong> Dwellings 0.3 22.1 26.8 20.1 27.0 19.7 28.5 31.6 28.3 26.8 16.1 11.8 3.7Less: FISIM 2 8.2 12.8 10.4 12.6 17.6 12.1 11.8 1.7 7.8 7.3 7.9 27.0 17.6Gross Value Added At Basic Prices 1.6 1.6 4.2 0.8 2.6 3.0 3.4 7.7 3.5 1.0 0.4 -1.1 1.3Add: Taxes on Products -5.8 -2.5 30.6 5.9 12.0 25.9 49.7 36.7 22.6 12.0 0.6 -8.3 -11.01 Comprise Agriculture, Fishing <strong>and</strong> Quarrying. Source: <strong>Singapore</strong> Department <strong>of</strong> Statistics2 Refers to Financial Intermediation Services Indirectly Measured.2007 20082000=100Percentage Change Over Corresponding Period Of Previous Year200939Note: The industries are classified according to SSIC 2005.
40EXPENDITURE ON GROSS DOMESTIC PRODUCT AT 2000 MARKET PRICES [TABLE A1.5]2007200820092005 2006 2007 2008 I II III IV I II III IV IMillion DollarsTOTAL 197,720.6 214,233.5 230,871.4 233,524.5 55,424.3 57,018.2 59,350.4 59,078.5 59,114.8 58,451.9 59,376.0 56,581.8 53,120.8Private Consumption Expenditure 81,665.9 84,944.5 89,334.1 91,516.0 21,726.4 22,415.1 22,215.2 22,977.4 22,608.9 23,397.0 22,812.6 22,697.5 21,447.0Government Consumption Expenditure 20,809.6 22,175.9 22,660.7 24,500.0 7,700.1 4,156.8 5,062.7 5,741.1 8,504.1 4,532.6 5,564.8 5,898.5 8,314.7Gross Fixed Capital Formation 43,497.8 49,276.2 58,729.6 66,754.1 13,520.7 14,028.4 14,050.7 17,129.8 17,643.5 17,534.6 16,146.0 15,430.0 15,030.3Changes in Inventories -2,862.3 -3,593.6 -7,430.0 6,476.1 -4,908.0 -184.0 -3,224.9 886.9 -2,289.9 2,008.0 622.9 6,135.1 430.1Net Exports <strong>of</strong> Goods & Services 58,209.3 64,345.2 71,989.6 47,624.3 18,492.0 17,549.4 22,410.4 13,537.8 13,841.9 11,583.8 15,221.2 6,977.4 7,031.6Exports <strong>of</strong> Goods & Services 492,676.9 550,456.1 598,321.1 605,974.8 143,837.3 145,337.7 154,909.2 154,236.9 155,289.1 153,069.0 158,125.9 139,490.8 122,402.1Less: Imports <strong>of</strong> Goods & Services 434,467.6 486,110.9 526,331.5 558,350.5 125,345.3 127,788.3 132,498.8 140,699.1 141,447.2 141,485.2 142,904.7 132,513.4 115,370.5Statistical Discrepancy -3,599.7 -2,914.7 -4,412.6 -3,346.0 -1,106.9 -947.5 -1,163.7 -1,194.5 -1,193.7 -604.1 -991.5 -556.7 867.1Percentage Change Over Corresponding Period Of Previous YearTOTAL 7.3 8.4 7.8 1.1 7.6 8.6 9.5 5.5 6.7 2.5 0.0 -4.2 -10.1Private Consumption Expenditure 3.8 4.0 5.2 2.4 2.7 5.8 6.3 5.8 4.1 4.4 2.7 -1.2 -5.1Government Consumption Expenditure 6.7 6.6 2.2 8.1 -1.6 3.4 -0.6 9.5 10.4 9.0 9.9 2.7 -2.2Gross Fixed Capital Formation -0.1 13.3 19.2 13.7 19.7 25.7 15.4 17.0 30.5 25.0 14.9 -9.9 -14.8Changes in Inventories na na na na na na na na na na na na naNet Exports <strong>of</strong> Goods & Services na na na na na na na na na na na na naExports <strong>of</strong> Goods & Services 12.3 11.7 8.7 1.3 9.2 7.6 9.6 8.4 8.0 5.3 2.1 -9.6 -21.2Less: Imports <strong>of</strong> Goods & Services 11.2 11.9 8.3 6.1 7.7 7.2 6.8 11.2 12.8 10.7 7.9 -5.8 -18.4Statistical Discrepancy na na na na na na na na na na na na naSource: <strong>Singapore</strong> Department <strong>of</strong> Statistics
CHANGES AND CONTRIBUTION TO GROWTH IN TOTAL DEMAND AT 2000 MARKET PRICES [TABLE A1.6]2007200820092005 2006 2007 2008 I II III IV I II III IV IPercentage Change Over Same Period <strong>of</strong> Previous Year 1TOTAL DEMAND 10.1 10.6 8.3 4.4 7.7 7.6 7.8 10.0 10.9 8.0 5.3 -5.6 -16.9Total Domestic Dem<strong>and</strong> 3.3 6.8 6.9 15.9 2.4 7.5 0.9 16.0 22.2 17.5 18.5 7.3 -2.7Final Domestic Dem<strong>and</strong> 3.0 7.1 9.2 7.1 6.7 11.6 8.3 10.2 13.5 12.0 7.7 -4.0 -8.1Consumption Expenditure 4.4 4.5 4.6 3.6 1.6 5.4 5.0 6.5 5.7 5.1 4.0 -0.4 -4.3Public 6.7 6.6 2.2 8.1 -1.6 3.4 -0.6 9.5 10.4 9.0 9.9 2.7 -2.2Private 3.8 4.0 5.2 2.4 2.7 5.8 6.3 5.8 4.1 4.4 2.7 -1.2 -5.1Gross Fixed Capital Formation -0.1 13.3 19.2 13.7 19.7 25.7 15.4 17.0 30.5 25.0 14.9 -9.9 -14.8Public -2.5 -12.2 -4.5 13.3 -8.5 -3.3 -5.1 0.6 1.5 20.0 18.5 17.8 11.5Private 0.3 18.6 22.8 13.7 26.4 29.5 18.3 19.0 35.4 25.5 14.5 -12.8 -18.2Changes in Inventories 0.2 -0.4 -1.8 6.0 -3.5 -2.7 -5.2 3.9 4.7 3.8 6.5 8.9 4.6External Dem<strong>and</strong> 12.3 11.7 8.7 1.3 9.2 7.6 9.6 8.4 8.0 5.3 2.1 -9.6 -21.2Percentage Contribution To GrowthTOTAL DEMAND 10.1 10.6 8.3 4.4 7.7 7.6 7.8 10.0 10.9 8.0 5.3 -5.6 -16.9Total Domestic Dem<strong>and</strong> 0.8 1.5 1.5 3.4 0.5 1.6 0.2 3.5 4.6 3.8 3.6 1.7 -0.6Final Domestic Dem<strong>and</strong> 0.7 1.6 2.0 1.6 1.6 2.4 1.8 2.3 3.2 2.6 1.7 -0.9 -2.0Consumption Expenditure 0.7 0.7 0.7 0.5 0.3 0.8 0.7 1.0 0.9 0.7 0.6 -0.1 -0.7Public 0.2 0.2 0.1 0.2 -0.1 0.1 0.0 0.3 0.4 0.2 0.3 0.1 -0.1Private 0.5 0.5 0.6 0.3 0.3 0.7 0.7 0.7 0.5 0.5 0.3 -0.1 -0.6Gross Fixed Capital Formation 0.0 0.9 1.3 1.1 1.3 1.7 1.0 1.4 2.3 1.9 1.1 -0.8 -1.3Public 0.0 -0.1 0.0 0.1 -0.1 0.0 0.0 0.0 0.0 0.1 0.1 0.1 0.1Private 0.0 1.1 1.4 0.9 1.4 1.7 1.1 1.4 2.3 1.8 0.9 -1.0 -1.4Changes in Inventories 0.1 -0.1 -0.5 1.8 -1.1 -0.8 -1.6 1.2 1.4 1.2 2.0 2.6 1.3External Dem<strong>and</strong> 9.3 9.1 6.8 1.0 7.2 5.9 7.6 6.5 6.3 4.2 1.7 -7.3 -16.31 For inventories, this refers instead to change as a percentage <strong>of</strong> GDP in the previous year. Source: <strong>Singapore</strong> Department <strong>of</strong> Statistics41
42GROSS FIXED CAPITAL FORMATION AT 2000 MARKET PRICES [TABLE A1.7]2007200820092005 2006 2007 2008 I II III IV I II III IV IMillion DollarsTOTAL 43,497.8 49,276.2 58,729.6 66,754.1 13,520.7 14,028.4 14,050.7 17,129.8 17,643.5 17,534.6 16,146.0 15,430.0 15,030.3Construction & Works 17,639.8 19,125.1 24,057.1 27,070.8 5,589.2 5,661.0 6,137.8 6,669.1 6,218.2 6,462.2 7,040.1 7,350.3 6,982.0Residential Buildings 7,232.7 7,605.5 9,350.1 10,387.1 2,136.0 2,394.8 2,365.3 2,454.0 2,337.0 2,605.4 2,701.8 2,742.9 2,474.0Non-Residential Buildings 7,090.8 8,305.6 11,655.5 12,747.3 2,669.0 2,629.7 2,997.5 3,359.3 2,994.2 2,865.9 3,337.1 3,550.1 3,297.1Other Construction & Works 3,316.3 3,214.0 3,051.5 3,936.4 784.2 636.5 775.0 855.8 887.0 990.9 1,001.2 1,057.3 1,210.9Transport Equipment 5,488.4 7,522.9 9,820.6 14,628.0 2,138.5 2,591.1 1,838.8 3,252.2 5,231.0 4,732.7 2,542.6 2,121.7 3,325.2Machinery, Equipment & S<strong>of</strong>tware 20,369.6 22,628.2 24,851.9 25,055.3 5,793.0 5,776.3 6,074.1 7,208.5 6,194.3 6,339.7 6,563.3 5,958.0 4,723.1Percentage Change Over Corresponding Period Of Previous YearTOTAL -0.1 13.3 19.2 13.7 19.7 25.7 15.4 17.0 30.5 25.0 14.9 -9.9 -14.8Construction & Works 0.3 8.4 25.8 12.5 22.9 25.4 23.0 31.4 11.3 14.2 14.7 10.2 12.3Residential Buildings -6.2 5.2 22.9 11.1 25.2 25.9 19.1 22.0 9.4 8.8 14.2 11.8 5.9Non-Residential Buildings 1.6 17.1 40.3 9.4 34.4 37.9 40.0 47.8 12.2 9.0 11.3 5.7 10.1Other Construction & Works 14.1 -3.1 -5.1 29.0 -8.5 -9.7 -10.1 8.3 13.1 55.7 29.2 23.5 36.5Transport Equipment -7.0 37.1 30.5 49.0 36.0 112.6 26.6 -0.8 144.6 82.7 38.3 -34.8 -36.4Machinery, Equipment & S<strong>of</strong>tware 1.5 11.1 9.8 0.8 12.0 6.4 5.8 14.6 6.9 9.8 8.1 -17.3 -23.8Source: <strong>Singapore</strong> Department <strong>of</strong> Statistics
CHANGES IN EMPLOYMENT BY SECTOR [TABLE A2.1]2005 2006 2007 2008 I II III IV I II III IV IpCompared To The Previous PeriodTOTAL 113,300 176,000 234,900 221,600 49,400 64,400 58,600 62,500 73,200 71,400 55,700 21,300 -1,000Goods Producing Industries 39,500 63,300 91,800 85,200 15,700 27,600 24,500 24,000 26,700 33,100 21,400 3,900 -11,300Manufacturing 29,100 41,600 49,300 19,500 10,100 15,900 12,400 10,900 11,800 10,100 4,600 -7,000 -19,900Construction 8,700 20,500 40,400 64,000 5,400 10,900 11,300 12,700 14,500 22,400 16,500 10,700 8,500Others 1,700 1,100 2,100 1,600 300 700 700 400 500 500 400 200 100Services Producing Industries 73,800 112,700 143,100 136,400 33,700 36,800 34,100 38,500 46,500 38,300 34,300 17,300 10,300Wholesale & Retail <strong>Trade</strong> 12,600 18,500 19,900 16,400 4,900 3,900 4,600 6,500 4,500 4,700 3,300 4,000 -500Transport & Storage 6,400 6,000 5,000 13,700 -300 3,000 -2,100 4,400 5,700 4,700 3,700 -400 -1,700Hotels & Restaurants 5,700 12,600 16,300 16,900 1,800 4,600 2,500 7,400 3,400 2,800 4,200 6,400 -1,000Information & Communications 3,700 6,500 6,300 5,700 1,200 2,100 2,000 900 1,700 1,400 2,000 600 800Financial Services 7,700 11,300 21,900 11,500 5,100 4,400 9,700 2,700 3,200 4,600 3,400 300 -2,200Business Services 20,200 34,100 41,600 36,100 10,000 11,700 10,000 9,900 13,200 12,900 8,600 1,400 3,700Other Services Industries 17,500 23,700 32,100 36,100 10,900 7,200 7,400 6,700 14,800 7,100 9,200 5,100 11,200Notes: 1 The industries are classified according to SSIC 2005.Source: Manpower Research & Statistics Department,2 Others comprise Agriculture, Fishing, Quarrying, Utilities, Sewerage <strong>and</strong> Waste Management. <strong>Ministry</strong> <strong>of</strong> Manpower3 Business Services comprise Real Estate & Leasing, Pr<strong>of</strong>essional Services <strong>and</strong> Administrative & Support Services.4 Data in the table may not necessarily add up to the total due to rounding.p - Preliminary20072008Number200943
44LABOUR PRODUCTIVITY BY INDUSTRY 1 [TABLE A2.2]2007 20082005 2006 2007 2008 I II III IV I II III IV IPercentage Change Over Corresponding Period Of Previous YearTOTAL 2 2.8 1.6 -0.8 -7.8 -0.3 0.3 0.4 -3.6 -2.9 -7.1 -9.0 -11.9 -15.4Total 2 (excluding construction) 2.6 1.8 -0.8 -7.3 -0.4 0.2 0.6 -3.6 -2.3 -6.7 -8.6 -11.5 -15.3Goods Producing Industries 3.5 3.1 -2.7 -11.7 -1.4 -1.1 1.1 -8.8 -0.2 -13.4 -16.6 -15.5 -24.0Manufacturing 2.9 3.9 -3.1 -10.9 -2.1 -1.7 1.9 -9.9 2.7 -13.3 -17.0 -14.7 -25.9Construction -0.1 -2.6 5.7 -0.6 4.4 7.1 3.9 7.2 -3.7 1.8 2.5 -3.0 3.8Services Producing Industries 2.5 1.4 0.1 -3.6 0.1 0.6 0.0 -0.1 -1.1 -1.5 -3.0 -8.6 -10.5Wholesale & Retail <strong>Trade</strong> 6.0 5.6 1.5 -2.4 2.1 2.6 0.9 0.6 0.2 0.5 -0.6 -9.4 -17.9Transport & Storage 2.4 2.5 2.5 -4.0 1.4 2.5 2.8 3.1 0.5 -1.0 -5.0 -10.1 -14.0Hotels & Restaurants 4.0 0.4 -6.0 -9.0 -4.3 -5.9 -6.2 -7.4 -7.5 -8.5 -9.8 -10.0 -12.4Information & Communications 2.1 -1.9 -3.0 -0.8 -2.8 -2.7 -3.2 -3.3 -1.7 0.6 -0.1 -1.9 -4.4Financial Services 1.2 3.2 1.1 -6.2 0.8 2.8 1.2 -0.3 -0.9 -3.6 -4.9 -15.1 -12.6Business Services -1.7 -4.6 -3.8 -5.7 -3.8 -3.7 -4.4 -3.3 -5.3 -6.3 -5.1 -6.1 -4.0Other Services Industries 0.9 -1.2 -2.1 -1.3 -1.6 -2.5 -2.0 -2.3 -2.6 0.1 -1.1 -1.8 0.21 Based on Gross Value Added At 2000 Basic Prices Source: <strong>Singapore</strong> Department <strong>of</strong> Statistics <strong>and</strong>2 Based on GDP At 2000 Market Prices Manpower Research & Statistics Department,Note: The industries are classified according to SSIC 2005. <strong>Ministry</strong> <strong>of</strong> Manpower2009
INDICES OF UNIT BUSINESS COST AND UNIT LABOUR COST [TABLE A2.3]2007 200820092005 2006 2007 2008 I II III IV I II III IV I2000=100UNIT LABOUR COST INDEX OFOVERALL ECONOMYUNIT BUSINESS COST INDEX OFMANUFACTURING96.5 97.8 102.9 112.8 108.6 96.5 95.1 111.3 117.9 104.0 104.9 124.2 128.797.9 97.9 100.4 109.8 103.5 97.0 95.7 105.3 106.4 108.0 107.4 117.3 118.7Unit Labour Cost 92.3 89.0 92.4 102.2 101.6 86.5 82.3 99.3 97.3 98.9 98.0 114.6 126.5Services Cost 102.6 105.3 106.8 116.0 105.1 105.4 106.5 110.1 113.8 115.4 115.0 119.8 113.2Government Rates & Fees 96.2 97.9 105.7 111.0 101.2 105.1 106.6 109.8 111.7 114.0 111.1 107.2 81.0Percentage Change Over Corresponding Period Of Previous YearUNIT LABOUR COST INDEX OFOVERALL ECONOMY0.9 1.3 5.2 9.6 3.9 5.4 4.2 7.1 8.6 7.8 10.3 11.7 9.2UNIT BUSINESS COST INDEX OFMANUFACTURING0.4 0.0 2.5 9.4 1.1 1.7 1.2 5.9 2.8 11.4 12.2 11.5 11.6Unit Labour Cost -1.7 -3.6 3.9 10.5 2.3 2.4 -0.4 11.1 -4.3 14.3 19.1 15.4 30.0Services Cost 2.0 2.7 1.4 8.6 0.1 1.0 2.0 2.3 8.2 9.5 8.0 8.9 -0.5Government Rates & Fees 1.2 1.7 7.9 5.0 4.5 8.0 9.0 10.3 10.3 8.5 4.3 -2.4 -27.5Note: The weights are based on the 2000 input structure <strong>and</strong> are used in the compilation <strong>of</strong> the indices from 2000 onwards.Source: <strong>Singapore</strong> Department <strong>of</strong> Statistics45
46CONSUMER PRICE INDEX [TABLE A3.1]2007 2008Weights 1 2005 2006 2007 2008 I II III IV I II III IV I2004=100ALL ITEMS 10,000 100.4 101.4 103.5 110.3 101.6 102.2 104.3 106.1 108.4 109.8 111.1 111.8 110.7Food 2,338 101.3 102.8 105.9 114.1 104.4 104.1 106.4 108.5 111.4 113.4 115.3 116.2 117.0Non-Cooked Food 1,029 101.9 103.9 107.9 118.5 106.5 105.7 108.4 111.1 114.9 117.3 120.3 121.4 122.4Cooked Food 1,309 100.7 102.0 104.2 110.6 102.7 102.9 104.9 106.4 108.6 110.4 111.5 112.0 112.7Clothing & Footwear 357 99.9 100.6 101.3 102.8 100.9 100.3 101.7 102.1 103.2 101.5 103.4 103.2 103.4Housing 2,126 100.8 103.5 103.9 117.1 102.3 101.7 104.6 107.1 111.9 114.5 118.5 123.7 119.2Transport & Communications 2,176 97.8 96.4 98.3 101.6 95.0 97.5 99.4 101.4 102.1 103.4 102.1 98.8 96.9Transport 1,672 97.5 95.9 98.2 102.5 94.2 97.3 99.4 102.1 103.0 104.7 103.1 99.1 96.0Communications 504 98.8 97.8 98.6 98.7 97.8 98.1 99.4 99.2 99.1 99.0 98.9 97.8 99.7Education & Stationery 819 102.0 104.0 105.3 108.9 104.9 103.9 106.0 106.3 108.9 108.9 109.1 108.6 108.6Health Care 525 100.4 101.3 105.5 111.5 102.4 104.3 107.3 108.0 109.9 110.8 112.4 112.8 114.0Recreation & Others 1,659 101.7 102.4 105.6 109.5 103.9 104.9 105.9 107.8 108.2 109.3 109.7 110.8 110.4Percentage Change Over Corresponding Period Of Previous YearALL ITEMS 10,000 0.5 1.0 2.1 6.5 0.5 1.0 2.7 4.1 6.6 7.5 6.6 5.4 2.1Food 2,338 1.3 1.6 2.9 7.8 2.0 1.4 3.3 5.0 6.7 8.9 8.4 7.1 5.0Non-Cooked Food 1,029 2.0 1.9 3.9 9.8 2.9 2.0 4.2 6.4 7.9 11.0 11.0 9.3 6.6Cooked Food 1,309 0.7 1.3 2.2 6.1 1.3 1.0 2.6 3.9 5.8 7.2 6.2 5.3 3.7Clothing & Footwear 357 0.0 0.7 0.6 1.5 0.2 0.2 1.0 1.1 2.3 1.2 1.6 1.0 0.2Housing 2,126 0.8 2.7 0.4 12.7 -0.3 -1.4 0.7 2.7 9.3 12.5 13.3 15.5 6.6Transport & Communications 2,176 -2.2 -1.5 2.0 3.3 -1.3 1.1 2.9 5.4 7.5 6.0 2.8 -2.6 -5.1Transport 1,672 -2.5 -1.6 2.4 4.3 -1.5 1.3 3.2 6.6 9.4 7.6 3.7 -3.0 -6.8Communications 504 -1.1 -1.0 0.8 0.1 -0.7 0.4 1.7 1.7 1.4 0.9 -0.5 -1.4 0.6Education & Stationery 819 2.0 1.9 1.3 3.4 1.1 0.2 1.8 1.8 3.7 4.8 2.9 2.2 -0.2Health Care 525 0.4 0.9 4.1 5.6 1.4 3.0 5.9 6.2 7.3 6.2 4.7 4.4 3.8Recreation & Others 1,659 1.7 0.7 3.2 3.7 1.2 3.1 4.4 4.1 4.2 4.2 3.6 2.8 2.01Derived by relating expenditure on the item to the total monthly household expenditure. Source: <strong>Singapore</strong> Department <strong>of</strong> StatisticsThe expenditure values were obtained from the 2002/03 Household Expenditure <strong>Survey</strong><strong>and</strong> updated to 2004's price level.2009
PRICE INDICES [TABLE A3.2]2007 200820092005 2006 2007 2008 I II III IV I II III IV I2006=100Domestic Supply Price Index 95.2 100.0 100.3 107.8 95.5 99.4 101.4 104.7 106.6 114.4 117.0 93.4 87.8<strong>Singapore</strong> Manufactured Products Price Index 97.7 100.0 98.4 101.8 95.2 98.5 98.9 101.1 101.6 108.0 107.9 89.8 85.0Import Price Index 97.2 100.0 98.1 101.1 95.8 97.7 98.9 100.1 100.3 103.8 106.3 94.0 91.3Export Price Index 98.0 100.0 96.3 97.6 95.3 96.3 96.6 97.1 96.7 100.2 101.6 91.8 88.0Percentage Change Over Corresponding Period Of Previous YearDomestic Supply Price Index 9.6 5.0 0.3 7.5 -4.0 -2.3 -0.9 8.6 11.6 15.0 15.3 -10.8 -17.7<strong>Singapore</strong> Manufactured Products Price Index 5.7 2.4 -1.6 3.4 -5.2 -3.0 -2.7 4.9 6.7 9.6 9.1 -11.2 -16.3Import Price Index 5.2 2.9 -1.9 3.0 -4.5 -3.5 -2.3 2.9 4.7 6.2 7.5 -6.1 -8.9Export Price Index 2.1 2.1 -3.7 1.3 -6.5 -4.6 -3.9 0.5 1.4 4.0 5.2 -5.4 -9.0Source: <strong>Singapore</strong> Department <strong>of</strong> Statistics47
48DOMESTIC SUPPLY PRICE INDEX [TABLE A3.3]2007 2008Weights 1 2005 2006 2007 2008 I II III IV I II III IV I2006=100ALL ITEMS 10,000 95.2 100.0 100.3 107.8 95.5 99.4 101.4 104.7 106.6 114.4 117.0 93.4 87.8Food 308 99.5 100.0 106.5 117.4 101.5 104.5 109.1 111.0 113.9 115.3 120.0 120.3 117.7Beverages & Tobacco 54 99.8 100.0 98.6 98.6 98.3 98.9 99.3 98.1 98.3 98.5 98.5 99.2 100.5Crude Materials 43 87.2 100.0 123.8 133.3 117.6 125.7 126.1 125.8 127.1 138.0 145.9 122.3 112.5Mineral Fuels 2,855 86.4 100.0 105.6 133.6 87.7 101.6 109.0 124.3 131.3 158.5 160.8 83.6 68.1Animal & Vegetable Oils 27 99.1 100.0 110.5 135.4 104.9 107.9 112.6 116.8 127.8 143.9 140.3 129.4 106.4Chemicals & Chemical Products 1,373 94.3 100.0 102.7 106.2 101.1 102.3 103.6 103.7 104.7 107.5 115.4 97.4 89.0Manufactured Goods 807 96.4 100.0 107.7 115.3 104.6 108.9 109.4 107.9 110.2 114.6 119.8 116.7 107.0Machinery & Equipment 3,786 102.7 100.0 93.1 87.9 95.6 94.1 92.7 90.0 88.2 86.4 87.0 89.9 91.9Miscellaneous Manufactures 747 98.7 100.0 99.4 99.9 99.8 98.9 99.6 99.4 100.3 98.4 99.1 101.8 103.4Percentage Change Over Corresponding Period Of Previous YearALL ITEMS 10,000 9.6 5.0 0.3 7.5 -4.0 -2.3 -0.9 8.6 11.6 15.0 15.3 -10.8 -17.7Food 308 2.8 0.6 6.5 10.2 1.7 4.3 8.7 11.3 12.2 10.3 10.0 8.3 3.4Beverages & Tobacco 54 1.7 0.2 -1.4 0.0 -3.0 -0.9 -0.4 -1.0 0.0 -0.4 -0.8 1.1 2.2Crude Materials 43 13.2 14.7 23.8 7.7 27.6 28.4 22.2 17.9 8.1 9.7 15.7 -2.8 -11.5Mineral Fuels 2,855 37.4 15.7 5.6 26.5 -10.7 -5.0 2.5 40.2 49.7 56.1 47.6 -32.7 -48.1Animal & Vegetable Oils 27 -9.1 0.9 10.5 22.5 3.9 9.4 13.0 15.8 21.9 33.4 24.7 10.8 -16.8Chemicals & Chemical Products 1,373 6.7 6.1 2.7 3.5 4.6 3.5 0.5 2.2 3.6 5.1 11.3 -6.1 -15.0Manufactured Goods 807 6.5 3.7 7.7 7.1 8.1 10.0 7.4 5.4 5.4 5.2 9.5 8.2 -2.9Machinery & Equipment 3,786 -2.8 -2.7 -6.9 -5.6 -6.2 -6.1 -7.1 -8.2 -7.8 -8.2 -6.1 -0.2 4.2Miscellaneous Manufactures 747 0.3 1.3 -0.6 0.5 -0.3 -0.9 -0.9 -0.3 0.5 -0.5 -0.4 2.4 3.11 The weights refer to 2006 distribution pattern <strong>of</strong> retained imports Source: <strong>Singapore</strong> Department <strong>of</strong> Statistics<strong>and</strong> locally manufactured goods sold in the domestic market <strong>and</strong>are used in the computation <strong>of</strong> the indices from 2006 onwards.2009
EXCHANGE RATES [TABLE A4.1]SINGAPORE DOLLAR PER2007 200820092005 2006 2007 2008 I II III IV I II III IV IAverage For PeriodUS Dollar 1.6646 1.5889 1.5071 1.4148 1.5322 1.5245 1.5174 1.4542 1.4093 1.3662 1.3968 1.4869 1.5120Malaysian Ringgit 0.4395 0.4331 0.4384 0.4247 0.4380 0.4447 0.4376 0.4332 0.4368 0.4253 0.4183 0.4185 0.4171Euro 2.0719 1.9952 2.0638 2.0771 2.0074 2.0553 2.0847 2.1080 2.1127 2.1345 2.1008 1.9606 1.9736Pound Sterling 3.0290 2.9261 3.0161 2.6162 2.9962 3.0278 3.0653 2.9750 2.7881 2.6921 2.6432 2.3414 2.1746100 Japanese Yen 1.5138 1.3667 1.2806 1.3738 1.2828 1.2631 1.2894 1.2872 1.3395 1.3071 1.2991 1.5494 1.6178100 Korean Won 0.1625 0.1664 0.1622 0.1306 0.1631 0.1641 0.1635 0.1578 0.1475 0.1343 0.1313 0.1094 0.1071100 New Taiwan Dollar 5.1768 4.8870 4.5870 4.4874 4.6550 4.6013 4.6079 4.4838 4.4731 4.4886 4.4769 4.5111 4.4529Hong Kong Dollar 0.2140 0.2045 0.1932 0.1817 0.1962 0.1950 0.1944 0.1870 0.1808 0.1752 0.1791 0.1918 0.1950Australian Dollar 1.2686 1.1967 1.2624 1.2016 1.2036 1.2671 1.2848 1.2941 1.2779 1.2890 1.2398 0.9997 1.0046SINGAPORE DOLLAR PERPercentage Change Over Previous PeriodUS Dollar 1.5 4.8 5.4 6.5 1.7 0.5 0.5 4.3 3.2 3.2 -2.2 -6.1 -1.7Malaysian Ringgit 1.2 1.5 -1.2 3.2 -1.8 -1.5 1.6 1.0 -0.8 2.7 1.7 0.0 0.3Euro 1.4 3.8 -3.3 -0.6 0.2 -2.3 -1.4 -1.1 -0.2 -1.0 1.6 7.2 -0.7Pound Sterling 2.2 3.5 -3.0 15.3 -0.3 -1.0 -1.2 3.0 6.7 3.6 1.9 12.9 7.7Japanese Yen 3.3 10.8 6.7 -6.8 3.2 1.6 -2.0 0.2 -3.9 2.5 0.6 -16.2 -4.2Korean Won -9.1 -2.3 2.6 24.2 1.8 -0.6 0.4 3.6 7.0 9.8 2.3 20.0 2.1New Taiwan Dollar -2.3 5.9 6.5 2.2 2.0 1.2 -0.1 2.8 0.2 -0.3 0.3 -0.8 1.3Hong Kong Dollar 1.4 4.6 5.9 6.3 2.1 0.6 0.3 4.0 3.4 3.2 -2.2 -6.6 -1.6Australian Dollar -1.9 6.0 -5.2 5.1 -0.3 -5.0 -1.4 -0.7 1.3 -0.9 4.0 24.0 -0.5Source: Monetary Authority <strong>of</strong> <strong>Singapore</strong>49
50EXCHANGE RATES - Cont'd [TABLE A4.1]SINGAPORE DOLLAR PER2007 200820092005 2006 2007 2008 I II III IV I II III IV IEnd Of PeriodUS Dollar 1.6642 1.5336 1.4412 1.4392 1.5172 1.5326 1.4909 1.4412 1.3799 1.3616 1.4314 1.4392 1.5194Malaysian Ringgit 0.4403 0.4343 0.4359 0.4155 0.4390 0.4437 0.4363 0.4359 0.4326 0.4168 0.4140 0.4155 0.4166Euro 1.9754 2.0176 2.1252 2.0258 2.0241 2.0595 2.1123 2.1252 2.1807 2.1493 2.0558 2.0258 2.0153Pound Sterling 2.8717 3.0102 2.8798 2.0769 2.9780 3.0684 3.0180 2.8798 2.7529 2.7142 2.5775 2.0769 2.1771100 Japanese Yen 1.4189 1.2887 1.2871 1.5924 1.2880 1.2421 1.2936 1.2871 1.3814 1.2819 1.3732 1.5924 1.5450100 Korean Won 0.1646 0.1649 0.1540 0.1143 0.1613 0.1656 0.1625 0.1540 0.1390 0.1304 0.1178 0.1143 0.1096100 New Taiwan Dollar 5.0701 4.7071 4.4404 4.3887 4.5869 4.6654 4.5538 4.4404 4.5375 4.4846 4.4343 4.3887 4.4741Hong Kong Dollar 0.2146 0.1973 0.1847 0.1857 0.1942 0.1961 0.1921 0.1847 0.1773 0.1745 0.1843 0.1857 0.1960Australian Dollar 1.2207 1.2132 1.2707 0.9959 1.2251 1.2998 1.3157 1.2707 1.2658 1.3101 1.1445 0.9959 1.0463SINGAPORE DOLLAR PERPercentage Change Over Previous PeriodUS Dollar -1.8 8.5 6.4 0.1 1.1 -1.0 2.8 3.4 4.4 1.3 -4.9 -0.5 -5.3Malaysian Ringgit -2.4 1.4 -0.4 4.9 -1.1 -1.1 1.7 0.1 0.8 3.8 0.7 -0.4 -0.3Euro 12.6 -2.1 -5.1 4.9 -0.3 -1.7 -2.5 -0.6 -2.5 1.5 4.5 1.5 0.5Pound Sterling 9.5 -4.6 4.5 38.7 1.1 -2.9 1.7 4.8 4.6 1.4 5.3 24.1 -4.6Japanese Yen 12.2 10.1 0.1 -19.2 0.1 3.7 -4.0 0.5 -6.8 7.8 -6.6 -13.8 3.1Korean Won -4.1 -0.2 7.1 34.7 2.2 -2.6 1.9 5.5 10.8 6.6 10.7 3.1 4.3New Taiwan Dollar 1.5 7.7 6.0 1.2 2.6 -1.7 2.5 2.6 -2.1 1.2 1.1 1.0 -1.9Hong Kong Dollar -2.1 8.8 6.8 -0.5 1.6 -1.0 2.1 4.0 4.2 1.6 -5.3 -0.8 -5.3Australian Dollar 4.2 0.6 -4.5 27.6 -1.0 -5.7 -1.2 3.5 0.4 -3.4 14.5 14.9 -4.8Source: Monetary Authority <strong>of</strong> <strong>Singapore</strong>
INTEREST RATES (At End Of Period) [TABLE A5.1]2005 2006 2007 2008 I II III IV I II III IV IPer Cent Per Annum3 - Month Treasury Bill Rate 1 2.65 3.10 2.00 0.57 2.62 2.22 2.05 2.00 0.83 0.51 1.65 0.57 0.343 - Month Interbank Rate 2 3.25 3.44 2.38 1.00 2.94 2.50 2.63 2.38 1.31 1.19 1.88 1.00 0.693 - Month US$ SIBOR Rate 4.54 5.36 4.73 1.44 5.35 5.36 5.23 4.73 2.72 2.81 3.90 1.44 1.20Banks' Rates 3Prime Lending Rate 5.30 5.33 5.33 5.38 5.33 5.33 5.33 5.33 5.38 5.38 5.38 5.38 5.38Fixed Deposits3 Months 0.56 0.57 0.51 0.39 0.56 0.51 0.53 0.51 0.42 0.41 0.41 0.39 0.336 Months 0.66 0.67 0.62 0.51 0.67 0.62 0.64 0.62 0.52 0.53 0.53 0.51 0.4012 Months 0.86 0.88 0.83 0.70 0.87 0.83 0.85 0.83 0.71 0.73 0.73 0.70 0.60Savings Deposits 0.26 0.25 0.25 0.22 0.25 0.25 0.25 0.25 0.24 0.23 0.23 0.22 0.20Finance Companies' Rates 42007 2008Fixed Deposits - 3 Months 0.83 1.00 0.70 0.46 0.72 0.70 0.70 0.70 0.50 0.48 0.48 0.46 0.36Savings Deposits 0.42 0.33 0.33 0.25 0.33 0.33 0.33 0.33 0.25 0.25 0.25 0.25 0.251 Closing bid rates quoted by SGS primary dealers. Source: Monetary Authority <strong>of</strong> <strong>Singapore</strong>2 Closing <strong>of</strong>fer rates.3 Refer to the average quoted by 10 leading banks.4 Refer to the average quoted by 10 leading finance companies.200951
52EXTERNAL TRADE [TABLE A6.1]2007200820092005 2006 2007 2008 I II III IV I II III IV IMillion DollarsTOTAL TRADE AT CURRENT PRICES 715,722.8 810,483.3 846,607.4 927,654.8 196,944.1 207,828.2 217,017.0 224,818.2 228,632.4 243,278.4 252,604.6 203,139.4 165,342.2Imports 333,190.8 378,924.1 395,979.7 450,892.6 90,513.7 97,629.0 100,169.3 107,667.7 109,942.1 118,500.4 122,404.5 100,045.6 79,607.4Exports 382,532.0 431,559.2 450,627.7 476,762.2 106,430.4 110,199.1 116,847.7 117,150.5 118,690.3 124,778.0 130,200.1 103,093.8 85,734.7Domestic Exports 207,447.7 227,378.0 234,903.1 247,618.0 54,978.5 57,848.2 60,562.7 61,513.6 61,960.3 64,310.5 69,358.6 51,988.5 42,685.0Oil 52,798.2 59,604.6 63,271.1 89,526.2 12,777.9 16,340.1 16,253.3 17,899.8 19,496.1 25,071.6 28,840.9 16,117.6 11,099.7Non-oil 154,649.5 167,773.4 171,632.0 158,091.8 42,200.7 41,508.0 44,309.5 43,613.8 42,464.2 39,238.9 40,517.6 35,871.0 31,585.2Re-Exports 175,084.3 204,181.2 215,724.7 229,144.2 51,451.9 52,350.9 56,284.9 55,636.9 56,730.0 60,467.5 60,841.5 51,105.3 43,049.8TOTAL TRADE AT 2006 PRICES 728,943.5 810,483.3 866,746.4 919,588.9 206,032.6 213,063.5 220,917.2 226,733.1 229,467.7 233,715.3 237,676.8 218,729.1 186,917.2Imports 341,389.4 378,924.1 403,343.5 442,217.5 94,849.9 99,769.5 101,262.6 107,461.5 108,720.7 112,497.7 112,991.2 108,007.9 90,549.3Exports 387,554.1 431,559.2 463,402.8 477,371.5 111,182.7 113,294.0 119,654.6 119,271.6 120,747.0 121,217.7 124,685.6 110,721.2 96,368.0Domestic Exports 213,608.3 227,378.0 239,230.3 237,138.9 57,762.0 59,066.5 61,305.6 61,096.2 60,990.3 58,703.0 61,633.2 55,812.3 49,440.5Oil 61,294.8 59,604.6 58,871.0 63,851.1 14,096.1 15,767.3 14,780.7 14,227.0 14,654.0 15,160.6 17,138.7 16,897.7 14,868.9Non-oil 152,313.5 167,773.4 180,359.3 173,287.8 43,665.9 43,299.2 46,525.0 46,869.2 46,336.3 43,542.3 44,494.5 38,914.7 34,571.6Re-Exports 173,945.8 204,181.2 224,172.5 240,232.6 53,420.7 54,227.5 58,349.0 58,175.3 59,756.7 62,514.7 63,052.4 54,908.8 46,927.4Percentage Change Over Corresponding Period Of Previous YearTOTAL TRADE AT CURRENT PRICES 13.8 13.2 4.5 9.6 2.9 2.6 2.5 9.8 16.1 17.1 16.4 -9.6 -27.7Imports 13.6 13.7 4.5 13.9 2.3 2.4 0.6 12.8 21.5 21.4 22.2 -7.1 -27.6Exports 14.0 12.8 4.4 5.8 3.4 2.9 4.2 7.2 11.5 13.2 11.4 -12.0 -27.8Domestic Exports 15.1 9.6 3.3 5.4 -1.4 0.0 4.7 10.1 12.7 11.2 14.5 -15.5 -31.1Oil 41.5 12.9 6.2 41.5 -11.6 -3.7 1.1 47.8 52.6 53.4 77.4 -10.0 -43.1Non-oil 8.2 8.5 2.3 -7.9 2.1 1.5 6.1 -0.4 0.6 -5.5 -8.6 -17.8 -25.6Re-Exports 12.7 16.6 5.7 6.2 9.1 6.2 3.6 4.1 10.3 15.5 8.1 -8.1 -24.1TOTAL TRADE AT 2006 PRICES 9.5 11.2 6.9 6.1 8.1 6.5 5.6 7.7 11.4 9.7 7.6 -3.5 -18.5Imports 8.2 11.0 6.4 9.6 7.3 6.1 3.1 9.3 14.6 12.8 11.6 0.5 -16.7Exports 10.7 11.4 7.4 3.0 8.7 7.0 7.8 6.2 8.6 7.0 4.2 -7.2 -20.2Domestic Exports 9.0 6.4 5.2 -0.9 4.0 3.7 7.6 5.5 5.6 -0.6 0.5 -8.6 -18.9Oil 5.1 -2.8 -1.2 8.5 -7.8 -2.0 -1.7 7.8 4.0 -3.8 16.0 18.8 1.5Non-oil 10.7 10.2 7.5 -3.9 8.4 6.0 10.9 4.8 6.1 0.6 -4.4 -17.0 -25.4Re-Exports 12.8 17.4 9.8 7.2 14.3 10.7 7.9 7.0 11.9 15.3 8.1 -5.6 -21.5Source: International Enterprise <strong>Singapore</strong>
IMPORTS BY COMMODITY AT CURRENT PRICES [TABLE A6.2]2007200820092005 2006 2007 2008 I II III IV I II III IV IMillion DollarsTOTAL 333,190.8 378,924.1 395,979.7 450,892.6 90,513.7 97,629.0 100,169.3 107,667.7 109,942.1 118,500.4 122,404.5 100,045.6 79,607.4Oil 59,145.2 74,644.6 83,366.9 128,791.8 16,773.5 21,311.6 20,319.5 24,962.4 29,457.8 36,110.5 38,092.8 25,130.7 18,626.2Non-Oil 274,045.6 304,279.5 312,612.8 322,100.8 73,740.2 76,317.5 79,849.8 82,705.3 80,484.3 82,389.9 84,311.7 74,914.9 60,981.2Food, Beverages & Tobacco 8,870.8 9,115.4 10,419.9 11,538.4 2,334.6 2,536.5 2,697.3 2,851.5 2,647.3 2,883.9 3,120.3 2,886.9 2,402.7Crude Materials 2,189.7 2,630.0 2,837.9 3,365.5 622.1 715.8 765.2 734.8 802.3 801.7 925.2 836.2 863.6Animal & Vegetable Oils 479.5 514.8 672.8 1,014.3 138.9 158.1 173.8 202.1 246.4 270.6 300.9 196.4 145.6Chemicals & Chemical Products 20,743.8 22,694.6 23,918.7 23,723.4 5,457.3 6,134.3 6,013.7 6,313.4 5,875.6 5,988.4 6,572.6 5,286.7 3,949.5Manufactured Goods 25,040.0 27,932.7 30,715.2 35,019.9 7,096.6 7,663.4 8,035.0 7,920.1 8,016.0 8,950.7 9,729.2 8,324.0 6,465.7Machinery & Transport Equipment 185,980.5 207,371.6 208,406.5 210,231.6 50,102.5 50,549.3 52,853.6 54,901.2 53,755.2 54,323.2 54,144.7 48,008.6 39,122.2Miscellaneous Manufactured Articles 26,525.7 27,692.6 29,238.5 29,073.9 6,520.3 7,084.3 7,529.5 8,104.3 6,860.0 7,141.0 7,705.9 7,367.1 5,342.0Miscellaneous Transaction Articles 4,215.6 6,327.8 6,403.3 8,133.8 1,467.8 1,475.8 1,781.8 1,677.9 2,281.6 2,030.4 1,812.9 2,008.9 2,690.0Percentage Change Over Corresponding Period Of Previous YearTOTAL 13.6 13.7 4.5 13.9 2.3 2.4 0.6 12.8 21.5 21.4 22.2 -7.1 -27.6Oil 35.6 26.2 11.7 54.5 -2.7 9.8 -8.8 58.8 75.6 69.4 87.5 0.7 -36.8Non-Oil 9.7 11.0 2.7 3.0 3.5 0.5 3.2 3.7 9.1 8.0 5.6 -9.4 -24.2Food, Beverages & Tobacco 5.8 2.8 14.3 10.7 12.2 16.5 11.7 16.7 13.4 13.7 15.7 1.2 -9.2Crude Materials 9.0 20.1 7.9 18.6 -1.5 2.9 10.6 20.3 29.0 12.0 20.9 13.8 7.6Animal & Vegetable Oils -9.9 7.4 30.7 50.8 19.4 31.9 24.6 45.2 77.4 71.2 73.2 -2.8 -40.9Chemicals & Chemical Products 12.7 9.4 5.4 -0.8 2.6 13.6 0.0 5.9 7.7 -2.4 9.3 -16.3 -32.8Manufactured Goods 23.4 11.6 10.0 14.0 19.1 3.9 10.9 7.7 13.0 16.8 21.1 5.1 -19.3Machinery & Transport Equipment 8.6 11.5 0.5 0.9 1.9 -1.8 1.2 0.7 7.3 7.5 2.4 -12.6 -27.2Miscellaneous Manufactured Articles 5.0 4.4 5.6 -0.6 0.6 4.1 4.4 12.6 5.2 0.8 2.3 -9.1 -22.1Miscellaneous Transaction Articles 19.9 50.1 1.2 27.0 -1.4 -23.4 27.0 11.1 55.4 37.6 1.7 19.7 17.9Note: Data prior to 2007 are based on SITC (Revision 3). From January 2007 onwards, data are based on SITC (Revision 4).Source: International Enterprise <strong>Singapore</strong>53
54EXPORTS BY COMMODITY AT CURRENT PRICES [TABLE A6.3]2007 200820092005 2006 2007 2008 I II III IV I II III IV IMillion DollarsTOTAL 382,532.0 431,559.2 450,627.7 476,762.2 106,430.4 110,199.1 116,847.7 117,150.5 118,690.3 124,778.0 130,200.1 103,093.8 85,734.7Oil 57,414.5 70,552.7 79,723.8 115,478.5 16,004.5 20,766.6 20,231.9 22,720.8 25,511.7 34,102.9 35,415.4 20,448.6 15,122.4Non-Oil 325,117.5 361,006.6 370,903.9 361,283.6 90,425.9 89,432.5 96,615.7 94,429.8 93,178.6 90,675.1 94,784.7 82,645.2 70,612.3Food, Beverages & Tobacco 5,918.3 6,291.3 7,112.4 7,827.2 1,711.0 1,621.9 1,828.9 1,950.5 1,838.6 1,909.7 1,995.7 2,083.2 1,640.5Crude Materials 2,257.2 2,798.1 2,887.9 3,041.6 702.1 731.7 740.9 713.2 821.0 816.2 849.7 554.7 516.3Animal & Vegetable Oils 422.5 454.8 552.6 888.7 128.1 133.6 146.2 144.7 206.1 210.9 272.2 199.6 134.0Chemicals & Chemical Products 43,610.8 49,070.2 55,615.3 48,514.1 14,158.2 13,752.9 13,949.4 13,754.7 13,479.4 12,864.4 12,655.8 9,514.5 10,197.2Manufactured Goods 17,497.7 18,495.8 21,889.8 22,331.0 5,227.3 5,265.0 5,725.9 5,671.6 5,341.7 6,095.6 5,990.1 4,903.6 4,150.2Machinery & Transport Equipment 224,980.2 249,240.5 247,655.1 242,702.0 60,008.1 59,314.0 64,948.7 63,384.3 62,065.0 60,315.6 63,915.9 56,405.6 45,039.3Miscellaneous Manufactured Articles 26,048.6 28,273.1 29,159.1 29,885.4 6,875.2 7,234.5 7,671.8 7,377.6 7,678.6 7,075.1 7,703.1 7,428.7 6,210.2Miscellaneous Transaction Articles 4,382.2 6,382.7 6,031.9 6,093.7 1,615.8 1,378.9 1,603.9 1,433.3 1,748.4 1,387.6 1,402.2 1,555.4 2,724.6Percentage Change Over Corresponding Period Of Previous YearTOTAL 14.0 12.8 4.4 5.8 3.4 2.9 4.2 7.2 11.5 13.2 11.4 -12.0 -27.8Oil 38.6 22.9 13.0 44.8 -0.1 9.8 0.1 47.4 59.4 64.2 75.0 -10.0 -40.7Non-Oil 10.5 11.0 2.7 -2.6 4.0 1.4 5.1 0.6 3.0 1.4 -1.9 -12.5 -24.2Food, Beverages & Tobacco 5.1 6.3 13.1 10.1 15.3 7.1 12.3 17.2 7.5 17.7 9.1 6.8 -10.8Crude Materials 6.1 24.0 3.2 5.3 20.4 3.9 -4.3 -3.2 16.9 11.5 14.7 -22.2 -37.1Animal & Vegetable Oils -11.3 7.6 21.5 60.8 17.6 28.1 34.7 8.9 60.8 57.8 86.2 37.9 -35.0Chemicals & Chemical Products 12.0 12.5 13.3 -12.8 15.7 16.1 20.2 2.9 -4.8 -6.5 -9.3 -30.8 -24.3Manufactured Goods 25.1 5.7 18.3 2.0 23.4 19.0 22.2 10.1 2.2 15.8 4.6 -13.5 -22.3Machinery & Transport Equipment 10.5 10.8 -0.6 -2.0 0.2 -2.4 0.7 -1.1 3.4 1.7 -1.6 -11.0 -27.4Miscellaneous Manufactured Articles -1.0 8.5 3.1 2.5 0.8 5.0 5.7 1.1 11.7 -2.2 0.4 0.7 -19.1Miscellaneous Transaction Articles 36.9 45.6 -5.5 1.0 6.5 -29.4 12.5 -3.7 8.2 0.6 -12.6 8.5 55.8Note: Data prior to 2007 are based on SITC (Revision 3). From January 2007 onwards, data are based on SITC (Revision 4).Source: International Enterprise <strong>Singapore</strong>
DOMESTIC EXPORTS BY COMMODITY AT CURRENT PRICES [TABLE A6.4]2007 200820092005 2006 2007 2008 I II III IV I II III IV IMillion DollarsTOTAL 207,447.7 227,378.0 234,903.1 247,618.0 54,978.5 57,848.2 60,562.7 61,513.6 61,960.3 64,310.5 69,358.6 51,988.5 42,685.0Oil 52,798.2 59,604.6 63,271.1 89,526.2 12,777.9 16,340.1 16,253.3 17,899.8 19,496.1 25,071.6 28,840.9 16,117.6 11,099.7Non-Oil 154,649.5 167,773.4 171,632.0 158,091.8 42,200.7 41,508.0 44,309.5 43,613.8 42,464.2 39,238.9 40,517.6 35,871.0 31,585.2Food, Beverages & Tobacco 2,619.4 2,795.8 3,048.6 3,593.7 708.6 717.3 797.2 825.5 827.0 875.7 929.2 961.8 782.9Chemicals & Chemical Products 34,526.1 39,544.0 45,046.5 37,588.8 11,720.4 11,119.6 11,234.6 10,972.0 10,743.3 9,991.9 9,670.3 7,183.3 8,137.3Manufactured Goods 5,485.1 6,526.3 7,233.5 7,359.6 1,739.7 1,751.8 1,840.5 1,901.4 1,883.9 1,922.2 1,894.5 1,659.0 1,262.4Machinery & Transport Equipment 95,306.6 100,116.3 95,517.8 88,796.4 23,138.1 22,653.9 25,021.5 24,704.3 23,310.0 21,378.2 22,884.7 21,223.5 16,963.2Office Machinery 34,786.9 29,218.9 26,105.2 24,981.8 6,559.7 6,381.5 6,599.8 6,564.1 6,628.2 6,227.2 6,146.4 5,980.0 4,321.8Industrial & Non-Electrical Machinery 9,089.1 10,283.8 11,687.7 11,522.9 2,581.4 2,946.7 3,115.2 3,044.5 2,893.1 2,935.5 2,987.5 2,706.9 2,689.0Telecommunication Apparatus 9,822.5 11,687.6 9,512.6 5,454.0 2,274.1 2,106.5 2,717.8 2,414.3 1,617.3 1,465.7 1,263.4 1,107.6 893.5Electrical Machinery & Generators 38,866.2 46,519.7 44,864.0 41,338.6 10,838.6 10,509.1 11,915.1 11,601.2 10,806.7 9,903.5 10,938.7 9,689.7 7,676.4Ships & Other Transport Equipment 2,741.9 2,406.4 3,348.2 5,499.1 884.4 710.1 673.6 1,080.2 1,364.8 846.4 1,548.5 1,739.4 1,382.5Miscellaneous Manufactured Articles 14,101.1 15,196.1 16,582.2 15,902.7 3,960.9 4,250.7 4,322.6 4,048.0 4,302.4 3,811.5 3,845.4 3,943.4 3,377.5Others 2,611.4 3,594.9 4,203.5 4,850.5 933.0 1,014.8 1,093.0 1,162.7 1,397.5 1,259.4 1,293.7 899.9 1,061.9Percentage Change Over Corresponding Period Of Previous YearTOTAL 15.1 9.6 3.3 5.4 -1.4 0.0 4.7 10.1 12.7 11.2 14.5 -15.5 -31.1Oil 41.5 12.9 6.2 41.5 -11.6 -3.7 1.1 47.8 52.6 53.4 77.4 -10.0 -43.1Non-Oil 8.2 8.5 2.3 -7.9 2.1 1.5 6.1 -0.4 0.6 -5.5 -8.6 -17.8 -25.6Food, Beverages & Tobacco 13.4 6.7 9.0 17.9 9.4 5.1 9.4 12.1 16.7 22.1 16.6 16.5 -5.3Chemicals & Chemical Products 11.7 14.5 13.9 -16.6 17.4 16.4 23.9 0.3 -8.3 -10.1 -13.9 -34.5 -24.3Manufactured Goods 15.6 19.0 10.8 1.7 19.1 7.0 8.0 10.3 8.3 9.7 2.9 -12.7 -33.0Machinery & Transport Equipment 7.8 5.0 -4.6 -7.0 -6.8 -7.5 -2.5 -1.7 0.7 -5.6 -8.5 -14.1 -27.2Office Machinery 3.1 -16.0 -10.7 -4.3 -10.2 -11.2 -13.4 -7.6 1.0 -2.4 -6.9 -8.9 -34.8Industrial & Non-Electrical Machinery 16.4 13.1 13.7 -1.4 0.3 16.6 16.9 20.9 12.1 -0.4 -4.1 -11.1 -7.1Telecommunication Apparatus 6.8 19.0 -18.6 -42.7 -20.6 -26.0 -7.5 -20.5 -28.9 -30.4 -53.5 -54.1 -44.8Electrical Machinery & Generators 7.2 19.7 -3.6 -7.9 -6.8 -6.5 1.8 -2.9 -0.3 -5.8 -8.2 -16.5 -29.0Ships & Other Transport Equipment 90.5 -12.2 39.1 64.2 93.0 0.1 -6.4 108.2 54.3 19.2 129.9 61.0 1.3Miscellaneous Manufactured Articles 2.2 7.8 9.1 -4.1 8.7 17.8 18.0 -5.5 8.6 -10.3 -11.0 -2.6 -21.5Others -2.3 37.7 16.9 15.4 23.3 10.2 15.3 19.9 49.8 24.1 18.4 -22.6 -24.055Note: Data prior to 2007 are based on SITC (Revision 3). From January 2007 onwards, data are based on SITC (Revision 4).Source: International Enterprise <strong>Singapore</strong>
56NON-OIL DOMESTIC EXPORTS BY MAJOR PRODUCTS AT CURRENT PRICES [TABLE A6.5]2007200820092005 2006 2007 2008 I II III IV I II III IV IMillion DollarsTOTAL 154,649.5 167,773.4 171,632.0 158,091.8 42,200.7 41,508.0 44,309.5 43,613.8 42,464.2 39,238.9 40,517.6 35,871.0 31,585.2Electronics 75,328.5 78,583.1 71,378.1 63,056.8 17,511.3 16,834.7 18,838.0 18,194.0 16,769.2 15,517.7 16,036.4 14,733.6 11,353.0Integrated Circuits 21,883.5 25,912.8 22,371.7 20,902.1 5,665.0 5,553.8 5,849.6 5,303.2 5,372.2 4,913.1 5,403.6 5,213.3 4,288.0Parts <strong>of</strong> PCs 16,097.7 15,881.4 15,505.8 14,536.3 3,839.5 3,914.0 3,891.3 3,861.0 3,663.0 3,554.1 3,886.5 3,432.7 2,500.8Disk Drives 13,450.3 9,323.1 7,359.7 7,108.4 1,956.9 1,722.1 1,892.2 1,788.4 2,102.5 1,749.1 1,522.5 1,734.3 1,162.3Personal Computers 1,282.5 1,181.5 1,327.6 1,335.4 263.8 283.2 362.5 418.0 362.5 344.8 311.6 316.6 297.3Telecom Equipment 5,173.4 6,792.7 4,601.8 2,858.0 1,379.0 1,156.4 1,097.9 968.4 1,017.8 817.0 547.0 476.1 380.8Others 17,441.1 19,491.6 20,211.5 16,316.6 4,407.0 4,205.2 5,744.5 5,854.9 4,251.2 4,139.6 4,365.2 3,560.6 2,723.8Non-Electronics 79,321.0 89,190.3 100,253.9 95,035.0 24,689.4 24,673.3 25,471.4 25,419.8 25,695.1 23,721.3 24,481.3 21,137.4 20,232.2Percentage Change Over Corresponding Period Of Previous YearTOTAL 8.2 8.5 2.3 -7.9 2.1 1.5 6.1 -0.4 0.6 -5.5 -8.6 -17.8 -25.6Electronics 3.9 4.3 -9.2 -11.7 -10.9 -12.0 -5.7 -8.2 -4.2 -7.8 -14.9 -19.0 -32.3Integrated Circuits -0.2 18.4 -13.7 -6.6 -13.1 -11.3 -10.6 -19.6 -5.2 -11.5 -7.6 -1.7 -20.2Parts <strong>of</strong> PCs 17.2 -1.3 -2.4 -6.3 -0.8 3.1 -7.8 -3.3 -4.6 -9.2 -0.1 -11.1 -31.7Disk Drives -3.8 -30.7 -21.1 -3.4 -20.6 -27.1 -20.8 -15.0 7.4 1.6 -19.5 -3.0 -44.7Personal Computers -8.9 -7.9 12.4 0.6 -9.5 10.8 28.4 18.8 37.4 21.7 -14.1 -24.3 -18.0Telecom Equipment 6.0 31.3 -32.3 -37.9 -13.6 -30.0 -34.3 -48.3 -26.2 -29.3 -50.2 -50.8 -62.6Others 5.3 11.8 3.7 -19.3 -10.4 -12.6 17.9 19.7 -3.5 -1.6 -24.0 -39.2 -35.9Non-Electronics 12.7 12.4 12.4 -5.2 13.9 13.4 16.9 6.1 4.1 -3.9 -3.9 -16.8 -21.3Note: Data prior to 2007 are based on SITC (Revision 3). From January 2007 onwards, data are based on SITC (Revision 4).Source: International Enterprise <strong>Singapore</strong>
RE-EXPORTS BY COMMODITY AT CURRENT PRICES [TABLE A6.6]2007200820092005 2006 2007 2008 I II III IV I II III IV IMillion DollarsTOTAL 175,084.3 204,181.2 215,724.7 229,144.2 51,451.9 52,350.9 56,284.9 55,636.9 56,730.0 60,467.5 60,841.5 51,105.3 43,049.8Oil 4,616.3 10,948.0 16,452.8 25,952.4 3,226.7 4,426.5 3,978.6 4,821.0 6,015.6 9,031.3 6,574.5 4,331.0 4,022.7Non-Oil 170,468.0 193,233.2 199,271.9 203,191.8 48,225.2 47,924.5 52,306.3 50,815.9 50,714.4 51,436.2 54,267.0 46,774.3 39,027.1Food, Beverages & Tobacco 3,299.0 3,495.5 4,063.8 4,233.5 1,002.4 904.7 1,031.7 1,125.0 1,011.5 1,034.0 1,066.6 1,121.4 857.6Chemicals & Chemical Products 9,084.7 9,526.2 10,568.7 10,925.2 2,437.9 2,633.3 2,714.8 2,782.8 2,736.0 2,872.5 2,985.5 2,331.2 2,059.9Manufactured Goods 12,012.7 11,969.5 14,656.3 14,971.4 3,487.6 3,513.2 3,885.4 3,770.2 3,457.8 4,173.4 4,095.7 3,244.5 2,887.8Machinery & Transport Equipment 129,673.6 149,124.2 152,137.3 153,905.6 36,870.0 36,660.1 39,927.1 38,680.0 38,755.0 38,937.3 41,031.2 35,182.1 28,076.1Office Machinery 18,908.9 21,911.5 21,899.5 21,704.4 5,483.4 5,811.6 5,399.7 5,204.8 5,446.6 5,388.2 5,817.1 5,052.5 3,606.2Industrial & Non-Electrical Machinery 12,969.8 13,276.7 14,755.5 16,488.0 3,456.3 3,605.2 3,927.6 3,766.4 3,917.9 4,048.4 4,466.4 4,055.3 3,493.3Telecommunication Apparatus 16,132.7 16,829.8 17,340.2 16,126.9 4,167.3 4,205.7 4,553.5 4,413.7 4,149.5 4,352.8 4,316.7 3,308.0 2,674.0Electrical Machinery & Generators 75,770.4 89,945.6 89,973.5 90,929.0 21,719.8 21,132.5 23,614.0 23,507.1 23,069.9 22,996.2 24,281.9 20,580.9 16,327.1Ships & Other Transport Equipment 5,891.7 7,160.7 8,168.6 8,657.3 2,043.3 1,905.0 2,432.4 1,788.0 2,171.1 2,151.8 2,149.1 2,185.4 1,975.5Miscellaneous Manufactured Articles 11,947.5 13,077.0 12,576.9 13,982.7 2,914.3 2,983.8 3,349.2 3,329.6 3,376.2 3,263.5 3,857.7 3,485.2 2,832.7Others 4,450.6 6,040.8 5,269.0 5,173.5 1,513.0 1,229.5 1,398.0 1,128.4 1,378.0 1,155.3 1,230.4 1,409.8 2,313.0Percentage Change Over Corresponding Period Of Previous YearTOTAL 12.7 16.6 5.7 6.2 9.1 6.2 3.6 4.1 10.3 15.5 8.1 -8.1 -24.1Oil 12.3 137.2 50.3 57.7 106.9 127.6 -3.8 45.8 86.4 104.0 65.2 -10.2 -33.1Non-Oil 12.7 13.4 3.1 2.0 5.8 1.3 4.2 1.4 5.2 7.3 3.7 -8.0 -23.0Food, Beverages & Tobacco -0.6 6.0 16.3 4.2 19.9 8.7 14.7 21.4 0.9 14.3 3.4 -0.3 -15.2Chemicals & Chemical Products 13.2 4.9 10.9 3.4 8.0 14.6 6.9 14.4 12.2 9.1 10.0 -16.2 -24.7Manufactured Goods 30.0 -0.4 22.4 2.1 25.7 26.1 30.3 10.0 -0.9 18.8 5.4 -13.9 -16.5Machinery & Transport Equipment 12.7 15.0 2.0 1.2 5.1 1.0 2.9 -0.7 5.1 6.2 2.8 -9.0 -27.6Office Machinery 15.7 15.9 -0.1 -0.9 1.4 19.9 -8.9 -9.2 -0.7 -7.3 7.7 -2.9 -33.8Industrial & Non-Electrical Machinery 13.0 2.4 11.1 11.7 9.0 7.4 14.5 13.5 13.4 12.3 13.7 7.7 -10.8Telecommunication Apparatus 7.0 4.3 3.0 -7.0 4.0 13.4 6.9 -9.1 -0.4 3.5 -5.2 -25.1 -35.6Electrical Machinery & Generators 12.9 18.7 0.0 1.1 3.1 -5.8 1.0 1.9 6.2 8.8 2.8 -12.4 -29.2Ships & Other Transport Equipment 15.9 21.5 14.1 6.0 43.6 -2.5 33.2 -8.7 6.3 13.0 -11.6 22.2 -9.0Miscellaneous Manufactured Articles -4.5 9.5 -3.8 11.2 -8.3 -9.2 -6.9 10.4 15.9 9.4 15.2 4.7 -16.1Others 42.1 35.7 -12.8 -1.8 4.2 -33.2 2.8 -18.7 -8.9 -6.0 -12.0 24.9 67.957Note: Data prior to 2007 are based on SITC (Revision 3). From January 2007 onwards, data are based on SITC (Revision 4).Source: International Enterprise <strong>Singapore</strong>
58NON-OIL DOMESTIC EXPORTS BY MAJOR COUNTRY/REGION AT CURRENT PRICES [TABLE A6.7]2007200820092005 2006 2007 2008 I II III IV I II III IV IMillion DollarsTOTAL 154,649.5 167,773.4 171,632.0 158,091.8 42,200.7 41,508.0 44,309.5 43,613.8 42,464.2 39,238.9 40,517.6 35,871.0 31,585.2EU 29,102.0 30,133.5 29,830.5 24,265.1 7,985.0 7,005.9 7,852.8 6,986.8 6,932.3 6,197.1 5,827.3 5,308.4 5,260.5United States 22,233.4 25,430.8 26,110.9 20,158.4 6,872.5 6,347.4 6,570.9 6,320.1 5,940.0 5,011.3 4,642.4 4,564.7 3,405.9China, People's Republic <strong>of</strong> 14,991.6 16,123.0 16,237.1 15,868.0 3,936.5 3,937.5 4,094.6 4,268.5 4,041.4 3,979.0 4,154.5 3,693.1 3,455.9Malaysia 13,490.6 15,250.3 15,918.1 14,517.0 3,850.3 3,758.8 4,177.5 4,131.4 3,592.5 3,812.6 3,821.1 3,290.8 2,581.1Indonesia 11,900.2 11,520.3 11,064.2 11,357.5 2,726.0 2,775.7 2,850.4 2,712.1 2,733.2 2,964.8 3,167.9 2,491.6 1,944.8Hong Kong, China 10,523.8 12,003.1 11,598.9 11,601.3 2,550.9 2,816.3 3,159.0 3,072.6 2,950.1 2,826.5 3,187.7 2,636.9 2,442.5Japan 10,409.3 10,624.3 10,603.8 10,572.9 2,633.0 2,732.5 2,550.0 2,688.3 2,929.0 2,707.5 2,381.7 2,554.7 1,941.6Taiwan 7,573.0 7,514.3 6,811.9 6,066.1 1,574.3 1,613.3 1,824.0 1,800.3 1,591.9 1,569.0 1,653.4 1,251.8 1,120.6Thail<strong>and</strong> 6,864.8 8,013.7 8,277.5 7,253.4 1,967.7 1,930.4 2,180.2 2,199.3 2,074.3 1,770.4 1,847.9 1,560.8 1,251.8South Korea 5,159.4 5,214.1 5,936.7 5,917.0 1,323.3 1,412.2 1,564.6 1,636.6 1,569.3 1,480.3 1,556.4 1,310.9 1,199.5Percentage Change Over Corresponding Period Of Previous YearTOTAL 8.2 8.5 2.3 -7.9 2.1 1.5 6.1 -0.4 0.6 -5.5 -8.6 -17.8 -25.6EU 5.8 3.5 -1.0 -18.7 -0.8 4.2 24.8 -22.9 -13.2 -11.5 -25.8 -24.0 -24.1United States -1.7 14.4 2.7 -22.8 14.3 1.0 -3.9 0.4 -13.6 -21.0 -29.3 -27.8 -42.7China, People's Republic <strong>of</strong> 27.2 7.5 0.7 -2.3 1.8 -3.6 2.9 1.9 2.7 1.1 1.5 -13.5 -14.5Malaysia 9.9 13.0 4.4 -8.8 10.1 6.3 1.8 0.4 -6.7 1.4 -8.5 -20.3 -28.2Indonesia 17.7 -3.2 -4.0 2.7 -5.6 0.8 -5.0 -5.8 0.3 6.8 11.1 -8.1 -28.8Hong Kong, China 0.9 14.1 -3.4 0.0 -12.4 -10.9 5.2 5.0 15.6 0.4 0.9 -14.2 -17.2Japan -1.2 2.1 -0.2 -0.3 -7.5 7.4 7.1 -5.7 11.2 -0.9 -6.6 -5.0 -33.7Taiwan 17.2 -0.8 -9.3 -10.9 -17.6 -20.6 -4.2 8.0 1.1 -2.7 -9.4 -30.5 -29.6Thail<strong>and</strong> 23.2 16.7 3.3 -12.4 -2.6 -1.2 6.0 10.9 5.4 -8.3 -15.2 -29.0 -39.7South Korea 9.7 1.1 13.9 -0.3 -0.4 11.6 28.1 17.0 18.6 4.8 -0.5 -19.9 -23.6Note: The European Union (EU) comprises Austria, Belgium, Bulgaria, Cyprus, Czech Rep, Denmark, Estonia, Finl<strong>and</strong>,France, Germany, Greece, Hungary, Irel<strong>and</strong>, Italy, Latvia, Lithuania, Luxembourg, Malta, Netherl<strong>and</strong>s, Pol<strong>and</strong>,Portugal, Romania, Slovak Rep, Slovenia, Spain, Sweden <strong>and</strong> the United Kingdom.Source: International Enterprise <strong>Singapore</strong>
INDEX OF INDUSTRIAL PRODUCTION [TABLE A8.1]2007 200820092005 2006 2007 2008 I II III IV I II III IV I2007=100TOTAL MANUFACTURING 84.4 94.4 100.0 95.8 93.0 97.2 107.7 102.1 104.4 91.8 95.9 91.2 77.2Electronics 92.0 96.1 100.0 93.0 94.0 93.1 105.4 107.8 97.2 92.3 99.7 82.8 59.5Semiconductors 66.0 86.2 100.0 97.2 91.0 97.7 104.0 107.3 97.6 96.6 108.6 85.8 64.6Computer Peripherals 128.8 123.8 100.0 103.5 103.2 93.4 94.9 108.5 111.8 100.2 101.7 100.4 71.5Data Storage 140.9 101.6 100.0 99.8 94.5 86.7 108.1 110.8 108.5 96.8 107.6 86.5 57.6Infocomms & Consumer Electronics 122.2 108.3 100.0 54.3 93.6 79.1 121.1 106.1 66.3 57.2 51.0 42.8 30.3Other Electronic Modules & Components 92.3 93.3 100.0 103.5 96.6 95.7 100.6 107.1 108.3 102.4 108.3 95.2 54.0Chemicals 95.2 96.9 100.0 96.4 100.1 101.2 97.5 101.1 101.6 102.3 97.6 84.0 78.3Petroleum 103.1 100.2 100.0 101.0 99.3 98.2 98.4 104.2 101.9 103.5 100.3 98.2 88.0Petrochemicals 90.2 94.9 100.0 91.8 99.7 101.6 97.0 101.5 100.4 100.4 90.5 75.9 73.0Specialty Chemicals 89.2 93.9 100.0 98.7 99.0 101.5 100.3 99.2 107.4 107.8 104.6 75.0 72.6Others 99.4 99.3 100.0 84.7 108.0 113.5 87.3 91.3 88.0 87.0 90.3 73.7 68.7Biomedical Manufacturing 81.9 100.2 100.0 93.1 85.6 99.3 121.4 93.6 128.3 71.4 77.9 95.0 90.6Pharmaceuticals 80.7 102.1 100.0 92.8 85.6 98.8 122.9 92.6 130.8 68.7 76.9 94.8 90.6Medical Technology 90.7 86.9 100.0 97.5 86.2 104.6 102.2 107.0 96.7 105.4 90.4 97.4 90.9Precision Engineering 91.8 100.2 100.0 92.5 95.5 98.2 104.2 102.0 93.6 95.6 96.8 84.1 66.0Machinery & Systems 78.1 93.8 100.0 94.8 89.1 97.8 106.5 106.7 95.3 98.4 97.1 88.6 68.4Precision Modules & Components 101.9 104.8 100.0 90.6 101.0 98.6 102.4 98.1 92.2 93.2 96.6 80.3 63.9Transport Engineering 61.0 80.6 100.0 107.1 93.6 98.4 103.8 104.1 98.0 108.2 109.4 112.7 104.8Marine & Offshore Engineering 52.5 75.1 100.0 109.7 88.0 93.9 107.2 110.8 95.3 112.0 113.3 118.2 106.9Aerospace 77.1 91.3 100.0 104.3 99.0 103.0 101.5 96.5 97.9 104.4 105.0 110.0 105.8L<strong>and</strong> 75.1 83.9 100.0 105.4 100.8 101.9 94.3 103.1 118.4 104.2 109.1 90.1 82.8General Manufacturing Industries 88.7 94.3 100.0 102.3 95.0 98.0 104.3 102.8 95.9 101.8 107.7 103.6 85.3Printing 93.6 97.6 100.0 96.7 93.3 100.4 102.1 104.1 93.9 99.4 99.3 94.0 73.9Food, Beverages & Tobacco 86.5 89.9 100.0 107.7 98.5 96.3 103.4 101.8 104.9 105.3 108.9 111.9 98.1Miscellaneous industries 86.6 94.7 100.0 102.5 94.2 97.5 105.8 102.5 92.6 101.4 111.4 104.6 85.0Note: The industries are classified according to SSIC 2005.Source : <strong>Economic</strong> Development Board61
62INDEX OF INDUSTRIAL PRODUCTION - Cont'd [TABLE A8.1]2007 200820092005 2006 2007 2008 I II III IV I II III IV IPercentage Change Over Corresponding Period Of Previous YearTOTAL MANUFACTURING 9.5 11.9 5.9 -4.2 6.4 7.4 11.8 -1.2 12.3 -5.6 -11.0 -10.7 -26.1Electronics 9.2 4.5 4.1 -7.1 3.8 0.5 6.0 5.8 3.4 -0.9 -5.4 -23.2 -38.8Semiconductors 9.8 30.6 16.0 -2.8 16.3 18.3 12.2 17.6 7.3 -1.1 4.4 -20.1 -33.8Computer Peripherals -6.0 -3.9 -19.2 3.5 -15.5 -22.5 -24.3 -14.8 8.3 7.4 7.2 -7.5 -36.1Data Storage 25.1 -27.9 -1.5 -0.2 -10.9 -11.7 7.7 9.0 14.8 11.7 -0.4 -22.0 -46.9Infocomms & Consumer Electronics 16.6 -11.4 -7.7 -45.7 -5.4 -24.0 13.5 -14.0 -29.2 -27.7 -57.9 -59.7 -54.2Other Electronic Modules & Components -6.9 1.1 7.2 3.5 2.1 2.9 9.9 13.9 12.0 7.0 7.6 -11.1 -50.1Chemicals 2.7 1.7 3.2 -3.6 3.8 3.5 2.1 3.4 1.6 1.0 0.1 -16.9 -23.0Petroleum 9.1 -2.8 -0.2 1.0 -0.6 1.6 -3.8 2.0 2.6 5.4 1.9 -5.8 -13.6Petrochemicals 0.5 5.2 5.3 -8.2 4.6 1.7 12.7 3.3 0.7 -1.2 -6.7 -25.3 -27.2Specialty Chemicals -1.0 5.2 6.5 -1.3 7.5 5.1 4.5 9.2 8.5 6.2 4.3 -24.4 -32.4Others 0.0 -0.1 0.7 -15.3 8.1 14.8 -9.4 -10.7 -18.5 -23.3 3.5 -19.2 -22.0Biomedical Manufacturing 10.7 22.4 -0.3 -6.8 -3.8 9.6 26.4 -25.3 49.8 -28.1 -35.8 1.5 -29.4Pharmaceuticals 11.5 26.6 -2.1 -7.2 -6.1 8.9 25.0 -27.8 52.8 -30.5 -37.4 2.4 -30.7Medical Technology 5.5 -4.3 15.1 -2.5 17.4 17.1 27.3 2.4 12.2 0.7 -11.5 -9.0 -6.0Precision Engineering 6.1 9.1 -0.2 -7.5 1.6 -2.3 -1.3 1.5 -2.0 -2.7 -7.1 -17.5 -29.5Machinery & Systems 13.3 20.1 6.6 -5.2 6.7 2.3 7.0 10.5 7.0 0.6 -8.8 -16.9 -28.2Precision Modules & Components 2.5 2.9 -4.6 -9.4 -0.6 -5.3 -7.0 -5.2 -8.7 -5.5 -5.6 -18.1 -30.7Transport Engineering 26.8 32.1 24.1 7.1 30.4 30.6 21.2 16.5 4.7 9.9 5.4 8.2 6.9Marine & Offshore Engineering 36.3 43.1 33.1 9.7 33.3 39.8 33.0 27.8 8.3 19.2 5.7 6.6 12.2Aerospace 19.1 18.4 9.5 4.3 19.4 13.0 5.7 1.4 -1.1 1.3 3.5 14.0 8.1L<strong>and</strong> -12.6 11.7 19.2 5.4 24.2 20.1 11.9 20.9 17.4 2.3 15.8 -12.6 -30.0General Manufacturing Industries 1.8 6.4 6.1 2.3 10.2 6.8 8.2 0.0 0.9 4.0 3.3 0.8 -11.0Printing 2.3 4.4 2.4 -3.3 2.8 3.9 2.9 0.1 0.6 -1.0 -2.7 -9.7 -21.3Food, Beverages & Tobacco 7.1 3.9 11.3 7.7 17.9 11.2 11.2 5.8 6.6 9.3 5.3 9.9 -6.5Miscellaneous industries -1.5 9.3 5.7 2.5 11.2 6.4 9.9 -3.2 -1.8 4.0 5.3 2.0 -8.2Note: The industries are classified according to SSIC 2005.Source : <strong>Economic</strong> Development Board
INVESTMENT COMMITMENTS IN MANUFACTURING 1 AND SERVICES BY INDUSTRY CLUSTER [TABLE A8.2]2007 200820092005 2006 2007 2008 I II III IV I II III IV IFixed Asset Investments (Million Dollars)TOTAL 9,402.4 10,357.1 17,187.2 18,046.0 2,588.2 3,268.4 2,422.6 8,908.1 2,450.4 10,457.3 2,920.6 2,217.7 3,216.9Manufacturing 8,518.8 8,842.6 16,083.6 16,386.3 2,503.5 2,647.9 2,239.0 8,693.2 1,957.8 10,120.4 2,694.6 1,613.5 2,924.9Electronics 4,354.2 4,336.4 5,138.6 2,942.3 1,145.2 1,431.3 1,315.2 1,246.9 925.8 555.5 1,178.4 282.6 1,501.5Chemicals 1,979.6 2,566.4 8,631.8 11,550.0 805.3 861.3 379.1 6,586.1 633.0 9,402.1 1,436.2 78.7 1,076.9Biomedical Manufacturing 859.5 901.6 932.4 738.3 300.0 42.8 57.3 532.4 0.0 2.9 0.0 735.4 0.0Precision Engineering 418.2 415.7 411.7 383.0 90.5 44.0 166.6 110.6 74.3 3.9 30.7 274.1 346.5Transport Engineering 597.5 472.8 502.9 570.0 108.0 166.8 51.7 176.3 319.2 8.1 0.0 242.7 0.0General Manufacturing Industries 309.8 149.6 466.2 202.7 54.5 101.7 269.1 40.8 5.5 147.9 49.3 0.0 0.0Services Clusters 883.6 1,514.5 1,103.6 1,659.7 84.7 620.5 183.6 214.9 492.6 336.9 226.0 604.2 292.01 Including servicing, engineering <strong>and</strong> R&D. Source : <strong>Economic</strong> Development Board63
64INVESTMENT COMMITMENTS IN MANUFACTURING 1 AND SERVICES BY COUNTRY OF ORIGIN [TABLE A8.3]2007 200820092005 2006 2007 2008 I II III IV I II III IV IFixed Asset Investments (Million Dollars)TOTAL 9,402.4 10,357.1 17,187.2 18,046.0 2,588.2 3,268.4 2,422.6 8,908.1 2,450.4 10,457.3 2,920.6 2,217.7 3,216.9Local 2,440.2 2,801.3 2,498.4 1,863.4 167.2 650.7 226.9 1,453.6 562.5 493.3 99.2 708.4 454.6Foreign 6,962.2 7,555.8 14,688.8 16,182.6 2,421.0 2,617.7 2,195.7 7,454.5 1,887.9 9,964.0 2,821.4 1,509.3 2,762.3United States 2,376.3 2,392.6 3,191.2 11,292.0 1,066.4 736.6 635.2 752.9 982.2 8,704.2 852.6 753.0 1,898.0Japan 1,355.3 1,342.1 1,055.7 1,251.6 221.4 422.3 254.4 157.7 442.2 442.6 164.2 202.6 201.3Europe 2,186.5 2,521.7 8,542.2 2,825.9 764.2 1,357.9 211.8 6,208.4 456.9 802.4 1,082.0 484.6 532.7Asia Pacific & Others 1,044.1 1,299.4 1,899.7 813.1 369.0 100.9 1,094.3 335.5 6.6 14.8 722.6 69.1 130.31 Including servicing, engineering <strong>and</strong> R&D. Source : <strong>Economic</strong> Development Board
BUILDING AND CONSTRUCTION ACTIVITIES [TABLE A9.1]2007200820092005 2006 2007 2008 I II III IV I II III IV IMillion DollarsCONTRACTS AWARDED 11,456.2 16,796.7 24,460.0 34,618.8 3,927.3 6,940.4 5,129.8 8,462.5 9,629.5 8,845.9 8,268.6 7,874.7 4,165.2Public 3,984.8 3,742.5 5,699.9 14,542.7 958.0 1,218.7 1,576.0 1,947.3 3,568.7 1,794.7 3,235.9 5,943.3 3,474.0Private 7,471.4 13,054.2 18,760.0 20,076.1 2,969.4 5,721.7 3,553.8 6,515.2 6,060.8 7,051.2 5,032.7 1,931.4 691.2CERTIFIED PAYMENTS 12,220.9 12,938.3 17,871.7 25,531.1 3,827.4 3,858.4 4,691.1 5,494.8 5,339.9 5,860.5 6,930.0 7,400.7 7,367.0Public 6,208.3 5,333.6 5,514.7 7,614.0 1,517.2 1,152.8 1,366.7 1,477.9 1,611.7 1,665.8 2,098.2 2,238.3 2,530.0Private 6,012.5 7,604.7 12,357.0 17,917.1 2,310.2 2,705.5 3,324.4 4,016.9 3,728.2 4,194.7 4,831.8 5,162.4 4,837.0Percentage Change Over Corresponding Period Of Previous YearCONTRACTS AWARDED 11.4 46.6 45.6 41.5 31.5 103.9 -23.3 127.7 145.2 27.5 61.2 -6.9 -56.7Public -12.9 -6.1 52.3 155.1 -16.3 68.8 98.4 79.9 272.5 47.3 105.3 205.2 -2.7Private 30.8 74.7 43.7 7.0 61.2 113.3 -39.7 147.4 104.1 23.2 41.6 -70.4 -88.6CERTIFIED PAYMENTS 5.2 5.9 38.1 42.9 19.7 31.6 38.7 60.3 39.5 51.9 47.7 34.7 38.0Public -3.9 -14.1 3.4 38.1 -6.0 5.4 5.7 10.9 6.2 44.5 53.5 51.5 57.0Private 16.6 26.5 62.5 45.0 45.9 47.1 59.2 91.8 61.4 55.0 45.3 28.5 29.7Source: Building <strong>and</strong> Construction Authority65
66RETAIL SALES INDEX [TABLE A10.1]2007 2008Weights 1 2005 2006 2007 2008 I II III IV I II III IV I2005=100TOTAL AT CURRENT PRICES 10,000 100.0 105.5 109.9 113.3 110.6 110.8 104.0 114.3 115.8 113.8 111.7 111.8 106.1Total (excluding Motor Vehicles) 6,551 100.0 105.8 116.1 123.0 112.1 114.5 111.7 125.9 124.3 119.9 122.3 125.6 116.7Department Stores 1,322 100.0 106.4 116.8 127.9 112.4 113.8 111.1 130.1 125.3 124.2 124.1 137.9 128.4Supermarkets 411 100.0 109.6 122.5 136.0 121.1 116.9 122.9 129.1 137.1 130.2 136.8 139.9 145.0Provision & Sundry Shops 536 100.0 105.8 112.5 119.8 112.7 114.4 114.1 109.0 114.7 116.3 123.2 125.1 122.2Food & Beverages 200 100.0 107.9 114.0 113.1 133.5 102.1 107.8 112.7 133.6 104.4 107.9 106.5 127.2Motor Vehicles (Excl ARF) 3,449 100.0 104.9 98.3 94.8 107.9 103.8 89.3 92.2 99.5 102.3 91.7 85.6 86.1Petrol Service Stations 456 100.0 110.8 119.5 144.0 100.3 115.6 128.0 134.0 141.1 152.5 155.7 126.7 114.7Medical Goods & Toiletries 332 100.0 107.0 111.8 122.4 113.2 113.9 105.9 114.3 122.4 121.8 118.5 126.8 128.3Wearing Apparel & Footwear 574 100.0 109.6 123.5 126.3 127.0 115.8 112.3 138.8 136.5 119.8 119.7 129.1 119.3Furniture & Household Equipment 755 100.0 103.1 117.8 118.9 115.6 121.9 108.1 125.6 126.6 115.7 117.4 115.8 102.0Recreational Goods 190 100.0 101.0 108.6 104.5 99.1 111.7 102.4 121.2 99.4 108.1 99.1 111.2 96.4Watches & Jewellery 607 100.0 100.4 110.8 108.9 104.2 112.2 100.4 126.6 112.9 105.1 105.1 112.4 92.1Telecommunications & Computers 366 100.0 102.8 111.6 118.6 99.8 113.6 109.6 123.2 119.6 107.3 124.1 123.2 113.4Optical Goods & Books 344 100.0 98.4 107.0 109.3 99.7 105.8 105.1 117.5 107.9 104.1 108.2 117.0 106.1Others 458 100.0 111.2 120.9 127.9 114.5 117.0 120.8 131.2 124.6 128.2 131.5 127.4 112.4Percentage Change Over Corresponding Period <strong>of</strong> Previous YearTOTAL AT CURRENT PRICES 10,000 8.0 5.5 4.2 3.0 3.4 6.2 4.1 3.1 4.6 2.7 7.5 -2.2 -8.3Total (excluding Motor Vehicles) 6,551 7.9 5.8 9.6 6.0 7.4 11.2 8.7 11.1 10.9 4.7 9.5 -0.3 -6.2Department Stores 1,322 10.0 6.4 9.8 9.5 9.7 8.9 10.4 10.0 11.4 9.2 11.7 6.1 2.5Supermarkets 411 2.4 9.6 11.8 11.0 11.1 11.9 12.7 11.5 13.3 11.3 11.4 8.3 5.7Provision & Sundry Shops 536 8.8 5.8 6.3 6.5 5.9 11.3 6.1 2.2 1.8 1.6 8.0 14.8 6.5Food & Beverages 200 12.0 7.9 5.7 -0.8 9.9 2.7 2.9 6.3 0.1 2.3 0.1 -5.5 -4.8Motor Vehicles (Excl ARF) 3,449 8.2 4.9 -6.3 -3.6 -3.6 -2.9 -5.4 -13.3 -7.8 -1.4 2.7 -7.2 -13.5Petrol Service Stations 456 7.1 10.8 7.8 20.5 -6.1 1.4 9.2 27.4 40.7 31.9 21.7 -5.4 -18.7Medical Goods & Toiletries 332 7.0 7.0 4.5 9.5 4.7 6.8 1.1 5.5 8.2 7.0 11.9 10.9 4.8Wearing Apparel & Footwear 574 10.0 9.6 12.7 2.3 10.4 11.5 10.4 17.9 7.5 3.5 6.5 -7.0 -12.6Furniture & Household Equipment 755 9.8 3.1 14.2 0.9 15.2 24.5 11.8 6.7 9.5 -5.1 8.7 -7.8 -19.5Recreational Goods 190 10.9 1.0 7.5 -3.8 2.9 12.0 7.9 7.2 0.3 -3.2 -3.2 -8.2 -3.0Watches & Jewellery 607 11.8 0.4 10.4 -1.8 7.7 15.4 9.8 8.8 8.4 -6.3 4.6 -11.2 -18.4Telecommunications & Computers 366 4.0 2.8 8.5 6.3 -2.4 8.0 9.3 18.8 19.9 -5.5 13.2 0.0 -5.2Optical Goods & Books 344 3.8 -1.7 8.8 2.1 5.5 15.2 5.3 9.6 8.2 -1.6 3.0 -0.4 -1.7Others 458 0.3 11.2 8.7 5.8 6.8 8.8 5.5 13.7 8.8 9.6 8.8 -2.9 -9.81 The weights are used in the computation <strong>of</strong> the indices from 2005 onwards. Source: <strong>Singapore</strong> Department <strong>of</strong> Statistics2009
RETAIL SALES INDEX - Cont'd [TABLE A10.1]2007 2008Weights 1 2005 2006 2007 2008 I II III IV I II III IV I2005=100TOTAL AT CONSTANT PRICES 10,000 100.0 107.0 111.0 109.1 113.8 113.8 104.3 112.2 112.7 110.6 107.2 106.1 100.7Total (excluding Motor Vehicles) 6,551 100.0 104.2 112.6 114.1 110.7 112.5 107.7 119.5 116.1 111.0 112.7 116.7 108.4Department Stores 1,322 100.0 105.3 113.6 119.3 110.2 112.1 107.2 124.7 118.1 117.0 114.5 127.5 117.6Supermarkets 411 100.0 107.5 116.2 119.6 116.4 113.1 115.8 119.4 123.7 115.4 118.9 120.4 123.8Provision & Sundry Shops 536 100.0 103.7 106.3 103.4 109.2 109.7 106.6 99.7 102.8 100.4 104.9 105.6 103.0Food & Beverages 200 100.0 105.9 108.3 101.0 127.8 99.0 102.0 104.6 120.7 94.2 95.6 93.5 110.4Motor Vehicles (Excl ARF) 3,449 100.0 112.2 108.0 99.6 119.7 116.4 97.7 98.3 106.2 109.8 96.7 85.8 86.0Petrol Service Stations 456 100.0 104.4 108.1 111.6 105.6 109.2 111.8 106.0 106.9 109.6 116.3 113.5 109.8Medical Goods & Toiletries 332 100.0 105.5 107.5 113.7 111.1 110.9 100.2 107.7 114.6 113.8 109.7 116.8 117.7Wearing Apparel & Footwear 574 100.0 108.8 121.5 122.5 125.5 115.3 109.8 135.3 131.9 117.8 115.5 124.8 115.2Furniture & Household Equipment 755 100.0 104.6 121.5 121.5 118.6 125.7 111.6 130.1 131.0 118.8 119.3 116.9 103.4Recreational Goods 190 100.0 100.7 106.7 102.9 98.2 110.2 100.1 118.3 97.5 107.2 97.9 108.8 94.6Watches & Jewellery 607 100.0 88.4 91.8 82.7 89.0 94.1 83.9 100.3 85.3 79.9 80.8 84.8 65.6Telecommunications & Computers 366 100.0 115.9 135.7 154.8 118.6 136.0 135.3 153.0 152.1 139.9 164.4 163.0 151.6Optical Goods & Books 344 100.0 97.5 105.2 104.8 98.6 104.9 102.7 114.7 104.8 100.9 104.5 109.0 99.0Others 458 100.0 108.5 114.9 113.8 110.9 113.1 114.4 121.0 111.9 114.2 116.3 112.9 100.0Percentage Change Over Corresponding Period <strong>of</strong> Previous YearTOTAL AT CONSTANT PRICES 10,000 9.0 7.0 3.8 -1.7 7.2 8.1 1.9 -1.6 -0.9 -2.9 2.8 -5.4 -10.7Total (excluding Motor Vehicles) 6,551 7.2 4.2 8.0 1.4 7.6 11.5 6.7 6.6 4.9 -1.3 4.6 -2.3 -6.7Department Stores 1,322 8.8 5.3 7.9 5.0 8.6 8.1 8.0 7.0 7.1 4.4 6.8 2.3 -0.4Supermarkets 411 -1.1 7.5 8.1 2.9 8.5 9.9 8.5 5.6 6.2 2.0 2.6 0.8 0.1Provision & Sundry Shops 536 5.1 3.7 2.5 -2.7 4.0 8.7 1.4 -3.9 -5.9 -8.5 -1.6 5.9 0.3Food & Beverages 200 10.1 5.9 2.4 -6.8 7.3 1.2 -0.7 0.8 -5.6 -4.9 -6.3 -10.6 -8.5Motor Vehicles (Excl ARF) 3,449 10.3 12.2 -3.7 -7.8 6.5 2.4 -6.8 -16.5 -11.3 -5.7 -1.0 -12.7 -19.0Petrol Service Stations 456 0.3 4.4 3.6 3.2 2.4 5.7 5.0 1.3 1.3 0.4 3.9 7.1 2.7Medical Goods & Toiletries 332 7.4 5.5 1.8 5.8 3.6 5.6 -3.0 1.1 3.1 2.6 9.4 8.4 2.8Wearing Apparel & Footwear 574 10.0 8.8 11.7 0.8 9.6 11.0 8.9 16.7 5.1 2.1 5.2 -7.8 -12.7Furniture & Household Equipment 755 11.8 4.6 16.2 0.0 17.9 27.0 13.2 8.4 10.4 -5.5 6.8 -10.2 -21.0Recreational Goods 190 12.2 0.7 5.9 -3.6 2.1 11.0 5.6 5.1 -0.7 -2.7 -2.2 -8.0 -3.0Watches & Jewellery 607 7.3 -11.6 3.9 -9.9 0.4 12.9 5.7 -2.0 -4.2 -15.0 -3.7 -15.5 -23.1Telecommunications & Computers 366 12.5 15.9 17.1 14.1 12.7 17.0 15.5 22.1 28.2 2.9 21.5 6.5 -0.4Optical Goods & Books 344 4.0 -2.5 7.9 -0.4 4.4 15.2 4.2 8.4 6.4 -3.7 1.7 -4.9 -5.6Others 458 -0.3 8.5 5.8 -0.9 5.2 7.2 2.8 8.2 1.0 1.0 1.6 -6.7 -10.71 The weights are used in the computation <strong>of</strong> the indices from 2005 onwards. Source: <strong>Singapore</strong> Department <strong>of</strong> Statistics200967
68VISITOR ARRIVALS BY COUNTRY OF RESIDENCE [TABLE A11.1]2007200820092005 2006 2007 2008 I II III IV I II III IV IThous<strong>and</strong>TOTAL 8,943.0 9,751.1 10,284.5 10,116.1 2,442.9 2,491.3 2,637.5 2,712.9 2,609.0 2,486.0 2,518.4 2,502.7 2,252.0ASEAN 3,341.7 3,577.4 3,724.7 3,571.4 827.4 946.6 933.3 1,017.4 845.7 899.4 877.7 948.6 757.9Japan 588.5 594.4 594.5 571.0 155.7 118.1 161.7 159.0 157.8 119.6 150.1 143.6 127.9Hong Kong SAR 313.8 291.5 302.1 278.1 67.9 80.2 87.1 66.9 74.7 66.2 75.8 61.5 64.4India 583.6 658.9 748.7 778.3 148.3 237.7 170.1 192.6 165.2 250.5 175.5 187.1 135.8China, People's Republic <strong>of</strong> 857.8 1,037.2 1,114.0 1,078.7 267.3 261.6 299.5 285.6 327.7 265.0 263.4 222.6 276.4Taiwan 214.0 219.5 208.2 175.9 56.6 47.2 62.2 42.3 47.9 41.4 48.6 38.0 41.3South Korea 364.2 454.7 464.3 423.0 120.3 104.7 122.3 117.0 131.1 106.4 107.9 77.7 73.6Australia 620.3 691.6 768.5 833.2 160.9 184.2 209.1 214.3 196.9 202.8 218.1 215.4 185.9United Kingdom 467.2 488.2 495.7 492.9 160.4 99.4 106.3 129.6 160.0 99.0 106.8 127.1 141.6United States 371.4 399.8 408.9 396.6 106.8 96.3 100.5 105.3 108.5 97.4 96.7 94.1 87.5Percentage Change Over Corresponding Period Of Previous YearTOTAL 7.4 9.0 5.5 -1.6 5.5 5.0 5.4 5.9 6.8 -0.2 -4.5 -7.8 -13.7ASEAN 8.3 7.1 4.1 -4.1 6.6 5.8 4.6 0.2 2.2 -5.0 -6.0 -6.8 -10.4Japan -1.7 1.0 0.0 -3.9 2.1 -7.3 -3.0 7.5 1.3 1.3 -7.2 -9.7 -18.9Hong Kong SAR 15.5 -7.1 3.6 -7.9 -0.2 4.3 9.7 -0.3 9.9 -17.5 -12.9 -8.2 -13.8India 23.8 12.9 13.6 4.0 11.3 17.6 11.9 12.3 11.4 5.4 3.2 -2.9 -17.8China, People's Republic <strong>of</strong> -2.6 20.9 7.4 -3.2 -0.8 5.8 6.9 18.8 22.6 1.3 -12.0 -22.0 -15.7Taiwan 17.3 2.6 -5.2 -15.5 5.0 -6.5 -5.7 -14.2 -15.2 -12.3 -21.8 -10.2 -13.9South Korea 0.9 24.9 2.1 -8.9 2.3 2.3 2.0 1.8 9.0 1.6 -11.8 -33.6 -43.8Australia 10.5 11.5 11.1 8.4 0.8 4.8 15.3 22.5 22.4 10.1 4.3 0.5 -5.6United Kingdom 2.2 4.5 1.5 -0.6 5.8 3.4 -0.3 -3.2 -0.2 -0.4 0.5 -2.0 -11.5United States 11.5 7.6 2.3 -3.0 5.2 0.2 -1.2 4.7 1.6 1.1 -3.8 -10.6 -19.3Notes: 1 Figures exclude Malaysian arrivals by l<strong>and</strong>.2 The term "ASEAN" st<strong>and</strong>s for "Association <strong>of</strong> South East Asian Nations" <strong>and</strong> refers to the ten-countrypolitical association comprising Brunei, Cambodia, Indonesia, Philippines, Laos, Malaysia, Myanmar,<strong>Singapore</strong>, Thail<strong>and</strong> <strong>and</strong> Vietnam. However, when used in the statistical tables, the term excludes <strong>Singapore</strong>.Source: <strong>Singapore</strong> Tourism Board
TRANSPORT AND COMMUNICATIONS [TABLE A12.1]2007 200820092005 2006 2007 2008 I II III IV I II III IV I69Total Sea Cargo H<strong>and</strong>led (Million Tonnes) 423.3 448.5 483.6 515.4 116.1 120.8 121.8 124.9 131.5 136.6 130.7 116.5 113.3General & Bulk Cargo 285.4 295.5 326.2 348.1 76.4 81.2 83.7 85.0 86.9 92.4 91.4 77.4 66.3Oil-in-Bulk 137.8 153.0 157.4 167.3 39.7 39.6 38.2 39.9 44.7 44.3 39.3 39.1 47.0Total Container Throughput ('000 TEUs) 23,192.2 24,792.4 27,935.5 29,918.2 6,579.2 6,891.2 7,256.9 7,208.2 7,331.0 7,694.1 7,926.3 6,966.8 6,018.1Sea Passenger H<strong>and</strong>led ('000) 6,525.8 7,040.7 7,127.2 6,949.7 1,514.5 1,843.9 1,813.4 1,955.4 1,742.1 1,737.3 1,623.7 1,846.6 1,594.0Vessel Arrivals 1 (Million Gross Tons) 1,151.8 1,315.0 1,459.2 1,621.1 346.0 360.6 376.5 376.1 394.7 408.5 411.2 406.6 423.3Total Air Cargo H<strong>and</strong>led ('000 Tonnes) 1,838.3 1,916.1 1,899.5 1,861.4 450.0 463.5 485.8 500.2 467.8 478.5 487.7 427.4 362.1Discharged 894.4 955.6 966.4 954.2 227.5 238.1 246.5 254.2 240.0 245.8 248.2 220.2 190.3Loaded 943.9 960.5 933.1 907.2 222.4 225.4 239.3 246.0 227.9 232.6 239.5 207.3 171.8Air Passenger H<strong>and</strong>led ('000) 30,761.9 33,410.6 35,263.8 36,332.3 8,343.5 8,683.0 8,801.9 9,435.5 8,963.6 9,065.5 8,908.0 9,395.3 8,263.8Aircraft L<strong>and</strong>ings (Number) 106,351 111,638 115,144 120,793 27,966 28,620 28,900 29,658 29,498 30,106 30,390 30,799 29,533Postal Articles H<strong>and</strong>led (Mil) 1,628.5 1,711.4 1,862.5 1,910.8 446.5 454.5 469.6 491.9 471.6 469.5 475.4 494.3 488.7Fixed Line Subscriptions 2 ('000) 1,847.8 1,851.0 1,859.3 1,857.1 1,853.5 1,847.2 1,851.5 1,859.3 1,861.8 1,862.9 1,864.8 1,857.1 1,843.0Mobile Subscriptions 2 ('000) 4,256.8 4,637.7 5,619.2 6,340.2 4,788.6 4,987.8 5,280.6 5,619.2 5,924.1 6,159.9 6,258.4 6,340.2 6,414.8Broadb<strong>and</strong> Internet Subscriptions 3 ('000) 629.6 757.5 3,250.7 4,715.9 787.8 2,542.5 2,848.2 3,250.7 3,640.6 4,026.4 4,336.4 4,715.9 4,883.7Total International Telephone Call Minutes 4 (Mil) 4,777.9 5,074.1 6,302.5 8,456.7 1,446.8 1,515.0 1,608.0 1,732.6 1,829.8 2,053.1 2,268.9 2,304.9 2,308.5Percentage Change Over Corresponding Period Of Previous YearTotal Sea Cargo H<strong>and</strong>led 7.6 6.0 7.8 6.6 10.1 6.9 4.1 10.5 13.3 13.1 7.3 -6.7 -13.8General & Bulk Cargo 8.1 3.5 10.4 6.7 7.8 10.7 10.2 12.9 13.7 13.8 9.3 -8.9 -23.7Oil-in-Bulk 6.6 11.0 2.8 6.3 14.6 0.0 -7.1 5.8 12.5 11.7 2.9 -1.9 5.4Total Container Throughput 8.7 6.9 12.7 7.1 14.2 14.1 11.2 11.6 11.4 11.7 9.2 -3.3 -17.9Sea Passenger H<strong>and</strong>led -12.8 7.9 1.2 -2.5 -6.7 0.5 3.1 7.2 15.0 -5.8 -10.5 -5.6 -8.5Vessel Arrivals 1 10.5 14.2 11.0 11.1 10.5 9.1 12.0 12.2 14.1 13.3 9.2 8.1 7.3Total Air Cargo H<strong>and</strong>led 3.3 4.2 -0.9 -2.0 -3.0 -1.1 0.9 -0.3 4.0 3.2 0.4 -14.5 -22.6Discharged 2.4 6.8 1.1 -1.3 -0.4 1.5 2.0 1.3 5.5 3.3 0.7 -13.4 -20.7Loaded 4.0 1.8 -2.9 -2.8 -5.6 -3.6 -0.3 -1.9 2.4 3.2 0.1 -15.7 -24.6Air Passenger H<strong>and</strong>led 7.4 8.6 5.5 3.0 6.9 5.5 5.5 4.5 7.4 4.4 1.2 -0.4 -7.8Aircraft L<strong>and</strong>ings 10.1 5.0 3.1 4.9 3.1 3.1 3.3 3.0 5.5 5.2 5.2 3.8 0.1Postal Articles H<strong>and</strong>led 1.0 5.1 8.8 2.6 3.7 9.6 10.3 11.6 5.6 3.3 1.2 0.5 3.6Fixed Line Subscriptions 2 -0.8 0.2 0.4 -0.1 0.5 0.2 0.3 0.4 0.4 0.8 0.7 -0.1 -1.0Mobile Subscriptions 2 10.3 8.9 21.2 12.8 9.2 18.2 19.6 21.2 23.7 23.5 18.5 12.8 8.3Broadb<strong>and</strong> Internet Subscriptions 3 24.4 20.3 na na 20.1 na na na na 58.4 52.3 45.1 40.1Total International Telephone Call Minutes 4 15.7 6.2 24.2 34.2 19 1 23.8 27.3 26.2 26.5I35.5 41.1 33.0 26.21 Include all sea-going vessels & regional ferries above 75 GT. Source: Maritime <strong>and</strong> Port Authority <strong>of</strong> <strong>Singapore</strong>2 At end <strong>of</strong> period. <strong>Singapore</strong> Cruise Centre Pte Ltd3 Figures refer to end <strong>of</strong> period, include xDSL, cable modems, leased line internet <strong>and</strong> otherbroadb<strong>and</strong> internet access methods with effect from July 2004, <strong>and</strong> include wireless broadb<strong>and</strong>subscriptions with effect from April 2007. Data for 1st Quarter 2009 refer to end February.Civil Aviation Authority <strong>of</strong> <strong>Singapore</strong><strong>Singapore</strong> Post LtdInfocomm Development Authority <strong>of</strong> <strong>Singapore</strong>4 Since July 2004, IDA has exp<strong>and</strong>ed on the reporting <strong>of</strong> international telephone services to includeall Service-Based Operators(SBO), resulting in a marked increase in the minutes reported fromJune 2004. Part <strong>of</strong> the increase is also due to monthly traffic fluctuations.
70MONEY SUPPLY (At End Of Period) [TABLE A13.1]2005 2006 2007 2008 I II III IV I II III IV IMillion DollarsMoney Supply (M2) 219,798.3 262,369.8 297,558.9 333,411.1 279,843.9 293,612.5 294,139.2 297,558.9 313,280.4 315,700.0 324,975.9 333,411.1 349,439.8Money Supply (M1) 46,085.9 52,242.6 63,938.6 75,703.8 55,448.1 59,761.1 60,941.0 63,938.6 68,875.7 73,016.5 75,924.5 75,703.8 85,173.7Currency in Active Circulation 14,584.5 15,284.7 16,668.5 18,997.4 15,745.2 16,077.9 16,193.7 16,668.5 17,356.2 17,562.4 18,196.4 18,997.4 19,489.0Dem<strong>and</strong> Deposits <strong>of</strong> Private Sector 31,501.4 36,957.9 47,270.1 56,706.4 39,702.9 43,683.2 44,747.3 47,270.1 51,519.5 55,454.1 57,728.1 56,706.4 65,684.7Quasi-Money 173,712.4 210,127.2 233,620.3 257,707.3 224,395.8 233,851.4 233,198.2 233,620.3 244,404.7 242,683.5 249,051.4 257,707.3 264,266.1Fixed Deposits 107,714.3 141,619.4 151,731.7 155,121.9 152,199.6 153,768.0 152,841.2 151,731.7 155,427.8 149,119.6 152,202.6 155,121.9 152,836.0<strong>Singapore</strong> Dollar NegotiableCertificates <strong>of</strong> Deposit Held409.2 220.8 65.7 18.0 205.4 430.8 309.8 65.7 46.1 27.9 28.0 18.0 3.0Savings & Other Deposits 65,588.9 68,287.0 81,822.9 102,567.4 71,990.8 79,652.6 80,047.2 81,822.9 88,930.8 93,536.0 96,820.8 102,567.4 111,427.1Money Supply (M2) 6.2 19.4 13.4 12.0 23.0 23.6 20.0 13.4 11.9 7.5 10.5 12.0 11.5Money Supply (M1) 4.4 13.4 22.4 18.4 14.8 22.5 23.9 22.4 24.2 22.2 24.6 18.4 23.7Currency in Active Circulation 6.5 4.8 9.1 14.0 6.9 8.7 8.4 9.1 10.2 9.2 12.4 14.0 12.3Dem<strong>and</strong> Deposits <strong>of</strong> Private Sector 3.4 17.3 27.9 20.0 18.3 28.5 30.6 27.9 29.8 26.9 29.0 20.0 27.5Quasi-Money 6.7 21.0 11.2 10.3 25.2 23.9 19.0 11.2 8.9 3.8 6.8 10.3 8.1Fixed Deposits 15.4 31.5 7.1 2.2 34.4 25.0 16.0 7.1 2.1 -3.0 -0.4 2.2 -1.7<strong>Singapore</strong> Dollar NegotiableCertificates <strong>of</strong> Deposit Held-20.5 -46.0 -70.2 -72.6 -40.4 -12.3 21.6 -70.2 -77.6 -93.5 -91.0 -72.6 -93.5Savings & Other Deposits -4.9 4.1 19.8 25.4 9.7 22.2 25.1 19.8 23.5 17.4 21.0 25.4 25.32007Percentage Change Over Corresponding Period Of Previous Year20082009Source: Monetary Authority <strong>of</strong> <strong>Singapore</strong>
MONETARY SURVEY (At End Of Period) [TABLE A13.2]2007200820092005 2006 2007 2008 I II III IV I II III IV IMillion DollarsMoney Supply (M2) 219,798.3 262,369.8 297,558.9 333,411.1 279,843.9 293,612.5 294,139.2 297,558.9 313,280.4 315,700.0 324,975.9 333,411.1 349,439.8Money Supply (M1) 46,085.9 52,242.6 63,938.6 75,703.8 55,448.1 59,761.1 60,941.0 63,938.6 68,875.7 73,016.5 75,924.5 75,703.8 85,173.7Quasi-Money 173,712.4 210,127.2 233,620.3 257,707.3 224,395.8 233,851.4 233,198.2 233,620.3 244,404.7 242,683.5 249,051.4 257,707.3 264,266.1Domestic Credit 240,558.3 256,397.6 299,187.5 341,650.3 266,492.8 276,465.4 290,587.9 299,187.5 316,047.0 326,529.3 332,192.0 341,650.3 346,780.5Public Sector 50,760.0 57,346.6 66,435.8 73,555.8 61,461.4 64,196.1 70,494.4 66,435.8 70,904.3 72,140.8 67,559.4 73,555.8 80,358.6Private Sector 189,798.3 199,051.0 232,751.7 268,094.5 205,031.4 212,269.3 220,093.5 232,751.7 245,142.7 254,388.5 264,632.6 268,094.5 266,421.9Government Deposits 110,851.2 111,834.0 113,112.1 134,810.0 111,116.1 105,273.9 107,742.8 113,112.1 116,503.2 126,042.4 125,461.9 134,810.0 121,319.5Net Foreign Position 193,710.2 224,787.3 239,378.1 263,774.2 240,337.3 240,356.9 239,396.2 239,378.1 253,609.5 255,469.5 257,974.7 263,774.2 275,302.7Monetary Authorities 191,790.1 207,909.4 233,826.6 249,585.9 207,977.4 219,583.2 225,540.9 233,826.6 244,178.9 239,655.0 241,482.9 249,585.9 252,137.9Banks 1,920.1 16,877.9 5,551.5 14,188.3 32,359.9 20,773.7 13,855.3 5,551.5 9,430.6 15,814.5 16,491.8 14,188.3 23,164.8Other Items -103,619.0 -106,981.1 -127,894.6 -137,203.4 -115,870.1 -117,935.9 -128,102.1 -127,894.6 -139,872.9 -140,256.4 -139,728.9 -137,203.4 -151,323.9Percentage Change Over Corresponding Period Of Previous YearMoney Supply (M2) 6.2 19.4 13.4 12.0 23.0 23.6 20.0 13.4 11.9 7.5 10.5 12.0 11.5Money Supply (M1) 4.4 13.4 22.4 18.4 14.8 22.5 23.9 22.4 24.2 22.2 24.6 18.4 23.7Quasi-Money 6.7 21.0 11.2 10.3 25.2 23.9 19.0 11.2 8.9 3.8 6.8 10.3 8.1Domestic Credit 1.0 6.6 16.7 14.2 11.0 10.9 13.6 16.7 18.6 18.1 14.3 14.2 9.7Public Sector -2.6 13.0 15.8 10.7 20.3 14.8 20.7 15.8 15.4 12.4 -4.2 10.7 13.3Private Sector 2.0 4.9 16.9 15.2 8.4 9.7 11.5 16.9 19.6 19.8 20.2 15.2 8.7Government Deposits 10.5 0.9 1.1 19.2 -2.7 -8.7 -10.8 1.1 4.8 19.7 16.4 19.2 4.1Source: Monetary Authority <strong>of</strong> <strong>Singapore</strong>71
72ASSETS OF BANKS (At End Of Period) [TABLE A13.3]2005 2006 2007 2008 I II III IV I II III IV IMillion DollarsTOTAL ASSETS 425,222.5 508,449.9 582,859.0 668,481.3 531,263.2 551,342.8 563,819.9 582,859.0 637,259.2 649,525.1 657,896.4 668,481.3 678,130.4Cash 1,349.4 1,665.4 1,772.9 1,739.8 1,357.0 1,485.4 1,365.0 1,772.9 1,582.5 1,768.1 1,798.1 1,739.8 1,573.8Amounts Due from Banks &Asian Currency Units133,505.2 183,989.2 194,828.8 217,301.1 193,392.3 199,815.9 193,335.4 194,828.8 216,341.6 214,557.5 222,879.1 217,301.1 231,214.5Balances with MAS 7,466.1 8,802.0 9,530.4 13,466.0 8,380.6 9,082.9 9,432.1 9,530.4 9,782.8 9,967.9 11,117.6 13,466.0 13,366.9Securities & Equities 70,228.9 80,627.0 91,943.8 98,734.5 85,917.8 90,575.9 94,306.9 91,943.8 96,856.6 97,214.7 93,491.2 98,734.5 105,942.5Loans & Advances Including BillsFinancing183,109.4 194,597.6 233,393.9 272,175.4 201,424.8 209,074.3 218,700.5 233,393.9 249,326.5 261,142.6 272,931.3 272,175.4 270,704.5Loans & Advances 177,801.3 188,437.4 224,358.8 262,685.7 194,589.2 201,854.7 210,811.1 224,358.8 237,938.8 247,344.1 258,641.3 262,685.7 261,595.4Bills Discounted or Purchased 1 5,308.1 6,160.2 9,035.2 9,489.7 6,835.6 7,219.6 7,889.4 9,035.2 11,387.8 13,798.5 14,290.0 9,489.7 9,109.1Other Assets 29,563.6 38,768.7 51,389.2 65,064.5 40,790.7 41,308.5 46,680.0 51,389.2 63,369.3 64,874.3 55,679.1 65,064.5 55,328.2Percentage Change Over Corresponding Period Of Previous YearTOTAL ASSETS 6.8 19.6 14.6 14.7 19.5 19.2 17.7 14.6 20.0 17.8 16.7 14.7 6.4Cash -3.7 23.4 6.5 -1.9 22.5 9.5 14.0 6.5 16.6 19.0 31.7 -1.9 -0.5Amounts Due from Banks &Asian Currency Units17.3 37.8 5.9 11.5 27.6 32.1 18.7 5.9 11.9 7.4 15.3 11.5 6.9Balances with MAS 10.2 17.9 8.3 41.3 14.4 15.0 20.7 8.3 16.7 9.7 17.9 41.3 36.6Securities & Equities 2.9 14.8 14.0 7.4 21.6 18.1 19.4 14.0 12.7 7.3 -0.9 7.4 9.4Loans & Advances Including BillsFinancing2.2 6.3 19.9 16.6 10.3 10.3 12.8 19.9 23.8 24.9 24.8 16.6 8.6Loans & Advances 2.5 6.0 19.1 17.1 9.9 10.3 12.3 19.1 22.3 22.5 22.7 17.1 9.9Bills Discounted or Purchased 1 -4.3 16.1 46.7 5.0 21.3 8.9 25.0 46.7 66.6 91.1 81.1 5.0 -20.0Other Assets 2.3 31.1 32.6 26.6 29.9 15.7 37.0 32.6 55.4 57.0 19.3 26.6 -12.71Excluding bills rediscounted between banks. Source: Monetary Authority <strong>of</strong> <strong>Singapore</strong>200720082009
LIABILITIES OF BANKS (At End Of Period) [TABLE A13.4]2007200820092005 2006 2007 2008 I II III IV I II III IV IMillion DollarsTOTAL LIABILITIES 425,222.5 508,449.9 582,859.0 668,481.3 531,263.2 551,342.8 563,819.9 582,859.0 637,259.2 649,525.1 657,896.4 668,481.3 678,130.4Capital & Reserves 38,161.7 39,017.4 41,436.9 51,531.0 44,440.1 43,106.2 42,898.7 41,436.9 47,895.7 44,261.4 46,202.3 51,531.0 52,177.9Deposits <strong>of</strong> Non-Bank Customers 1 223,718.0 272,462.6 314,985.8 347,507.4 290,925.0 306,135.8 308,741.5 314,985.8 330,849.0 333,260.1 341,702.3 347,507.4 364,630.6Dem<strong>and</strong> Deposits 35,140.1 41,473.1 52,080.2 62,100.4 43,149.0 47,810.3 49,973.5 52,080.2 57,972.3 62,574.4 64,027.4 62,100.4 71,345.7Fixed Deposits 118,496.4 158,168.3 175,421.2 175,646.9 171,064.0 173,360.1 173,210.1 175,421.2 177,955.1 170,681.4 174,195.4 175,646.9 173,808.1Savings Deposits 69,306.2 71,760.9 86,496.0 109,033.5 75,463.7 83,567.6 84,236.9 86,496.0 94,154.8 99,360.9 102,762.3 109,033.5 118,748.2Amounts Due to Banks 120,849.1 146,468.4 165,520.8 184,401.8 141,535.4 150,072.7 152,785.0 165,520.8 184,235.2 188,483.7 192,638.4 184,401.8 190,811.9In <strong>Singapore</strong> 23,010.9 19,879.9 17,225.7 18,283.9 17,684.2 16,995.1 16,543.1 17,225.7 20,440.8 20,978.9 24,846.3 18,283.9 19,513.3Outside <strong>Singapore</strong> 2 97,838.3 126,588.5 148,295.1 166,117.9 123,851.3 133,077.5 136,241.9 148,295.1 163,794.3 167,504.8 167,792.1 166,117.9 171,298.6Other Liabilities 42,493.7 50,501.6 60,915.5 85,041.0 54,362.6 52,028.1 59,394.6 60,915.5 74,279.4 83,520.0 77,353.4 85,041.0 70,510.1Percentage Change Over Corresponding Period Of Previous YearTOTAL LIABILITIES 6.8 19.6 14.6 14.7 19.5 19.2 17.7 14.6 20.0 17.8 16.7 14.7 6.4Capital & Reserves 6.2 2.2 6.2 24.4 9.8 7.2 7.8 6.2 7.8 2.7 7.7 24.4 8.9Deposits <strong>of</strong> Non-Bank Customers 1 8.5 21.8 15.6 10.3 25.7 26.0 22.0 15.6 13.7 8.9 10.7 10.3 10.2Dem<strong>and</strong> Deposits 7.2 18.0 25.6 19.2 17.8 29.7 34.3 25.6 34.4 30.9 28.1 19.2 23.1Fixed Deposits 18.7 33.5 10.9 0.1 37.1 26.9 17.4 10.9 4.0 -1.5 0.6 0.1 -2.3Savings Deposits -5.0 3.5 20.5 26.1 9.2 21.8 24.9 20.5 24.8 18.9 22.0 26.1 26.1Amounts Due to Banks 5.1 21.2 13.0 11.4 10.2 15.0 11.4 13.0 30.2 25.6 26.1 11.4 3.6In <strong>Singapore</strong> 22.3 -13.6 -13.4 6.1 -25.1 -19.4 -17.8 -13.4 15.6 23.4 50.2 6.1 -4.5Outside <strong>Singapore</strong> 2 1.8 29.4 17.1 12.0 18.2 21.6 16.4 17.1 32.3 25.9 23.2 12.0 4.6Other Liabilities 3.2 18.8 20.6 39.6 22.4 6.8 21.5 20.6 36.6 60.5 30.2 39.6 -5.11 Excluding non-bank customers' holdings <strong>of</strong> <strong>Singapore</strong> Dollar negotiable certificates <strong>of</strong> deposit. Source: Monetary Authority <strong>of</strong> <strong>Singapore</strong>2 Including Asian Currency Units.73
74BANK LOANS AND ADVANCES TO NON-BANK CUSTOMERS BY INDUSTRY (At End Of Period) [TABLE A13.5]2005 2006 2007 2008 I II III IV I II III IV IMillion DollarsTOTAL LOANS & ADVANCESINCLUDING BILLS FINANCING183,109.4 194,597.6 233,393.9 272,175.4 201,424.8 209,074.3 218,700.5 233,393.9 249,326.5 261,142.6 272,931.3 272,175.4 270,704.5Manufacturing 10,108.0 10,863.2 10,220.3 11,751.3 10,540.2 10,358.4 10,171.5 10,220.3 11,110.7 11,851.6 11,830.4 11,751.3 11,899.7Building & Construction 23,031.1 26,345.5 37,508.9 49,994.4 28,172.7 30,489.3 31,975.8 37,508.9 43,628.4 47,282.1 48,782.3 49,994.4 50,825.3Housing Loans 61,954.6 63,345.1 73,139.1 79,587.0 64,356.5 66,319.6 70,472.5 73,139.1 74,180.5 75,919.5 77,614.8 79,587.0 80,485.1General Commerce 19,885.2 20,059.0 22,271.9 24,855.8 20,010.8 20,928.2 21,714.4 22,271.9 25,293.2 28,404.2 28,438.4 24,855.8 22,456.9Transport & Communications 4,327.0 6,297.1 9,129.8 9,211.7 6,932.9 7,951.9 8,795.8 9,129.8 9,719.8 9,649.9 11,272.7 9,211.7 9,456.9Financial Institutions 21,993.1 23,805.6 31,360.4 33,506.1 26,727.4 27,158.0 27,265.6 31,360.4 32,958.6 32,445.4 33,424.6 33,506.1 32,367.3Pr<strong>of</strong>essional & Private Individuals 32,482.3 32,318.3 35,070.9 37,872.2 32,416.7 32,863.1 33,657.9 35,070.9 35,285.7 36,886.2 37,643.5 37,872.2 37,585.1Others 9,328.3 11,563.8 14,692.8 25,396.7 12,267.4 13,005.8 14,647.0 14,692.8 17,149.7 18,703.6 23,924.7 25,396.7 25,628.3Percentage Change Over Corresponding Period Of Previous YearTOTAL LOANS & ADVANCESINCLUDING BILLS FINANCING2.2 6.3 19.9 16.6 10.3 10.3 12.8 19.9 23.8 24.9 24.8 16.6 8.6Manufacturing 3.2 7.5 -5.9 15.0 2.2 -2.8 -8.2 -5.9 5.4 14.4 16.3 15.0 7.1Building & Construction -2.2 14.4 42.4 33.3 23.5 20.8 21.2 42.4 54.9 55.1 52.6 33.3 16.5Housing Loans 5.2 2.2 15.5 8.8 3.7 6.9 12.5 15.5 15.3 14.5 10.1 8.8 8.5General Commerce 5.2 0.9 11.0 11.6 3.2 3.0 5.5 11.0 26.4 35.7 31.0 11.6 -11.2Transport & Communications 9.4 45.5 45.0 0.9 50.8 49.2 36.6 45.0 40.2 21.4 28.2 0.9 -2.7Financial Institutions -0.6 8.2 31.7 6.8 17.9 10.7 15.5 31.7 23.3 19.5 22.6 6.8 -1.8Pr<strong>of</strong>essional & Private Individuals -0.3 -0.5 8.5 8.0 1.4 2.6 5.3 8.5 8.9 12.2 11.8 8.0 6.5Others 0.3 24.0 27.1 72.9 38.6 37.7 29.7 27.1 39.8 43.8 63.3 72.9 49.4200720082009Source: Monetary Authority <strong>of</strong> <strong>Singapore</strong>
ASSETS AND LIABILITIES OF ASIAN CURRENCY UNITS (At End Of Period) [TABLE A13.6]2005 2006 2007 2008 I II III IV I II III IV ITOTAL ASSETS 611,377.4 698,648.5 906,936.3 912,968.6 739,854.6 769,984.0 845,840.0 906,936.3 993,748.4 964,408.5 968,992.0 912,968.6 844,168.9Loans to Non-Bank Customers 120,865.5 139,499.6 197,781.6 214,386.9 145,615.1 160,428.3 178,387.3 197,781.6 220,881.0 235,209.3 240,669.4 214,386.9 204,402.0Interbank Funds 389,485.1 434,022.9 532,661.4 498,671.6 456,383.0 455,347.1 497,708.8 532,661.4 558,890.7 522,576.5 524,186.5 498,671.6 466,549.2In <strong>Singapore</strong> 40,766.4 51,409.5 66,398.3 64,138.3 52,764.8 54,005.4 58,182.7 66,398.3 76,688.5 75,566.1 69,661.0 64,138.3 66,088.6Outside <strong>Singapore</strong> 348,718.7 382,613.4 466,263.1 434,533.3 403,618.2 401,341.7 439,526.0 466,263.1 482,202.2 447,010.4 454,525.5 434,533.3 400,460.6Other Assets 101,026.7 125,126.0 176,493.3 199,910.0 137,856.6 154,208.6 169,744.0 176,493.3 213,976.8 206,622.7 204,136.1 199,910.0 173,217.8TOTAL LIABILITIES 611,377.4 698,648.5 906,936.3 912,968.6 739,854.6 769,984.0 845,840.0 906,936.3 993,748.4 964,408.5 968,992.0 912,968.6 844,168.9Deposits <strong>of</strong> Non-Bank Customers 162,834.2 210,936.1 264,473.5 262,221.0 221,030.7 228,213.3 247,559.7 264,473.5 273,004.7 267,117.1 264,185.2 262,221.0 257,509.8Interbank Funds 394,080.5 415,760.0 551,471.7 523,782.0 444,900.2 455,436.3 503,503.5 551,471.7 611,427.0 591,689.2 586,781.8 523,782.0 477,342.9In <strong>Singapore</strong> 37,337.3 49,139.6 50,438.6 62,747.7 51,104.2 51,271.3 55,916.1 50,438.6 57,957.0 59,638.8 56,248.3 62,747.7 63,824.6Outside <strong>Singapore</strong> 356,743.2 366,620.4 501,033.1 461,034.4 393,796.0 404,165.0 447,587.4 501,033.1 553,470.0 532,050.4 530,533.5 461,034.4 413,518.3Other Liabilities 54,462.6 71,952.3 90,991.1 126,965.6 73,923.8 86,334.4 94,776.8 90,991.1 109,316.6 105,602.3 118,025.0 126,965.6 109,316.1TOTAL ASSETS 5.1 14.3 29.8 0.7 20.6 17.4 26.7 29.8 34.3 25.3 14.6 0.7 -15.1Loans to Non-Bank Customers 29.3 15.4 41.8 8.4 21.5 20.8 34.2 41.8 51.7 46.6 34.9 8.4 -7.5Interbank Funds 1.1 11.4 22.7 -6.4 18.8 11.2 18.6 22.7 22.5 14.8 5.3 -6.4 -16.5In <strong>Singapore</strong> -7.2 26.1 29.2 -3.4 20.0 14.6 14.8 29.2 45.3 39.9 19.7 -3.4 -13.8Outside <strong>Singapore</strong> 2.2 9.7 21.9 -6.8 18.6 10.7 19.1 21.9 19.5 11.4 3.4 -6.8 -17.0Other Assets -1.7 23.9 41.1 13.3 25.7 35.8 47.5 41.1 55.2 34.0 20.3 13.3 -19.0TOTAL LIABILITIES 5.1 14.3 29.8 0.7 20.6 17.4 26.7 29.8 34.3 25.3 14.6 0.7 -15.1Deposits <strong>of</strong> Non-Bank Customers 8.3 29.5 25.4 -0.9 29.7 22.0 30.7 25.4 23.5 17.0 6.7 -0.9 -5.7Interbank Funds 3.7 5.5 32.6 -5.0 15.6 11.6 21.3 32.6 37.4 29.9 16.5 -5.0 -21.9In <strong>Singapore</strong> 7.4 31.6 2.6 24.4 17.2 21.3 19.0 2.6 13.4 16.3 0.6 24.4 10.1Outside <strong>Singapore</strong> 3.4 2.8 36.7 -8.0 15.4 10.4 21.5 36.7 40.5 31.6 18.5 -8.0 -25.3Other Liabilities 6.1 32.1 26.5 39.5 26.4 42.3 50.4 26.5 47.9 22.3 24.5 39.5 0.02007Million US DollarsPercentage Change Over Corresponding Period Of Previous Year20082009Source: Monetary Authority <strong>of</strong> <strong>Singapore</strong>75
76QUARTERLY COMPOSITE LEADING INDEX [TABLE A14.1]I II III IV2000=1001994 86.8 87.7 88.9 90.21995 89.2 89.6 91.8 90.71996 90.9 91.5 91.5 92.21997 93.4 95.0 94.8 93.51998 90.0 87.9 88.1 89.51999 92.5 97.8 100.1 102.02000 100.9 101.0 100.4 97.62001 94.9 92.4 91.3 94.12002 97.6 98.4 96.9 97.42003 94.6 96.9 101.2 104.62004 107.6 108.1 107.7 107.12005 108.5 108.3 109.6 111.02006 111.8 112.6 111.9 114.92007 118.9 121.6 121.6 123.82008 120.4 120.2 119.4 111.72009 109.8Percentage Change Over Previous Quarter1994 0.3 1.0 1.4 1.51995 -1.1 0.4 2.5 -1.21996 0.2 0.7 0.0 0.81997 1.3 1.7 -0.2 -1.41998 -3.7 -2.3 0.2 1.61999 3.4 5.7 2.4 1.92000 -1.1 0.1 -0.6 -2.82001 -2.8 -2.6 -1.2 3.12002 3.7 0.8 -1.5 0.52003 -2.9 2.4 4.4 3.42004 2.9 0.5 -0.4 -0.62005 1.3 -0.2 1.2 1.32006 0.7 0.7 -0.6 2.72007 3.5 2.3 0.0 1.82008 -2.7 -0.2 -0.7 -6.42009 -1.7Source: <strong>Singapore</strong> Department <strong>of</strong> Statistics
BUSINESS EXPECTATIONS FOR THE MANUFACTURING SECTOR (Forecast For The Next Quarter) [TABLE A14.2]2006 2007 20082009I II III IV I II III IV I II III IV IIn Percentage TermsGeneral Business Expectations(For Next 6 Months)+26 +26 +22 +7 +26 +22 +25 +2 -7 +1 -18 -57 -33Numbers Employed +14 +28 +22 +23 +20 +9 +14 +11 +3 +4 -3 -28 -23New Orders Received +12 +15 +24 0 +31 +28 +20 +9 +4 +20 -6 -39 -34Output +23 +16 +27 +2 +38 +30 +20 +14 -1 +18 +3 -52 -15Direct Export Overseas +12 +13 +31 -2 +33 +26 +22 +4 +5 +18 -7 -36 -28Stocks <strong>of</strong> Finished Goods +6 +10 -11 -15 +4 +7 -2 0 -11 -7 -2 -24 -20Average Selling Prices -15 -2 -12 -8 -8 -9 -7 -10 -9 -8 -17 -36 -34Note: "Net weighted balance" is the difference between the weighted percentages <strong>of</strong> "ups" <strong>and</strong> "downs".A plus sign indicates a net upward trend <strong>and</strong> a minus sign denotes a net downward trend.Source: <strong>Economic</strong> Development Board77
78BUSINESS EXPECTATIONS FOR THE SERVICES SECTOR (Forecast For The Next Quarter) [TABLE A14.3]2006 2007I II III IV I II III IV I II III IV INet Weighted Balance In Percentage TermsTOTAL SERVICES SECTORGeneral Business Expectations (For Next 6 Months) +25 +23 +24 +18 +22 +28 +23 +8 +3 +2 -15 -53 -48Employment +17 +11 +20 +18 +23 +20 +27 +19 +17 +17 +11 -20 -15Operating Receipts +28 +9 +21 +8 +27 +20 +29 +10 +16 +7 -3 -50 -36WHOLESALE & RETAIL TRADEGeneral Business Expectations (For Next 6 Months) +10 +18 +16 -8 +12 +25 +25 +2 +5 -4 -11 -47 -43Employment +4 +7 +25 +8 +12 +10 +18 +8 +17 +12 +10 -19 -16Operating Receipts +17 +3 +12 -22 +19 +9 +27 -9 +9 +6 0 -47 -33Ending Stocks <strong>of</strong> Merch<strong>and</strong>ise 0 0 -6 -18 -3 +7 +10 +4 +13 -3 -3 -28 -26TRANSPORT & STORAGEGeneral Business Expectations (For Next 6 Months) +14 +18 +8 -4 +18 +17 +18 -5 -9 +8 -25 -66 -52Employment +35 +15 +19 +11 +37 +27 +40 +37 +39 +42 +14 -19 -9Operating Receipts +29 +29 +12 -9 +30 +26 +44 +4 +24 +23 -5 -75 -46HOTELS & CATERINGGeneral Business Expectations (For Next 6 Months) +18 +48 +55 +29 +21 +65 +76 +30 +26 +3 +17 -65 -55Employment +15 +3 +14 +20 +25 +20 +46 +9 +24 +12 +34 -33 -7Operating Receipts +7 +25 +51 -6 +17 +45 +59 +7 +22 +2 +33 -44 -25Ending Stocks <strong>of</strong> Merch<strong>and</strong>ise -29 +3 +19 +6 +7 +13 +20 +8 -3 +13 +6 -20 -10INFORMATION & COMMUNICATIONSGeneral Business Expectations (For Next 6 Months) -2 +1 +2 -5 +12 +23 +5 +9 +23 +12 +9 -30 -26Employment +3 +7 +4 +11 +15 +7 +15 +11 +19 +18 +5 -19 -14Operating Receipts +7 -7 +15 -10 +18 +20 +17 +1 +10 +29 +4 -28 -21FINANCIAL SERVICESGeneral Business Expectations (For Next 6 Months) +51 +27 +30 +46 +29 +30 +17 +19 -4 -3 -34 -61 -52Employment +51 +30 +35 +56 +39 +49 +45 +58 +6 +7 -7 -14 -22Operating Receipts +46 +8 +37 +59 +40 +19 +28 +42 +25 -19 -21 -51 -35Deposits <strong>of</strong> Non-bank Customers +55 +3 +23 +46 +22 +26 +16 +45 +43 +15 +2 +3 -3Loans & Advances to Non-bank Customers +32 +51 +53 +59 +43 +42 +42 +31 +1 -11 -33 -29 -33REAL ESTATEGeneral Business Expectations (For Next 6 Months) +63 +66 +69 +73 +61 +65 +30 +17 +9 -17 -41 -52 -58Employment -3 +3 +3 +3 +24 +18 +13 +13 +9 +15 +23 -12 -13Operating Receipts +70 +5 +10 +7 +33 +32 +6 +12 +20 +16 -2 -49 -43BUSINESS SERVICESGeneral Business Expectations (For Next 6 Months) +22 +16 +34 +36 +24 +25 +33 +19 +7 +17 +6 -49 -55Employment +27 +15 +19 +32 +31 +27 +23 +20 +3 +15 +6 -17 -22Operating Receipts +15 +15 +19 +24 +25 +27 +22 +18 +7 +9 +7 -32 -3920082009Note: "Net weighted balance" is the difference between the weighted percentages <strong>of</strong> "ups" <strong>and</strong> "downs".A plus sign indicates a net upward trend <strong>and</strong> a minus sign denotes a net downward trend.Source: <strong>Singapore</strong> Department <strong>of</strong> Statistics
GOVERNMENT OPERATING REVENUE [TABLE A15.1]2007 200820092005 2006 2007 2008 I II III IV I II III IV IpMillion DollarsTOTAL 1 28,116.5 31,072.4 39,515.9 41,376.7 8,187.4 10,098.0 10,887.3 10,343.3 9,046.3 10,678.4 11,391.4 10,260.6 8,731.9Tax Revenue 25,201.0 28,718.3 36,061.3 37,518.6 7,358.7 9,279.9 9,986.0 9,436.7 7,927.6 9,709.1 10,411.3 9,470.6 8,117.8Income Tax 12,655.0 14,947.7 16,410.2 18,559.0 2,485.0 4,826.7 4,709.7 4,388.7 2,695.7 5,106.2 5,586.1 5,171.1 3,423.0Corporate Income Tax 7,077.4 8,298.8 9,085.7 10,115.1 1,186.5 3,413.4 3,182.3 1,303.5 1,351.2 3,659.4 3,658.0 1,446.6 1,789.7Personal Income Tax 4,131.5 4,626.5 5,530.6 6,288.1 1,174.2 1,413.3 1,527.0 1,416.1 1,330.7 1,446.8 1,928.2 1,582.4 1,632.8Contributions by Statutory Board 1,446.1 2,022.4 1,793.9 2,155.8 124.3 0.0 0.4 1,669.1 13.8 0.0 0.0 2,142.1 0.5Assets Taxes 1,818.8 2,052.0 2,432.0 2,891.3 820.9 463.3 505.6 642.2 970.7 547.3 597.6 775.7 983.0Taxes on Motor Vehicles 2 1,438.3 1,723.4 2,101.3 2,003.3 519.9 508.3 520.0 553.1 607.8 506.3 451.9 437.4 439.2Customs & Excise Duties 1,994.8 1,943.3 2,033.6 2,082.5 583.5 445.1 517.5 487.4 535.2 477.0 533.3 537.0 518.0Betting Taxes 1,530.9 1,548.3 1,665.0 1,776.6 463.4 367.3 416.5 417.8 511.9 392.4 448.9 423.5 506.3Stamp Duty 812.8 1,311.7 4,077.9 1,837.8 1,049.1 1,076.0 1,196.4 756.4 647.9 450.9 470.7 268.3 241.7Goods & Services Tax 3,814.9 3,960.1 5,612.3 6,632.1 961.8 1,187.5 1,704.1 1,759.0 1,514.6 1,767.7 1,841.5 1,508.3 1,369.2Others 1,135.6 1,231.8 1,729.1 1,736.0 475.1 405.6 416.2 432.1 443.9 461.3 481.3 349.4 637.3Fees & Charges 2,567.1 2,120.2 3,231.8 3,726.2 699.8 779.7 878.3 874.0 1,097.6 905.2 950.1 773.3 546.3Other Receipts 3 348.3 233.9 222.8 131.9 128.9 38.3 23.0 32.6 21.1 64.1 30.1 16.7 67.81 Operating revenue refers to receipts credited to the Consolidated Revenue Account <strong>and</strong> Development Fund Account, Source: <strong>Ministry</strong> <strong>of</strong> Financebut excludes interest income, investment income <strong>and</strong> capital receipts. Figures are rounded to the nearest $ million.2 Taxes on Motor Vehicles comprise additional registration fees, road tax, special tax on heavy-oil engines, passenger vehicle seating fees <strong>and</strong>non-motor vehicle licences, but exclude excise duties on motor vehicles which are classified under Customs <strong>and</strong> Excise Duties.3 Other receipts exclude repayment <strong>of</strong> loans <strong>and</strong> advances, interest income, investment income <strong>and</strong> capital receipts.79
80GOVERNMENT OPERATING EXPENDITURE [TABLE A15.2]2005 2006 2007 2008 I II III IV I II III IV IpMillion DollarsTOTAL 1 20,674.6 23,463.0 24,351.7 28,590.3 8,651.2 4,412.9 5,113.6 6,174.0 10,251.6 4,501.8 6,692.6 7,144.4 10,391.3Security & External Relations 10,443.4 11,973.0 11,308.5 13,588.1 4,321.3 1,928.0 2,202.1 2,857.1 5,412.4 2,108.3 2,868.6 3,198.8 5,040.2Social Development 8,548.0 9,684.6 10,995.9 12,568.3 3,704.2 2,055.6 2,415.7 2,820.4 4,181.3 1,978.9 3,036.2 3,371.9 4,473.0Education 4,980.7 5,684.6 6,566.8 7,298.1 2,491.7 958.4 1,367.4 1,749.3 2,710.5 752.6 1,768.1 2,066.8 2,888.9Health 1,670.7 1,764.4 2,015.6 2,295.1 591.6 437.3 486.3 500.4 595.4 556.6 564.5 578.6 678.9Community Development, Youth & Sports 817.7 898.0 832.9 1,172.6 227.4 230.5 181.1 193.8 357.0 195.2 261.4 359.0 366.3Information, Communications & the Arts 274.5 320.3 351.6 370.2 143.1 37.5 84.7 86.2 144.0 43.5 94.1 88.5 185.9Environment & Water Resources 442.7 418.1 436.3 560.1 97.7 112.4 113.9 112.2 114.5 120.4 170.6 154.4 160.3National Development 361.8 599.3 792.7 872.4 152.7 279.4 182.2 178.5 259.9 310.5 177.4 124.5 192.6<strong>Economic</strong> Development 924.2 953.8 1,116.7 1,436.0 355.9 244.5 258.7 257.5 351.4 232.4 534.3 317.9 539.2Transport 285.1 284.1 284.1 373.8 71.3 78.4 79.6 54.8 108.1 58.8 118.5 88.5 101.1<strong>Trade</strong> & <strong>Industry</strong> 443.7 459.2 579.2 624.1 205.1 120.2 123.4 130.6 153.9 112.0 199.9 158.3 189.3Manpower 165.2 179.7 215.1 405.8 66.0 39.0 49.7 60.3 77.5 61.5 205.9 60.9 235.6Info-Communications <strong>and</strong> Media Development 2 30.2 30.8 38.3 32.2 13.5 6.9 5.9 11.9 11.9 0.1 10.1 10.2 13.2Government Administration 759.0 851.6 930.6 998.0 269.7 184.7 237.2 239.0 306.5 182.2 253.5 255.8 338.91 Government operating expenditure refers to expenditure on manpower, other operating expenditure Source: <strong>Ministry</strong> <strong>of</strong> Finance(excluding expenses on investment <strong>and</strong> agency fees on l<strong>and</strong> sales) <strong>and</strong> operating grants.2 Re-classified from Info-Communications Technology to include expenditure related to Media Development Programme from April 2007 onwards.Figures may not add up due to rounding.2007 20082009
GOVERNMENT DEVELOPMENT EXPENDITURE [TABLE A15.3]2007 200820092005 2006 2007 2008 I II III IV I II III IV IpMillion DollarsTOTAL 1 8,106.8 6,411.5 6,982.7 8,879.9 2,154.3 1,195.5 1,688.3 1,944.7 2,201.2 2,208.5 1,754.2 2,716.0 2,678.1Security & External Relations 916.2 821.8 817.7 862.1 404.3 80.8 135.0 197.6 415.2 100.9 174.7 171.3 330.3Social Development 3,388.0 2,101.8 2,776.9 2,885.1 955.1 423.4 642.1 756.3 1,002.6 594.3 722.8 565.3 855.0Education 993.8 687.5 680.9 856.0 263.3 114.0 129.9 173.8 324.4 84.1 257.9 189.6 221.6Health 107.8 82.2 131.2 245.4 61.2 17.9 23.7 28.4 115.4 18.2 49.0 62.8 206.5Community Development, Youth & Sports 120.4 65.0 159.3 188.9 70.7 7.5 16.7 64.5 145.1 6.8 15.1 21.9 52.0Information, Communications & the Arts 183.9 110.3 111.4 109.8 50.1 2.7 32.2 26.4 33.9 18.3 30.6 27.0 56.5Environment & Water Resources 877.2 548.6 493.3 328.0 189.8 72.9 67.9 162.7 77.7 76.7 95.2 78.5 74.6National Development 1,104.9 608.2 1,200.8 1,156.9 320.0 208.4 371.8 300.6 306.1 390.2 275.0 185.6 243.8<strong>Economic</strong> Development 3,323.8 3,017.5 3,273.4 4,899.3 739.8 656.6 902.2 974.8 655.7 1,498.7 845.2 1,899.7 1,400.9Transport 1,952.8 1,738.7 1,669.8 2,785.9 313.4 406.5 268.5 681.3 265.1 733.8 616.1 1,170.9 857.8<strong>Trade</strong> & <strong>Industry</strong> 1,320.4 1,227.7 1,542.1 2,056.4 391.9 249.0 622.6 278.5 365.4 758.7 215.2 717.1 492.0Manpower 39.4 20.3 20.7 32.5 10.2 1.0 3.4 6.0 13.7 4.5 7.6 6.7 16.5Info-Communications <strong>and</strong> Media Development 2 11.2 30.7 40.9 24.5 24.2 0.0 7.7 8.9 11.6 1.7 6.2 5.0 34.6Government Administration 478.9 470.4 114.7 233.4 55.0 34.7 9.0 15.9 127.6 14.5 11.5 79.7 92.01 Government development expenditure excludes l<strong>and</strong>-related expenditure items <strong>and</strong> loans to statutory boards <strong>and</strong> industrial <strong>and</strong> commercial enterprises. Source: <strong>Ministry</strong> <strong>of</strong> Finance2 Re-classified from Info-Communications Technology to include expenditure related to Media Development Programme from April 2007 onwards.Figures may not add up due to rounding.81