Math 156 Summer 04 Final Exam 1. Consider the data set below ...
Math 156 Summer 04 Final Exam 1. Consider the data set below ...
Math 156 Summer 04 Final Exam 1. Consider the data set below ...
- No tags were found...

You also want an ePaper? Increase the reach of your titles
YUMPU automatically turns print PDFs into web optimized ePapers that Google loves.
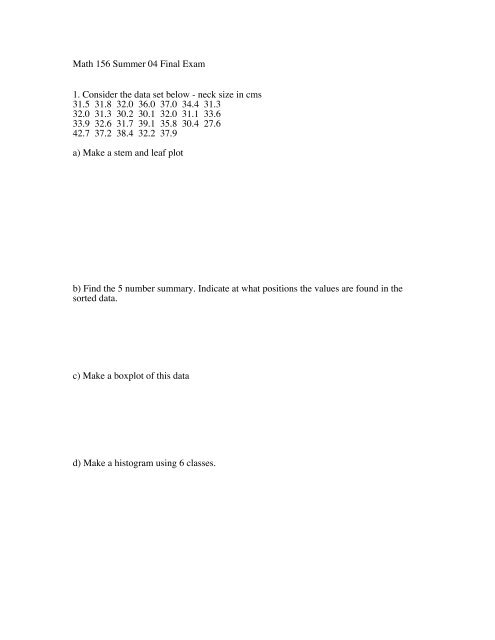
<strong>Math</strong> <strong>156</strong> <strong>Summer</strong> <strong>04</strong> <strong>Final</strong> <strong>Exam</strong><strong>1.</strong> <strong>Consider</strong> <strong>the</strong> <strong>data</strong> <strong>set</strong> <strong>below</strong> - neck size in cms3<strong>1.</strong>5 3<strong>1.</strong>8 32.0 36.0 37.0 34.4 3<strong>1.</strong>332.0 3<strong>1.</strong>3 30.2 30.1 32.0 3<strong>1.</strong>1 33.633.9 32.6 3<strong>1.</strong>7 39.1 35.8 30.4 27.642.7 37.2 38.4 32.2 37.9a) Make a stem and leaf plotb) Find <strong>the</strong> 5 number summary. Indicate at what positions <strong>the</strong> values are found in <strong>the</strong>sorted <strong>data</strong>.c) Make a boxplot of this <strong>data</strong>d) Make a histogram using 6 classes.
e) Use your calculator to find <strong>the</strong> mean and standard deviationf) Would you use <strong>the</strong> mean and standard deviation, or <strong>the</strong> five number summary todescribe this <strong>data</strong> <strong>set</strong>? Which is best and why?g) Describe <strong>the</strong> shape of <strong>the</strong> <strong>data</strong>.2. Use x = 1 ∑ x iand s =n1∑ (x i− x) 2 to find <strong>the</strong> mean and standard deviation of:n − 12.5 3.1 2.2 4.3 4.1
3. Define <strong>the</strong> terms:Central Limit TheoremLaw of Large NumbersSampling distribution of a statisticLurking variableConfoundingStatistically significant4. When are <strong>the</strong> following valid computations?a) P(A and B) = P(A)P(B) b) P(A or B) = P(A) + P(B)
5. Recent SAT results had a normal distribution with mean 500 and standard deviation100.a) Use <strong>the</strong> 68-95-99.7 rule to give a range of scores including nearly all scoresb) What is <strong>the</strong> probability a randomly chosen student scores between 450 and 600?c) How high a score does a student need to be in <strong>the</strong> top 15%?d) What is <strong>the</strong> chance <strong>the</strong> average of 5 students' scores is between 450 and 600?e) What is <strong>the</strong> probability that <strong>the</strong> average of 80 randomly chosen students' scores is<strong>below</strong> 490?f) What would <strong>the</strong> mean and standard deviation of <strong>the</strong> sampling distribution be for <strong>the</strong>average of 80 scores?
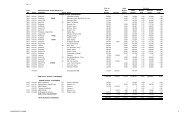
6. <strong>Consider</strong> <strong>the</strong> 2 seater <strong>data</strong> attached to <strong>the</strong> end of <strong>the</strong> testa) Which of <strong>the</strong> seven variables are categorical? Quantitative?b) Make a scatterplot using city mileage as <strong>the</strong> explanatory variablec) Describe <strong>the</strong> relationship (form direction strength)d) Find <strong>the</strong> equation of <strong>the</strong> regression line ŷ = a + bx using b = r s ys xand a = y − bx .e) Find <strong>the</strong> coordinates of two points you would use to plot <strong>the</strong> regression line.f) What hwy mileage would be predicted for a city mileage of 30 mpg?
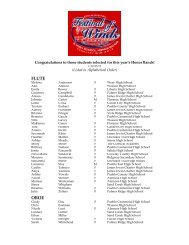
g) What is this type of prediction in f) called?h) Find <strong>the</strong> residual for <strong>the</strong> Porsche Boxster Si) What percent of <strong>the</strong> variation in hwy mileage can be attributed to a linear relationshipbetween mileages?j) Which points probably have <strong>the</strong> most influence on <strong>the</strong> regression line?7. <strong>Consider</strong> <strong>the</strong> probabilities listed for colors of a randomly selected M&M candy:Brown Red Green Blue Orange.15 .2 .1 .2 ??a) What must be <strong>the</strong> orange probability?b) What is <strong>the</strong> chance an M&M is not Red?c) If you select one M&M and <strong>the</strong>n ano<strong>the</strong>r, what is <strong>the</strong> chance your selection consists ofan Orange followed by a Green?d) In a sample of 10 M&Ms, what is <strong>the</strong> chance <strong>the</strong>re are no Red candies?
8. a) In 6 rolls of a die, what is <strong>the</strong> probability of rolling at least 2 sixes?b) In 60 rolls of a die, what is <strong>the</strong> approximate probability of rolling at least 20 sixes?9. Use <strong>the</strong> tables to perform an SRS of size 12 from a list of 900 people. Use line 102.10. Diagram <strong>the</strong> experiment and assign treatments to 30 subjects in an experimentcomparing 3 kinds of <strong>the</strong>rapy. Use line 120.
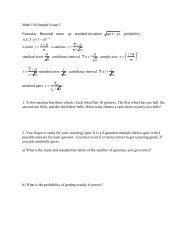
<strong>Math</strong> <strong>156</strong> <strong>Final</strong> <strong>Exam</strong> Part 2<strong>1.</strong> a) If you were to examine 100 independently generated 95% confidence intervals, howmany would you expect to be providing correct results?b) Your friend tells you that a 95% confidence interval gives a range of values where wewould likely find <strong>the</strong> sample mean in 95% of sampling situations. What do you tell yourfriend?c) A 95% confidence interval for <strong>the</strong> mean contains <strong>the</strong> number 6.5. What hypo<strong>the</strong>sis testand what conclusion can you state based in this evidence?2. Produce <strong>the</strong> required confidence intervals:a) 90% confidence, for <strong>the</strong> population mean, if x = 1<strong>1.</strong>2, n = 50, σ = 4.3b) 95% confidence, for <strong>the</strong> population mean, if x = 26.5, n = 15, s = 2.5
c) 99% confidence, for difference of <strong>the</strong> population means, if x 1= 26, n 1= 12, s 1= <strong>1.</strong>5x 2= 24.1, n 1= 16, s 1= <strong>1.</strong>75d) 98% confidence, for population proportion, if 56 of 200 polled are in favor ofincreasing taxes.3. Perform <strong>the</strong> hypo<strong>the</strong>sis tests. Quote a p-value or approximate p-value in your results.Data: x = 10.1, n = 200, σ = .95a) H 0: µ = 10 H a: µ < 10b) H 0: µ = 10 H a: µ > 10c) H 0: µ = 10 H a: µ ≠ 10
4. Perform <strong>the</strong> hypo<strong>the</strong>sis tests. Quote a p-value or approximate p-value in your results.Data: x = 58.1, n = 100, s = 12a) H 0: µ = 60 H a: µ < 60b) H 0: µ = 60 H a: µ > 60c) H 0: µ = 60 H a: µ ≠ 605. Find <strong>the</strong> sample sizes needed if:a) <strong>the</strong> margin of error in a 90% z-interval for <strong>the</strong> mean is to be .<strong>04</strong> , and σ = <strong>1.</strong>22b) <strong>the</strong> margin of error in a 99% z-interval for <strong>the</strong> population proportion is to be .<strong>04</strong> , andyou think <strong>the</strong> population proportion is around 75%.
6. Define <strong>the</strong> termsConfidence levelMargin of errorStandard error of <strong>the</strong> meanp-valueSignificant at level alpha
7. What conditions need to be verified for results to be valid that are based on:a) ˆ p ± z *p ˆ (1 − p ˆ )nb) z = x − µσ / nc) t = x − µs / nd) χ 2 =∑(observed - expected) 2expected
8. Could you conclude that more than half of all CSU-Pueblo students are in favor of afee to support <strong>the</strong> <strong>Math</strong> Learning Center, based on an SRS of 200 students yielding 124in favor of <strong>the</strong> fee? Explain.9. Perform a chi-square test of <strong>the</strong> <strong>data</strong> <strong>below</strong>. State null and alternative hypo<strong>the</strong>ses, carryout <strong>the</strong> test and quote a p-value in your results.men womenhate pets 22 15tolerate pets 26 21love pets 51 52