Biodiversity lab.pdf
Biodiversity lab.pdf
Biodiversity lab.pdf

Create successful ePaper yourself
Turn your PDF publications into a flip-book with our unique Google optimized e-Paper software.
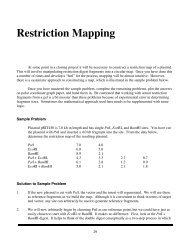
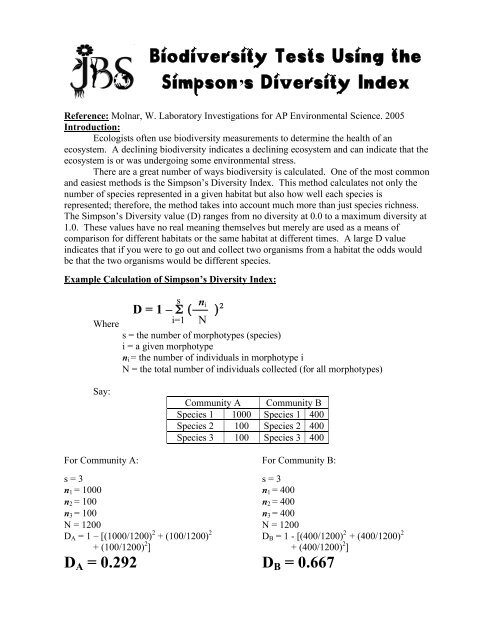
<strong>Biodiversity</strong> Tests Using theSimpson’s Diversity IndexReference: Molnar, W. Laboratory Investigations for AP Environmental Science. 2005Introduction:Ecologists often use biodiversity measurements to determine the health of anecosystem. A declining biodiversity indicates a declining ecosystem and can indicate that theecosystem is or was undergoing some environmental stress.There are a great number of ways biodiversity is calculated. One of the most commonand easiest methods is the Simpson’s Diversity Index. This method calculates not only thenumber of species represented in a given habitat but also how well each species isrepresented; therefore, the method takes into account much more than just species richness.The Simpson’s Diversity value (D) ranges from no diversity at 0.0 to a maximum diversity at1.0. These values have no real meaning themselves but merely are used as a means ofcomparison for different habitats or the same habitat at different times. A large D valueindicates that if you were to go out and collect two organisms from a habitat the odds wouldbe that the two organisms would be different species.Example Calculation of Simpson’s Diversity Index:Wheresn iD = 1 – Σ ( ) 2i=1 Ns = the number of morphotypes (species)i = a given morphotypen i = the number of individuals in morphotype iN = the total number of individuals collected (for all morphotypes)Say:Community A Community BSpecies 1 1000 Species 1 400Species 2 100 Species 2 400Species 3 100 Species 3 400For Community A:s = 3n 1 = 1000n 2 = 100n 3 = 100N = 1200D A = 1 – [(1000/1200) 2 + (100/1200) 2+ (100/1200) 2 ]D A = 0.292For Community B:s = 3n 1 = 400n 2 = 400n 3 = 400N = 1200D B = 1 - [(400/1200) 2 + (400/1200) 2+ (400/1200) 2 ]D B = 0.667
Pre<strong>lab</strong> Question:Use the Simpson’s diversity index to determine which of the following three communities of100 individuals is most diverse. Community 1 contains 10 species, with 91 individuals of thefirst species, and 1 individual of each of the remaining species. Community 2 contains only 5species, with 20 individuals of each. Community 3 contains 10 species, with 18 individualsfrom 2 of the species and 8 individuals from the remaining 8 species.Hypotheses: We will investigate the biodiversity of both plants and animals in 8 locations oncampus: Prairie, Wooded Area, Lawn, Pond Edge, Bioretention Cell 1, Bioretention Cell 2,Bioretention Cell 3, and a Parking Lot Island.Which location do you believe will contain the highest biodiversity in plants? Why?Which location do you believe will contain the highest biodiversity in animals? Why?What do you believe will be the relationship between plant biodiversity and animalbiodiversity? Why?
Part 1: Animal <strong>Biodiversity</strong>Locations to be Tested: Prairie, Wooded Area, Lawn, Pond Edge, Bioretention Cell 1,Bioretention Cell 2, Bioretention Cell 3, Parking Lot IslandSticky Trap Setting Procedure:In the <strong>lab</strong>: Using a Sharpie ® put your name and location at the top of the 3 sticky traps givento you. The top part is the yellow strip at the top with no backing. If the sticky traps are nothole punched, hole punch the middle top portion of the sticky trap so you can hang the trapwith string if you choose to do so.In the field: Go to your location site and place the sticky traps in order within your givenlocation. Place your sticky trap on the ground or secure the trap onto a stick, a wall, a fence, aplant, a rock, etc., 0 to 3 feet from the ground. After setting each trap, remove the wax paperfrom the trap. Return to the site after at least 24 hours to collect the traps.Sticky Trap Collection Procedure:Once 24 hours has elapsed return to the sticky traps to observe any activity that has occurred.Collect the traps and observe the number of different morphotypes present on each trap.Compare your morphotypes with those found in the same location so you and another groupin the same location don’t count the same morphotype twice.Species found by you from the sticky traps.Individual Animal DataDescription of MorphotypeID of Species?Number of thatspecies represented
Animal species found by all the members sampling at your location from the sticky traps.What was your location?Location Animal DataDescription of MorphotypeID of Species?Number of thatspecies represented
Refer to your location data and calculate your location’s Simpson’s Diversity Index below.Part 2: Plant <strong>Biodiversity</strong>Construct a 1 m 2 quadrat around the sticky trap you analyzed. Within this square meter countthe morphotypes of plants that are found in your quadrat. Record this data below.Individual Plant DataNumber of thatDescription of MorphotypeID of Species?species represented
Plant species found by all the members sampling at your location.What was your location?Location Plant DataDescription of MorphotypeID of Species?Number of thatspecies represented
Refer to your location data and calculate your location’s Simpson’s Diversity Index below.Questions & Analysis:1. Fill out the table below.LocationPrairieWooded AreaLawnPond EdgeBioretention Cell 1Bioretention Cell 2Bioretention Cell 3Parking Lot IslandAnimal Simpson’s<strong>Biodiversity</strong> IndexPlant Simpson’s<strong>Biodiversity</strong> Index2. Use the computer to generate a graph of the relationship between plant biodiversity indexand animal biodiversity index. Make sure to attach this graph to your <strong>lab</strong> write-up when youturn it in.3. Describe the general relationship between plant biodiversity index and animal biodiversityindex. Why does this relationship exist?
4. How do the abiotic factors seem to affect the number of species?5. Determine the differences in the Index values from one location to another.a. Describe what is different between the habitats.b. How do you think the moisture, temperature, and any other biotic or abiotic factorsinfluenced your results?6. Design an experiment by which you could evaluate the effect of an invasive plant species,such as purple loosestrife, on songbird diversity, using the Shannon-Weiner Diversity Index.