Tabasco pepper transpiration by the heat dissipation probe ... - UFRB
Tabasco pepper transpiration by the heat dissipation probe ... - UFRB
Tabasco pepper transpiration by the heat dissipation probe ... - UFRB

Create successful ePaper yourself
Turn your PDF publications into a flip-book with our unique Google optimized e-Paper software.
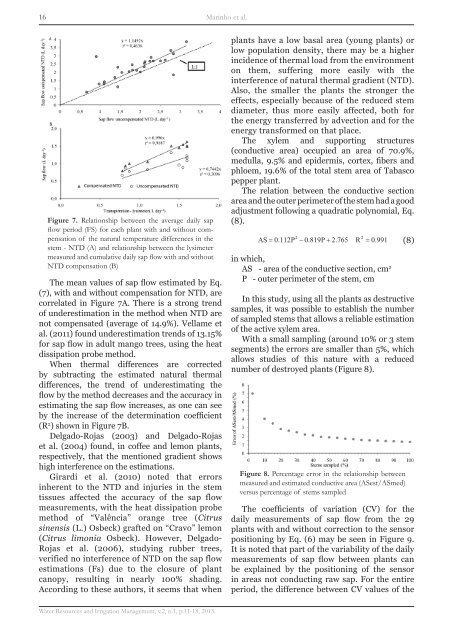
16Marinho et al.Figure 7. Relationship between <strong>the</strong> average daily sapflow period (FS) for each plant with and without compensationof <strong>the</strong> natural temperature differences in <strong>the</strong>stem - NTD (A) and relationship between <strong>the</strong> lysimetermeasured and cumulative daily sap flow with and withoutNTD compensation (B)The mean values of sap flow estimated <strong>by</strong> Eq.(7), with and without compensation for NTD, arecorrelated in Figure 7A. There is a strong trendof underestimation in <strong>the</strong> method when NTD arenot compensated (average of 14.9%). Vellame etal. (2011) found underestimation trends of 13.15%for sap flow in adult mango trees, using <strong>the</strong> <strong>heat</strong><strong>dissipation</strong> <strong>probe</strong> method.When <strong>the</strong>rmal differences are corrected<strong>by</strong> subtracting <strong>the</strong> estimated natural <strong>the</strong>rmaldifferences, <strong>the</strong> trend of underestimating <strong>the</strong>flow <strong>by</strong> <strong>the</strong> method decreases and <strong>the</strong> accuracy inestimating <strong>the</strong> sap flow increases, as one can see<strong>by</strong> <strong>the</strong> increase of <strong>the</strong> determination coefficient(R 2 ) shown in Figure 7B.Delgado-Rojas (2003) and Delgado-Rojaset al. (2004) found, in coffee and lemon plants,respectively, that <strong>the</strong> mentioned gradient showshigh interference on <strong>the</strong> estimations.Girardi et al. (2010) noted that errorsinherent to <strong>the</strong> NTD and injuries in <strong>the</strong> stemtissues affected <strong>the</strong> accuracy of <strong>the</strong> sap flowmeasurements, with <strong>the</strong> <strong>heat</strong> <strong>dissipation</strong> <strong>probe</strong>method of “Valência” orange tree (Citrussinensis (L.) Osbeck) grafted on “Cravo” lemon(Citrus limonia Osbeck). However, Delgado-Rojas et al. (2006), studying rubber trees,verified no interference of NTD on <strong>the</strong> sap flowestimations (Fs) due to <strong>the</strong> closure of plantcanopy, resulting in nearly 100% shading.According to <strong>the</strong>se authors, it seems that whenplants have a low basal area (young plants) orlow population density, <strong>the</strong>re may be a higherincidence of <strong>the</strong>rmal load from <strong>the</strong> environmenton <strong>the</strong>m, suffering more easily with <strong>the</strong>interference of natural <strong>the</strong>rmal gradient (NTD).Also, <strong>the</strong> smaller <strong>the</strong> plants <strong>the</strong> stronger <strong>the</strong>effects, especially because of <strong>the</strong> reduced stemdiameter, thus more easily affected, both for<strong>the</strong> energy transferred <strong>by</strong> advection and for <strong>the</strong>energy transformed on that place.The xylem and supporting structures(conductive area) occupied an area of 70.9%,medulla, 9.5% and epidermis, cortex, fibers andphloem, 19.6% of <strong>the</strong> total stem area of <strong>Tabasco</strong><strong>pepper</strong> plant.The relation between <strong>the</strong> conductive sectionarea and <strong>the</strong> outer perimeter of <strong>the</strong> stem had a goodadjustment following a quadratic polynomial, Eq.(8).2 2AS = 0. 112P − 0. 819P+ 2. 765 R = 0.991in which,AS - area of <strong>the</strong> conductive section, cm 2P - outer perimeter of <strong>the</strong> stem, cmIn this study, using all <strong>the</strong> plants as destructivesamples, it was possible to establish <strong>the</strong> numberof sampled stems that allows a reliable estimationof <strong>the</strong> active xylem area.With a small sampling (around 10% or 3 stemsegments) <strong>the</strong> errors are smaller than 5%, whichallows studies of this nature with a reducednumber of destroyed plants (Figure 8).Figure 8. Percentage error in <strong>the</strong> relationship betweenmeasured and estimated conductive area (ASest/ASmed)versus percentage of stems sampled(8)The coefficients of variation (CV) for <strong>the</strong>daily measurements of sap flow from <strong>the</strong> 29plants with and without correction to <strong>the</strong> sensorpositioning <strong>by</strong> Eq. (6) may be seen in Figure 9.It is noted that part of <strong>the</strong> variability of <strong>the</strong> dailymeasurements of sap flow between plants canbe explained <strong>by</strong> <strong>the</strong> positioning of <strong>the</strong> sensorin areas not conducting raw sap. For <strong>the</strong> entireperiod, <strong>the</strong> difference between CV values of <strong>the</strong>Water Resources and Irrigation Management, v.2, n.1, p.11-18, 2013.