Validation of the USCOM-1A cardiac output monitor in ...
Validation of the USCOM-1A cardiac output monitor in ...
Validation of the USCOM-1A cardiac output monitor in ...

Create successful ePaper yourself
Turn your PDF publications into a flip-book with our unique Google optimized e-Paper software.
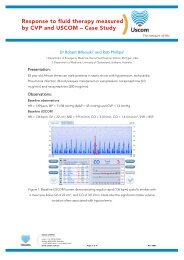
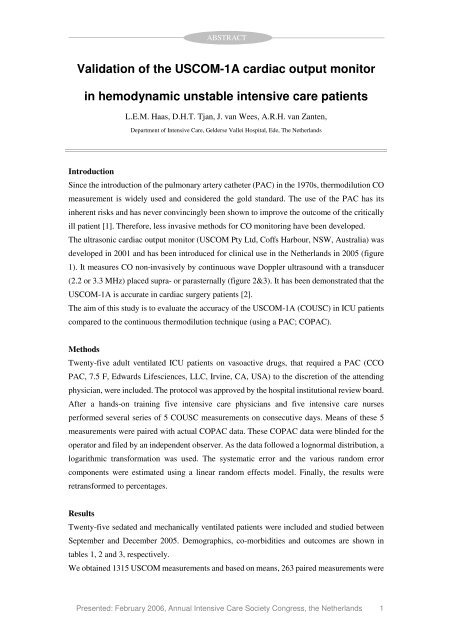
ABSTRACT<strong>Validation</strong> <strong>of</strong> <strong>the</strong> <strong>USCOM</strong>-<strong>1A</strong> <strong>cardiac</strong> <strong>output</strong> <strong>monitor</strong><strong>in</strong> hemodynamic unstable <strong>in</strong>tensive care patientsL.E.M. Haas, D.H.T. Tjan, J. van Wees, A.R.H. van Zanten,Department <strong>of</strong> Intensive Care, Gelderse Vallei Hospital, Ede, The Ne<strong>the</strong>rlandsIntroductionS<strong>in</strong>ce <strong>the</strong> <strong>in</strong>troduction <strong>of</strong> <strong>the</strong> pulmonary artery ca<strong>the</strong>ter (PAC) <strong>in</strong> <strong>the</strong> 1970s, <strong>the</strong>rmodilution COmeasurement is widely used and considered <strong>the</strong> gold standard. The use <strong>of</strong> <strong>the</strong> PAC has its<strong>in</strong>herent risks and has never conv<strong>in</strong>c<strong>in</strong>gly been shown to improve <strong>the</strong> outcome <strong>of</strong> <strong>the</strong> criticallyill patient [1]. Therefore, less <strong>in</strong>vasive methods for CO <strong>monitor</strong><strong>in</strong>g have been developed.The ultrasonic <strong>cardiac</strong> <strong>output</strong> <strong>monitor</strong> (<strong>USCOM</strong> Pty Ltd, C<strong>of</strong>fs Harbour, NSW, Australia) wasdeveloped <strong>in</strong> 2001 and has been <strong>in</strong>troduced for cl<strong>in</strong>ical use <strong>in</strong> <strong>the</strong> Ne<strong>the</strong>rlands <strong>in</strong> 2005 (figure1). It measures CO non-<strong>in</strong>vasively by cont<strong>in</strong>uous wave Doppler ultrasound with a transducer(2.2 or 3.3 MHz) placed supra- or parasternally (figure 2&3). It has been demonstrated that <strong>the</strong><strong>USCOM</strong>-<strong>1A</strong> is accurate <strong>in</strong> <strong>cardiac</strong> surgery patients [2].The aim <strong>of</strong> this study is to evaluate <strong>the</strong> accuracy <strong>of</strong> <strong>the</strong> <strong>USCOM</strong>-<strong>1A</strong> (COUSC) <strong>in</strong> ICU patientscompared to <strong>the</strong> cont<strong>in</strong>uous <strong>the</strong>rmodilution technique (us<strong>in</strong>g a PAC; COPAC).MethodsTwenty-five adult ventilated ICU patients on vasoactive drugs, that required a PAC (CCOPAC, 7.5 F, Edwards Lifesciences, LLC, Irv<strong>in</strong>e, CA, USA) to <strong>the</strong> discretion <strong>of</strong> <strong>the</strong> attend<strong>in</strong>gphysician, were <strong>in</strong>cluded. The protocol was approved by <strong>the</strong> hospital <strong>in</strong>stitutional review board.After a hands-on tra<strong>in</strong><strong>in</strong>g five <strong>in</strong>tensive care physicians and five <strong>in</strong>tensive care nursesperformed several series <strong>of</strong> 5 COUSC measurements on consecutive days. Means <strong>of</strong> <strong>the</strong>se 5measurements were paired with actual COPAC data. These COPAC data were bl<strong>in</strong>ded for <strong>the</strong>operator and filed by an <strong>in</strong>dependent observer. As <strong>the</strong> data followed a lognormal distribution, alogarithmic transformation was used. The systematic error and <strong>the</strong> various random errorcomponents were estimated us<strong>in</strong>g a l<strong>in</strong>ear random effects model. F<strong>in</strong>ally, <strong>the</strong> results wereretransformed to percentages.ResultsTwenty-five sedated and mechanically ventilated patients were <strong>in</strong>cluded and studied betweenSeptember and December 2005. Demographics, co-morbidities and outcomes are shown <strong>in</strong>tables 1, 2 and 3, respectively.We obta<strong>in</strong>ed 1315 <strong>USCOM</strong> measurements and based on means, 263 paired measurements werePresented: February 2006, Annual Intensive Care Society Congress, <strong>the</strong> Ne<strong>the</strong>rlands 1
analysed for bias, precision and correlation. We measured CO <strong>in</strong> a range <strong>of</strong> 1.1-11.0 l/m<strong>in</strong>(mean CO 6.0 ± 1.9, median 5.8 l/m<strong>in</strong>). The correlation over <strong>the</strong> CO range between <strong>the</strong> twotechniques is shown <strong>in</strong> figure 4. Correlation <strong>of</strong> COPAC vs. COUSC is good (correlationcoefficient r = 0,8024 and r2 = 0,6438).The accuracy is depicted <strong>in</strong> figure 5 us<strong>in</strong>g Bland-Altman analysis. Individual comparisons areshown <strong>in</strong> figure 6. The overall coefficient <strong>of</strong> variation is 17%. This means that 95% <strong>of</strong> errors areless than 34%. Random effect model error comprises a <strong>in</strong>ter-operator variability <strong>of</strong> 7.7%, a<strong>in</strong>ter-patient variability <strong>of</strong> 8.8% and residual variability <strong>of</strong> 14%. Fur<strong>the</strong>r correction for <strong>the</strong>systematic error was performed, but did not change results. The error is greatest at high flows,where <strong>USCOM</strong> underestimated <strong>the</strong> CO (by up to 30%), but is acceptable <strong>in</strong> <strong>the</strong> cl<strong>in</strong>icallyimportant range. Temperature and gender did not <strong>in</strong>fluence <strong>the</strong> correlation. We found asignificant relation <strong>of</strong> <strong>the</strong> CO with <strong>the</strong> body mass <strong>in</strong>dex (BMI) (p=0.03). A s<strong>in</strong>gle po<strong>in</strong>t <strong>in</strong>crease<strong>of</strong> BMI corresponds with 1% <strong>in</strong>crease <strong>of</strong> COUSC. Correction for BMI only marg<strong>in</strong>ally reduces<strong>the</strong> total error from 17% to 16%. In all patients similar circulatory pr<strong>of</strong>iles were found withPAC and <strong>USCOM</strong>Patients (Pts) and Methods:We studied 7 pts with CRT (mean age 70±8) with <strong>the</strong> mean EF (24±9%) at recruitment. A VOwas first performed by an echo physician us<strong>in</strong>g <strong>the</strong> Ritter’s formula. After determ<strong>in</strong><strong>in</strong>g <strong>the</strong>optimal AV <strong>in</strong>terval, <strong>the</strong> highest Doppler trans-aortic flow determ<strong>in</strong>ed CO and <strong>the</strong> highest MDfrom <strong>the</strong> aortic Doppler at 11 VV <strong>in</strong>tervals (RV80, RV60, RV40, RV20, RV12, 0 LV12, LV20,LV40, LV60 and LV80) <strong>in</strong> random sequence by <strong>the</strong> same echo physician and a nurse whowere bl<strong>in</strong>d to <strong>the</strong> sequence.Results:The Doppler and <strong>USCOM</strong> determ<strong>in</strong>ed VVI were all with<strong>in</strong> 20ms. 5 pts (71%) had 100%concordant <strong>in</strong> VV <strong>in</strong>terval, <strong>the</strong> rema<strong>in</strong><strong>in</strong>g 2 pts had VVI difference with<strong>in</strong> 20ms. The <strong>USCOM</strong>determ<strong>in</strong>ed VVI were well correlated with <strong>the</strong> Doppler determ<strong>in</strong>ed VVI. (r2 0.92, p
Figure 1: <strong>USCOM</strong> <strong>monitor</strong>Figure 2: Anatomic position for <strong>USCOM</strong> CO measurementsPresented: February 2006, Annual Intensive Care Society Congress, <strong>the</strong> Ne<strong>the</strong>rlands 3
Figure 3: Flow pr<strong>of</strong>ilePresented: February 2006, Annual Intensive Care Society Congress, <strong>the</strong> Ne<strong>the</strong>rlands 4
Table 2: Co-morbidities (N = 25)Table 1: Demographics (N = 25)Table 3: Outcome (N = 25)Presented: February 2006, Annual Intensive Care Society Congress, <strong>the</strong> Ne<strong>the</strong>rlands 5
Figure 4: Correlation between <strong>the</strong> COUSC <strong>monitor</strong> and COPACFigure 5: Bland-Altman plot <strong>of</strong> errors <strong>of</strong> COUSC <strong>monitor</strong> vs. COPACPresented: February 2006, Annual Intensive Care Society Congress, <strong>the</strong> Ne<strong>the</strong>rlands 6
Figure 6: Cardiac Output <strong>in</strong> <strong>in</strong>dividual patients compar<strong>in</strong>g PAC vs. <strong>USCOM</strong>Figure 7: Diagnosis <strong>of</strong> shock states compar<strong>in</strong>g cl<strong>in</strong>ical suspicion with PAC vs. <strong>USCOM</strong>Presented: February 2006, Annual Intensive Care Society Congress, <strong>the</strong> Ne<strong>the</strong>rlands 7
References1 Harvey S, Harrison DA, S<strong>in</strong>ger M, Ashcr<strong>of</strong>t J, Jones CM, Elbourne D, Brampton W, Williams D,Young D, Rowan K; PAC-Man study collaboration. Assessment <strong>of</strong> <strong>the</strong> cl<strong>in</strong>ical effectiveness <strong>of</strong>pulmonary artery ca<strong>the</strong>ters <strong>in</strong> management <strong>of</strong> patients <strong>in</strong> <strong>in</strong>tensive care (PAC-Man): a randomisedcontrolled trial. Lancet 2005; 366:472-77.2 Tan HL, P<strong>in</strong>der M, Parsons R, Roberts B, Heerden PV. Cl<strong>in</strong>ical evaluation <strong>of</strong> <strong>USCOM</strong> ultrasonic<strong>cardiac</strong> <strong>output</strong> <strong>monitor</strong> <strong>in</strong> <strong>cardiac</strong> surgical patients <strong>in</strong> <strong>in</strong>tensive care unit. Br J Anaesth 2005; 94:287-91.Presented: February 2006, Annual Intensive Care Society Congress, <strong>the</strong> Ne<strong>the</strong>rlands 8