Operations Research, 2010 - Wayne State University
Operations Research, 2010 - Wayne State University
Operations Research, 2010 - Wayne State University

You also want an ePaper? Increase the reach of your titles
YUMPU automatically turns print PDFs into web optimized ePapers that Google loves.
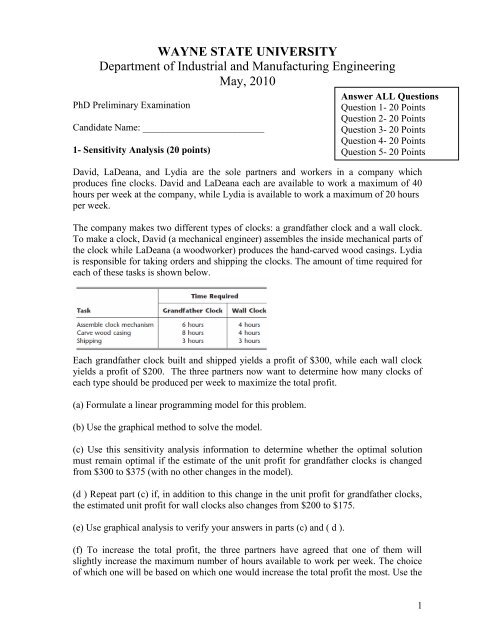
WAYNE STATE UNIVERSITYDepartment of Industrial and Manufacturing EngineeringMay, <strong>2010</strong>PhD Preliminary ExaminationCandidate Name: _________________________1- Sensitivity Analysis (20 points)Answer ALL QuestionsQuestion 1- 20 PointsQuestion 2- 20 PointsQuestion 3- 20 PointsQuestion 4- 20 PointsQuestion 5- 20 PointsDavid, LaDeana, and Lydia are the sole partners and workers in a company whichproduces fine clocks. David and LaDeana each are available to work a maximum of 40hours per week at the company, while Lydia is available to work a maximum of 20 hoursper week.The company makes two different types of clocks: a grandfather clock and a wall clock.To make a clock, David (a mechanical engineer) assembles the inside mechanical parts ofthe clock while LaDeana (a woodworker) produces the hand-carved wood casings. Lydiais responsible for taking orders and shipping the clocks. The amount of time required foreach of these tasks is shown below.Each grandfather clock built and shipped yields a profit of $300, while each wall clockyields a profit of $200. The three partners now want to determine how many clocks ofeach type should be produced per week to maximize the total profit.(a) Formulate a linear programming model for this problem.(b) Use the graphical method to solve the model.(c) Use this sensitivity analysis information to determine whether the optimal solutionmust remain optimal if the estimate of the unit profit for grandfather clocks is changedfrom $300 to $375 (with no other changes in the model).(d ) Repeat part (c) if, in addition to this change in the unit profit for grandfather clocks,the estimated unit profit for wall clocks also changes from $200 to $175.(e) Use graphical analysis to verify your answers in parts (c) and ( d ).(f) To increase the total profit, the three partners have agreed that one of them willslightly increase the maximum number of hours available to work per week. The choiceof which one will be based on which one would increase the total profit the most. Use the1
sensitivity analysis information to make this choice. (Assume no change in the originalestimates of the unit profits.)(g) Explain why one of the shadow prices is equal to zero.(h) Can the shadow prices given in the sensitivity analysis information be validly used todetermine the effect if Lydia were to change her maximum number of hours available towork per week from 20 to 25? If so, what would be the increase in the total profit?(i) Repeat part ( h) if, in addition to the change for Lydia, David also were to change hismaximum number of hours available to work per week from 40 to 35.(j) Use graphical analysis to verify your answer in part (i).2
2- Queuing Theory (20 points)Solve the following independent problems.2.A. Trucks arrive at a warehouse according to a Poisson process with a mean rate of 4per hour. Only one truck can be loaded at a time. The time required to load a truck has anexponential distribution with a mean of 10/n minutes, where n is the number of loaders (n= 1, 2, 3, . . .). The costs are (i) $18 per hour for each loader and (ii) $20 per hour for eachtruck being loaded or waiting in line to be loaded. Determine the number of loaders thatminimizes the expected hourly cost.2.B. Antonio runs a shoe repair store by himself. Customers arrive to bring a pair ofshoes to be repaired according to a Poisson process at a mean rate of 1 per hour. The timeAntonio requires to repair each individual shoe has an exponential distribution with amean of 15 minutes.(a) Consider the formulation of this queueing system where the individual shoes (notpairs of shoes) are considered to be the customers. For this formulation, construct the ratediagram and develop the balance equations, but do not solve further.(b) Now consider the formulation of this queueing system where the pairs of shoes areconsidered to be the customers. Identify the specific queueing model that fits thisformulation.(c) Calculate the expected number of pairs of shoes in the shop.(d) Calculate the expected amount of time from when a customer drops off a pair of shoesuntil they are repaired and ready to be picked up.2.C. Consider a queueing system with two types of customers. Type 1 customers arriveaccording to a Poisson process with a mean rate of 5 per hour. Type 2 customers alsoarrive according to a Poisson process with a mean rate of 5 per hour. The system has twoservers, both of which serve both types of customers. For both types, service times havean exponential distribution with a mean of 10 minutes. Service is provided on a firstcome-first-servedbasis.(a) What is the probability distribution (including its mean) of the time betweenconsecutive arrivals of customers of any type?(b) When a particular type 2 customer arrives, she finds two type 1 customers there in theprocess of being served but no other customers in the system. What is the probabilitydistribution (including its mean) of this type 2 customer’s waiting time in the queue?3
3- IP Problem Formulation: (20 points)The Fly-Right Airplane Company builds small jet airplanes to sell to corporations for theuse of their executives. To meet the needs of these executives, the company’s customerssometimes order a custom design of the airplanes being purchased. When this occurs, asubstantial start-up cost is incurred to initiate the production of these airplanes.Fly-Right has recently received purchase requests from three customers with shortdeadlines. However, because the company’s production facilities already are almostcompletely tied up filling previous orders, it will not be able to accept all three orders.Therefore, a decision now needs to be made on the number of airplanes the company willagree to produce (if any) for each of the three customers.The relevant data are given in the next table. The first row gives the start-up cost requiredto initiate the production of the airplanes for each customer. Once production is underway, the marginal net revenue (which is the purchase price minus the marginalproduction cost) from each airplane produced is shown in the second row. The third rowgives the percentage of the available production capacity that would be used for eachairplane produced. The last row indicates the maximum number of airplanes requestedby each customer (but less will be accepted).Fly-Right now wants to determine how many airplanes to produce for each customer (ifany) to maximize the company’s total profit (total net revenue minus start-up costs).(a) Formulate a model with both integer variables and binary variables for this problem.A more detailed analysis of the various cost and revenue factors now has revealed thatthe potential profit from producing airplanes for each customer cannot be expressedsimply in terms of a start-up cost and a fixed marginal net revenue per airplane produced.Instead, the profits are given by the following table.(b) Formulate a BIP model for this problem that includes constraints for mutuallyexclusive alternatives.(c) Formulate another BIP model for this model that includes constraints for contingentdecisions.4
4- Decision Analysis (20 points)Dr. Switzer has a seriously ill patient but has had trouble diagnosing the specific cause ofthe illness. The doctor now has narrowed the cause down to two alternatives: disease A ordisease B. Based on the evidence so far, she feels that the two alternatives are equallylikely.Beyond the testing already done, there is no test available to determine if the cause isdisease B. One test is available for disease A, but it has two major problems. First, it isvery expensive. Second, it is somewhat unreliable, giving an accurate result only 80percent of the time. Thus, it will give a positive result (indicating disease A) for only 80percent of patients who have disease A, whereas it will give a positive result for 20percent of patients who actually have disease B instead.Disease B is a very serious disease with no known treatment. It is sometimes fatal, andthose who survive remain in poor health with a poor quality of life thereafter. Theprognosis is similar for victims of disease A if it is left untreated. However, there is afairly expensive treatment available that eliminates the danger for those with disease A,and it may return them to good health. Unfortunately, it is a relatively radical treatmentthat always leads to death if the patient actually has disease B instead.The probability distribution for the prognosis for this patient is given for each case in thefollowing table, where the column headings (after the first one) indicate the disease forthe patient.The patient has assigned the following utilities to the possible outcomes:In addition, these utilities should be incremented by -2 if the patient incurs the cost of thetest for disease A and by -1 if the patient (or the patient’s estate) incurs the cost of thetreatment for disease A.Use decision analysis with a complete decision tree to determine if the patient shouldundergo the test for disease A and then how to proceed (receive the treatment for diseaseA?) to maximize the patient’s expected utility.5
5- LP(Linear Programming) Problem (20 points)The Audiofile Company produces boomboxes. However, management has decided tosubcontract out the production of the speakers needed for the boomboxes. Three vendorsare available to supply the speakers. Their price for each shipment of 1,000 speakers isshown below.In addition, each vendor would charge a shipping cost. Each shipment would go to one ofthe company’s two warehouses. Each vendor has its own formula for calculating thisshipping cost based on the mileage to the warehouse. These formulas and the mileagedata are shown below.Whenever one of the company’s two factories needs a shipment of speakers to assembleinto the boomboxes, the company hires a trucker to bring the shipment in from one of thewarehouses. The cost per shipment is given in the next column, along with the number ofshipments needed per month at each factory.Each vendor is able to supply as many as 10 shipments per month. However, because ofshipping limitations, each vendor is able to send a maximum of only 6 shipments permonth to each warehouse. Similarly, each warehouse is able to send a maximum of only6 shipments per month to each factory. Management now wants to develop a plan foreach month regarding how many shipments (if any) to order from each vendor, howmany of those shipments should go to each warehouse, and then how many shipmentseach warehouse should send to each factory. The objective is to minimize the sum of the6
purchase costs (including the shipping charge) and the shipping costs from thewarehouses to the factories.(a) Draw a network that depicts the company’s supply network. Identify the supplynodes, transshipment nodes, and demand nodes in this network.(b) Formulate this problem as a minimum cost flow problem by inserting all thenecessary data into this network. Also include a dummy demand node that receives (atzero cost) all the unused supply capacity at the vendors.7