ferro alloys - International Manganese Institute
ferro alloys - International Manganese Institute
ferro alloys - International Manganese Institute

You also want an ePaper? Increase the reach of your titles
YUMPU automatically turns print PDFs into web optimized ePapers that Google loves.
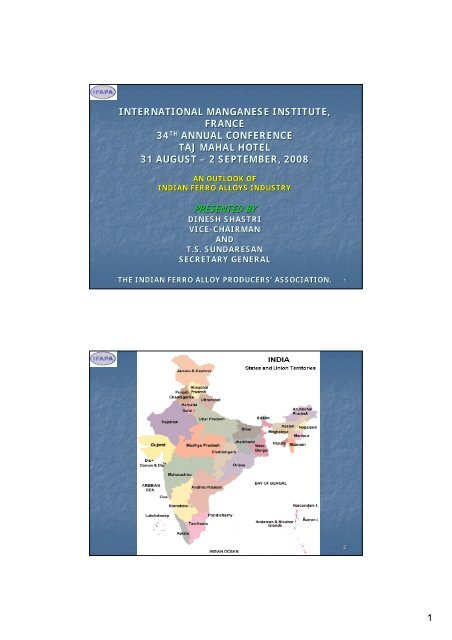
INTERNATIONAL MANGANESE INSTITUTE,FRANCE34 TH ANNUAL CONFERENCETAJ MAHAL HOTEL31 AUGUST – 2 SEPTEMBER, 2008AN OUTLOOK OFINDIAN FERRO ALLOYS INDUSTRYPRESENTED BYDINESH SHASTRIVICE-CHAIRMANCHAIRMANANDT.S. SUNDARESANSECRETARY GENERALTHE INDIAN FERRO ALLOY PRODUCERS’ ASSOCIATION.121
• FACTS OF INDIA• Official Name:BHARAT (INDIA)• Capital:New Delhi• Population:1.130 billion• Area:3.3 million square kilometers• Coastline Length:7600 Km• Languages:India has two National languages:English (as Official) and Hindi(in Devanagiri script).The Indian Constitution also officiallyrecognizes 22 regional languages• Major Religions:Hinduism, Islam, Christianity,Buddhism, Sikhism, Jainism• Literacy: 65.38 %• President:Mrs. Pratibha Patil• Prime Minister:Dr. Manmohan Singh• National Currency:Rupee (One Rupee = 100 Paise)3INDIA’S S ECONOMY - OVERVIEW:• India's diverse economy encompasses traditional village farming, modernagriculture, handicrafts, a wide range of modern industries, and amultitude of services. Services are the major source of economic growth,accounting for more than half of India's output.• GDP (purchasing power parity):$2.965 trillion (2007 est.)• GDP (official exchange rate):$1.09 trillion (2007 est.)• GDP - real growth rate:8.5% (2007 est.)• GDP - per capita (PPP):$2,700 (2007 est.)• GDP - composition by sector: agriculture: 16.6%industry: 28.4%services: 55% (2007 est.)• Labor force:516.4 million (2007 est.)• Industrial production growth rate:10% (2007 est.)• Electricity - production: 661.6 billion kWh (2005)• Oil - production:834,600 bbl/day (2005 est.)• Natural gas – production:28.68 billion cu m (2005 est.)• Exports:$140.8 billion f.o.b. (2007 est.)• Imports:$224.1 billion f.o.b. (2007 est.)• Reserves of foreign exchange & gold:$239.4 billion(31 Dec 2007est)Source: Government Library/Publications42
STEEL5STEEL PRODUCTION AND CAPACITY ININDIAIn Million TonnesCRUDE STEEL2005-06062006-07072007-0808(Provisional)Production46.4650.8253.90Capacity51.1756.8459.00CapacityUtilistion (%)918991Source: Joint Plant Committee63
STEEL PRODUCTION – INDIAIn Million TonnesYEARMAINPRODUCERSSECONDARYPRODUCERSTOTAL2005-0606 21.694 24.766 46.4602006-0707 22.177 28.640 50.8172007-08(p)08(p) 22.104 31.800 53.904Source: Joint Plant Committee7STEEL CONSUMPTION IN INDIAIn Million TonnesFINISHED STEEL2006-072005-062007-0808(Provisional)Production for sale46.5752.5355.26Imports4.314.936.92Exports4.805.245.05Consumption41.4346.7851.48Source: Joint Plant Committee84
NEW CAPACITY ANNOUNCEMENT• UNITSM.TONNES• ARCELOR MITTAL 24.0 (Orissa 12, Jharkand 12)• BUSHAN STEEL4.5 (Orissa)• ESSAR STEEL 12.0 (Orissa 6, Jharkand 3, Chattisgarh 3)• ISPAT 5.0 (Jharkand(Jharkand)• JAI BALAJI5.0 (West Bengal)• JINDAL STEEL 26.0 (Jharkand(Jharkand, Chattisgarh, , Orissa)• JSPL 19.0 (Jharkand(6, Orissa 6, Chattisgarh 3)• POSCO12.0 (Orissa)• SAIL 10.0• TATA STEEL 28.0 (Jharkand(12, Orissa 6, Chattisgarh 5)• UTTAM GALVA 4.0• VIZAG STEEL 12.0---------------161.5 (Expected to touch 124 M.T by 2012)---------Source: Annual Reports & Market Reports9PROJECTION - CRUDE STEEL PRODUCTION (INDIA)(Million Tonnes)• Producer/Route 2008-0909 2009-102010-1111 2011-1212• A) Oxygen Route• 1) SAIL (Incl. VISL) 15.81 15.93 19.48 21.53• 2) RINL 4.20 5.30 6.60 7.60• 3) TSL 6.00 7.00 8.00 9.00• 4) JINDAL:• a) Corex-BOF1.50 1.50 1.50 1.50• b) BF-BOFBOF 2.20 3.00 3.50 4.00• c) MBF-EOF0.70 0.70 0.80 0.80• TOTAL OXYGEN ROUTE 30.41 33.43 39.88 44.43• B) Electric Furnace (EF) Route• 1) SAIL (ASP & SSP) 0.18 0.65 0.65 0.65• 2) Other EAF Units 10.12 10.45 11.25 12.15• Induction Furnace Units 9.50 10.00 10.50 11.00• B) TOTAL EF ROUTE 19.80 21.10 22.40 23.80• C) NEW UNITS PROPOSED 6.00 8.00 10.00 12.00• D) GRAND TOTAL A+B+C 56.21 62.53 72.28 80.23105
STAINLESS STEEL11INDIAN STAINLESS STEEL OUTLOOK• INDIA WITH APPARENT CONSUMPTION OF 1.2 MN.TONNESPLACED 7 TH IN TERMS OF GLOBAL STAINLESS STEELCONSUMPTION• INDIAN CONSUMPTION GROWTH OVER LAST DECADE AT 13%.• INDIAN PER CAPITA CONSUMPTION OF STAINLESS STEEL OF 1.1KG IS FAR LOWER THAN CHINA 4.1 KG & DEVELOPED COUNTRIESIN THE RANGE OF 15-20 KG.• POTENTIAL FOR HIGH GROWTH-- HIGHER EXPECTED GROWTH IN GDP & INDUSTRIALPRODUCTION-EXISTING LOW PER CAPITA CONSUMPTION-AVAILABILITY OF KEY NATURAL RESOURCES LIKE MN.ORE ANDCR.ORE-LOW MAN POWER COST-INCREASING BUYING POWER• DEMAND EXPECTED TO GROW BY 12% ANNUALLY126
PROJECTED SS DEMAND IN INDIAIN ‘000 TONNES• YEARFLATLONGTOTAL• 2005 1001 153 1154• 2010 1685 373 2058• 2015 3185 900 4085• GROWTH 11.5% 17.5% 12.3%• SOURCE: ISSDA MARKET RESEARCH13FERRO ALLOYS147
Demand Drivers for Ferro AlloysFerro Alloys are used primarily in steel making as deoxidantand alloying agent. Depending upon the process of steelmaking and the product quality envisaged, the requirement ofFerro Alloys varies widely.Demand Driver of Ferro Alloys:Crude Steel ProductionAlloy Steel ProductionStainless Steel Production15Introduction‣ PART OF CORE SECTOR UNDER MINISTRY OF STEEL‣ SUPPLYING CRUCIAL INTERMEDIATES TO STEEL INDUSTRY‣ COMPLETED FOUR DECADES‣ BULK FERRO ALLOYS AND NOBLE FERRO ALLOYS‣ USED IN THE PRODUCTION OF STEEL AS DE-OXIDANT ANDALLOYING AGENTS‣ PRINCIPAL FUNCTION OF THE ALLOYS ADDITION,INCREASES CORROSION OR OXIDATION RESISTANCE,HARDENABILITY, TENSILE STRENGTH AT HIGHTEMPERATURE, WEAR AND ABRASION RESISTANCE WITHADDED CARBON, INCREASES OTHER RELATED PROPERTIESIN THE STEEL, SUCH AS CREEP, STRENGTH, ETC.168
Performance Review36%Capacity (in Million Tonnes)5%<strong>Manganese</strong> Alloys2.101%Ferro Silicon0.20Chrome Alloys1.3058%FeSiNoble Fe AlloysMn AlloysFeCrNoble Ferro AlloysTOTAL0.043.6417REGION-WISE CAPACITIES• ALLOYS/PARTICULARSEASTWESTCENTRALNORTHSOUTHINDIA• (1) BULK FERRO ALLOYS• MANGANESE ALLOYSCapacity (MVA) 467.55 192.1 330.50 - 192.20 1182No. of Furnaces 66 18 58 - 19 161No. of Units 29 8 30 - 9 76• FERRO SILICONCapacity (MVA) 149.40 5 5 8.1 98.50 266No. of Furnaces 19 1 1 3 14 38No. of Units 15 1 1 3 9 29• CHROME ALLOYSCapacity (MVA) 614.50 24 49.40 12.075 103.80 803.375No. of Furnaces 29 1 6 5 12 53No. of Units 15 1 4 4 4 28• TOTAL (BULK FERRO ALLOYS)Capacity (MVA) 1230.45 221.1 384.9 20.175 394.5 2251.375No. of Furnaces 114 20 65 8 45 252No. of Units 59 10 35 7 22 133• (2) NOBLE FERRO ALLOYSNo. of Units 14 12 2 4 5 37189
Production PerformanceQuantity in Tonnes(A) BULK FERRO ALLOYS 2007-08(p)08(p) 2006-0707 2005-0606• HC Ferro <strong>Manganese</strong> 377,958 281,013 256,121• MC Ferro <strong>Manganese</strong> 7,517 9,190 11,796• LC Ferro <strong>Manganese</strong> 5,735 6,523 5,140• Silico <strong>Manganese</strong> 861,101 738,314 564,633• MC Silico <strong>Manganese</strong> 32,541 29,581 27,739• LC Silico <strong>Manganese</strong> 17,760 15,067 4,000• Ferro Silicon 83,716 92,632 90,652• HC Ferro Chrome 948,366 801,138 662,062• LC Ferro Chrome 235 230 235• SUB TOTAL (A) 2,334,929 1,973,688 1,622,37819• B) NOBLE FERRO ALLOYS 2007-0808(p)2006-0707 2005-0606• Ferro Molybdenum 2,899 3,120 2,827• Ferro Vanadium 1,585 1,139 877• Ferro Tungsten 51 54 63• Ferro Silicon Magnesium 13,525 11,387 11,171• Ferro Aluminium 9,377 9,947 7,214• Ferro Silico Zirconium 109 178 87• Ferro Titanium 1,837 1,761 735• Ferro Boron 80 80 75• Ferro Nickel Magnesium 122 97 -• SUB. TOTAL (B) 29,585 27,763 3 23,049• GRAND TOTAL (A + B) 2,364,514 2,001,451 1,645,427• Percentage of Increase 18% 22% 11%2010
Export PerformanceQuantity in Tonnes(A) BULK FERRO ALLOYS 2007-0808(p)2006-0707 2005-0606• HC Ferro <strong>Manganese</strong> 110,272 49,286 28,258• LC Ferro <strong>Manganese</strong> 85 - -• Silico <strong>Manganese</strong> 262,799 167,882 121,640• MC Silico <strong>Manganese</strong> - 909 1,780• LC Silico <strong>Manganese</strong> - 4,800 -• Ferro Silicon 5,102 458 835• HC Ferro Chrome 520,739 356,112 299,680• LC Ferro Chrome 76 - -• Sub. Total (A) 899,073 579,447 452,19321• (B) NOBLE FERRO ALLOYS• Ferro Molybdenum 10 - -• Ferro Vanadium 32 15 -• Ferro Silicon Magnesium 2,407 584 1,376• Ferro Aluminium 993 738 27• Ferro Silico Zirconium 2 - 2• Ferro Titanium 25 374 2• Sub.Total (B) 3,469 1,711 1,407• Grand Total (A) + (B) 902,542 581,158 453,600• Percentage of increase 55% 28% 16.5%• VALUE OF EXPORTS 43,752 18,962 13,373(RS. IN MILLION)• Percentage of increase 131% 42% (-)) 6 %2211
FERRO ALLOYS – A CASE INCONTRADICTIONExcess Capacity – New CapacityIncreasing cost of basic inputsNon availability of Ore – ImportsHigh Power TariffLower Customs Duty on ImportsGovernment entering into Free Trade Agreementswith other countries.Increase in logistic costs23EXCESS CAPACITYQuantity in ‘Million TonnesCapacityProductionCapacityDuring 2007-0808 Utilization n %• <strong>Manganese</strong> Alloys 2.10 1.30 62• Ferro Silicon 0.20 0.08 40• Chrome Alloys 1.30 0.95 73• Noble Ferro Alloys 0.04 0.03 75• TOTAL 3.64 2.36 652412
Ferro AlloysFerro SiliconTotalIMPORT OF FERRO ALLOYSFerro <strong>Manganese</strong>Silico <strong>Manganese</strong>HC/LC Ferro Chrome/Charge ChromeOther Ferro AlloysPercentage of increase2007-0808(April-Dec.)14,23547369,46512,64013,532110,345-2006-0707127,158In Tonnes12,03720786,83519,0549,02531 %2005-060616,1021,28762,03511,1826,72897,33422 %Total value Rs in Million7,3287,7985,913Percentage of increaseImport Duty-5 %32 %7.50 %29 %10 %NOTE: Import of Ferro Nickel is not shown as the same is notmanufactured indigenously.25MANGANESE OREAs Per Indian Bureau of Mines Survey Report of 1-4-20051Total inferred reserves of <strong>Manganese</strong> Ore - 378 MTProved ReserveProbable ReserveTotal Recoverable Reserves77 MT61 MT- 138 MTFerro <strong>Manganese</strong> Grade5 MTMedium Grade8 MTProved Reserve – Ferro Alloy Grade - 13 MTPresent ProductionOver 2 Million Tonnes• Imports 2007-0808 2006-0707 2005-0606(April-Dec.)438,546 248,202 13,280• Prices of <strong>Manganese</strong> ore reaching historical levels.Source: IBM/Ministry of Commerce2613
CHROME OREAs Per Indian Bureau of Mines Survey Report of 1-4-20051Total inferred reserves of Chrome Ore - 213 MTProved ReserveProbable ReserveTotal Recoverable Reserves31 MT35 MT- 66 MTPresent ProductionAround 3.5 Million Tonnes• Imports 2007-0808 2006-0707 2005-0606(April-Dec.)87,147 4,800 5,100• Prices of Chrome ore are increasing every yearSource: IBM/Ministry of Commerce27REDUCTANTS‣ Coke is the most widely used reductant in FerroAlloy production. Ferro Alloys consume 0.6-0.70.7tonnes of reductants per tonne of production.‣ Domestic Coal and Coke suffers from high Ash andvolatile matter content, resulting in adverse effecton the efficiency of furnace operation.‣ Due to non-availability of Low Ash Low PhosMetallurgical Coke indigenously, the Industry isdependent on imports.‣ Resulting in high and rising Coke cost globally.2814
POWER• Though the generation cost is not high in India, the PowerTariff borne by the Industry is high, because of cross-subsidization to Agricultural Sector, Low Plant Load Factorand High T & D losses.• Electricity Duty, which varies widely from State to State,creates additional burden for the Industry.• Though Power Reforms are on, the impact of thisdevelopment on long-term prices, specifically Powerintensive consumers, such as Ferro Alloy Producers, isdifficult to assess, since the electricity market still seems tobe in a state of flux.• Captive Power generation may hold the key, though capitalinefficient.29INDIAPOWER TARIFFOTHER COUNTRIESSTATESCENTS/COUNTRIESCENTS/KWHKWHANDHRA PRADESH 6-6.566.5 ARGENTINA 1.2CHHATTISGARH 7.0 AUSTRALIA 2.1KARNATAKA 12.0 BRAZIL 3.2KERALA 8.5 CHINA 3.8MAHARASHTRA 9.2-10.0 FINLAND 3.2ORISSA 6.2-7.0 ICELAND 2.1WEST BENGAL 6.5-8.5 KAZAKHSTAN 1.9RUSSIA A 2.1SOUTH AFRICA 2.7UKRAINE 3.03015
IMPORT CUSTOMS DUTYImport Duty on Ferro Alloys120.00%100.00%105.00%80.00%85.00%Axis Title60.00%40.00%50.00%30.00%25.00%20.00%0.00%25.00%20.00%20.00%15.00%10.00%7.50%5.00%0.00%1992‐931993‐941994‐951995‐961996‐971997‐991999‐2003Jan‐04Jul‐04Mar‐05Mar‐0622‐Jan‐0730‐Apr‐0831LOGISTICS COSTSThe Industry produces over 2 million tones ofFerro Alloys annually. Nearly 2.5 to 3 tonnes ofsuch raw materials have to be moved by Railwaywagons for one tonne of Ferro Alloy production.The Industry has been experiencing shortage ofwagons for procuring raw materialsFreight element is very high, thus reducingcompetitiveness of the Industry.Poor infrastructure facilities at Port also leading toberthing delays for ships and longer loading time.3216
India’s s CompetitivenessOrePowerReductantsLogisticsLabourOverall• CIS 2 2 2 3 2 11• China 1 2 3 3 3 12• Europe 1 2 1 3 1 8• India 1 2 2 2 3 10• Japan 1 1 2 3 1 8• South Africa 3 3 2 3 2 13• 1 – Low availability, 2 – Moderate availability, 3 – Advantageousavailability33☯ Indian Economy is growing at an accelerated growth rate of 8-10%. 8☯ Steel Production is expected around 80 million tonnes by 2011-12.12.☯ Welcome sign for Ferro Alloy Industry as consumption of Ferro <strong>alloys</strong> awill increase.☯ Raw Material and Logistics will play a crucial role.☯ Imports of <strong>Manganese</strong> ore and chrome ore will increase.☯ Captive power plants will increase.Conclusion☯ India has the potential to be a major player in the Global Ferro o AlloyIndustry after China in the coming years.☯ Industry’s s dominance in Asian market to rise in future.☯ If export growth rate is not maintained domestic market will beplagued with overcapacity.3417
3518