Hydrogen sulphide removal from biogas by zeolite ... - Mose
Hydrogen sulphide removal from biogas by zeolite ... - Mose
Hydrogen sulphide removal from biogas by zeolite ... - Mose

You also want an ePaper? Increase the reach of your titles
YUMPU automatically turns print PDFs into web optimized ePapers that Google loves.
Chemical Engineering Journal 145 (2008) 86–92Contents lists available at ScienceDirectChemical Engineering Journaljournal homepage: www.elsevier.com/locate/cej<strong>Hydrogen</strong> <strong>sulphide</strong> <strong>removal</strong> <strong>from</strong> <strong>biogas</strong> <strong>by</strong> <strong>zeolite</strong> adsorptionPart I. GCMC molecular simulationsPaolo Cosoli ∗ , Marco Ferrone, Sabrina Pricl, Maurizio FermegliaMolecular Simulation Engineering (MOSE) Laboratory, Department of Chemical, Environmental and Raw Materials Engineering (DICAMP), University of Trieste,Piazzale Europa 1, 34127 Trieste, ItalyarticleinfoabstractArticle history:Received 4 October 2007Received in revised form 9 July 2008Accepted 13 July 2008Keywords:Monte Carlo methodsMolecular simulationBiogas<strong>Hydrogen</strong> <strong>sulphide</strong> <strong>removal</strong>In this work Grand Canonical Monte Carlo (GCMC) simulations have been used to study hydrogen sulfide(H 2 S) <strong>removal</strong> <strong>from</strong> <strong>biogas</strong> streams <strong>by</strong> different <strong>zeolite</strong>s such as FAU (Faujasite, NaX and NaY), LTA (<strong>zeolite</strong>A (Lynde division, Union Carbide)) and MFI (Zeolite Socony Mobil – five). Additionally, quantum mechanics(QM) molecular simulations have been performed to obtain structures and partial charges of somesorbates. The computational procedure adopted has been validated <strong>by</strong> comparison with experimentaldata available for H 2 S <strong>removal</strong> in atmospheric environment <strong>by</strong> <strong>zeolite</strong> NaY. In order to obtain a prioritylist in terms of both H 2 S isotherms and adsorption selectivity, adsorption simulations for pure H 2 Satlowpressures and for a prototype <strong>biogas</strong> mixture (i.e., CO 2 ,CH 4 , and H 2 S) have been performed and compared.The adsorption mechanisms and competition for accessible adsorption sites in terms of thermodynamicbehavior have been also examined. Overall, the results obtained in this work could be routinely applied todifferent case studies, thus yielding deeper qualitative and quantitative insights into adsorption pollutant<strong>removal</strong> processes in environmental fields.© 2008 Elsevier B.V. All rights reserved.1. IntroductionPollutant <strong>removal</strong> <strong>from</strong> <strong>biogas</strong> is of crucial importance to guaranteebetter performances in <strong>biogas</strong> exploitation processes, andto reduce environmental impact of gaseous emissions. Biogas productionand utilization is constantly increasing, as it represents a“green”, renewable energy, obtainable in a relatively economicalway <strong>from</strong> anaerobic digestion [1–6]. Nevertheless, one of the mostharmful pollutants, hydrogen sulfide (H 2 S), is a <strong>biogas</strong> component,in a concentration range spanning <strong>from</strong> 10–30 to 1000–2000 ppm.Considering that exposure to a concentration of only 300 ppm for30 min is enough to render a worker unconscious, it is clear thatthis fraction has to be dramatically reduced [1] to the lower toxiclimit (i.e, at least 10 ppm [1,7]).In some cases, aerobic biological processes, catalytic or oxidativeprocesses can be used [8,9]; the use of adsorption processes,exploiting various types of adsorbents, is also widespread [10,11].Zeolite materials are particularly suitable for adsorption <strong>removal</strong>processes [11–14], <strong>by</strong> virtue of their high selectivity and compatibilitytowards polar compounds, such as H 2 S. Hydrophilic <strong>zeolite</strong>s,with a high content of Al in their tetrahedrical framework, are∗ Corresponding author. Tel.: +39 040 558 3757; fax: +39 040 569823.E-mail address: paolo.cosoli@dicamp.units.it (P. Cosoli).generally more appropriate for polar molecules adsorption, whilehydrophobic <strong>zeolite</strong>s are effective in the entrapment of apolarmolecules [15]. In this work we investigated the potentialities ofa series of <strong>zeolite</strong>s for H 2 S <strong>removal</strong>, using molecular simulationtechniques such as Grand Canonical Monte Carlo (GCMC) [16], andab initio quantum mechanics (QM).Molecular simulations have become a powerful tool to exploreboth material science and life science fields; accordingly, we believethat these techniques have reached the stage to be successfully –and intensively – employed in environmental applications, determininga gain of time, money savings and the possibility to exploreapplications in an easier way [17]. Thus, in what follows weemployed molecular simulations for ranking a list of selected <strong>zeolite</strong>sin terms of selectivity and adsorption isotherms, giving alsoinsights on adsorption mechanisms at atomistic level <strong>from</strong> a thermodynamicpoint of view. Relevant experimental data are scarce[12,18], and usually given in terms of pure contaminant adsorptionisotherms. Nevertheless, some studies about H 2 S vapor–liquidequilibria <strong>by</strong> means of molecular simulation techniques are available[19], or about vapor–liquid coexistence of H 2 S in mixtures[20], these works are based upon the Gibbs Ensemble Monte CarloMethod [21].Thus, in order to validate the computational procedure adoptedwe decided to compare our calculation with experimental adsorptionisotherms of pure H 2 S on <strong>zeolite</strong> NaY [12], and to examine1385-8947/$ – see front matter © 2008 Elsevier B.V. All rights reserved.doi:10.1016/j.cej.2008.07.034
P. Cosoli et al. / Chemical Engineering Journal 145 (2008) 86–92 87the differences encountered in a realistic situation, when a <strong>biogas</strong>mixture of CO 2 ,CH 4 , and H 2 S at low pressures is considered. Finally,isosteric heats of adsorption, total energy contributions and energydensities were the selected quantities to investigate adsorptioncompetition at different pressures, and <strong>zeolite</strong> selectivity [22].2. Materials and methodsSimulations were carried out on an Intel bi-processor XEON32bit workstation. We used Sorption and DMol 3 software modulesof Materials Studio (v. 4.0, Accelrys, San Diego, CA, USA), and inhousedeveloped software. Stochastic methods have been describedin our previous work [23] or elsewhere [24,25]; hence, here we willonly briefly describe Metropolis [16] and Configurational Bias [26]methods.Generally speaking, during a sorption simulation the chemicalpotential is kept fixed, creating a certain number of configurationsof molecules to be adsorbed on a given framework. In theGrand Canonical ensemble, the chemical potentials of all componentsand the temperature are fixed as if the framework is in opencontact with an infinite sorbate reservoir at a given temperature.The reservoir is completely described <strong>by</strong> temperature and fugacityof all components, and does not have to be simulated explicitly.Chemical potentials for each component are related to the fugacity(or partial pressure) f of the components; the reservoir, in thisstudy, is always treated as an ideal-gas system, due to the low bulkpressures taken into account, thus, partial pressures have been considered.Molecules can be created, translated, rotated or destroyed. Equilibriumis reached when temperature and chemical potential ofthe external reservoir (i.e., free gas outside the framework) and theframework are equal. The Metropolis sampling method generateschain of configurations with the ensemble probability. Transforminga configuration involves a random displacement of each atomin the system <strong>from</strong> its actual position; as in this case sorbates areflexible, trajectories are employed (see Additional Information). Atrial move is accepted if it lowers the configuration energy of thesystem. If the configuration energy is increased, trials are acceptedwith a probability proportional to a Boltzmann factor: P =e −U/kT ,where U is the configuration energy difference. Configurationalbias (CBMC) methods are widely used to simulate adsorption ofrather large and flexible molecules. In a CBMC sorption simulation,a bias is introduced towards high energy values, to avoid attemptof sampling configurations with low probabilities, which are likelyto be rejected <strong>by</strong> the acceptance test [26].In this work, adsorbed molecules are rather small if comparedto all <strong>zeolite</strong> pore size; nevertheless, we decided to test both methods.Since the results for <strong>biogas</strong> adsorption isotherms in <strong>zeolite</strong>sobtained with Metropolis Monte Carlo (MMC) and CBMC revealednegligible differences (see Supplementary material), we decidedto adopt the MMC technique, being computationally faster thanCBMC. H 2 S molecular model has been built and optimized at QMdensity functional theory (DFT) [27] level with the DMol 3 module,due to its flexibility and dipole moment; structures of thesymmetrical CH 4 and symmetrical and linear CO 2 molecules havebeen minimized, and partial charges assigned <strong>by</strong> the selectedForce Field, the cvff aug (consistence valence augmented forcefield).Four <strong>zeolite</strong>s were considered: LTA, FAU NaX, FAU NaY, and MFI.The first three frameworks are hydrophilic, and already employedfor H 2 S adsorption [12,28,29]. The last one, MFI, is hydrophobicin nature, and has been taken into account to investigate adsorptiondifferences between these categories. 3D molecular models ofLTA (Si/Al = 1), NaX (Si/Al = 1), NaY (Si/Al = 2.5) and dealuminatedMFI [30] were available in the structural database of Materials Studio.Aluminum substitutions have been performed <strong>by</strong> followingLoewenstein’s rule [31], while Na + ions position has been assigned<strong>by</strong> in-house developed software for identifying potential energyminima and, thus, most probable extra-framework cation positions.An all-atom model has been chosen for calculation; the cvff augwas the potential energy expression of choice in all calculations[32]; a more detailed description of all molecule models is given inAdditional Information. Electrostatic energy terms have been computed<strong>by</strong> the Ewald summation method. van der Waals interactionshave been calculated with the classical Lennard–Jones function[33]; the cut off for van der Waals contribution, has been set to8.5 Å, with an atom based calculations and cubic spline truncation;the cut-off distance should be less than a half of the minor cellside, so when necessary (<strong>zeolite</strong> MFI) we duplicated cells. The cubicspline truncation was set to 1 Å with a buffer of 0.5 Å; in this way,the van der Waals non-bond energy term is splined <strong>from</strong> its fullvalue to zero within a radio of 1 Å. For electrostatic contributions,the accuracy of Ewald and group calculation was 0.001 kcal/molwith the same cut off and buffer. At least 1 × 10 7 productive MonteCarlo steps (i.e. Monte Carlo trial moves), preceded <strong>by</strong> 1 × 10 6 equilibrationsteps, have been performed under 3D periodic boundaryconditions. Overall, we performed and compared MMC for pure H 2 Sadsorption (<strong>from</strong> 10 up to 1000 Pa), and competitive, simultaneousadsorption of H 2 S, CH 4 and CO 2 , with partial pressure in the rangeof a typical <strong>biogas</strong> (CO 2 and CH 4 with low concentrations of H 2 S)and a bulk pressure P total = 1 atm. The simulation temperature wasfixed at 298 K, which is a realistic temperature for a <strong>biogas</strong> exiting<strong>from</strong> a mesophilic process [1,2,6].Adsorption thermodynamics were further investigated analyzingthe values of the isosteric heat of adsorption, Q RF , which is ameasure of adsorption capabilities of a sorbate in an adsorbentframework. Q RF is defined as the difference between the partialmolar enthalpy of the sorbate component in the external reservoir(i.e., free gas) and in the framework; accordingly, it is a measureof the enthalpy change involved in the transfer of a solute <strong>from</strong>the reference state to the adsorbed state at a constant solid phaseconcentration [34]:Q RF = h R − h F (1)Evaluation of Q RF requires the application of Clausius–Clapeyronequation [34]:[ dp] [ d(ln p)]Q RF = (v S − v F )∼= RT (2)d(ln T) d(ln T)where v R and v F are the sorbate partial molar volumes in the reservoirand in the framework, respectively, p the partial pressure, andT the temperature. In the right-hand side term of Eq. (2), the partialmolar volume of the gas molecules in the framework is neglectedwith respect to that in the reservoir, and the gas behavior in thereservoir is assumed to be ideal. This leads to the expression of Q RFin the Grand Canonical ensemble, where the free energy G can becalculated:Q RF = RT − G (3)A further criterion for investigating adsorption is given <strong>by</strong> theanalysis of the total energy components of the system and theenergy distributions. In the first case, the total energy E M of a specificconfiguration of the simulation, M, is given <strong>by</strong> the Coulomb (i.e.,electrostatic) and van der Waals (i.e., dispersion) contributions:E M = E SSM + ESF M + US M (4)where E SSMmolecules, E SFMis the intermolecular energy between the sorbateis the interaction energy between the sorbate
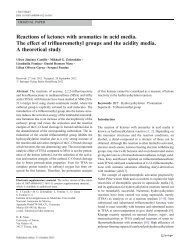
88 P. Cosoli et al. / Chemical Engineering Journal 145 (2008) 86–92Fig. 1. Comparison between experimental adsorption isotherms [12] of H 2 SonNaY(Si/Al = 2.5) (), and GCMC calculated adsorption isotherms (). Lines serve as eyeguides.Fig. 2. Sorption isotherms for pure H 2 S and H 2 S in a <strong>biogas</strong> mixture. Pure H 2 S simulations:(), NaY; (), NaX; (), LTA; (), MFI. Biogas mixture simulations: (♦), NaY;(□), NaX; (○), LTA; (△), MFI. Lines serve as eye guides.molecules and the framework, and U S is the total intramolecularMenergy of the sorbate molecules, as a sum of intramolecular energiesof all sorbates. The intramolecular energy of the framework isnot included as the framework is fixed throughout the simulation.The energy distribution curves for each sorbate express sorbateframeworkinteractions over the entire cell volume; in this case,the interaction energy expressions take the form of Eq. (4) withthe obvious exclusion of the last term U S . In the case of a mixtureMadsorption, the selectivity factor S ij can be also considered, as given<strong>by</strong> [35,36]:S ij =(xix j) ( yjy i)(5)where x i , x j are the molar fractions of species i and j in the gas phase,while y i and y j are the molar fraction of species i and j adsorbed inthe framework.3. Results and discussionInitially, we compared our simulated H 2 S adsorption isothermson <strong>zeolite</strong> NaY at 298 K with the corresponding, available experimentaldata [12]. As shown in Fig. 1, a good agreement is obtained.Small differences may be related, for instance, to the presence ofimpurities in original <strong>zeolite</strong>, and to the possibly different Si/Alratio.Simulation results for <strong>biogas</strong> purification are shown in Fig. 2.Considerably different behaviors for adsorption isotherms of pureFig. 3. H 2 S, CO 2 and CH 4 adsorption isotherms as a function of H 2 S partial pressure in NaY (a), NaX (b), MFI (c), and LTA (d). Symbols legend: (), H 2 S; (), CO 2 ;(), CH 4 .Lines serve as eye guides.
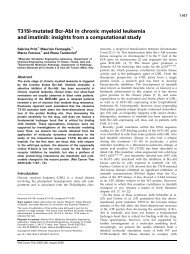
P. Cosoli et al. / Chemical Engineering Journal 145 (2008) 86–92 89Table 1Average values of Q RF for a <strong>biogas</strong> mixture adsorption process, and non-bond energy components relative to adsorption at P H2 S = 1000 PaZeolite Q RF (kcal/mol) Total energy contributions (P H2 S = 1000 Pa) (kcal/mol)H 2 S CO 2 CH 4 van der Waals CoulombFAU NaY 17.9 (0.4) 11.4 (0.1) 7.2 (0.4) −300.3 (9.4) −502.9 (13.0)FAU NaX 15.6 (0.6) 12.3 (0.1) 9.7 (0.1) −302.3 (8.6) −541.1 (14.7)MFI 10.2 (0.4) 9.3 (0.3) 9.1 (0.2) −179.9 (8.2) −0.69 (0.7)LTA 14.5 (0.2) 14.6 (0.1) 9.3 (0.1) −389.7 (9.5) −613.6 (13.8)Standard deviations are reported in parenthesis.H 2 S and for the <strong>biogas</strong> mixture are obtained. These differencesare qualitative, quantitative, and suggest a possible ranking of the<strong>zeolite</strong> performances. Due to the complexity of the systems and,sometimes, to the very low number of H 2 S molecules adsorbed,some difficulties in Monte Carlo samplings may arise; a consequence,isotherms are not always smooth, and the error bars foreach point, resulting <strong>from</strong> running multiple simulations in the sameconditions, are shown to quantify the variability of the predictedvalues. Nevertheless, as expected, the adsorption of H 2 S on thehydrophobic MFI network is always lower than all other <strong>zeolite</strong>s;moreover, the considerable differences in loadings (1–4 orders ofmagnitude) allow a ranking among <strong>zeolite</strong>s to be clearly established.To complement the information on framework selectivity, italso instructive to examine the adsorption curves for CH 4 and CO 2reported in Fig. 3. The isotherms of H 2 S are also shown for comparison.As expected, in hydrophilic <strong>zeolite</strong>s the amount of H 2 Sadsorbed usually increases with increasing H 2 S partial pressure;the isotherms of CH 4 slightly decrease, whilst CO 2 adsorptioncurves remain stable. On the other hand, when considering the apolarMFI framework, the amount of adsorbed H 2 Sisverylow,evenwhen considering pure component adsorption isotherms. During<strong>biogas</strong> adsorption simulations, however, the CH 4 loading remainsstable, while H 2 S adsorption slightly increases at the expenses ofCO 2 .The global results yielded <strong>by</strong> the MMC simulations are quite sensible.In fact, electrostatic interactions between the polar moleculeH 2 S and the framework are more favorable in hydrophilic, ion-rich<strong>zeolite</strong>s; at the same time, the increase of H 2 S partial pressure isdetrimental to the adsorption of the less polar molecule, CH 4 . Thereverse is true when considering the hydrophobic MFI framework,onto which less polar compounds are more favorably attracted, asexpected. Overall, the FAU NaY <strong>zeolite</strong> seems to be characterized<strong>by</strong> the highest selectivity towards H 2 S, and MFI <strong>by</strong> the lowest one.The fact that NaY could be the framework of choice, and not theNaX counterpart, in spite of the higher Si/Al ratio, could be possiblyrationalized <strong>by</strong> invoking greater sterical hindrance imposed <strong>by</strong> thelarger amount of sodium cations and, thus, lower pore dimensionsavailable to H 2 S binding. Analogously, the different pore shape forLTA (with the consequent confinement effects), and the differentcharge distribution which influence sorbate-framework interac-Fig. 4. Energy density distributions for <strong>biogas</strong> mixture adsorption on NaY at P H2 S = 10 Pa (a), NaY at P H2 S = 1000 Pa, MFI at P H2 S = 10 Pa (c), and MFI at P H2 S = 1000 Pa (d).Symbols legend: (······)=H 2 S; (–·–·–) = CH 4 ; (—) = CO 2 .
90 P. Cosoli et al. / Chemical Engineering Journal 145 (2008) 86–92Fig. 5. Selectivity factor for H 2 S with respect to CH 4 (S H2 S,CH 4) (filled symbols) andto CO 2 (S H2 S,CO 2) (open symbols). Symbols legend: (, □), NaY; (, ○), NaX; (, ♦),LTA; (, △), MFI. Lines serve as eye guides.tions can be the main reason for the lower H 2 S loading (with respectto NaX or NaY) when the mixture is taken into account.Examining the simulation results <strong>from</strong> a thermodynamic standpointwe can confirm and further explain these tendencies. Table 1list the calculated isosteric heats Q RF for each species, averagedover different H 2 S input pressures. Table 1 also reports the meantotal non-bond energy components for the Metropolis Monte Carlo(MMC) sorption isotherm of the <strong>biogas</strong> mixture when P H2 S =1000 Pa as an example. Utterly analogous results are obtained atdifferent H 2 S partial pressures. Interestingly, the highly favorablevalues of the electrostatic components reveal that the differentsteric hindrance characterizing the three dimensional structure ofthe <strong>zeolite</strong> frameworks is not the only responsible for <strong>zeolite</strong> selectivity.In fact, given that the three gases do not differ very muchin their molecular volumes (V CO2 = 34.0Å 3 , V H2 S = 30.3Å 3 , andV CH4 = 28.20 Å 3 , respectively), all <strong>zeolite</strong> pore sizes are all ratherlarge if compared to the mean radius of these molecules. Accordingly,the considered <strong>zeolite</strong>s do not seem to behave predominantlyas molecular sieves, but rather their selectivity appears be drivenmainly <strong>by</strong> the electrostatic interactions in terms of total energycontributions.As well evident <strong>from</strong> Table 1, Q RF for H 2 S is always higher thanthe corresponding values for CO 2 and CH 4 when the adsorptiontakes place on polar frameworks; interestingly, however these differencesflatten for the adsorption process onto the apolar <strong>zeolite</strong>.This can be taken as a further piece of evidence that H 2 S adsorptionon FAU (NaY and NaX), and LTA is favored, and increases withincreasing P H2 S.The density distribution profiles for the total energy confirm thesame trend, as the H 2 S curves show the most mean negative valuesin all <strong>zeolite</strong>s except MFI, where this tendency is inverted. Fig. 4illustrates this behavior in the cases of NaY and MFI at P H2 S = 10and 1000 Pa, respectively, as selected examples.Fig. 4 shows different peaks for both NaY–H 2 S and NaY–CH 4energy distributions, a trend confirmed for the other hydrophilic<strong>zeolite</strong>s in the entire H 2 S partial pressure range. CO 2 curves, on thecontrary, exhibit an invariant behavior characterized <strong>by</strong> a Gaussiandistribution. As a rationale, we can say than CH 4 and H 2 S are ableto occupy more that one site, or position, in the framework withdifferent probability, so that adsorption sites can be interchangedas P H2 S increases. MFI curves have only one peak for each gas, andeach peak is close to each other showing no appreciable differencesFig. 6. Density distribution of adsorbed species in MFI (top) and NaY (bottom), P H2 S = 10 Pa (left), and P H2 S = 1000 Pa (right). Molecular color code: red, H 2 S; blue, CH 4 ;green, CO 2 . Density ranges between 0 and 0.3.
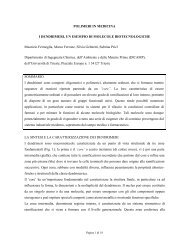
P. Cosoli et al. / Chemical Engineering Journal 145 (2008) 86–92 91in E values. Accordingly, sorption site interchange is more difficultin the MFI apolar framework. To consider more details of adsorptionselectivity, we mapped H 2 S selectivity with respect to CH 4 and CO 2in Fig. 5.Selectivity factors are generally very high in hydrophilic <strong>zeolite</strong>s;again, according to our simulations, the best results are achievedwith NaY. To find a rationale for these selectivity curves is lessstraightforward. As a general observation, they tend to decreasequickly for NaY and LTA; accordingly, selectivity is generally higherat low H 2 S partial pressures, which indicates that sorption selectivitymechanism seems to work better in the typical low rangeof <strong>biogas</strong> H 2 S content. Lower selectivity for NaY and LTA may beexplained <strong>by</strong> the fact that, when P H2 S increases, H 2 S gains newadsorption sites, for which H 2 S is favored over CH 4 and CO 2 , butnot as well as for old adsorption sites, at lower P H2 S. Selectivityfor NaX shows less variation, probably because selectivity valuesat low H 2 S pressures are already quite low. This, in turn, could bedue to the higher steric hindrance exerted <strong>by</strong> the higher numberof cations characterizing this framework. Once again, MFI does notshow selectivity for H 2 S.We also investigated the density fields in the pores of the <strong>zeolite</strong>3D periodic structures (Fig. 6). Although for low P H2 S in somecases, distributions are not symmetrical, it is qualitatively evidenthow H 2 S prevalently substitutes CH 4 in sorption sites (especially inlarger pores). Zeolites NaX and LTA show similar behaviors, whileMFI adsorption site substitutions are much less evident, if at all.4. ConclusionsThe main results of this work confirm that hydrophilic <strong>zeolite</strong>sare more indicated for H 2 S adsorption. Differences arise, asevidences <strong>by</strong> both pure H 2 S and <strong>biogas</strong> mixture adsorption simulations,<strong>from</strong> adsorption site competition.Adsorption isotherms, isosteric heats of adsorption and energydistributions confirm specific trends and explain adsorption behaviors.Results are of remarkable practical use if considered in termsof selectivity, according to which a ranking for the considered<strong>zeolite</strong>s towards H 2 S can be formulated: the FAU NaY frameworkappears the best choice, being favored over NaX, which has essentiallythe same structure but a different Si/Al ratio, ultimatelyresulting in more sterical hindered pores. In this way, a reasonableranking for the best <strong>zeolite</strong> choice has been determined. Itshould be noticed that for some kinds of <strong>zeolite</strong>s, as LTA or MFI,H 2 S is scarcely adsorbed when mixture are considered, this affectsthe shape of adsorption isotherms and, probably, the accuracy ofMonte Carlo sampling. In these cases, further analysis may beperformed to obtain much quantitative results. This can be obviouslydone <strong>by</strong> speeding up calculations or applying new, moreefficient sampling methods, which is out of the scope of the presentwork.AcknowledgementWe like to acknowledge Dr. Roberto Millini for the helpful discussionsand support.Appendix A. Supplementary dataSupplementary data associated with this article can be found,in the online version, at doi:10.1016/j.cej.2008.07.034.References[1] U. Marchaim, Biogas Technology as an Environmental Solution to Pollution,Bull. FAO Agric. Services, Rome, Italy, 1992.[2] R.E. Speece, Anaerobic Biotechnology for Industrial Wastewaters, Archae Press,Nashville, Tennessee, USA, 1996.[3] G. Lettinga, A.F.M. van Velsen, S.W. Hobma, W. de Zeeuw, A. Klapwijk, Useof the upflow sludge blanket (USB) reactor concept for biological wastewatertreatment, especially for anaerobic treatment, Biotech. Bioeng. 22 (1980)699–734.[4] A. van Haandel, M.T. Kato, P.F.F. Cavalcanti, L. Florencio, Anaerobic reactordesign concepts for the treatment of domestic wastewater, Rev. Environ. Sci.Biol./Technol. 5 (2006) 21–38.[5] K. Braber, Anaerobic digestion of municipal solid waste: a modern wastedisposal option on the verge of breakthrough, Biomass Bioenergy 9 (1995)365–376.[6] V.N. Gunaseelan, Anaerobic digestion of biomass for methane production: areview, Biomass Bioenergy 13 (1997) 83–114.[7] T.H. Mil<strong>by</strong>, R.C. Baselt, <strong>Hydrogen</strong> sulfide poisoning: clarification of some controversialissues, Am. J. Ind. Med. 35 (1999) 192–195.[8] S. Nishimura, M. Yoda, Removal of hydrogen <strong>sulphide</strong> <strong>from</strong> ananaerobic <strong>biogas</strong> using a bioscrubber, Water Sci. Technol. 36 (1997)349–356.[9] J.S. Eow, Recovery of sulfur <strong>from</strong> sour acid gas: a review of the technology,Environ. Prog. 21 (2002) 143–162.[10] A. Bagreev, T.J. Bandosz, Study of hydrogen sulfide adsorption on activated carbonsusing inverse gas chromatography at infinite dilution, J. Phys. Chem. B 104(2000) 8841–8847.[11] X. Xiaochun, I. Novochinskii, C. Song, Low-temperature <strong>removal</strong> of H 2 S<strong>by</strong> nanoporous composite of polymer-mesoporous molecular sieve MCM-41 as adsorbent for fuel cell applications, Energy Fuels 19 (2005)2214–2215.[12] A.J. Cruz, J. Pires, A.P. Carvalho, M. Brotas de Carvalho, Physical adsorption ofH 2 S related to the conservation of works of art: the role of the pore structureat low relative pressure, Adsorption 11 (2005) 569–576.[13] C.L. Garcia, J.A. Lercher, Adsorption of H 2 S on ZSM5 <strong>zeolite</strong>s, J. Phys. Chem. 96(1992) 2230–2235.[14] S. Yasyerli, I. Ar, G. Dogu, T. Dogu, Removal of hydrogen sulfide <strong>by</strong>clinoptilolite in a fixed bed adsorber, Chem. Eng. Process. 41 (2002)785–792.[15] Choosing an adsorption system for VOC: carbon, <strong>zeolite</strong> or polymers? U.S. Environmentalprotection Agency, Clean Air Technology Center, Technical Bulletin,Research Triangle Park, North Carolina, USA, 1999.[16] N. Metropolis, A.W. Rosenbluth, M.N. Rosenbluth, A.H. Teller, Equation ofState calculations <strong>by</strong> fast computing machines, J. Chem. Phys. 21 (1953)1087–1092.[17] J.-C. Charpentier, The triplet “molecular processes–product–process” engineering:the future of chemical engineering? Chem. Eng. Sci. 57 (2002)4667–4690.[18] E.S. Kikkinides, V.I. Sikavitsas, R.T. Yang, Natural gas desulphurization <strong>by</strong>adsorption: feasibility and multiplicity of cyclic steady states, Ind. Eng. Chem.Res. 34 (1995) 255–262.[19] W. Lin, Q. Yang, C. Zhong, Molecular simulation of vapor–liquid equilibria oftoxic gases, Fluid Phase Equilib. 220 (2004) 1–6.[20] J. Delhommelle, A. Boutin, A.H. Fuchs, Molecular simulation of vapour-liquidcoexistence curves for hydrogen sulfide-alkane and carbon dioxide-alkane mixtures,Mol. Simulat. 22 (1999) 351–368.[21] S.C. McGrother, K.E. Gubbins, Constant pressure Gibbs ensemble MonteCarlo simulations of adsorption into narrow pores, Mol. Phys. 97 (1999)955–965.[22] R. Millini, Application of modeling in <strong>zeolite</strong> science, Catal. Today 41 (1998)41–51.[23] P. Cosoli, M. Ferrone, S. Pricl, M. Fermeglia, Grand Canonical Monte Carlo simulationsfor VOCs adsorption in non-polar <strong>zeolite</strong>s, Int. J. Environ. Technol. Manage.7 (1/2) (2007) 228–243.[24] S.R. Jale, M. Bülow, F.R. Fitch, N. Perelman, D. Shen, Monte Carlo simulation ofsorption equilibria for nitrogen and oxygen on LiLSX <strong>zeolite</strong>, J. Phys. Chem. B104 (2000) 5272–5280.[25] S. Suzuki, H. Takaba, T. Yamaguchi, S. Nakao, Estimation of gas permeability of a<strong>zeolite</strong> membrane, based on a molecular simulation technique and permeationmodel, J. Phys. Chem. B 104 (2000) 1971–1976.[26] J.I. Siepmann, D. Frenkel, Configurational bias Monte Carlo: a new samplingscheme for flexible chains, Mol. Phys. 75 (1992) 59–70.[27] M. Levy, Universal variational functionals of electron densities, first-order densitymatrices, and natural spin-orbitals and solution of the v-representabilityproblem, Proc. Natl. Acad. Sci. U.S.A. 76 (1979) 6062–6065.[28] H.Y. Young, K. Yang, W.H. Young, K. Seff, Crystal structure of a hydrogen sulfidesorption complex of <strong>zeolite</strong> LTA, Zeolites 17 (1996) 495–500.[29] F. Maugé, A. Sahibed-Dine, M. Gaillard, M. Ziolek, Modification of the acidicproperties of NaY <strong>zeolite</strong> <strong>by</strong> H2S adsorption—an infrared study, J. Catal. 207(2002) 353–360.[30] http://www.iza-structure.org/databases/.[31] W. Loewenstein, The distribution of aluminium in the tetrahedra of silicatesand aluminates, Am. Miner. 39 (1954) 92–96.[32] J.-R. Hill, A.R. Minihan, E. Wimmer, C.J. Adams, Framework dynamics includingcomputer simulations of the water adsorption isotherm of <strong>zeolite</strong> Na-MAP,Phys. Chem. Chem. Phys. 2 (2000) 4255–4268.[33] R.L. June, A.T. Bell, D.N. Theodorou, Molecular dynamics study of methane andxenon in silicalite, J. Phys. Chem. 94 (1990) 8232–8240.
92 P. Cosoli et al. / Chemical Engineering Journal 145 (2008) 86–92[34] W. Huang, W.J. Weber Jr., Thermodynamic considerations in the sorption oforganic contaminants <strong>by</strong> soils and sediments. 1. The isosteric heat approachand its application to model inorganic sorbents, Environ. Sci. Technol. 31 (1997)3238–3243.[35] J.-M. Leyssale, G.K. Papadopoulos, D.N. Theodorou, Sorption thermodynamicsof CO 2 , CH 4 , and their mixtures in the ITQ-1 <strong>zeolite</strong>as revealed <strong>by</strong> molecular simulations, J. Phys. Chem. B 110 (2006)22742–22753.[36] D. Nicholson, K.E. Gubbins, Separation of carbon dioxide methane mixtures <strong>by</strong>adsorption: effects of geometry and energetics on selectivity, J. Chem. Phys. 104(1996) 8126–8134.