Amino acid profile and Maillard compounds of sun-dried pears ...
Amino acid profile and Maillard compounds of sun-dried pears ...
Amino acid profile and Maillard compounds of sun-dried pears ...

Create successful ePaper yourself
Turn your PDF publications into a flip-book with our unique Google optimized e-Paper software.
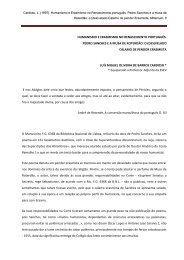
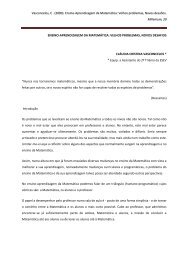
Eur Food Res Technol (2011) 233:637–646 639at the village <strong>of</strong> Ervedal da Beira (Oliveira do Hospital,Portugal) at the commercial maturity stage (Fig. 1a). Onaverage, the fresh fruits had a mass <strong>of</strong> 64 g, with a diameter<strong>of</strong> 4.3 cm <strong>and</strong> height <strong>of</strong> 6.5 cm. The moisture content was78%.For fresh pear analysis, some fruits were frozen justafter harvesting. The remaining fruits were processedaccording to the different methodologies under study.According to the traditional <strong>sun</strong>-drying process, thefresh fruits were peeled <strong>and</strong> allowed to dry in an openspace with <strong>sun</strong>shine incidence, as described by Ferreiraet al. [5] (Fig. 1b). After being peeled, fresh <strong>pears</strong> werealso allowed to dry in two greenhouses that differed in theirsize, structure <strong>and</strong> location. GH1 was provided with airconvection, with a flux <strong>of</strong> 900 m 3 h -1 , it was located atground level <strong>and</strong>, in comparison to GH2, had the largestcargo capacity. Its area was 6.3 m 2 (3.19 m long by 1.93 mwide), <strong>and</strong> the height in the sides was 1.24 m, whereas inthe middle was 1.97 m. The structure was aluminium withhorticulture glass <strong>and</strong> there were two ro<strong>of</strong> windows for airextraction. The drying time for GH1 was approximately7 days (Fig. 1c). The GH2 greenhouse consisted <strong>of</strong> insulatedglass panels <strong>and</strong> had the form <strong>of</strong> a box (1.20 m heightby 1.20 m long <strong>and</strong> 1.00 m wide). Inside, it was composedby a U-shaped structure, parallel to the floor, where <strong>pears</strong>were let to dry. GH2 was located on a ro<strong>of</strong> <strong>of</strong> a building<strong>and</strong> contained a step structure coated with reflective film,where <strong>pears</strong> were allowed to dry. This interior structureallowed a greater incidence <strong>of</strong> the light <strong>and</strong> consequentlypromoted the drying process by natural air convection, withthe air entering in the lower level (first step) <strong>and</strong> leaving inthe higher level, by means <strong>of</strong> a gir<strong>and</strong>ole. The drying timefor GH2 was approximately 5 days (Fig. 1d), 2 days lessthat the drying time <strong>of</strong> GH1.For hot air tunnel drying (HAT), after peeled, <strong>pears</strong> werelet to dry at a constant temperature <strong>of</strong> 40 °C <strong>and</strong> an air flow<strong>of</strong> 1.2 m s -1 for about 7 days (Fig. 1e). The drying tunnelwas 2 m long, <strong>and</strong> the air convection was promoted by aventilator placed at the entrance <strong>of</strong> the tunnel. In thisstructure, <strong>pears</strong> were not exposed to light, although the airwas heated by a solar collector, <strong>and</strong> therefore the <strong>sun</strong> wasalso the main source <strong>of</strong> energy.Independently <strong>of</strong> the type <strong>of</strong> processing used, the processedfruits reached a mass <strong>of</strong> 10–14 g with a moisturecontent <strong>of</strong> 20% <strong>and</strong> had a maximum width <strong>of</strong> 2.5–3.4 cm,height <strong>of</strong> 3.9–4.7 cm <strong>and</strong> thickness <strong>of</strong> 1.2–1.5 cm. Thesensory descriptive <strong>pr<strong>of</strong>ile</strong> <strong>of</strong> the traditional product, whenevaluated by a sensory panel test, is the following: brown–red uniform colour (Fig. 1b), sweet <strong>and</strong> slight <strong>acid</strong>, with anot too hard–not too s<strong>of</strong>t texture <strong>and</strong> presenting elasticity.Concerning GH1, it was considered very similar to thetraditional product, with the same rate <strong>of</strong> global appreciation,but with lower colour uniformity (Fig. 1c), sweetness<strong>and</strong> elasticity. GH2 was similar to GH1, although obtaininga lower global appreciation, possibly due to an even lower<strong>acid</strong>ity (Fig. 1d). HAT presented the sensory <strong>pr<strong>of</strong>ile</strong> closeto the traditional product concerning colour uniformity,sweetness <strong>and</strong> toughness but it was not appreciated due tothe colour tonality (yellow-orange) (Fig. 1e) <strong>and</strong> slight less<strong>acid</strong>ity. This product, although having the accurate organolepticcharacteristics except the colour, was rejected bythe panellists due to the inaccurate colour when comparedwith the traditional product.Before analysis, the pulp <strong>of</strong> the fresh <strong>and</strong> <strong>dried</strong> <strong>pears</strong>was collected, ground <strong>and</strong> freeze-<strong>dried</strong>.<strong>Amino</strong> <strong>acid</strong>s analysisThe methodology for <strong>acid</strong> hydrolysis <strong>of</strong> protein materialwas adapted from Zumwalt et al. [22]. To a test tube with ascrew cap with PTFE coating was rigorously weighed10 mg <strong>of</strong> freeze-<strong>dried</strong> material. To each sample, 2 mLhydrochloric <strong>acid</strong> (HCl) 6 M was added; the content <strong>of</strong> thetubes was frozen in liquid nitrogen, evacuated during 1 minwith a vacuum pump <strong>and</strong> refilled with nitrogen. Afterthawing, the suspension was sonicated for 5 min in anultrasound bath at room temperature. The procedure <strong>of</strong>freezing–vacuum–sonication was repeated twice. Thehydrolysis took place during 24 h at 110 °C using a heatingblock. After cooling to room temperature, 500 lL <strong>of</strong> theFig. 1 The S. Bartolomeu pear.a Fresh <strong>pears</strong> <strong>and</strong> <strong>pears</strong> <strong>dried</strong> bydifferent technologies:b Traditional, c GH1, d GH2<strong>and</strong> e HAT123
640 Eur Food Res Technol (2011) 233:637–646internal st<strong>and</strong>ard solution (norleucine 5.0 mM in HCl0.1 M) was added <strong>and</strong> the tubes content was evaporated todryness under vacuum in a centrifugal evaporator. Theresulting material was dissolved in 1 mL HCl 0.1 M <strong>and</strong>filtered with 0.45 lm filters. For the analysis <strong>of</strong> free amino<strong>acid</strong>s, 10 mg <strong>of</strong> each sample was suspended in 2 mL <strong>of</strong> asolution <strong>of</strong> HCl 0.1 M <strong>and</strong> spiked with 500 lL <strong>of</strong> theinternal st<strong>and</strong>ard solution. The suspension was left stirringfor several hours <strong>and</strong> then was filtered with 0.45 lm filters.The solutions containing the released amino <strong>acid</strong>s were<strong>dried</strong> under vacuum using a centrifugal evaporator.The derivatization <strong>of</strong> amino <strong>acid</strong>s for GC analysis wasperformed according to the methodology described byMacKenzie et al. [23]. The resultant solid residue wasdissolved in 200 lL <strong>of</strong> a solution <strong>of</strong> 3 M HCl in isobutanol.This solution was prepared by adding 270 lL <strong>of</strong> acetylchloride per mL <strong>of</strong> dry isobutanol; the isobutanol was <strong>dried</strong>with calcium hydride, distilled <strong>and</strong> stored with molecularsieves 4 Å. The mixture was heated to 120 °C for 10 min<strong>and</strong>, after shaking in a vortex, was heated for further30 min. After cooling to ambient temperature, the excess <strong>of</strong>reagent was evaporated under vacuum using a centrifugalevaporator. Then, 200 lL <strong>of</strong> a solution <strong>of</strong> 0.2 mg mL -1BHT prepared in ethyl acetate was added <strong>and</strong> the solventwas removed under vacuum in a centrifugal evaporator.Afterwards, 100 lL <strong>of</strong> heptafluorobutyric anhydride wasadded <strong>and</strong> the mixture was heated during 10 min at 150 °C.After cooling to room temperature, the excess <strong>of</strong> solventwas removed under vacuum <strong>and</strong> the material obtained wasdissolved in 50 lL <strong>of</strong> ethyl acetate <strong>and</strong> analysed immediatelyor frozen at -20 °C until analysis.Separation <strong>of</strong> amino <strong>acid</strong>s was achieved by gas chromatography,carried out in a PerkinElmer Clarus 400instrument (PerkinElmer, Massachusetts, USA) equippedwith a flame ionisation detector (FID). The injector waskept at 250 °C <strong>and</strong> the detector at 260 °C. Hydrogen wasused as carrier gas. A DB-1 (30 m, 0.25 mm i.d. <strong>and</strong>0.15 lm thickness) fused-silica capillary column (J & WScientific) was used with the following temperature programme:1 min hold at 70 °C, increase to 170 °C at 2.0 °C/min <strong>and</strong> then to 250 °C (5 min hold) at 16 °C min -1 . The<strong>compounds</strong> were identified by their retention times <strong>and</strong>chromatographic comparison with authentic st<strong>and</strong>ards.Quantification was based on the internal st<strong>and</strong>ard methodusing L-norleucine, <strong>and</strong> the calibration curves were built for18 amino <strong>acid</strong>s. For asparagine (Asn) <strong>and</strong> aspartic <strong>acid</strong>(Asp), as well as for glutamine (Gln) <strong>and</strong> glutamic <strong>acid</strong>(Glu), the methodology does not allow the distinctionbetween the amide <strong>and</strong> carboxylic <strong>acid</strong> functions. As such,those amino <strong>acid</strong>s were quantified together as Asx <strong>and</strong> Glx,respectively. Also, the methodology used did not allow thedetection <strong>of</strong> His. The limit <strong>of</strong> quantification <strong>of</strong> analysedamino <strong>acid</strong>s was determined to be ten times the value <strong>of</strong> theresidual signal peaks.Analysis <strong>of</strong> carboxymethyllysine (CML),carboxyethyllysine (CEL) <strong>and</strong> furosineThe <strong>acid</strong> hydrolysis for the CML <strong>and</strong> CEL release fromthe protein material <strong>and</strong> furosine conversion fromfructosyl-lysine residues present on the protein materialwas performed based on the methodology described byBuser et al. [24]. To a test tube with a screw cap withPTFE coating was rigorously weighed 75 mg <strong>of</strong> freeze<strong>dried</strong>material. To each sample was added 3 mL <strong>of</strong> 7.8 MHCl, <strong>and</strong> the resulting suspension was sonicated for15 min in an ultrasound bath. The tubes were sealed undernitrogen atmosphere, <strong>and</strong> the hydrolysis took place during24 h at 110 °C using a heating block. After cooling toroom temperature, the tubes content was evaporated todryness under vacuum. The resulting material was dissolvedin 4 mL <strong>of</strong> 2 M HCl <strong>and</strong> filtered with 0.45 lmpore filters.The <strong>acid</strong> hydrolysates were purified by solid-phaseextraction (SPE) to improve the baseline in the procedurefor quantification by GC–MS [25]. The solid-phaseextraction cartridges with 500 mg <strong>of</strong> C-18 stationary phasewas packed with 5 mL <strong>of</strong> ethanol, followed by 5 mL <strong>of</strong>distilled water <strong>and</strong> finally with 5 mL <strong>of</strong> a 2 M HCl solution.The samples were dissolved in 4 mL <strong>of</strong> 2 M HCl,filtered <strong>and</strong> applied in the C-18 cartridges, recovering theeluent in a test tube. The column was washed with 3 mL <strong>of</strong>2 M HCl <strong>and</strong> the eluent recovered in the same test tube.The solvent was removed under vacuum using a centrifugalevaporator.The furosine, CML <strong>and</strong> CEL residues were derivatisedby esterification with isobutanol <strong>and</strong> acylation with heptafluorobutyricanhydride as described for amino <strong>acid</strong>sderivatization, with the exception that the BHT solutionwas not added after the esterification with isobutanol [24].The furosine, CML <strong>and</strong> CEL residues were analysed bygas chromatography–quadrupole mass spectrometry (GC–MS, Agilent). The column <strong>and</strong> the temperature programmeused were the same as for amino <strong>acid</strong>s analysis. Selectedion monitoring (SIM) was used for the detection <strong>of</strong> the<strong>compounds</strong>. The ions at m/z 110, 621 <strong>and</strong> 578 were used,respectively, for furosine, CML <strong>and</strong> CEL detection. Forqualification, additional ions at m/z 280 <strong>and</strong> 240, m/z 565<strong>and</strong> 519 <strong>and</strong> m/z 533 <strong>and</strong> 511, respectively, were used.Quantification was performed using the lysine residues asinternal st<strong>and</strong>ard. The MS was operated in the electronimpact mode with an electron impact energy <strong>of</strong> 70 eV <strong>and</strong>data collected at a rate <strong>of</strong> 3 scan s -1 . The ion source <strong>and</strong>the transfer line were kept at 230 °C [20].123
642 Eur Food Res Technol (2011) 233:637–646Table 2 Protein amino <strong>acid</strong>scontent (mg 100 g -1 ) <strong>of</strong> 2009fresh <strong>and</strong> <strong>dried</strong> pear fruitsValues are mean ± st<strong>and</strong>arderror (3 replicates)Protein amino <strong>acid</strong>s content (mg 100 g -1 )<strong>Amino</strong> <strong>acid</strong> Fresh 09 Traditional 09 GH1 09 GH2 09 HAT 09Ala 15.21 ± 1.22 15.01 ± 0.62 18.94 ± 5.89 17.77 ± 2.55 11.10 ± 2.45Gly 9.11 ± 0.19 8.52 ± 0.06 10.24 ± 2.07 8.02 ± 2.71 8.47 ± 0.79Val 22.32 ± 2.24 21.58 ± 0.57 26.09 ± 0.34 23.30 ± 0.06 19.81 ± 3.05Thr 12.92 ± 1.17 10.50 ± 1.86 11.95 ± 0.61 9.78 ± 3.32 13.32 ± 0.61Leu 64.16 ± 11.64 58.52 ± 5.51 60.25 ± 12.11 66.22 ± 11.93 55.25 ± 4.44Ile 33.28 ± 10.71 29.82 ± 3.64 28.87 ± 0.69 38.28 ± 3.82 34.98 ± 4.74Pro 19.77 ± 6.82 9.22 ± 2.05 14.89 ± 3.12 4.76 ± 2.04 12.45 ± 0.65Asx 44.72 ± 12.23 41.48 ± 2.80 51.99 ± 8.96 49.99 ± 4.64 44.65 ± 2.32Phe 11.48 ± 2.68 9.01 ± 4.37 11.87 ± 0.11 12.45 ± 0.97 11.99 ± 1.02Glx 79.58 ± 13.87 93.48 ± 2.12 90.92 ± 12.39 83.84 ± 6.69 89.92 ± 8.16Lys 24.88 ± 1.13 19.34 ± 2.52 18.99 ± 6.59 23.53 ± 0.78 24.02 ± 3.25Total 337.43 ± 63.89 316.46 ± 13.47 345.98 ± 10.66 336.92 ± 25.21 325.97 ± 30.27amino <strong>acid</strong> in higher amount, followed by Glx. Consideringtheir relative molar percentages, Pro accounts for39–25% <strong>of</strong> the free amino <strong>acid</strong>s, whereas Glx accounts for24–15%. Although no data are available for free amino<strong>acid</strong>s <strong>of</strong> <strong>dried</strong> <strong>pears</strong>, the results are comparable with thoseobtained for the dehydration <strong>of</strong> grapes where it wasobserved the decrease in the total free amino <strong>acid</strong> contentas well as a decrease in Asx [11]. These authors attributedthe decrease in the free amino <strong>acid</strong> content to the low wateractivity <strong>of</strong> samples, favouring the <strong>Maillard</strong> reaction atroom temperature. Also, the higher relative amount <strong>of</strong> freePro has been observed in pear juice [14]. In fact, theincrease in the synthesis <strong>of</strong> Pro has been reported as aresponse <strong>of</strong> the fruits to stress conditions [19, 26, 27],namely due to the modulation <strong>of</strong> expression <strong>of</strong> proline-richglycoproteins (extensins).Eleven amino <strong>acid</strong>s were found in proteins from fresh<strong>and</strong> traditional <strong>sun</strong>-<strong>dried</strong> <strong>pears</strong> (Table 2; Fig. 2b). In total,they account for 4.23 mg per g <strong>of</strong> dry weight <strong>of</strong> the pulp inthe samples from fresh fruits in 2008 season <strong>and</strong>3.37 mg g -1 in 2009. A value <strong>of</strong> 2.31 mg g -1 (dry weight)for fresh pear (Pyrus communis L.) is reported in literature[7], although from Beurré variety, which is lower than thevalues for protein found for S. Bartolomeu fruits from bothharvests. In traditional <strong>sun</strong>-<strong>dried</strong> fruits, the amount <strong>of</strong>protein amino <strong>acid</strong>s was higher (18%) than in fresh in 2008(5.00 mg g -1 ) <strong>and</strong> lower (6%) in 2009 (3.17 mg g -1 ).For the fresh fruits, the most abundant protein amino<strong>acid</strong>s are Glx <strong>and</strong> Leu (20–19 mol%, each) <strong>and</strong> Asx(17–13 mol%) (Fig. 2b). Also in relevant amount occur Ile(10–7 mol%), Ala (8–7 mol%) <strong>and</strong> Val (7 mol%). Asx wasreported by Pilipenko et al. [7] as the predominant amino<strong>acid</strong> in Pyrus communis L. fruits <strong>of</strong> Beurré variety(35 mol%), showing that S. Bartolomeu <strong>pears</strong> present lowerrelative amounts, although similar amounts are observedwhen expressed in mg g -1 . All amino <strong>acid</strong>s found as constituents<strong>of</strong> S. Bartolomeu <strong>pears</strong> have been also found inBeurré variety. The exception is Hyp, not found in amountsto be detected in S. Bartolomeu <strong>pears</strong>. Hyp is an amino <strong>acid</strong>characteristic <strong>of</strong> extensins <strong>and</strong> arabinogalactan-rich glycoproteins.Pyrus communis L. arabinogalactan-rich glycoproteinsfrom suspension cultures are composed mainly byGlx (16 mol%) [28]. In Chinese species, reporting eightpear varieties, Chen et al. [8] showed large variations in theamino <strong>acid</strong> <strong>pr<strong>of</strong>ile</strong> for the different pear varieties. Anyway,Asn accounted for near 20% <strong>of</strong> total amino <strong>acid</strong>s. In these<strong>pears</strong>, Ser is the main constituent, although not always,which is not the case <strong>of</strong> Pyrus communis L., where no Serwas found.No significant changes were observed in the amino <strong>acid</strong>s<strong>pr<strong>of</strong>ile</strong> <strong>of</strong> proteins from traditional <strong>sun</strong>-<strong>dried</strong> <strong>pears</strong> whencompared to the fresh samples (Fig. 2b). However, inrelation to the same mass <strong>of</strong> protein, a decrease in thecontent <strong>of</strong> Pro (-16% in 2008 <strong>and</strong> -50% in 2009), Phe(-15 <strong>and</strong> -16%), Lys (-9 <strong>and</strong> -17%) <strong>and</strong> Thr (-10 <strong>and</strong>-13%) was observed in both harvests, contrasting with theincrease in Glx (?17 <strong>and</strong> ?25%). The higher differencewas Pro, in accordance with the higher increase in Pro foundas free amino <strong>acid</strong>. Also, the increase in the content in Glxin proteins is in accordance with the lower amounts found asfree amino <strong>acid</strong>. As no data are available concerning thecomposition <strong>of</strong> the amino <strong>acid</strong>s <strong>of</strong> proteins <strong>of</strong> <strong>dried</strong> fruits,the origin <strong>of</strong> this phenomenon remains unknown, althoughit can be suggested that modulation in Pro-rich glycoproteinsynthesis <strong>and</strong>/or degradation seems to be involved. Concerningthe decrease in Phe, Lys <strong>and</strong> Thr, it is possible that itis related with the occurrence <strong>of</strong> <strong>Maillard</strong> reactions. Thishypothesis will be verified taking into account the analysis<strong>of</strong> other independent samples, namely the <strong>pears</strong> <strong>dried</strong>according to different methodologies, which present123
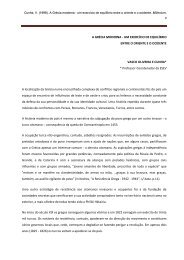
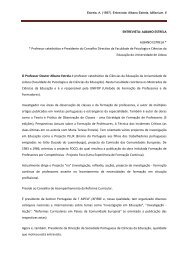
644 Eur Food Res Technol (2011) 233:637–646increase in the relative content <strong>of</strong> Val <strong>and</strong> Ala was alsoobserved in traditional, GH1 <strong>and</strong> GH2 processed fruits.Detection <strong>of</strong> carboxymethyllysine (CML),carboxyethyllysine (CEL) <strong>and</strong> furosine in <strong>pears</strong>In order to observe whether the browning <strong>of</strong> <strong>sun</strong>-<strong>dried</strong><strong>pears</strong> also results from the contribution <strong>of</strong> <strong>Maillard</strong> reactionproducts, the analysis <strong>of</strong> carboxymethyllysine (CML),carboxyethyllysine (CEL) <strong>and</strong> furosine in <strong>dried</strong> <strong>pears</strong> wassearched <strong>and</strong> fresh <strong>pears</strong> were also analysed to be used ascontrol. CML quantification was performed together withCEL due to the fact that the applied methodology does notallow the separation between these two <strong>compounds</strong>.Although literature does not report the occurrence <strong>of</strong>furosine, CML <strong>and</strong> CEL in unprocessed materials usingthis methodology, it was noticed their occurrence in fresh<strong>pears</strong>. In fact, furosine content detected for fresh <strong>pears</strong> was871 mg per 100 g <strong>of</strong> protein present in the sample <strong>and</strong> theamount <strong>of</strong> CEL ? CML detected was 275 mg 100 g -1protein. Some authors [29, 30] reported that this kind <strong>of</strong><strong>compounds</strong> might partially be formed from degradationproducts derived from lipids or sugars during samplehydrolysis. As these fruits have not been processed, theoccurrence <strong>of</strong> these <strong>compounds</strong> may be resultant <strong>of</strong> anartefact <strong>of</strong> the methodology used, namely from the <strong>acid</strong>hydrolysis to which the samples were submitted. In order toavoid this fact, a preliminary protein extraction would berequired to remove all interferences in the analysis methodology.Nevertheless, the amount <strong>of</strong> furosine <strong>and</strong>CML ? CEL was higher in <strong>dried</strong> samples. Using fresh<strong>pears</strong> as control <strong>of</strong> the methodology applied, it was possibleto determine the amount <strong>of</strong> these <strong>compounds</strong> producedafter the different drying technologies used (Fig. 4).For <strong>dried</strong> <strong>pears</strong>, furosine amount ranged between247 mg 100 g -1 protein for traditional <strong>and</strong> 80 mg 100 g -1protein for HAT. For GH1 <strong>and</strong> GH2, the furosine amountwas 182 <strong>and</strong> 136 mg 100 g -1 proteins, respectively. Theamount <strong>of</strong> furosine detected for <strong>dried</strong> <strong>pears</strong> was similar tothat described in literature for products to which moderateContent (mg / 100 g Protein)300250200150100500Fur CML+CEL Fur CML+CEL Fur CML+CEL Fur CML+CELTraditional GH1 GH2 HATFig. 4 Furosine (Fur) <strong>and</strong> carboxymethyllysine (CML) ? carboxyethyllysine(CEL) content (mg 100 g -1 protein) in <strong>dried</strong> <strong>pears</strong>from 2009 harvestheat treatment is applied, such as UHT milk products [31,32] (35–269 mg 100 g -1 protein), jams <strong>and</strong> fruit-basedinfant foods [18] (44–448 mg 100 g -1 protein) <strong>and</strong> cookedbeef <strong>and</strong> salmon [29] (100–200 mg 100 g -1 protein). ForCML ? CEL quantification in <strong>dried</strong> <strong>pears</strong>, the amount <strong>of</strong>these <strong>compounds</strong> ranged between 96 mg 100 g -1 proteinfor traditional <strong>and</strong> 37 mg 100 g -1 protein for HAT. ForGH1 <strong>and</strong> GH2, the furosine amount was 94 <strong>and</strong> 71 mg100 g -1 proteins, respectively. The values determined forthe content <strong>of</strong> CML ? CEL in <strong>dried</strong> <strong>pears</strong> were, asexpected, higher compared to those described in literaturefor CML even in severely heat-treated foods, such assterilised evaporated milk [17] (43–52 mg 100 g -1 protein)<strong>and</strong> hypoallergenic powdered infant formulas [30](13–32 mg 100 g -1 protein). This fact may be due to CELinterference in CML quantification.In both analysis (furosine <strong>and</strong> CML ? CEL), there wasa tendency for the occurrence <strong>of</strong> higher levels <strong>of</strong> these<strong>compounds</strong> in traditional <strong>pears</strong> <strong>and</strong> lower contents in HAT<strong>dried</strong> <strong>pears</strong>, while GH1 <strong>and</strong> GH2 <strong>dried</strong> <strong>pears</strong> presentedintermediate levels (Fig. 4), showing that the traditionalwas the most severe processing <strong>of</strong> all studied <strong>and</strong> the HATwas the less severe.Taking into account the amount <strong>of</strong> the decrease in thecontent <strong>of</strong> each amino <strong>acid</strong> with the different treatments(Table 2) <strong>and</strong> the amounts <strong>of</strong> <strong>Maillard</strong> reaction productsquantified (Fig. 4), it is possible to observe a positivecorrelation between the contents <strong>of</strong> these <strong>compounds</strong> <strong>and</strong>the decrease in the relative amount <strong>of</strong> Lys <strong>and</strong> Phe. On thecontrary Val, Ala, Ile <strong>and</strong> Glx showed a negative correlation.The decrease in the relative content <strong>of</strong> Pro does notshow any relation with the occurrence <strong>of</strong> these <strong>compounds</strong>.The Lys degradation observed in Traditional <strong>and</strong> GH1<strong>pears</strong> is comparable to that occurring in condensed milk butis lower than that <strong>of</strong> chocolate, processed breakfast cereals<strong>and</strong> bread [33] <strong>and</strong> fruits <strong>and</strong> vegetables in baby foods [34],which allows to include the <strong>pears</strong> in moderate thermallyprocessed foods if processed according to the traditionalprocess or with GH1. Using this parameter as marker <strong>of</strong> thethermal damage [11, 13, 35], it can be stated that the <strong>pears</strong>produced by HAT do not lose the nutritional value concerningthe stability <strong>of</strong> Lys. However, <strong>Maillard</strong> reactionproducts, when in a moderate amount as observed in traditional<strong>and</strong> GH1 <strong>pears</strong>, may contribute to beneficial antioxidantproperties [36, 37].The differences observed between the colour <strong>of</strong> traditional<strong>pears</strong> (reddish brown colour) <strong>and</strong> HAT <strong>dried</strong> <strong>pears</strong>(yellow-orange colour) are also in accordance with thehigher amount <strong>of</strong> <strong>Maillard</strong> reaction products in traditionalprocessed fruits. For GH1 <strong>and</strong> GH2 <strong>dried</strong> <strong>pears</strong>, the colourationwas similar to the traditional <strong>dried</strong> <strong>pears</strong>, althoughGH2 fruits presented a not so intense colour as traditional<strong>and</strong> GH1 ones (Fig. 1). These results allow to infer that the123
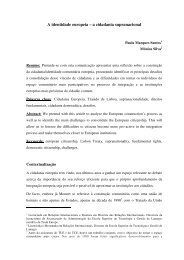
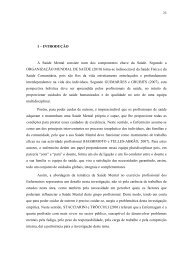
Eur Food Res Technol (2011) 233:637–646 645drying process promotes the occurrence <strong>of</strong> <strong>Maillard</strong> reactionsin the S. Bartolomeu <strong>pears</strong> <strong>and</strong> that in the traditional,GH1, <strong>and</strong> GH2 drying processes, they contribute to thereddish brown colour <strong>of</strong> the <strong>dried</strong> <strong>pears</strong>. For HAT drying, itis possible that the heating <strong>of</strong> the fruits has not been highenough to promote the occurrence <strong>of</strong> <strong>Maillard</strong> reactions inthe most advanced steps, when the brown colouration isproduced.Influence <strong>of</strong> pH, temperature <strong>and</strong> moisture on <strong>dried</strong>pear colour formationAs the <strong>Maillard</strong> reaction is known to be favoured duringthe dehydration process systems [13] under conditions <strong>of</strong>pH ranging 5–7, with intermediate moisture content <strong>and</strong>temperatures over 50 °C using long processing times, a fewsets <strong>of</strong> simple experiments were performed on pear tissuesto relate the occurrence <strong>of</strong> <strong>Maillard</strong> <strong>compounds</strong> with thereddish brown colouration.In order to test the influence <strong>of</strong> pH on the development<strong>of</strong> the colour <strong>of</strong> the <strong>pears</strong>, pieces <strong>of</strong> freeze-<strong>dried</strong> pulp <strong>of</strong> afresh pear were immersed in buffer solutions in the range<strong>of</strong> the pH scale. It was observed that the tissues immersedin the solutions with higher pH became darker than theother ones. The major colour variations were observed inthe interval <strong>of</strong> pH 4–6, whereas at pH 5.0, the colour <strong>of</strong> thetissue approached the reddish brown colour characteristic<strong>of</strong> the traditional product (Fig. 5a).abclowmoisturepH 4 pH 5 pH 6<strong>sun</strong>lightdarkness30 °C 50 °ChighmoisturehighmoistureFig. 5 Effect <strong>of</strong> a pH variation, b <strong>sun</strong>light exposure <strong>and</strong> c moisture<strong>and</strong> temperature in the development <strong>of</strong> the colour <strong>of</strong> pear tissuesThe freeze-<strong>dried</strong> pear tissues that have been immersed inthe buffer solution at pH 5.0 were placed (in a wet form) intwo plastic containers, one exposed to <strong>sun</strong>light <strong>and</strong> theother one was placed in the dark. This experiment allowedto observe that the sample exposed to <strong>sun</strong>light presented anincrease in the intensity <strong>of</strong> the colour when compared withthe sample placed in the dark (Fig. 5b). Because watercondensation was observed over the walls <strong>of</strong> the containerswhere the tissues were exposed to the light <strong>and</strong> not in thecontrol ones, it was hypothesised that the increase intemperature <strong>of</strong> the wet tissues could be an important factorfor pear tissues colouration. To test this hypothesis, pieces<strong>of</strong> freeze-<strong>dried</strong> pear tissues were immersed in the buffersolution at pH 5.0 <strong>and</strong> the wet material was cut in twohalves. One part was placed in a Petri dish that was closedto preserve the moisture <strong>and</strong> the other one was left in directcontact with the air. Both samples were placed in an ovenat 30 <strong>and</strong> 50 °C. It was observed that the tissues that weremaintained closed, keeping the moisture, presented moreintense colourations <strong>and</strong> the colour intensity was higher for50 °C than for 30 °C (Fig. 5c).These results allow concluding that the pH, the dryingtemperature <strong>and</strong> the tissues moisture are importantparameters for the development <strong>of</strong> the characteristic colour<strong>of</strong> the traditional product.ConclusionThe results obtained allowed concluding that drying <strong>of</strong>S. Bartolomeu <strong>pears</strong> affects the free amino <strong>acid</strong> <strong>pr<strong>of</strong>ile</strong>,increasing Pro content <strong>and</strong> decreasing Asx <strong>and</strong> Glx.Although the proteic amino <strong>acid</strong> <strong>pr<strong>of</strong>ile</strong> was not significantlymodified with the drying process, a loss <strong>of</strong> therelative content <strong>of</strong> Lys is observed. This loss is related withthe increase in the amount <strong>of</strong> furosine, CML <strong>and</strong> CELformed during the drying process.Although all drying methods tested promoted theincrease in the amount <strong>of</strong> CML, CEL <strong>and</strong> furosine, thisincrease was higher in the case <strong>of</strong> the traditional <strong>sun</strong>-drying<strong>and</strong> greenhouse processing, where the fruits presentedreddish brown colour <strong>and</strong> lower for the hot air tunnelprocessing, where the fruits became yellow-orange. Theseresults allow to conclude that the drying processing <strong>of</strong>S. Bartolomeu <strong>pears</strong> promotes <strong>Maillard</strong> reactions, possiblycontributing to the characteristic reddish brown colour <strong>of</strong>this product. These reactions are formed under conditions<strong>of</strong> pH, temperature <strong>and</strong> moisture that promote the development<strong>of</strong> this characteristic colour.Acknowledgments We thank FCT for financial support throughproject PTDC/AGR-ALI/74587/2006, Research Unit 62/94-QOPNA(PEst-C/QUI/UI0062/2011) <strong>and</strong> Cláudia Nunes Post-Doc grantSFRH/BPD/46584/2008.123
646 Eur Food Res Technol (2011) 233:637–646References1. Ferreira D, Barros A, Coimbra MA, Delgadillo I (2001) CarbohydrPolym 45:175–1822. Barroca MJ, Guiné RPF, Pinto A, Gonçalves FM, Ferreira DMS(2006) Food Bioprod Process 84:109–1133. Ferreira D, Guyot S, Marnet N, Delgadillo I, Renard CMGC,Coimbra MA (2002) J Agric Food Chem 50:4537–45444. Guine RPF, Ramos MA, Figueiredo M (2006) Dry Technol24:1525–15305. Ferreira D, Lopes da Silva JA, Pinto G, Santos C, Delgadillo I,Coimbra MA (2008) Eur Food Res Technol 226:1545–15526. Silva BM, Andrade PM, Valentão P, Ferreres F, Seabra RM,Ferreira MA (2004) J Agric Food Chem 52:1201–12067. Pilipenko LN, Kalinkov AY, Spektor AV (1999) Chem NatCompd 35:208–2118. Chen JL, Wang ZF, Wu J, Wang Q, Hu XS (2007) Food Chem104:268–2759. van Gorsel H, Li C, Kerbel EL, Smits M, Kader AA (1992)J Agric Food Chem 40:784–78910. Askari GR, Emam-Djomeh Z, Mousavi SM (2009) Dry Technol27:831–84111. Sanz ML, del Castillo MD, Corzo N, Olano A (2001) J AgricFood Chem 49:5228–523112. Moreno J, Peinado J, Peinado RA (2007) Food Chem104:224–22813. Rufián-Henares JA, García-Villanova B, Guerra-Hernández E(2008) Eur Food Res Technol 228:249–25614. Belitz H-D, Grosch W, Schieberle P (2004) Food chemistry, 3rdrevised edition. Springer, Berlin15. Cardelle-Cobas A, Moreno FJ, Corzo N, Olano A, Villamiel M(2005) J Agric Food Chem 53:9078–908216. Frank D, Gould I, Millikan M (2005) Aust J Grape Wine Res11:15–2317. Erbersdobler HF, Somoza V (2007) Mol Nutr Food Res51:423–43018. Rada-Mendoza M, Olano A, Villamiel M (2002) J Agric FoodChem 50:4141–414519. Shirsat AH, Bell A, Spence J, Harris JN (1996) Planta199:618–62420. Nunes FM, Coimbra MA (2007) J Agric Food Chem55:3967–397721. Guine RPF, Castro JAAM (2002) Dry Technol 20:1515–152622. Zumwalt RW, Absheer JS, Kaiser FE, Gehrke CW (1987) J AssocOff Anal Chem 70:147–15123. MacKenzie SL, Tenaschuk D (1974) J Chromatogr A 97:19–2424. Büser W, Erbersdobler HF, Liardon R (1987) J Chromatogr A387:515–51925. Serrano MA, Castillo G, Muñoz MM, Hernández A (2002)J Chromatogr Sci 40:87–9126. Huxham IM, Jarvis MC, Shakespeare L, Dover CJ, Johnson D,Knox JP, Seymour GB (1999) Planta 208:438–44327. Josè M, Puigdomènech P (1993) New Phytol 125:259–28228. Webster JM, Oxley D, Pettolino FA, Bacic A (2008) Phytochemistry69:873–88129. Charissou A, Ait-Ameur L, Birlouez-Aragon I (2007) J ChromatogrA 1140:189–19430. Fenaille F, Parisod V, Visani P, Populaire S, Tabet JC, Guy PA(2006) Int Dairy J 16:728–73931. Vallejo-Cordoba B, Mazorra-Manzano MA, González-CórdovaAF (2004) J Agric Food Chem 52:5787–579032. Van Renterghem R, De Block J (1996) Int Dairy J 6:371–38233. Meade SJ, Reid EA, Gerrard JA (2005) J AOAC Int 88:904–92234. Alonso ML, Zapico J (1994) J Food Biochem 18:393–40335. Gökmen V, Serpen A, Açar OÇ, Morales FJ (2008) J Cereal Sci48:843–84736. Anese M, Manzocco L, Nicoli MC, Lerici CR (1999) J Sci FoodAgric 79:750–75437. Martín MA, Ramos S, Mateos R, Rufián-Henares JA, Morales FJ,Bravo L, Goya L (2009) J Agric Food Chem 57:7250–7258123