Eliminating Corporal Punishment in Schools Part I - Azim Premji ...
Eliminating Corporal Punishment in Schools Part I - Azim Premji ...
Eliminating Corporal Punishment in Schools Part I - Azim Premji ...

You also want an ePaper? Increase the reach of your titles
YUMPU automatically turns print PDFs into web optimized ePapers that Google loves.
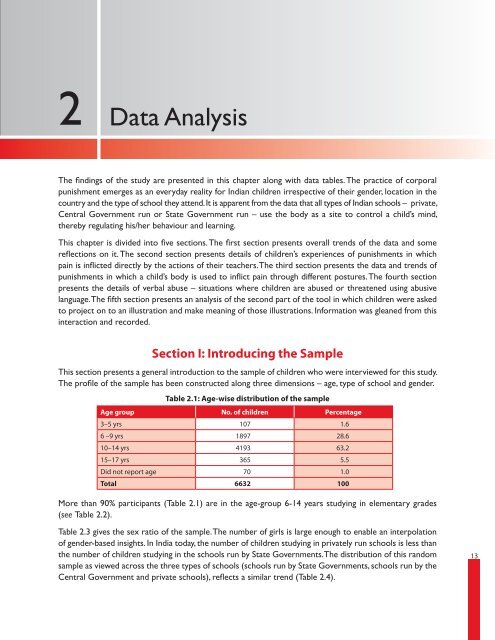
Data Analysis2 Data AnalysisThe f<strong>in</strong>d<strong>in</strong>gs of the study are presented <strong>in</strong> this chapter along with data tables. The practice of corporalpunishment emerges as an everyday reality for Indian children irrespective of their gender, location <strong>in</strong> thecountry and the type of school they attend. It is apparent from the data that all types of Indian schools – private,Central Government run or State Government run – use the body as a site to control a child’s m<strong>in</strong>d,thereby regulat<strong>in</strong>g his/her behaviour and learn<strong>in</strong>g.This chapter is divided <strong>in</strong>to five sections. The first section presents overall trends of the data and somereflections on it. The second section presents details of children’s experiences of punishments <strong>in</strong> whichpa<strong>in</strong> is <strong>in</strong>flicted directly by the actions of their teachers. The third section presents the data and trends ofpunishments <strong>in</strong> which a child’s body is used to <strong>in</strong>flict pa<strong>in</strong> through different postures. The fourth sectionpresents the details of verbal abuse – situations where children are abused or threatened us<strong>in</strong>g abusivelanguage. The fifth section presents an analysis of the second part of the tool <strong>in</strong> which children were askedto project on to an illustration and make mean<strong>in</strong>g of those illustrations. Information was gleaned from this<strong>in</strong>teraction and recorded.Section I: Introduc<strong>in</strong>g the SampleThis section presents a general <strong>in</strong>troduction to the sample of children who were <strong>in</strong>terviewed for this study.The profile of the sample has been constructed along three dimensions – age, type of school and gender.Table 2.1: Age-wise distribution of the sampleAge group No. of children Percentage3–5 yrs 107 1.66 –9 yrs 1897 28.610–14 yrs 4193 63.215–17 yrs 365 5.5Did not report age 70 1.0Total 6632 100More than 90% participants (Table 2.1) are <strong>in</strong> the age-group 6-14 years study<strong>in</strong>g <strong>in</strong> elementary grades(see Table 2.2).Table 2.3 gives the sex ratio of the sample. The number of girls is large enough to enable an <strong>in</strong>terpolationof gender-based <strong>in</strong>sights. In India today, the number of children study<strong>in</strong>g <strong>in</strong> privately run schools is less thanthe number of children study<strong>in</strong>g <strong>in</strong> the schools run by State Governments. The distribution of this randomsample as viewed across the three types of schools (schools run by State Governments, schools run by theCentral Government and private schools), reflects a similar trend (Table 2.4).13