Herington Reservoir, Dickinson County, KS - Kansas Water Office
Herington Reservoir, Dickinson County, KS - Kansas Water Office
Herington Reservoir, Dickinson County, KS - Kansas Water Office

You also want an ePaper? Increase the reach of your titles
YUMPU automatically turns print PDFs into web optimized ePapers that Google loves.
Bathymetric and Sediment Survey of<strong>Herington</strong> <strong>Reservoir</strong>, <strong>Dickinson</strong> <strong>County</strong>, <strong>Kansas</strong><strong>Kansas</strong> Biological SurveyApplied Science and Technology for<strong>Reservoir</strong> Assessment (ASTRA) ProgramReport 2008-06 (March 2009)Revised Area-Elevation-Capacity Tables and Figures, January 2010
This work was funded by the <strong>Kansas</strong> <strong>Water</strong> <strong>Office</strong> through the State<strong>Water</strong> Plan Fund in support of the <strong>Reservoir</strong> Sustainability Initiative.
TABLE OF CONTENTSSUMMARY.....................................................................................................................iTABLE OF CONTENTS................................................................................................iiLIST OF FIGURES.......................................................................................................iiiLIST OF TABLES ........................................................................................................ivLAKE HISTORY AND PERTINENT INFORMATION .................................................. 1BATHYMETRIC SURVEYING PROCEDUREPre-survey preparation:..................................................................................... 3Survey procedures: ........................................................................................... 3Establishment of lake level on survey date: ...................................................... 4Location of lake elevation benchmark ............................................................... 5NGS OPUS solution report ............................................................................... 6Post-processing ................................................................................................ 8BATHYMETRIC SURVEY RESULTSArea-Volume-Elevation Tables........................................................................ 11SEDIMENT SAMPLING............................................................................................. 14Procedures...................................................................................................... 14Results ............................................................................................................ 14ii
LIST OF FIGURESFigure 1. <strong>Herington</strong> <strong>Reservoir</strong> ................................................................................. 1Figure 2. Location of <strong>Herington</strong> <strong>Reservoir</strong> in <strong>Dickinson</strong> <strong>County</strong>, <strong>Kansas</strong>................. 2Figure 3. Photograph, view north, of lake elevation benchmark site........................ 5Figure 4. Bathymetric survey transects.................................................................... 7Figure 5. <strong>Reservoir</strong> depth map .............................................................................. 10Figure 6. Cumulative area-elevation curve. ........................................................... 13Figure 7. Cumulative volume-elevation curve. ....................................................... 13Figure 8. Sediment sampling sites. ...................................................................... 15Figure 9. Sediment particle size analysis .............................................................. 16Figure 10. Map of sediment particle size for sites in <strong>Herington</strong> <strong>Reservoir</strong> ............... 17iii
LIST OF TABLESTable 1. Cumulative area in acres by tenth foot elevation increments.................... 11Table 2. Cumulative volume in acre-feet by tenth foot elevation increments .......... 12Table 3 Sediment sampling site data..................................................................... 14iv
LAKE HISTORY AND PERTINENT INFORMATION(This section summarized from the <strong>Kansas</strong> Dam Inventory and KDWP)http://crunch.tec.army.mil/nidpublic/webpages/nid.cfmhttp://www.kdwp.state.ks.us/news/Fishing/Where-to-Fish-in-<strong>Kansas</strong>/Fishing-Locations-Public-<strong>Water</strong>s/Region-2/<strong>Herington</strong>-City-Lake-NewFigure 1. <strong>Herington</strong> <strong>Reservoir</strong>, <strong>Dickinson</strong> <strong>County</strong>, <strong>Kansas</strong>.Location: <strong>Herington</strong> Lake and <strong>Herington</strong> <strong>Reservoir</strong> are located about 2 mileswest of the town of <strong>Herington</strong> in <strong>Dickinson</strong> <strong>County</strong>, <strong>Kansas</strong>.Purpose: <strong>Water</strong> supply, recreation, and flood control.History of Construction: Both the lake and the reservoir are owned locally bythe City of <strong>Herington</strong>. <strong>Herington</strong> Lake was finished in 1923. The <strong>Reservoir</strong> wasbuilt in 1982 under the <strong>Water</strong>shed Protection and Flood Prevention Act by thecity of <strong>Herington</strong> with the assistance of the Soil Conservation Service, U.S.Department of Agriculture. The dam structure is Lyon Creek <strong>Water</strong>shed Multiple-Purpose Structure No. 6. The <strong>Reservoir</strong> is the primary source of water for thetowns of <strong>Herington</strong>, Hope, Woodbine, and Latimer.Structure and Spillway Type: Both dams are rolled earth-fill type. <strong>Herington</strong><strong>Reservoir</strong> Dam is 2410 feet long, 52 feet high, and has a 300 foot uncontrolledspillway.1
<strong>Dickinson</strong> <strong>County</strong>, <strong>Kansas</strong>ManchesterChapmanAbileneEnterpriseWoodbineCarltonHope<strong>Herington</strong>-Miles0 1.5 3 6 9 12Figure 2. Location of <strong>Herington</strong> Lake and <strong>Herington</strong> <strong>Reservoir</strong> in <strong>Dickinson</strong> <strong>County</strong>.2
<strong>Reservoir</strong> Bathymetric (Depth) Surveying ProceduresKBS operates a Biosonics DT-X acoustic echosounding system(www.biosonicsinc.com) with a 200 kHz split-beam transducer and a 38-kHz singlebeamtransducer. In addition to providing basic information on reservoir depth profiles,the Biosonics system also permits the assessment of bottom sediment composition.Latitude-longitude information is provided by a JRC global positioning system (GPS)that interfaces with the Biosonics system. ESRI’s ArcGIS is used for on-lake navigationand positioning, with GPS data feeds provided by the Biosonics unit through a serialcable. Power is provided to the echosounding unit, command/navigation computer, andauxiliary monitor by means of a inverter and battery backup device that in turn drawpower from the 12-volt boat battery.Pre-survey preparation:Geospatial reference data: Prior to conducting the survey, geospatial data of the targetlake is acquired, including georeferenced National Agricultural Imagery Project (NAIP)photography. The lake boundary is digitized as a polygon shapefile from the FSA NAIPgeoreferenced aerial photography obtained online from the Data Access and ServiceCenter (DASC) at the <strong>Kansas</strong> Geological Survey. Prior to the lake survey, a series oftransect lines are created as a shapefile in ArcGIS for guiding the boat during thesurvey. Transect lines are spaced more closely (25-50 meters separation) on smallerstate/local lakes, while a spacing of 100-150 meters is used for federal reservoirs.Survey procedures:Calibration (Temperature and ball check): After boat launch and initialization of theBiosonics system and command computer, system parameters are set in the BiosonicsVisual Acquisition software. The temperature of the lake at 1-2 meters is taken with aresearch-grade metric electronic thermometer. This temperature, in degrees Celsius, isinput to the Biosonics Visual Acquisition software to calculate the speed of sound inwater at the given temperature at the given depth. Start range, end range, pingduration, and ping interval are also set at this time. A ball check is performed using atungsten-carbide sphere supplied by Biosonics for this purpose. The ball is lowered to aknown distance (1.0 meter) below the transducer faces. The position of the ball in thewater column (distance from the transducer face to the ball) is clearly visible on theechogram. The echogram distance is compared to the known distance to assure thatparameters are properly set and the system is operating correctly.On-lake survey procedures: Using the GPS Extension of ArcGIS, the GPS data feedfrom the GPS receiver via the Biosonics echosounder, and the pre-planned transectpattern, the location of the boat on the lake in real-time is shown on thecommand/navigation computer screen. To assist the boat operator in navigation, anauxiliary LCD monitor is connected to the computer and placed within the easy view ofthe boat operator. Transducer face depth on all dates is 0.5 meters below the watersurface. The transect pattern is maintained except when modified by obstructions in thelake (e.g., partially submerged trees) or shallow water and mudflats. Data areautomatically logged in new files every half-hour (approximately 9000-ping files) by theBiosonics system.3
Establishment Of Lake Level On Survey Dates:State and Local <strong>Reservoir</strong>s:Most state and local lakes in <strong>Kansas</strong> do not have water surface elevationgauges. Therefore, a local benchmark at the edge of a lake is established, typically aconcrete pad or wall adjacent to the water. The location of the benchmark isphotographed and a description noted. On the day of the survey, the vertical distancebetween the water surface and the surface of the benchmark is measured. In caseswhere the benchmark must be established a distance away from the lake, a surveygradelaser level is used to establish the vertical distance between benchmark andwater surface.A TopCon HiPerLite+ survey-grade static global positioning system is used toestablish the height of the benchmark. The unit is set at a fixed distance above thebenchmark, and the vertical distance between the benchmark and the AntennaReference Point recorded. The unit is allowed to record data points for a minimum oftwo hours at a rate of one point every 10 seconds.Following GPS data acquisition, the data are downloaded at the office from theGPS unit, converted from TopCon proprietary format to RINEX format, and uploaded tothe National Geodetic Survey (NGS) On-line Positioning User Service (OPUS). Rawdata are processed by OPUS with respect to three NGS CORS (Continuously OperatingReference Stations) locations and results returned to the user.The elevation of the benchmark is provided in meters as the orthometric height(NAVD88, computed using GEOID03). The vertical difference between the lake surfaceon the survey day is subtracted from the OPUS-computer orthometric height to producethe lake elevation value, in meters. This lake elevation value is entered as an attributeof the lake perimeter polygon shapefile in postprocessing.Lake water surface elevation on June 25, 2008 was 1335.3 feet above sea level.4
Location of Lake Elevation Benchmark:<strong>Herington</strong> <strong>Reservoir</strong> (New <strong>Herington</strong> Lake): The northeast corner of the concrete dockanchor pad adjacent to the main boat ramp on the east side of the lake (off Sage Road).UTM (NAD83, Zone 14): Easting (X) [meters]: 673578.9, Northing (Y) [meters]: 4280754.1Figure 3. View north along boat dock. Lake level was measured from the water surface to the topof the concrete pad at the northeastern edge (right in picture) of the concrete.5
<strong>Herington</strong> <strong>Reservoir</strong> (New)herington_reservoir_OPUS_results.txtNGS OPUS SOLUTION REPORT========================All computed coordinate accuracies are listed as peak-to-peak values.For additional information: www.ngs.noaa.gov/OPUS/Using_OPUS.html#accuracyUSER: mjakub@ku.edu DATE: July 03, 2008RINEX FILE: her1183t.08oTIME: 16:40:27 UTCSOFTWARE: page5 0612.06 master3.pl START: 2008/07/01 19:58:00EPHEMERIS: igr14862.eph [rapid] STOP: 2008/07/01 22:04:00NAV FILE: brdc1830.08n OBS USED: 4968 / 5138 : 97%ANT NAME: TPSHIPER_PLUS NONE # FIXED AMB: 34 / 34 : 100%ARP HEIGHT: .985OVERALL RMS: 0.017(m)REF FRAME: NAD_83(CORS96)(EPOCH:2002.0000)ITRF00 (EPOCH:2008.4997)X: -608250.378(m) 0.006(m) -608251.092(m) 0.006(m)Y: -4950172.910(m) 0.022(m) -4950171.549(m) 0.022(m)Z: 3963008.624(m) 0.033(m) 3963008.503(m) 0.033(m)LAT: 38 39 30.11431 0.023(m) 38 39 30.13684 0.023(m)E LON: 262 59 41.70981 0.007(m) 262 59 41.67364 0.007(m)W LON: 97 0 18.29019 0.007(m) 97 0 18.32636 0.007(m)EL HGT: 378.356(m) 0.034(m) 377.293(m) 0.034(m)ORTHO HGT: 407.657(m) 0.071(m) [NAVD88 (Computed using GEOID03)]UTM COORDINATES STATE PLANE COORDINATESUTM (Zone 14) SPC (1501 <strong>KS</strong> N)Northing (Y) [meters] 4280754.190 36557.760Easting (X) [meters] 673578.968 486598.326Convergence [degrees] 1.24648795 0.62950004Point Scale 0.99997104 1.00000992Combined Factor 0.99991168 0.99995056US NATIONAL GRID DESIGNATOR: 14SPH7357980754(NAD 83)BASE STATIONS USEDPID DESIGNATION LATITUDE LONGITUDE DISTANCE(m)AH9960 FBYN FAIRBURY CORS ARP N400436.713 W0971846.120 159707.9AF9527 HBRK HILLSBORO CORS ARP N381816.715 W0971736.655 46641.2DJ3671 <strong>KS</strong>T5 TOPEKA 5 CORS ARP N390240.554 W0960220.776 94183.4NEAREST NGS PUBLISHED CONTROL POINTJF0403 W 214 N383802. W0970013. 2727.7This position and the above vector components were computed without anyknowledge by the National Geodetic Survey regarding the equipment orfield operating procedures used.6
Ü0 0.1 0.2 0.3 0.4 0.5MilesFigure 4. Bathymetric Survey Transects for <strong>Herington</strong> <strong>Reservoir</strong>7
Post-processing (Visual Bottom Typer)The Biosonics DT-X system produces data files in a proprietary DT4 file formatcontaining acoustic and GPS data. To extract the bottom position from the acousticdata, each DT4 file is processed through the Biosonics Visual Bottom Typer (VBT)software. The processing algorithm is described as follows:“The BioSonics, Inc. bottom tracker is an “end_up" algorithm, in thatit begins searching for the bottom echo portion of a ping from the lastsample toward the first sample. The bottom tracker tracks the bottom echoby isolating the region(s) where the data exceeds a peak threshold for Nconsecutive samples, then drops below a surface threshold for M samples.Once a bottom echo has been identified , a bottom sampling window isused to find the next echo. The bottom echo is first isolated by user_definedthreshold values that indicate (1) the lowest energy to include in the bottomecho (bottom detection threshold) and (2) the lowest energy to start lookingfor a bottom peak (peak threshold). The bottom detection threshold allowsthe user to filter out noise caused by a low data acquisition threshold. Thepeak threshold prevents the algorithm from identifying the small energyechoes (due to fish, sediment or plant life) as a bottom echo.” (BiosonicsVisual Bottom Typer User’s Manual, Version 1.10, p. 70).Data is output as a comma-delimited (*.csv) text file. A set number of qualifying pingsare averaged to produce a single report (for example, the output for ping 31 {whenpings per report is 20} is the average of all values for pings 12-31). Standard analysisprocedure for all 2008 and later data is to use the average of 7 pings to produce oneoutput value.All raw *.csv files are merged into one master *.csv file using the shareware programFile Append and Split Tool (FAST) by Boxer Software (Ver. 1.0, 2006).Post-processing (Excel)The master *.csv file created by the FAST utility is imported into Microsoft Excel.Excess header lines are deleted (each input CSV file has its own header), and theheader file is edited to change the column headers “#Ping” to “Ping” and “E1’ “ to “E11”,characters that are not ingestable by ArcGIS. Entries with depth values of zero (0) aredeleted, as are any entries with depth values less than the start range of the dataacquisition parameter (typically 0.49 meters or less) (indicating areas where the waterwas too shallow to record a depth reading).In Excel, depth adjustments are made. A new field – Adj_Depth – is created. The valuefor AdjDepth is calculated as AdjDepth = Depth + (Transducer Face Depth), where theTransducer Face Depth represents the depth of the transducer face below water level inmeters (Typically, this value is 0.5 meters). Four values are computed in Excel:DepthM, DepthFt, ElevM and ElevFt, where:8
DepthM = Adj_DepthDepthFt = Adj_Depth * 3.28084These water depths are RELATIVE water depths that can vary from day-to-day basedon the elevation of the water surface. In order to normalize all depth measurements toan absolute reference, water depths must be subtracted from an established value forthe elevation of the water surface at the time of the bathymetric survey. Determinationof water surface elevation has been described in an earlier section on establishment oflake levels.To set depths relative to lake elevation, another field is added to the attribute table ofthe point shapefile, ElevM. The value for this attribute is then computed asDepth_ElevM = (Elevation of the <strong>Water</strong> Surface in meters above sea level) - Adj_Depth.Elevation of the water surface in feet above sea level is also computed by convertingElevM to elevation in feet (ElevM * 3.28084).Particularly for multi-day surveys, ADJ_DEPTH, Depth_M, and Depth_Ft should NOTbe used for further analysis or interpolation. If water depth is desired, it should beproduced by subtracting Elev_M or Elev_Ft from the reference elevation used forinterpolation purposes (for federal reservoirs, the elevation of the water surface on theday that the aerial photography from which the lake perimeter polygon was digitized).Post-processing (ArcGIS):Ingest to ArcGIS is accomplished by using the Tools – Add XY Data option. Theprojection information is specified at this time (WGS84). Point files are displayed asEvent files, and are then exported as a shapefile (filename convention:ALLPOINTS_WGS84.shp). The pointfile is then reprojected to the UTM coordinatesystem of the appropriate zone (14 or 15) (filename convention ALLPOINTS_UTM.shp).Raster interpolation of the point data is performed using the same input data and theTopo to Raster option within the 3D Extension of ArcGIS. The elevation of the reservoiron the date of aerial photography used to create the perimeter/shoreline shapefile wasused as the water surface elevation in all interpolations from point data to raster data.Contour line files are derived from the raster interpolation files using the ArcGIScommand under 3D Analyst – Raster Surface – Contour.Area-elevation-volume tables are derived using an ArcGIS extension custom written forand available from the ASTRA Program. Summarized, the extension calculates thearea and volume of the reservoir at 1/10-foot elevation increments from the raster datafor a series of water surfaces beginning at the lowest elevation recorded andprogressing upward in 1/10-foot elevation increments to the reference water surface.Cumulative volume is also computed in acre-feet.9
0 0.1 0.2 0.3 0.4 0.5MilesÜDepth in Feet0.00 - 2.002.01 - 4.004.01 - 6.006.01 - 8.008.01 - 10.0010.01 - 12.0012.01 - 14.0014.01 - 16.0016.01 - 18.0018.01 - 20.0020.01 - 22.0022.01 - 24.0024.01 - 26.0026.01 - 28.002 Ft. ContourFigure 5. <strong>Water</strong> depth based on June 2008 bathymetric survey.Depths are based on a pool elevation of 1335.3 feet.10
Table 1Cumulative area in acres by tenth foot elevation incrementsElevation (ftNGVD) 0.00 0.10 0.20 0.30 0.40 0.50 0.60 0.70 0.80 0.901309 1 1 1 1 1 2 2 2 3 31310 4 4 4 5 6 7 7 8 9 101311 11 12 13 15 16 17 18 19 21 221312 23 25 27 28 30 31 33 34 35 371313 38 40 42 43 44 45 47 49 50 521314 53 55 56 58 59 61 63 64 66 671315 69 70 71 73 74 75 76 77 78 791316 80 82 83 85 86 87 88 90 91 921317 94 95 96 98 99 100 101 103 104 1051318 107 108 109 111 112 114 116 118 120 1221319 124 126 127 129 131 133 134 136 138 1401320 142 144 146 148 151 153 155 157 159 1601321 162 164 166 168 170 173 175 177 179 1811322 183 185 187 189 191 194 196 198 201 2031323 205 208 210 212 214 216 218 219 221 2231324 224 226 227 229 231 233 236 238 241 2441325 247 250 253 256 259 261 264 266 268 2711326 273 275 277 279 281 283 285 287 289 2911327 293 296 298 301 304 307 310 312 315 3171328 320 322 325 328 331 333 336 339 343 3461329 349 352 354 357 359 361 364 366 368 3701330 373 375 378 380 383 385 388 391 394 3971331 400 403 405 408 410 412 414 417 419 4211332 423 426 428 430 432 434 436 438 440 4421333 444 446 448 450 452 454 456 458 461 4631334 465 467 470 472 475 478 480 483 486 4901335 493 498 504 51211
Table 2Cumulative volume in acre-feet by tenth foot elevation incrementsElevation(ft NGVD) 0.00 0.10 0.20 0.30 0.40 0.50 0.60 0.70 0.80 0.901309 0 0 0 0 0 1 1 1 1 21310 2 2 3 3 4 4 5 6 7 71311 9 10 11 12 14 15 17 19 21 231312 25 28 30 33 36 39 42 46 49 531313 56 60 64 69 73 77 82 87 92 971314 102 107 113 119 125 131 137 143 150 1561315 163 170 177 184 192 199 206 214 222 2301316 238 246 254 262 271 280 288 297 306 3151317 325 334 344 353 363 373 383 394 404 4141318 425 436 447 458 469 480 492 503 515 5271319 540 552 565 577 590 604 617 630 644 6581320 672 686 701 716 731 746 761 777 793 8091321 825 841 858 874 891 909 926 943 961 9791322 998 1016 1035 1054 1073 1092 1111 1131 1151 11711323 1192 1212 1233 1254 1276 1297 1319 1341 1363 13851324 1407 1430 1453 1475 1498 1522 1545 1569 1593 16171325 1641 1666 1691 1717 1743 1769 1795 1821 1848 18751326 1902 1930 1957 1985 2013 2041 2070 2098 2127 21561327 2185 2215 2244 2274 2305 2335 2366 2397 2429 24601328 2492 2524 2557 2589 2622 2656 2689 2723 2757 27911329 2826 2861 2897 2932 2968 3004 3040 3077 3113 31501330 3188 3225 3263 3301 3339 3377 3416 3455 3494 35341331 3574 3614 3655 3695 3736 3777 3819 3860 3902 39441332 3986 4029 4072 4114 4158 4201 4244 4288 4332 43761333 4421 4465 4510 4555 4600 4645 4691 4736 4782 48291334 4875 4922 4969 5016 5063 5111 5159 5207 5256 53051335 5354 5404 5454 550612
600500400Cumulative Area (acres)30020010001308 1310 1312 1314 1316 1318 1320 1322 1324 1326 1328 1330 1332 1334 1336Elevation (feet)Figure 6. Cumulative area-elevation curve700060005000Cumulative Volume (acre-feet)400030002000100001308 1310 1312 1314 1316 1318 1320 1322 1324 1326 1328 1330 1332 1334 1336Elevation (feet)Figure 7. Cumulative volume-elevation curve13
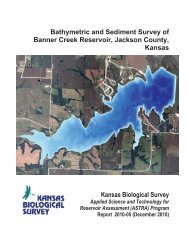
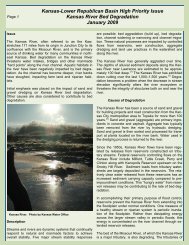
SEDIMENT SAMPLING PROCEDURESSediment samples were collected from three sites within the reservoir using a Wildcodrop-corer (Wildlife Supply Company, Buffalo, NY). One sample is taken near the dam;a second at mid-lake; and a third in the upper end/transitional area. Sampling istypically performed on the same day as the bathymetric survey, following completion ofthe survey. As the drop-corer samples only the upper sediment, the entire sample ineach case is collected and sealed in a sampling container. Samples are then shippedto MidWest Laboratories (Omaha, NE), for texture, bulk density, and other analyses.SEDIMENT SAMPLING RESULTS:Sampling sites were distributed across the length of the reservoir (Figure 8). Samplesite particle size distributions were relatively uniform and identical across the reservoir.All three sites are dominated by silt (56-65%) with clay as a secondary fraction (32-33%) and sand only a minor fraction (2-12%) (Table 3; Figure 9; Figure 10).Table 3<strong>Herington</strong> <strong>Reservoir</strong> Sediment Sampling Site DataCODE UTMX UTMY Sand % Silt % Clay %HR-1 672495.8 4279307.1 12 56 32HR-2 672877.3 4280112.2 2 65 33HR-3 673356.9 4280921.6 10 58 32Coordinates are Universal Transverse Mercator (UTM), NAD83, Zone 14 North14
HR#3 - Dam end!.HR#2 - Midlake!.HR#1 - Upper Lake!.0 0.1 0.2 0.3 0.4 0.5MilesFigure 8. Sediment sampling sites in <strong>Herington</strong> <strong>Reservoir</strong>Ü15
<strong>Herington</strong> <strong>Reservoir</strong>2008 Sediment Particle Size Analysis100%90%80%70%60%50%40%30%20%10%0%HR-1 HR-2 HR-3Sample Site% Clay% Silt%SandFigure 9. Sediment particle size analysis.16
HR#3 - Dam endHR#2 - MidlakeHR#1 - Upper LakeParticle SizeDistributionsSandSiltClay0 0.1 0.2 0.3 0.4 0.5MilesFigure 10. Sediment particle size analysis for sites in <strong>Herington</strong> <strong>Reservoir</strong>Ü17