Experience Gathered from the Use of ANSYS - TechNet Alliance
Experience Gathered from the Use of ANSYS - TechNet Alliance
Experience Gathered from the Use of ANSYS - TechNet Alliance

Create successful ePaper yourself
Turn your PDF publications into a flip-book with our unique Google optimized e-Paper software.
Summary<br />
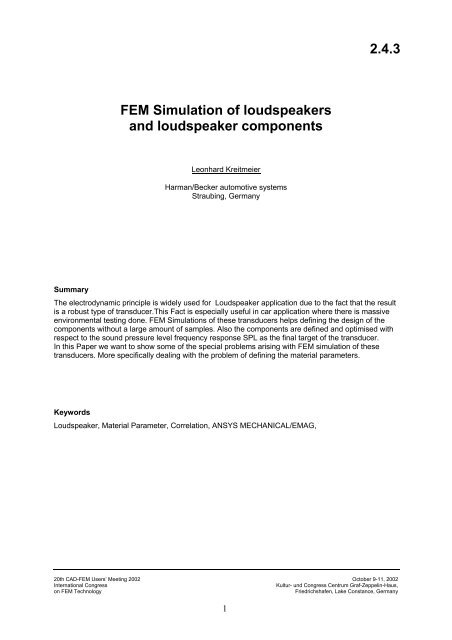
FEM Simulation <strong>of</strong> loudspeakers<br />
and loudspeaker components<br />
Leonhard Kreitmeier<br />
Harman/Becker automotive systems<br />
Straubing, Germany<br />
The electrodynamic principle is widely used for Loudspeaker application due to <strong>the</strong> fact that <strong>the</strong> result<br />
is a robust type <strong>of</strong> transducer.This Fact is especially useful in car application where <strong>the</strong>re is massive<br />
environmental testing done. FEM Simulations <strong>of</strong> <strong>the</strong>se transducers helps defining <strong>the</strong> design <strong>of</strong> <strong>the</strong><br />
components without a large amount <strong>of</strong> samples. Also <strong>the</strong> components are defined and optimised with<br />
respect to <strong>the</strong> sound pressure level frequency response SPL as <strong>the</strong> final target <strong>of</strong> <strong>the</strong> transducer.<br />
In this Paper we want to show some <strong>of</strong> <strong>the</strong> special problems arising with FEM simulation <strong>of</strong> <strong>the</strong>se<br />
transducers. More specifically dealing with <strong>the</strong> problem <strong>of</strong> defining <strong>the</strong> material parameters.<br />
Keywords<br />
Loudspeaker, Material Parameter, Correlation, <strong>ANSYS</strong> MECHANICAL/EMAG,<br />
20th CAD-FEM <strong>Use</strong>rs’ Meeting 2002 October 9-11, 2002<br />
International Congress Kultur- und Congress Centrum Graf-Zeppelin-Haus,<br />
on FEM Technology Friedrichshafen, Lake Constance, Germany<br />
1<br />
2.4.3
1. Introduction<br />
The investigation is done to an electrodynamic loudspeaker. (Fig. 1).<br />
Figure 1:<br />
electrodynamic loudspeaker<br />
This speaker consists <strong>of</strong> <strong>the</strong> following main parts which are<br />
• a vibrating mechanical structure (membrane, dust cup, voice coil, voice coil former, surround<br />
and spider) which is clamped or glued to a basket (Fig. 2).<br />
• a fixing structure (basket) (Fig. 3).<br />
• a motor unit (Magnet structure) which is also fixed to <strong>the</strong> basket. (Fig. 4).<br />
Figure 2: vibrat.structure<br />
Figure 3: basket<br />
Figure 4: motor unit<br />
This structure is assembled that way that <strong>the</strong> voice coil, which is part <strong>of</strong> <strong>the</strong> vibrating structure, is<br />
placed in <strong>the</strong> radial air gap <strong>of</strong> <strong>the</strong> permanent magnet structure.<br />
The electrical signal is now transferred via Lorenzforces acting on <strong>the</strong> voice coil, due to <strong>the</strong> interaction<br />
<strong>of</strong> <strong>the</strong> current in <strong>the</strong> voice coil and <strong>the</strong> Magnet field in <strong>the</strong> air gap <strong>of</strong> <strong>the</strong> magnet system. Thus an axial<br />
movement (vibration) <strong>of</strong> <strong>the</strong> structure is created (electro dynamic interaction). The vibrating structure<br />
(membrane) <strong>the</strong>n creates air waves in <strong>the</strong> audio frequency range. (Fig. 1).<br />
The FEM Simulation <strong>of</strong> this structure and <strong>of</strong> its parts has <strong>the</strong> target to create a constant sound<br />
pressure level over <strong>the</strong> operating audio frequency range. Also <strong>the</strong> limitation <strong>of</strong> this vibration (motion) in<br />
a defined manner and level is part <strong>of</strong> this simulations.<br />
Denomination <strong>of</strong> certain parts <strong>of</strong> <strong>the</strong> vibrating structure (Fig. 5).<br />
membran<br />
surround<br />
spider<br />
Voice coil<br />
Figure 5: vibrating structure<br />
Dust cup<br />
former<br />
20th CAD-FEM <strong>Use</strong>rs’ Meeting 2002 October 9-11, 2002<br />
International Congress Kultur- und Congress Centrum Graf-Zeppelin-Haus,<br />
on FEM Technology Friedrichshafen, Lake Constance, Germany<br />
2
2. Simulation <strong>of</strong> electrodynamic Loudspeakers and <strong>the</strong>ir components<br />
Some examples for this type <strong>of</strong> calculations are magnet calculations, none linear force excursion,<br />
Force Factor Bl versus excursion calculation for magnet-voice coil configuration and frequency<br />
response calculation for <strong>the</strong> complete loudspeaker.<br />
• magnet simulation (optimisation) Fig. 6a,b<br />
Flux Density B in <strong>the</strong> air gap<br />
Created are Design spaces <strong>of</strong> geometric data versus <strong>the</strong> Flux Density B[T] in <strong>the</strong> air gap. The<br />
variables to be optimised in this calculations, are iron part thicknesses, magnet material type<br />
and dimension. Principle design space plots are<br />
preferred versus single optimisation results (f.e.<br />
random optimisation because <strong>of</strong> changing<br />
optimisation target functions.<br />
Figure 6a: magnet<br />
• magnet simulation (large signal) Fig. 7a,b<br />
Force Factor BL versus excursion x<br />
Figure 6b: Design Space<br />
The Designspace consists <strong>of</strong> <strong>the</strong> configuration type <strong>of</strong> magnet system and voice coil system. The<br />
target is to design this excursion function <strong>of</strong> <strong>the</strong><br />
Force Factor Bl [ Tm] in a way that <strong>the</strong> distortion <strong>of</strong><br />
<strong>the</strong> transducer is minimised. Target function is<br />
created by special large signal measurement<br />
s<strong>of</strong>tware.<br />
Figure 7a:<br />
• suspension simulation ( large signal )<br />
Force versus excursion<br />
Figure 7b: Bl vers. Excursion ( voice coil)<br />
The Force – Excursion curve for <strong>the</strong> components (spider,surround) or <strong>the</strong> complete speaker, is<br />
evaluated by a none linear calculation. The figure 8b show results for a spider and <strong>the</strong> variation <strong>of</strong> its<br />
roll height. This allows geometric design<br />
with respect to excursion limits. Fig. 8a,b<br />
spider<br />
Figure 8a:<br />
Roll height<br />
Figure 8b: Force-Excursion ( spider )<br />
20th CAD-FEM <strong>Use</strong>rs’ Meeting 2002 October 9-11, 2002<br />
International Congress Kultur- und Congress Centrum Graf-Zeppelin-Haus,<br />
on FEM Technology Friedrichshafen, Lake Constance, Germany<br />
3
• frequency response Topology Correlation<br />
Sound Pressure Level (SPL) versus frequency<br />
( dome tweeter ) Fig. 9a,b<br />
The sound pressure frequency response is used two ways<br />
- as a target function <strong>of</strong> an existing sample for material parameter definition<br />
- optimisation for <strong>the</strong> geometric design data <strong>of</strong> <strong>the</strong> transducer.<br />
In this example <strong>the</strong> frequency response curve for a dome tweeter is calculated <strong>from</strong> 8kHz up to 30kHz.<br />
The results are used to determine <strong>the</strong> material parameters <strong>of</strong> <strong>the</strong> dome tweeter components by<br />
correlation with <strong>the</strong> measured response.Sensitivity<br />
analysis <strong>of</strong> <strong>the</strong> parameters allow to detect <strong>the</strong><br />
influence <strong>of</strong> <strong>the</strong> parameter on part <strong>of</strong> <strong>the</strong> response<br />
curve and how it is typically changed.So certain<br />
specifics <strong>of</strong> <strong>the</strong> frequency response should be<br />
reproduced.<br />
Figure 9a:<br />
Figure 9b: Sound Pressure Level (SPL)<br />
frequency response<br />
3. Special requirements <strong>of</strong> an acoustic frequency response calculation<br />
Now we want to look at certain specifics <strong>of</strong> calculating sound pressure level frequency response curve<br />
by FEM simulation means with <strong>ANSYS</strong>/MECHANICAL.<br />
What is <strong>of</strong> interest here are certain requirements concerning frequency calculation <strong>of</strong> <strong>the</strong> complete<br />
loudspeaker over <strong>the</strong> audio frequency range.<br />
3.1. Initial considerations<br />
specifics on loudspeaker frequency response calculation should be considered here.<br />
Initial considerations<br />
• Axisymetric calculation in 2D<br />
• Air space is reduced to 0.37 m<br />
• Exact FEM modelling <strong>of</strong> geometry, wave guide, inner air spaces and glue is necessary<br />
• sensitivity <strong>of</strong> <strong>the</strong> frequency response result is very high to geometric variations,<br />
so <strong>the</strong> geometric data must be defined very exactly<br />
• Results data <strong>of</strong> <strong>the</strong> FEM simulation ( Frequency resonse,basic resonance fo,excursion x ) are used<br />
in different ways<br />
to correlate with measured data <strong>of</strong> a sample to determine material parameters<br />
to make design optimisation <strong>of</strong> geometric data in case <strong>the</strong> material parameters are defined.<br />
The calculation is now performed as a harmonic calculation (Small Signal Domain)<br />
20th CAD-FEM <strong>Use</strong>rs’ Meeting 2002 October 9-11, 2002<br />
International Congress Kultur- und Congress Centrum Graf-Zeppelin-Haus,<br />
on FEM Technology Friedrichshafen, Lake Constance, Germany<br />
4
3.2. special requirements <strong>of</strong> acoustic calculations<br />
Specialities <strong>of</strong> a acoustic frequency response calculation<br />
The specifics for such an acoustic calculations are<br />
3.2.1 Frequency bandwidth is large<br />
The frequency bandwidth for this transducers is very high . Fig. 10<br />
• The frequency bandwidth covers <strong>the</strong> whole<br />
audio bandwidth <strong>from</strong> 20 Hz to 20 kHz.<br />
• Measured frequency range for <strong>the</strong> devices<br />
is 0 Hz up to 30 kHz.<br />
3.2.2 multi physic coupling<br />
SPL<br />
20 Hz<br />
8 kHz<br />
30 000 Hz<br />
Figure 10: frequency response bandwidth<br />
f [Hz]<br />
There is a series <strong>of</strong> energy conversion <strong>from</strong> electrical signal to <strong>the</strong> final sound pressure wave in air.<br />
Fig. 10<br />
Sound Pressure Level SPL<br />
• <strong>the</strong> fluid-structure coupling<br />
<strong>the</strong> mechanical vibration creates an<br />
acoustic pressure wave.<br />
• <strong>the</strong> electrodynamic coupling<br />
electrical signal is converted to<br />
mechanical vibration <strong>of</strong> <strong>the</strong> structure.<br />
3.2.3 number <strong>of</strong> DOF´s is extremely high<br />
Figure 11: multi physic coupling<br />
Lorenz Force F<br />
<strong>the</strong> number <strong>of</strong> DOF´s becomes under certain conditions very high dependent on dimension and upper<br />
frequency limit Fig.12a,b,c<br />
• <strong>the</strong> main contribution due to air alements<br />
• size <strong>of</strong> <strong>the</strong> elements is defined by upper bandwidth limit<br />
Abbildung 12a:<br />
structure<br />
Elements : 906<br />
DOF´s : 1812<br />
Calc.time (25 frequ.) :<br />
Figure 12b:<br />
Structur+air space 0.375 m<br />
Elements : 14040<br />
DOF´s : 14946<br />
Calc.time (25 frequ.) : 7 min<br />
Figure 12c:<br />
Structur+air space 0.375 m<br />
Elements : 74646<br />
DOF´s : 75552<br />
Calc.time (25 frequ.) : -3 Std.<br />
20th CAD-FEM <strong>Use</strong>rs’ Meeting 2002 October 9-11, 2002<br />
International Congress Kultur- und Congress Centrum Graf-Zeppelin-Haus,<br />
on FEM Technology Friedrichshafen, Lake Constance, Germany<br />
5
3.2.4 difference <strong>of</strong> 2D and 3D calculation (radiating modes)<br />
A 2D calculation is sufficient because only radial modes are contributing to <strong>the</strong> radiation. Only in<br />
special cases a 3D calculation is necessary (Oval transducers,<br />
asymmetric overlap <strong>of</strong> glued parts,etc,). High amount <strong>of</strong> elements<br />
and thus an extended calculation time is achieved by solving a<br />
3D Problem and keeping <strong>the</strong> resolution at <strong>the</strong> measurement point<br />
<strong>the</strong> same as in <strong>the</strong> 2D axisymetric case. Fig. 13a,b,c<br />
Figure 13a:<br />
Structur+air space 0.375 m<br />
Elements : 14040<br />
DOF´s : 14946<br />
Calc.time (25 frequ.) : 7 min<br />
3.2.5 material parameters are frequency dependent<br />
Figure 13b:<br />
Structur+air space 0.375 m<br />
Elements : 560.000<br />
DOF´s : 560.000<br />
Calc.time (25 frequ.) : -8 days<br />
Figure 13c:<br />
Structur+air space 0.375 m<br />
Elements : 74646<br />
DOF´s : 75552<br />
Calc.time (25 frequ.) : -3 hours.<br />
Material Parameters for most materials (paper,polymers, glues) are frequency dependent over this<br />
extended frequency range.Measurements have been<br />
done on this area and show a clear dependency on<br />
E-Module<br />
frequency and temperature over <strong>the</strong> audio frequency<br />
range.<br />
5 °C<br />
• Measurements on Polyvinylchlorid results <strong>from</strong><br />
Becker and Oberst are shown in Fig. 14. [1] [2]<br />
• The frequency range is <strong>from</strong> 10 Hz to 10 kHz<br />
• The temperature range <strong>from</strong> 5 °C to 120 °C<br />
• The Module is changing <strong>from</strong> 1.0e7 Pa to 5.0e9 Pa.<br />
3.2.6 to measure frequency parameter<br />
120 °C<br />
Figure 14: E-Module <strong>of</strong> Polyvinylchlorid<br />
Most available material parameter measurement tools are only for static measurements. The<br />
consequence is for <strong>the</strong> determination <strong>of</strong> material parameters values at higher frequencies <strong>the</strong>re is a<br />
need to relay on correlation with result values ( frequency response, etc).<br />
• measurement technique frequency range temperature range<br />
• Push/Pull measurement 0Hz -40-300 °C<br />
• Rotary-vibrating measurement 2Hz -40-300 °C<br />
( Dreh/Schwingversuch )<br />
• DMTA Dynamic Mechanical Thermal Analysis 1 - 200Hz -40-300 °C<br />
• Modal Analysis measurement (by Laser) 1Hz - 5kHz -40-300 °C<br />
Modal Correlation S<strong>of</strong>tware (LMS,IDEAS)<br />
• Special Rotary-Vibration measurement 1Hz – 5 kHz -40-300 °C<br />
( Mastering Technique ) 1Hz – 10 kHz -40-300 °C<br />
20th CAD-FEM <strong>Use</strong>rs’ Meeting 2002 October 9-11, 2002<br />
International Congress Kultur- und Congress Centrum Graf-Zeppelin-Haus,<br />
on FEM Technology Friedrichshafen, Lake Constance, Germany<br />
6
3.2.7 Material parameter correlation<br />
For <strong>the</strong> entire frequency range correlation’s with result values like frequency response are <strong>the</strong> only<br />
way to determine material parameter values. In <strong>the</strong> case <strong>of</strong> <strong>the</strong> frequency response <strong>the</strong> correlation is<br />
done reproducing <strong>the</strong> special characteristics <strong>of</strong> <strong>the</strong> response curve. If <strong>the</strong>re are none <strong>the</strong>n samples are<br />
created with different configuration (shapes, wave guide, etc ) or reduced amount <strong>of</strong> materials.<br />
There are certain categories ( force-excursion, resonances, response curve) used for correlation<br />
• correlation measurement component frequency range<br />
• static force-excursion measurement surround/spider 0 Hz<br />
• static force-3D deformation measurement cone 0 Hz<br />
• Basic resonance measurement surround/spider 50 Hz – 2 kHz<br />
• surround resonance Measurement surround 1 kHz<br />
• cone resonance measurement cone 15 kHz<br />
• Frequency response <strong>of</strong> SPL (Topology) loudspeaker 10 Hz – 30 kHz<br />
• consistent multi response correlation loudspeaker 10 Hz – 30 kHz<br />
• general sensitivity analysis<br />
• special samples with reduced amount <strong>of</strong> materials<br />
3.2.8 large amount <strong>of</strong> materials<br />
The loudspeaker consists <strong>of</strong> a large amount <strong>of</strong> materials which are connected to each o<strong>the</strong>r. Mostly<br />
These parts are glued but <strong>the</strong>re is also <strong>the</strong> possibility <strong>of</strong> clamping. They all interact creating <strong>the</strong><br />
frequency response curve.<br />
So only those parameter formulations (damping models) are available which can be assigned to a lot<br />
<strong>of</strong> materials (material dependent damping ß i).<br />
• minimum 2 materials<br />
( membrane, glue)<br />
• maximum up to 14 materials<br />
3.2.9 restriction on material models to be used (due to large amount <strong>of</strong> materials)<br />
Only those parameter formulations are available in <strong>ANSYS</strong>/MECHANICAL which can be assigned to a<br />
lot <strong>of</strong> materials ( material dependent damping ß i )<br />
• large amount <strong>of</strong> materials<br />
• only certain damping mechanisms<br />
can be used (material dependent<br />
ß damping and element damping)<br />
• parameter <strong>of</strong> <strong>the</strong> damping model<br />
is used as adjustment parameter Figure 16: damping mechanisms in <strong>ANSYS</strong><br />
in an energetic view.<br />
Global mass damping<br />
element damping<br />
3.2.10 MACRO in APDL<br />
Global structural damping Global constant damping<br />
Material depending structural damping<br />
To incorporate <strong>the</strong>se aspects into <strong>the</strong> calculation and using frequency dependent material parameters<br />
an external Macro in APDL is created for <strong>the</strong>se calculations.<br />
This external Macro in APDL allows to formulate <strong>the</strong> material parameters as frequency dependent<br />
functions as well as to use simply material dependent constant damping.<br />
Iteration process <strong>of</strong> external macro (Ansys APDL language)<br />
allows for<br />
- application <strong>of</strong> material parameter functions (redefining and remeshing)<br />
- constant damping ratio for different materials<br />
- to choose linear or logarithmic frequency spacing<br />
20th CAD-FEM <strong>Use</strong>rs’ Meeting 2002 October 9-11, 2002<br />
International Congress Kultur- und Congress Centrum Graf-Zeppelin-Haus,<br />
on FEM Technology Friedrichshafen, Lake Constance, Germany<br />
7
4. Examples<br />
We want to go into details showing 2 examples <strong>of</strong> determining material parameters by correlation.<br />
4.1. material parameter correlation <strong>of</strong> cone membrane<br />
In this example <strong>the</strong> frequency dependent material parameter <strong>of</strong> different paper cones is determined by<br />
use <strong>of</strong> correlation.<br />
• Theoretical response curve known <strong>from</strong><br />
measurements. [1] [2]<br />
( see point 4.1.1 )<br />
• in <strong>the</strong> static case correlation with force-excursion<br />
measurements are performed (3D deformation <strong>of</strong><br />
cone )<br />
( see point 4.1.2 )<br />
• In <strong>the</strong> upper frequency range 3kHz to 10 kHz<br />
resonances <strong>of</strong> <strong>the</strong> cone are used for correlation.<br />
( in this frequency range <strong>the</strong> cone does not vibrate<br />
as a rigid poston – cone break up region )<br />
( see point 4.1.3 )<br />
4.1.1 <strong>the</strong>oretical response curve<br />
Theoretic response curve <strong>from</strong> measurements<br />
by Becker and Oberst on Polyvinylchlorid [1] [2]<br />
Fig. 17<br />
The absolute values <strong>of</strong> <strong>the</strong> E-module function depends<br />
on <strong>the</strong> s<strong>of</strong>tening temperature <strong>of</strong> <strong>the</strong> material used.<br />
In principle <strong>the</strong>re is a continuos raising function with<br />
temperature.<br />
4.1.2 static case force-excursion correlation<br />
2.<br />
Cone res. 3.<br />
1.<br />
Force-excurs. <strong>the</strong>ory<br />
Figure 16: frequ.depending E <strong>of</strong> paper cone<br />
Abbildung 17: E-Module Polyvinylchlorid<br />
In <strong>the</strong> static case correlation with force-excursion measurements are performed.(3D deformation <strong>of</strong><br />
cone Fig. 18a,b,c,d<br />
• in <strong>the</strong> static case <strong>the</strong> Youngs modulus E is determined by correlation with force-excursion<br />
measurements<br />
• this correlation is a replacement for static push/pull measurement done with special tailored, flat<br />
samples.<br />
• <strong>the</strong> advantage <strong>of</strong> <strong>the</strong> correlation is that <strong>the</strong> initial sample is used.<br />
Figure 18a:<br />
measurement<br />
Figure 18b:<br />
modelling<br />
Figure 18c:<br />
simulation<br />
Figure 18d: correlation<br />
20th CAD-FEM <strong>Use</strong>rs’ Meeting 2002 October 9-11, 2002<br />
International Congress Kultur- und Congress Centrum Graf-Zeppelin-Haus,<br />
on FEM Technology Friedrichshafen, Lake Constance, Germany<br />
8
4.1.3 dynamic case cone resonance correlation<br />
The definition <strong>of</strong> <strong>the</strong> cone material parameter in <strong>the</strong> dynamic case at higher frequencies ( 3 kHz to 10<br />
kHz )is done by correlation with cone resonances. For this case a special sample is created with<br />
removed surround and <strong>the</strong> dust cup replaced by a massive part. So <strong>the</strong> relevant materials remained<br />
are <strong>the</strong> cone and <strong>the</strong> glue to <strong>the</strong> voice coil. In this upper frequency range <strong>the</strong> cone does not vibrate as<br />
a rigid piston. So a multitude <strong>of</strong> resonances are created ( cone break up modes ). Fig. 19a,b<br />
No surround.<br />
Figure 19a:<br />
special sample loudspeaker<br />
(with no surround )<br />
4.1.3 comparison with DMTA measurement<br />
Figure 19b: cone resonances<br />
Comparison <strong>of</strong> <strong>the</strong> correlation results(Fig. 20a) <strong>of</strong> two cone paper materials with DMTA measurements<br />
Fig. 20b show a clear correspondence <strong>of</strong> <strong>the</strong> static values (0Hz or 1Hz) at a temperature <strong>of</strong> 27 °C.<br />
Also <strong>the</strong> tendency <strong>of</strong> <strong>the</strong> frequency dependency towards higher frequency is represented in a<br />
corresponding behaviour towards low temperatures in <strong>the</strong> DMTA measurement.<br />
1.01 GPa<br />
0.56 GPa<br />
Figure 20a:<br />
Determine E-Modulus by correlation<br />
2.9 GPa 2.2 GPa<br />
4.2. dome tweeter frequency response calculation<br />
0.95 GPa<br />
0.54 GPa<br />
Figure 20b:<br />
DMTA measurement <strong>of</strong> E-modulus at 1Hz<br />
Dome Tweeter loudspeaker for high frequency reproduction require a very exact modelling due to <strong>the</strong><br />
fact that <strong>the</strong> sound pressure frequency response SPL shows high sensitivity concerning a variation <strong>of</strong><br />
geometric data.<br />
Two procedures are possible ei<strong>the</strong>r to use one frequency response and detect <strong>the</strong> frequency range<br />
where <strong>the</strong> specific parameter acts upon or to use multiple sample type results using <strong>the</strong> same<br />
materials (consistent set type <strong>of</strong> parameter).<br />
4.1.3 Single frequency response topology<br />
sensitivity analysis <strong>of</strong> material parameters<br />
on <strong>the</strong> frequency response. Fig. 21a,b<br />
Figure 11a: dome<br />
Figure 21b: single frequency<br />
20th CAD-FEM <strong>Use</strong>rs’ Meeting 2002 October 9-11, 2002<br />
International Congress Kultur- und Congress Centrum Graf-Zeppelin-Haus,<br />
on FEM Technology Friedrichshafen, Lake Constance, Germany<br />
9
4.2.2 multi frequency response topology<br />
Sensitivity analysis <strong>of</strong> material parameter on a multitude <strong>of</strong> frequency responses <strong>of</strong> different sample<br />
types using <strong>the</strong> same materials. The changed geometry shapes <strong>of</strong> <strong>the</strong> dome membrane and <strong>the</strong><br />
changed acoustic wave guide in front <strong>of</strong> <strong>the</strong> transducer create a completely different frequency<br />
response behaviour. The effects <strong>of</strong> <strong>the</strong> material parameters on those responses is also different.These<br />
different target response curves allow to identify <strong>the</strong> correct set <strong>of</strong> parameters<br />
Tweeter with wave guide 1. Fig. 22a,b<br />
Tweeter with wave guide 2. Fig. 23a,b<br />
Tweeter without wave guide. Fig. 24a,b<br />
Conclusions<br />
Figure 22a:<br />
Figure 23a:<br />
Figure 24a:<br />
Figure 22b:<br />
Figure 23b:<br />
Figure 24b:<br />
The Problems arising with <strong>the</strong> design <strong>of</strong> Loudspeakers can be solved with Ansys FEM simulations.<br />
Also <strong>the</strong> specific formulations <strong>of</strong> frequency dependent material parameters can be implemented in<br />
Ansys to adapt to <strong>the</strong> requirements <strong>of</strong> loudspeaker Simulations.<br />
The definition and correlation <strong>of</strong> material parameters is <strong>the</strong> most time consuming part <strong>of</strong> <strong>the</strong><br />
simulations. Once <strong>the</strong>se parameters are defined <strong>the</strong> performance <strong>of</strong> <strong>the</strong> loudspeaker, <strong>the</strong> geometric<br />
design, <strong>the</strong> material choice, tolerance considerations, <strong>the</strong> weight and <strong>the</strong> related costs could be<br />
optimised (minimised).<br />
This is a much more time saving and cost optimised procedure <strong>of</strong> adoption to <strong>the</strong> required<br />
performance than to build a huge amount <strong>of</strong> samples.<br />
References<br />
[1] Becker G.W., Oberst H..: "Frequency dependent material parameter <strong>of</strong> Polyvinylchlorid”,Kolloid<br />
Zeitschrift 148, 1956, pp. 6<br />
[2] Cremer L., Heckel M.: "Körperschall", Springer Verlag, 1996, pp 224<br />
20th CAD-FEM <strong>Use</strong>rs’ Meeting 2002 October 9-11, 2002<br />
International Congress Kultur- und Congress Centrum Graf-Zeppelin-Haus,<br />
on FEM Technology Friedrichshafen, Lake Constance, Germany<br />
10