1 Aging and Hail Research of PVC Membranes Frank J. Foley, Jim ...
1 Aging and Hail Research of PVC Membranes Frank J. Foley, Jim ...
1 Aging and Hail Research of PVC Membranes Frank J. Foley, Jim ...

You also want an ePaper? Increase the reach of your titles
YUMPU automatically turns print PDFs into web optimized ePapers that Google loves.
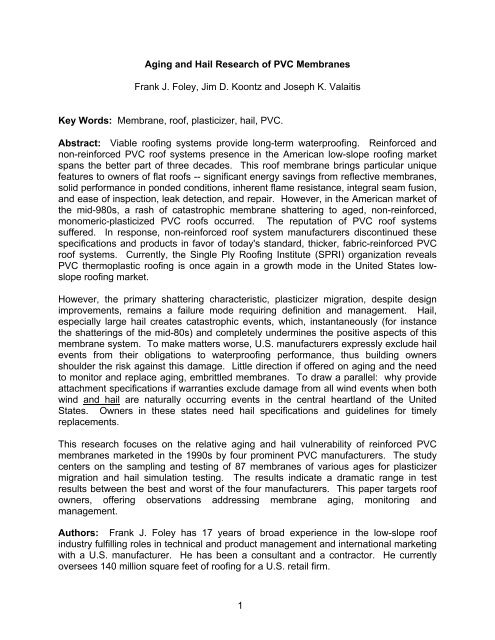
<strong>Aging</strong> <strong>and</strong> <strong>Hail</strong> <strong>Research</strong> <strong>of</strong> <strong>PVC</strong> <strong>Membranes</strong><strong>Frank</strong> J. <strong>Foley</strong>, <strong>Jim</strong> D. Koontz <strong>and</strong> Joseph K. ValaitisKey Words: Membrane, ro<strong>of</strong>, plasticizer, hail, <strong>PVC</strong>.Abstract: Viable ro<strong>of</strong>ing systems provide long-term waterpro<strong>of</strong>ing. Reinforced <strong>and</strong>non-reinforced <strong>PVC</strong> ro<strong>of</strong> systems presence in the American low-slope ro<strong>of</strong>ing marketspans the better part <strong>of</strong> three decades. This ro<strong>of</strong> membrane brings particular uniquefeatures to owners <strong>of</strong> flat ro<strong>of</strong>s -- significant energy savings from reflective membranes,solid performance in ponded conditions, inherent flame resistance, integral seam fusion,<strong>and</strong> ease <strong>of</strong> inspection, leak detection, <strong>and</strong> repair. However, in the American market <strong>of</strong>the mid-980s, a rash <strong>of</strong> catastrophic membrane shattering to aged, non-reinforced,monomeric-plasticized <strong>PVC</strong> ro<strong>of</strong>s occurred. The reputation <strong>of</strong> <strong>PVC</strong> ro<strong>of</strong> systemssuffered. In response, non-reinforced ro<strong>of</strong> system manufacturers discontinued thesespecifications <strong>and</strong> products in favor <strong>of</strong> today's st<strong>and</strong>ard, thicker, fabric-reinforced <strong>PVC</strong>ro<strong>of</strong> systems. Currently, the Single Ply Ro<strong>of</strong>ing Institute (SPRI) organization reveals<strong>PVC</strong> thermoplastic ro<strong>of</strong>ing is once again in a growth mode in the United States lowslopero<strong>of</strong>ing market.However, the primary shattering characteristic, plasticizer migration, despite designimprovements, remains a failure mode requiring definition <strong>and</strong> management. <strong>Hail</strong>,especially large hail creates catastrophic events, which, instantaneously (for instancethe shatterings <strong>of</strong> the mid-80s) <strong>and</strong> completely undermines the positive aspects <strong>of</strong> thismembrane system. To make matters worse, U.S. manufacturers expressly exclude hailevents from their obligations to waterpro<strong>of</strong>ing performance, thus building ownersshoulder the risk against this damage. Little direction if <strong>of</strong>fered on aging <strong>and</strong> the needto monitor <strong>and</strong> replace aging, embrittled membranes. To draw a parallel: why provideattachment specifications if warranties exclude damage from all wind events when bothwind <strong>and</strong> hail are naturally occurring events in the central heartl<strong>and</strong> <strong>of</strong> the UnitedStates. Owners in these states need hail specifications <strong>and</strong> guidelines for timelyreplacements.This research focuses on the relative aging <strong>and</strong> hail vulnerability <strong>of</strong> reinforced <strong>PVC</strong>membranes marketed in the 1990s by four prominent <strong>PVC</strong> manufacturers. The studycenters on the sampling <strong>and</strong> testing <strong>of</strong> 87 membranes <strong>of</strong> various ages for plasticizermigration <strong>and</strong> hail simulation testing. The results indicate a dramatic range in testresults between the best <strong>and</strong> worst <strong>of</strong> the four manufacturers. This paper targets ro<strong>of</strong>owners, <strong>of</strong>fering observations addressing membrane aging, monitoring <strong>and</strong>management.Authors: <strong>Frank</strong> J. <strong>Foley</strong> has 17 years <strong>of</strong> broad experience in the low-slope ro<strong>of</strong>industry fulfilling roles in technical <strong>and</strong> product management <strong>and</strong> international marketingwith a U.S. manufacturer. He has been a consultant <strong>and</strong> a contractor. He currentlyoversees 140 million square feet <strong>of</strong> ro<strong>of</strong>ing for a U.S. retail firm.1
<strong>Jim</strong> D. Koontz, P.E., is a consulting engineer with <strong>Jim</strong> D. Koontz & Associates, Inc. <strong>of</strong>Hobbs, New Mexico, a ro<strong>of</strong>-engineering firm. With 30+ years <strong>of</strong> experience in hailinvestigation, ro<strong>of</strong> research, ro<strong>of</strong> consulting <strong>and</strong> laboratory analysis <strong>of</strong> ro<strong>of</strong>ing materials,he has authored numerous technical articles <strong>and</strong> presented ro<strong>of</strong> seminars regarding avariety <strong>of</strong> ro<strong>of</strong> topics.Joseph K. Valaitis, M.S., is an independent research consultant with Valaitis Consulting<strong>of</strong> Brecksville, Ohio for the rubber <strong>and</strong> plastics industry. He brings 37 years <strong>of</strong> chemicalresearch experience that includes 24 technical articles, chapters to h<strong>and</strong>books onrubber technology <strong>and</strong> 19 patents in polymer mechanics <strong>and</strong> ro<strong>of</strong>ing chemistry.1.0 INTRODUCTIONSix distinct categories <strong>of</strong> membrane systems dominate the current United States lowslopero<strong>of</strong>ing market: built-up asphalt; built-up coal-tar pitch; thermoset rubber (EPDM);SBS-modified bitumen; APP-modified bitumen; <strong>and</strong> thermoplastics (<strong>PVC</strong>, <strong>PVC</strong> alloys,<strong>and</strong> TPO). Selection <strong>of</strong> the optimum ro<strong>of</strong>ing solution for a given project is dependentupon a number <strong>of</strong> building owner's criteria (Table 1). Although some owners focus ononly a few criteria, others may have multiple reasons for selecting a particularmembrane system. All <strong>of</strong> these categories <strong>of</strong> ro<strong>of</strong> systems demonstrate benefits toowners. No single classification <strong>of</strong> ro<strong>of</strong> system satisfies all criteria because each bringsdistinct features to a vast spectrum <strong>of</strong> owner <strong>and</strong> building needs.Initial installed cost Speed <strong>of</strong> installation Warranty <strong>and</strong> perceived health <strong>of</strong>supplierWeight Ease <strong>of</strong> leak detection UV <strong>and</strong> ozone resistanceImpact upon energy Ponding resistance Ease <strong>of</strong> applicationFire rating Aesthetic appearance Life cycle costWind rating Chemical resistance Impact <strong>and</strong> abuse resistanceEnvironmental impact(degradation/disposal)Tolerates movement (thermal<strong>and</strong> structural)Performance in extendedextreme temperaturesEase <strong>and</strong> integrity <strong>of</strong> repair Ease <strong>of</strong> accurate inspection Timeline length -- signal <strong>of</strong>degradation to replacementRo<strong>of</strong> pr<strong>of</strong>ile -- density <strong>of</strong>Compatibility with system Use <strong>and</strong> climate <strong>of</strong> buildingpenetrations, accessibility components <strong>and</strong> deck typeTable 1: Criteria in membrane system selectionHowever, when selecting any ro<strong>of</strong>ing system, specifiers <strong>and</strong> owners must consider thepotential causes <strong>of</strong> failure <strong>of</strong> their selected ro<strong>of</strong>ing system. <strong>Hail</strong> events in particular canundermine a careful membrane selection because <strong>of</strong> a sudden <strong>and</strong> complete loss <strong>of</strong>waterpro<strong>of</strong>ing, resulting in damage to equipment, product, interior finishes, businessenterprise, <strong>and</strong> building structure. The authors have observed hail damage to allexposed ro<strong>of</strong> systems - from thin, non-reinforced, elastomeric skins to thick, reinforced,multi-layer composites. “Exposed” here is defined as any ro<strong>of</strong> system not covered withstone.2
A complete absence <strong>of</strong> answers to questions from many membrane suppliers promptedthis study in the spring <strong>of</strong> 2000. Manufacturers were asked to supply empirical dataavailable regarding the aging <strong>of</strong> ro<strong>of</strong> membrane products <strong>and</strong> the product's hailvulnerability. In other words, should an owner in a hail-prone location plan for a ro<strong>of</strong>replacement at a certain age, or at a certain measure <strong>of</strong> membrane degradation, eventhough the ro<strong>of</strong> system it is still performing?This research focuses on the hail performance <strong>of</strong> only one <strong>of</strong> these classes <strong>of</strong> ro<strong>of</strong>ingsystems -- reinforced, monomeric-plasticized, <strong>PVC</strong> membranes. In the mid to late1980s, the reputation <strong>and</strong> use <strong>of</strong> <strong>PVC</strong> ro<strong>of</strong> systems were negatively impacted byfrequent reports <strong>of</strong> membranes shattering across the United States. Those shatteringswere caused by the impact <strong>of</strong> cold weather contraction on aged <strong>and</strong> embrittled <strong>PVC</strong>membranes. The membranes <strong>of</strong> those reports were non-reinforced <strong>and</strong> <strong>of</strong>ten thinmembranes. Design improvements have been made to <strong>PVC</strong> membranes such as theroutine use <strong>of</strong> fabric reinforcements <strong>and</strong> increased thicknesses. These designimprovements largely restored the reputation <strong>and</strong> acceptance <strong>of</strong> conventional <strong>PVC</strong>membranes. However, the agent <strong>of</strong> destruction in those shatters remains intact -membrane embrittlement caused by plasticizer migration as a result <strong>of</strong> weathering.<strong>Hail</strong>stone impact causes most catastrophic damage to embrittled, current design <strong>PVC</strong>membranes. Owners <strong>and</strong> specifiers <strong>of</strong> <strong>PVC</strong> membranes, appreciating the benefits <strong>of</strong>this class <strong>of</strong> ro<strong>of</strong>s, need to manage against this event.Features <strong>of</strong> <strong>PVC</strong> Ro<strong>of</strong>ing <strong>Membranes</strong><strong>PVC</strong> (polyvinyl chloride) is a ubiquitous polymer. Web sites <strong>of</strong> plastic trade institutesindicate that annual North American dem<strong>and</strong> for <strong>PVC</strong> resin is 14 billion pounds (threebillion kilograms). A large percentage <strong>of</strong> this polymer is used in the constructionindustry as rigid piping, cable sheathing, cabinetry, wall covering, flooring <strong>and</strong> to a smallextent, flat ro<strong>of</strong>ing. <strong>PVC</strong> ro<strong>of</strong> membranes were introduced from Europe to the NorthAmerican low-slope ro<strong>of</strong>ing market in the 1970s. There are many successful <strong>PVC</strong>ro<strong>of</strong>ing applications in service today that are older than 15 years, a common single plywarranty period in the U.S. market.Building owners <strong>and</strong> specifiers <strong>of</strong> exposed <strong>PVC</strong> ro<strong>of</strong> systems <strong>of</strong>ten focus on thefollowing distinct benefits <strong>of</strong> <strong>PVC</strong> ro<strong>of</strong> installations:. competitive installation cost. verification <strong>of</strong> details <strong>and</strong> workmanship ease. installation may occur during very cold <strong>and</strong>/or damp conditions that would impairor prevent installations <strong>of</strong> other ro<strong>of</strong> systems. provision <strong>of</strong> inherent flame-resistant chemistry <strong>of</strong> the base polymer to the ro<strong>of</strong> <strong>of</strong>commercial buildings. across the entire ro<strong>of</strong>, if properly installed is a consistent, predictable fusion <strong>of</strong>membrane panels into a single, flexible waterpro<strong>of</strong>ing skin. ease <strong>of</strong> leak detection, ease <strong>of</strong> repair <strong>and</strong> long-term integrity <strong>of</strong> “the patch”4
Furthermore, a recent U.S. government study consequently indicates that southern U.S.owners <strong>of</strong> large, commercial, low-slope ro<strong>of</strong> systems who select white, reflective ro<strong>of</strong>surfaces will fund their ro<strong>of</strong>ing investment by means <strong>of</strong> <strong>of</strong>fsetting reductions in annualenergy expenses. 3Mode <strong>of</strong> <strong>PVC</strong> Membrane Failure<strong>PVC</strong> membranes provide important benefits to owners <strong>and</strong> specifiers. However, thecharacteristic aging <strong>of</strong> <strong>PVC</strong> membrane is noteworthy. The collective observations <strong>of</strong> theauthors collaborate that long-term failure modes with conventional <strong>PVC</strong> ro<strong>of</strong>membranes are largely about gradual membrane embrittlement due to exposure to theelements - heat <strong>and</strong> ultraviolet light. Although crystallization <strong>of</strong> the base resincontributes to embrittlement, it has always been observed <strong>and</strong> measured that when aconventional <strong>PVC</strong> membrane feels brittle, the plasticizer is departing from themembrane.<strong>PVC</strong> ro<strong>of</strong> membranes are comprised <strong>of</strong> fabric reinforcement <strong>and</strong> film blends both above<strong>and</strong> beneath the reinforcement. The film blends are formulations <strong>of</strong> following three maingroupings:<strong>PVC</strong> resin - 50 to 60% <strong>of</strong> the formula (by weight)Plasticizers - 25 to 35%“All other components” - generally 10 to 15% <strong>of</strong> the formulaThe category “all other components” covers an array <strong>of</strong> ingredients added t<strong>of</strong>ormulations imparting specific properties to the membrane skin - UV resistance,coloration, heat <strong>and</strong> compound stabilizers, process enhancers, antifungal agents, <strong>and</strong>fillers. Fillers defined here are low-cost solids that increase the mass <strong>of</strong> a productwithout compromising its performance.Each manufacturer has proprietary formulations for its <strong>PVC</strong> ro<strong>of</strong> membranes. Theseformulations reflect a delicate balance between the limitations <strong>of</strong> process equipment,marketing <strong>and</strong> pr<strong>of</strong>it goals, <strong>and</strong> design objectives <strong>of</strong> products. <strong>PVC</strong> formulations aresophisticated chemistry with many choices among the three principle groupings - resin,plasticizer, <strong>and</strong> “other” ingredients. Change one component <strong>and</strong> there is an impact onthe production process, membrane cost <strong>and</strong> ro<strong>of</strong> performance.Plasticizing agents are key features <strong>of</strong> <strong>PVC</strong> membrane. They impart flexibility to a solid<strong>PVC</strong> resin. They provide the ability to fuse seams <strong>and</strong> cold temperature performance.Plasticizers are also at the heart <strong>of</strong> a <strong>PVC</strong> membrane failure. <strong>Jim</strong> Koontz notes therelationship between loss <strong>of</strong> plasticizer <strong>and</strong> the resulting changes in physical properties,increase in durometer hardness, increase in specific gravity, loss <strong>of</strong> elongation <strong>and</strong>increase in tensile strength. 4The authors have collectively <strong>and</strong> consistently observed that <strong>PVC</strong> membranes graduallyage <strong>and</strong> become brittle through exposure. Therefore, logic follows, as a result <strong>of</strong> this5
aging process an association between hail vulnerability <strong>and</strong> embrittlement exists.<strong>Hail</strong>stones smaller than 1-inch (25 mm) in diameter have fractured “stiff” membranesfrom one supplier's product as new as 3 years. However, another manufacturer'smembrane, 8 years old <strong>and</strong> still supple, performed through a hailstorm where the stoneswere 2-inches (50 mm) in diameter. These observations indicate distinct differences inplasticizer stability between <strong>PVC</strong> manufacturers. This study attempts to isolate theproducts <strong>of</strong> four major <strong>PVC</strong> membrane suppliers to discover plasticizer content <strong>and</strong> therates <strong>of</strong> plasticizer migration. Furthermore, this study provides indication <strong>of</strong> hailperformance for the membranes <strong>of</strong> these four suppliers. To accomplish this discovery,a large number <strong>of</strong> <strong>PVC</strong> membranes were sampled, plasticizer analysis performed <strong>and</strong>subjected to hail simulation testing.2.0 SAMPLE POPULATIONDuring September 2000, 87 conventional <strong>PVC</strong> membrane samples from the four distinctmanufacturing groups were gathered from the centers <strong>of</strong> 87 low-sloped ro<strong>of</strong>s scatteredprimarily through the central, hail-prone section <strong>of</strong> the United States (Table 2). Theterm, “manufacturing groups,” is used because over a period <strong>of</strong> years, a singlemanufacturer may have more than one manufacturing site. Where there was a reportedchange in manufacturing site <strong>and</strong>/or process, that manufacturer representedconsistency in formulations <strong>and</strong> no change in performance characteristics. Themanufacturing groups issued 15 year warranties for the ro<strong>of</strong> systems at these locations.These warranties provided an expectation <strong>of</strong> 15 years <strong>of</strong> waterpro<strong>of</strong>ing performance.Arizona 5Colorado 12Iowa 7Idaho 1Illinois 5Kansas 6Louisiana 2Minnesota 6Nebraska 2Oklahoma 4So. Carolina 1Texas 35Utah 1Total 87Table 2: Locations <strong>of</strong> sampling by stateWith the exception <strong>of</strong> insulation board thickness, the specifications from the sampledro<strong>of</strong>s were identical.6
Common to all the sampled ro<strong>of</strong>ing systems were the following:. The membranes represented manufacturers producing membranes in the U.S.market for more than 15 years, each with a production capacity <strong>of</strong> at least 25million square feet (2.3 million m 2 ) per year.. Each membrane was a “conventional” monomeric-plasticized <strong>PVC</strong>.. The membrane systems incorporated polyester fabric reinforcements.. Ro<strong>of</strong> systems were “exposed”, mechanically fastened, with rigid polyisocyanurateinsulation board.. The ro<strong>of</strong> membranes were reported to comply with ASTM D 4434.. Nominal thickness measured 45 to 50 mils (1.1 to 1.2 mm). The installed ro<strong>of</strong>systems design slope measured 1.04% (1/8 in 12).Age <strong>of</strong> SamplesThe samples varied in age <strong>of</strong> exposure from the newest at 1 year <strong>and</strong> 2 monthsexposed in the state <strong>of</strong> Utah, to the oldest at 10 years <strong>and</strong> 3 months exposed inOklahoma. The sample age begins as one month after the ship date <strong>of</strong> material to theconstruction site, allowing for installation time.Factoring for UV <strong>Aging</strong>The geographic location <strong>of</strong> a ro<strong>of</strong> has significant impact on aging. For example, a ro<strong>of</strong>in Minnesota does not receive the same heat <strong>and</strong> sun exposure as a ro<strong>of</strong> in Arizona.To account for this significant climatic variation, the membrane age <strong>of</strong> each sample wasfactored (increased or decreased) for UV index depending upon the American statefrom which the sample was taken.The National Oceanic <strong>and</strong> Atmospheric Administration’s (NOAA's) Website providesmean UV index by month <strong>and</strong> by state for the year 1997. 5 A UV index is assigned bythat agency, ranging from 1 to 10. As reference points, Minnesota in January 1997 hadthe lowest assigned relative UV index <strong>of</strong> 1.0 <strong>and</strong> Arizona in July 1997 had the highestassigned UV index <strong>of</strong> 10.0.Of the 13 states from which the samples were taken, the mean annual UV index was4.71. Table 3 illustrates the methodology behind factoring for 2 <strong>of</strong> the 13 states.1997 NOAA Mean UVIndex(a) (a-b/b)Mean UVJAN FEB MAR APR MAY JUN JUL AUG SEP OCTNOV DEC Tot Mean FactorAZ 3 4 6 7 9 10 10 9 7 5 3 2 75 6.25 132.70%MN 1 1 2 4 5 7 6 5 4 2 1 1 39 3.25 69.10%All States: ( b )= 4.71Table 3: Method <strong>of</strong> UV “factoring” using two states as an example7
For 1997 (the only year posted on the web site), the mean monthly UV index for Arizonacalculates to 6.25 while the mean index for Minnesota is 3.25. Within the total average<strong>of</strong> all 13 states in this study (Item b in Table 3) ro<strong>of</strong>s in Arizona were aged an additional32.7%, while ro<strong>of</strong>s in Minnesota were made 30.9% younger.Arizona WeightingMinnesota Weighting(6.25 – 4.71) / 4.71 = + 32.7% (3.25 – 4.71) / 4.71 = - 30.9 %Thus, the age <strong>of</strong> all ro<strong>of</strong> samples taken from Arizona increased by 32.7%, <strong>and</strong> the age<strong>of</strong> Minnesota samples were reduced by 30.9%. Going forward, test results thatreference “UV age” or “UV factored age” are a result <strong>of</strong> this method <strong>of</strong> factoring.This crude method <strong>of</strong> UV factoring makes the assumption that a month's aging processfor a July Arizona ro<strong>of</strong> is 10 times faster than a January Minnesota ro<strong>of</strong>. No empiricalsupport for this consideration exists. Consistent observations <strong>of</strong> sun <strong>and</strong> heat exposureare the two primary weathering agents <strong>of</strong> <strong>PVC</strong> ro<strong>of</strong> aging. Southern U.S. <strong>PVC</strong> ro<strong>of</strong>sage more rapidly than northern ro<strong>of</strong>s. Regardless, as depicted in the next table, this“factoring” bias among the samples is fairly uniform in impact. Underst<strong>and</strong>ably the ro<strong>of</strong>samples among the four manufacturing groups were evenly dispersed, both in age <strong>and</strong>geography.<strong>Aging</strong> by Manufacturing GroupsTable 4 reports four distinct manufacturing groups (group identification here is A, B, C,& D) were sampled with mean age <strong>and</strong> mean UV-factored age.GroupIDNo. <strong>of</strong>SamplesMean Age<strong>of</strong> Samples(Years)FactoredUV Age(Years)DIFF %A 20 5.79 6.08 0.29 5.01%B 21 4.30 4.74 0.44 10.23%C 25 4.95 5.42 0.47 9.49%D 21 5.83 6.05 0.22 3.77%87Table 4: Four manufacturing groups, mean <strong>and</strong> UV factored ageNotably, the newest <strong>of</strong> the four manufacturing groups was Group B with an average age<strong>of</strong> 4.3 years. This group had the greatest amount <strong>of</strong> UV factoring - an additional .44years (about 5 months). If a false-positive bias in aging exists due to the factoringmethod (if a July Arizona ro<strong>of</strong> does not age faster), then Group B will receive thegreatest percentage <strong>of</strong> false bias. In contrast, the oldest <strong>of</strong> the four groups (group Dmean exposure <strong>of</strong> 5.83 years) received the least amount <strong>of</strong> factoring - an additional .22years (about 2-1/2months).8
Sampling MethodWithin a 30-day period, the 87 membrane samples were gathered from the center <strong>of</strong>each ro<strong>of</strong>. Identification markings were made on both the main panel <strong>and</strong> on the “tail” <strong>of</strong>each panel so that collected data could be correlated between panel <strong>and</strong> “tail.” Thecross-seam “tail” samples were cut <strong>of</strong>f <strong>and</strong> express-mailed to an independent chemicaltesting agent for plasticizer analysis. The larger membrane panels were stacked <strong>and</strong>stored in a laboratory environment at the site <strong>of</strong> the hail simulation testing. Thefollowing is a sketch <strong>of</strong> the sample taken from each ro<strong>of</strong> (Illustration 1).Overlap area betweentwo membrane panels3-foot3-footCross-seam “tail”Illustration #1: Plan view <strong>of</strong> sampling, 9.0-sf (.83 m 2 ) membrane sample , with “tail”The tail portion <strong>of</strong> the sample provides a hidden flap underneath the seam weld <strong>of</strong>unexposed membrane. Illustration #2 below sketches the unexposed hidden flap <strong>and</strong>the exposed portion <strong>of</strong> a membrane sample cut out as the cross-seam “tail.”Edge <strong>of</strong> sampled tailWELDExposed portionHidden flapIllustration #2: Cross-seam “tail”9
From the 87 membrane samples, three analyses were made:1. Solvent extraction <strong>of</strong> plasticizer content - hidden flap <strong>and</strong> exposed portion<strong>of</strong> the same membrane.2. Micrometer measurement <strong>of</strong> membrane thickness - hidden flap <strong>and</strong>exposed portion <strong>of</strong> the same membrane.3. <strong>Hail</strong> simulation testing <strong>of</strong> membrane panels.3.0 TEST PROCEDURESSolvent Extraction <strong>of</strong> Plasticizer ContentTo explore the relative rates <strong>of</strong> plasticizer loss among these four major manufacturers,plasticizer was solvent-extracted from both the hidden flap <strong>and</strong> from the exposedportion <strong>of</strong> the membrane. Solvent extraction follows ASTM D 3421 protocol. Theunderlying concept <strong>of</strong> solvent extraction is that a bath <strong>of</strong> aggressive solvent easilyseparates the liquid plasticizer from the polymer resin. The ASTM protocol defines thatthe average extraction is plus or minus 3.3% <strong>of</strong> a complete extraction <strong>of</strong> liquidplasticizer from the <strong>PVC</strong> membrane.Prior to extraction, the sample is weighed <strong>and</strong> then placed into a bath <strong>of</strong> solvent for adefined period <strong>of</strong> time where the plasticizer is drawn out <strong>of</strong> the sample. The bathedsample is allowed to air dry <strong>and</strong> is weighed a second time. At this point, the plasticizeritself is captured as a dilution into the liquid solvent. The reduction in weight <strong>of</strong> the postbathsample represents the amount <strong>of</strong> removed liquid plasticizer. (For additionalchemical analysis <strong>of</strong> the type <strong>of</strong> plasticizer, the solvent may be evaporated, leaving theplasticizer as a residue).By extracting plasticizer from both the hidden flap <strong>and</strong> the exposed portion <strong>of</strong> the samemembrane panel, measurements <strong>of</strong> plasticizer content in both the exposed <strong>and</strong> hiddenportions <strong>of</strong> the membrane can be made. The differences between these two contentsreflect the amount <strong>of</strong> plasticizer that migrated from the membrane as a result <strong>of</strong>exposed weathering. Two qualifications in this analysis are highlighted:1. Solvent extraction is only made from the top layer <strong>of</strong> the membrane.<strong>PVC</strong> ro<strong>of</strong>ing membranes are usually a composite <strong>of</strong> films above <strong>and</strong>below the fabric reinforcement. Mechanical separation was made <strong>of</strong> thefilm above the reinforcement <strong>and</strong> only the top film were analyzed forsolvent extraction. Since the top film withst<strong>and</strong>s direct sunlight <strong>and</strong>weathering, analysis only <strong>of</strong> the top film dramatically reveals theweathering effect <strong>of</strong> exposure.10
Underlying logic would support that the content <strong>and</strong> quality <strong>of</strong> plasticizerbelow the reinforcement serves as a reservoir <strong>of</strong> replacement forplasticizer, which degrades <strong>and</strong> departs the membrane from the topsurface (a sort <strong>of</strong> “balanced equilibrium”). Within this logic, however, theweave structure <strong>of</strong> the fabric reinforcement <strong>and</strong> the presence <strong>of</strong> a coatingaround the reinforcement potentially promote or limit the amount <strong>of</strong>migration from bottom film to top film. Regardless <strong>of</strong> logic, if the layerabove the fabric surfacing loses significant plasticizer, then the top surfacebecomes embrittled <strong>and</strong> loses impact resistance.2. The hidden flap undergoes some small degree <strong>of</strong> aging.Unlike the weathered portion <strong>of</strong> a cross-seam sample, the portion <strong>of</strong>membrane hidden under the flap looks new <strong>and</strong> feels supple. However,because the hidden flap is exposed to ambient temperature <strong>and</strong> humidity,the content <strong>of</strong> the plasticizer measured in the hidden flap is not exactly thesame content <strong>of</strong> plasticizer existing in the membrane when the productwas first shipped. This analysis does not incorporate an estimate <strong>of</strong> thissmall rate <strong>of</strong> hidden flap aging.Micrometer Measurement <strong>of</strong> Membrane ThicknessAs conventional <strong>PVC</strong> membranes are exposed <strong>and</strong> aged, a change in thickness occurs.As an additional analysis, micrometer measurements <strong>of</strong> the cross-seam samples weremade for both the hidden flap <strong>and</strong> the exposed portion. Measurements were made infive locations on each side (hidden <strong>and</strong> exposed) <strong>of</strong> each cross-seam sample <strong>and</strong> theaverage <strong>of</strong> the five measurements are reported. Metric data is <strong>of</strong>fered simply as aconversion.<strong>Hail</strong> Simulation Testing <strong>of</strong> Membrane Panels<strong>Jim</strong> D. Koontz & Associates, Inc. used the larger 3-foot by 3-foot (.9 m by .9 m) section<strong>of</strong> each exposed membrane for hail simulation testing. The following conditions weredefined for this simulated hail testing.Simulation <strong>of</strong> <strong>Hail</strong>stone ProjectileSpheres <strong>of</strong> frozen water were used as projectiles for impact testing against the largemembrane samples. The ice sphere test method was selected since laboratory cast icespheres closely correlate with hail. Prior studies have shown that approximately 75-percent <strong>of</strong> large-sized hail is spherical or nearly spherical in shape. 6 <strong>Hail</strong> density rangeshave been reported between 0.02 lb/inch 3 <strong>and</strong> 0.03 lb/inch 3 (0.7 <strong>and</strong> 0.91 gm/cm 3 ) thelatter value being the density <strong>of</strong> pure ice. The ice spheres used in this research werecast pure ice (Photo 2).11
Photo 2: Sphere <strong>of</strong> frozen ice for impact testingVickie Crenshaw <strong>and</strong> <strong>Jim</strong> Koontz defined this test protocol <strong>of</strong> constructing ice spheres inearlier simulated hail research <strong>of</strong> various ro<strong>of</strong> coverings. 7 Constructing the simulatedhailstones in silicon molds in two stages permitted the expansion <strong>of</strong> ice without cracking.Weighing the mass <strong>of</strong> water into each mold provided consistency <strong>of</strong> sphere masses <strong>and</strong>diameters. Ice spheres were formed at 10 0 F (-12.2 0 C).Size <strong>and</strong> Speed <strong>of</strong> Ice SpheresThe diameters <strong>of</strong> ice spheres tested were 1-inch, 1-1/2-inches, 2-inches, 2-1/2-inches,<strong>and</strong> 3-inches (25 mm, 38 mm, 50 mm, 63 mm, <strong>and</strong> 76 mm). The ice spheres werepropelled from a hail gun at velocities listed by NBS Series No. 23 <strong>and</strong> impactedselected targets. A gauge measured the pressure <strong>of</strong> the compressed air from the hailgun regulated to preset values. An electronic quick-release valve opens releasingcompressed air <strong>and</strong> propels the frozen spheres. A three-screen ballistics timermeasured the sphere velocity. The known mass <strong>and</strong> velocity <strong>of</strong> the sphere allowed foran accurate determination <strong>of</strong> the kinetic “impact” energy.A.P. Laurie, an early hail researcher, derived hail sizes <strong>and</strong> correlating kinetic (impact)energies in the 1960s. 8 Laurie developed this information from data collected by E.G.Bilham <strong>and</strong> E.F. Relf. 9 Laurie graphed the correlation between terminal velocity, haildiameter, <strong>and</strong> approximate kinetic (impact) energy. The values are repeated in Table 5for the stone diameters <strong>of</strong> this test.12
Tension Not Defined <strong>and</strong>/or Introduced in This TestSubsequently, this hail simulation test took into consideration that any hail testingshould include a measurable <strong>and</strong> repeatable level <strong>of</strong> membrane tension. In NorthAmerican ro<strong>of</strong>ing practices, thermoplastic membranes are routinely “kicked tight” priorto welding. Observations conclude that a membrane wrinkle potentially created at thetime <strong>of</strong> ro<strong>of</strong> application disappears with exposure. The loss <strong>of</strong> plasticizer results in acontraction <strong>of</strong> the ro<strong>of</strong> membrane. Once the membrane contraction occurs, the ro<strong>of</strong>membrane will be under constant tension. Additionally, tension will vary according tochanges in ro<strong>of</strong> surface temperature. Therefore, whether initially placed in tension orwhether tension develops as a result <strong>of</strong> aging, future hail testing <strong>of</strong> membranes shouldincorporate a level <strong>of</strong> membrane tension meaningful to the class <strong>of</strong> ro<strong>of</strong> system beingtested, within a defined temperature range.Failure Definition <strong>and</strong> Graduated Impact TestingFor this test, failure from impact testing was defined as any visible evidence <strong>of</strong>membrane fracture, either on the top surface or the underside surface. In practicalterms, a large hole in the membrane surface will require immediate repair. On the otherh<strong>and</strong>, a slight fracture <strong>of</strong> only the top surface <strong>of</strong> a membrane may not be a threat towaterpro<strong>of</strong>ing for a number <strong>of</strong> weeks or even months. Yet the definition <strong>of</strong> failureconsiders both <strong>of</strong> these conditions as a failure. Furthermore, microscopic examination<strong>of</strong> an impact site <strong>of</strong>ten reveals damage to fabric reinforcement or film delamination.However, this definition <strong>of</strong> failure for this test reduces subjective judgment to unassistedvisual observation <strong>of</strong> fracture.Beginning with the test's smallest sphere <strong>of</strong> ice, 1 inch (25 mm), successive firings weremade at the target assembly in 1/2-inch increments through 3-inches (12 mmincrements through 76 mm). Each successive firing was aimed higher in the targetzone. After each firing, laboratory technicians used a waterpro<strong>of</strong> crayon to outline thesize <strong>of</strong> the ice ball at the point <strong>of</strong> impact. Also after each firing, the top surface <strong>of</strong> themembrane was examined for visible fracture. If no fracture was visible, the next largersize <strong>of</strong> ice ball was fired at the assembly at its test-design speed.When visible fracture in the impact zone <strong>of</strong> the weathered face <strong>of</strong> a membrane panelappeared, the test ended, the panel was removed <strong>and</strong> the backside inspected. If visibleevidence <strong>of</strong> a fracture on the backside <strong>of</strong> the panel was confirmed but from a smallersize <strong>of</strong> ice ball, the failure mode is defined to the smaller ice sphere size.If the membrane sample received no visible fracture through all five firings, the panelwas removed from the assembly <strong>and</strong> the backside <strong>of</strong> the membrane was reviewed forfracture. If there was no visible fracture on either side, the test result was recorded as"no failure".14
4.0 TEST RESULTSPlasticizer Loss <strong>and</strong> Thickness ChangeTable 7 reports an arithmetic means for the four manufacturing groups in exposed age<strong>and</strong> UV-factored age, plasticizer contents (as a percent <strong>of</strong> weight), <strong>and</strong> thickness gaugein mils (thous<strong>and</strong>s <strong>of</strong> an inch).Sample Data by Group ( A ) ( B ) ( B/A ) ( C ) ( D ) ( D/C ) ( E ) ( F ) (F/E)Mean % Mean %Mean MeanMean ThicknessGroup No. <strong>of</strong>Flap ExposedExposed Factored DIFF %DIFF % Gauge Gauge DIFF %ID SamplesPlasticizer PlasticizerAge UV AgeFlap ExposedContent ContentA 20 5.79 6.08 0.29 5.01 32.5 28.9 3.6 11.05 39.5 37.4 2.1 5.32B 21 4.3 4.74 0.44 10.23 27.3 23.5 3.8 13.92 45.2 39.9 5.3 11.73C 25 4.95 5.42 0.47 9.49 30.9 28.9 2.0 6.47 47.5 45.3 2.2 4.63D 21 5.83 6.05 0.22 3.77 34.9 33.4 1.5 4.30 48.6 44.8 3.8 7.8287Table 7: Group summaries – mean data: plasticizer <strong>and</strong> thickness changesDistinguishable in this table, manufacturing group D began with the highest averagelevel <strong>of</strong> plasticizer content - 34.9%. After six years (on average) <strong>of</strong> UV aging, the meanexposed content <strong>of</strong> plasticizer for group D at 33.4% was still higher than the hidden flapcontent <strong>of</strong> the other three groups.Manufacturing group B, with the “newest” membrane at 4.74 years, had the leastamount <strong>of</strong> plasticizer in the hidden flap (27.3%), <strong>and</strong> the greatest amount <strong>of</strong> plasticizerloss, from 27.3% to 23.5%. This loss represents a 13.92% decrease in plasticizercontent by weight. In addition, group B also had the largest decrease in thickness - 5.3mils or an 11.73% reduction in thickness. In just over four years, almost 12% <strong>of</strong>thickness is gone. In this case, if more than 10% <strong>of</strong> the membrane is lost in four years,how much membrane would remain to withst<strong>and</strong> the elements at 12 years? Wouldthere be sufficient thickness <strong>and</strong> physical properties remaining for performance?15
A further analysis <strong>of</strong> the data questions how much plasticizer is lost per UV-factoredyear (Table 8).Group IDNo. <strong>of</strong>Samples( A ) ( B ) ( B/A )Factored UVAge% FlapPlasticizerContent% ExposedPlasticizerContentDIFFPlasticizer %Loss by UVYearPearsonCorrelationPlasticizerLoss by UVAgeA 20 6.08 32.5 28.9 3.6 0.590 0.808B 21 4.74 27.3 23.5 3.8 0.802 0.561C 25 5.42 30.9 28.9 2.0 0.369 0.674D 21 6.05 34.9 33.4 1.5 0.248 0.760Table 8: Summary <strong>of</strong> means, plasticizer loss by UV aged year, four manufacturing groupsAgain, group D data indicates the least percentage loss <strong>of</strong> plasticizer by year (.248%),whereas group B data indicates the greatest percentage loss <strong>of</strong> plasticizer (0.802%).Pearson Correlation Analysis provides a statistical measurement <strong>of</strong> the dispersion <strong>of</strong>data points between two variables. For this analysis, the variables <strong>of</strong> time <strong>of</strong> exposure<strong>and</strong> the loss <strong>of</strong> plasticizer by year were taken into consideration. If all the data pointswere clustered perfectly in a tight linear relationship (all <strong>of</strong> the data points are located onthe regression line) the value would be 1.000, or a “perfect” correlation. Conversely, avalue <strong>of</strong> 0.000 signifies no relationship between the variables. Group B has the lowestvalue (0.561) in Pearson Correlation (Table 7).4.0 HAIL SIMULATION RESULTSResults by GroupThe 87 membrane samples tested in hail simulation according to Table 9 <strong>of</strong>fers eachmanufacturing group two views <strong>of</strong> the data: (1) UV-factored aging in years, <strong>and</strong> (2)exposed plasticizer content % by weight. Within each set <strong>of</strong> data by manufacturinggroup, the results are broken down into two groupings. “Any failure” <strong>and</strong> “small spherefailure” are summarized. The category small sphere isolates the combination <strong>of</strong> failuresat 1 <strong>and</strong> 1-1/2 inch sizes (25 mm <strong>and</strong> 38 mm). A small sphere fracture in the test isreported in the “any failure” <strong>and</strong> in the “small sphere failure” categories.A review <strong>of</strong> the NOAA Website <strong>of</strong> hail events by county provides evidence that smallhail commonly occurs in many areas <strong>of</strong> the central United States. The analysis focusedon small hail performance.16
UV Factored<strong>Aging</strong>Group A, 20 Samples Group B, 21 Samples Group C, 25 Samples Group D, 21 SamplesSmallSmallSmallAnyAnyAny Small Sphere AnySphereSphereSphereFailureFailureFailure Failure FailureFailureFailureFailureTo 3.5 years 0 0 8 2 0 0 0 03.51 - 7.00 3 1 10 10 5 0 3 07.01 - older 6 5 3 3 6 3 5 0% By WeightExposedPlasticizerContent24% <strong>and</strong> less 2 2 13 12 1 0 NA NA24.1 - 28% 4 2 7 2 5 3 1 028.1 - 32% 2 1 1 1 5 0 5 0Over 32.1% 1 1 NA NA 0 0 2 0Table 9: Simulated hail results, by group, by size category, according to age <strong>and</strong> plasticizercontentGroup D contained no samples where the exposed plasticizer content measured 24% orless. In relation, group B had no samples where the plasticizer content was greaterthan 32.1%. Thus, “NA” was used within these two group summaries.Table 10 presents a view <strong>of</strong> the total grouping <strong>of</strong> all tested conventional plasticizersamples. The summarization <strong>of</strong>fers a benchmark between the two categories <strong>of</strong> age<strong>and</strong> plasticizer content -- the isolation <strong>of</strong> group B <strong>and</strong> D results. The summary results <strong>of</strong>all 87 tested membranes are skewed by the results <strong>of</strong> these two groups, group D as themost resistant to failure, group B as the least <strong>and</strong> the results <strong>of</strong> groups A <strong>and</strong> C lyingbetween B <strong>and</strong> D.17
Net PlasticizerContent, % Weight( A ) ( B ) ( B/A ) ( C ) ( C/A )SmallNo. <strong>of</strong>Any Failure % to Total Sphere % to TotalSamplesFailure32% 21 3 14.29% 1 4.76%Totals 87 49 24Group D Alone 21 8 38.10% 0 0%Group B Alone 21 21 100% 15 71.43%UV <strong>Aging</strong> (Years)No. <strong>of</strong>SamplesAny Failure % to TotalSmallSphereFailure% to TotalTo 3.5 22 8 36.36% 2 9.09%3.51 to 7.0 44 21 47.73% 11 25.00%7.01 <strong>and</strong> older 21 20 95.24% 11 52.38%Totals 87 49 24Table 10: Impact testing, all samples, by UV aging <strong>and</strong> by net plasticizer contentNotably, group D had no samples <strong>of</strong> small sphere failure, whereas in contrast, 71% <strong>of</strong>group B samples had a small sphere failure.The data analysis <strong>of</strong> the samples for the four groups <strong>of</strong> manufacturers provides insightinto long-term impact performance. Because <strong>of</strong> the inherent technology <strong>of</strong> conventionalflexible <strong>PVC</strong> membranes, plasticizer loss is an inevitable event. In other words, themembranes in each <strong>of</strong> the four groups display some degree <strong>of</strong> plasticizer loss over timewith group A <strong>and</strong> group C results positioned between the relative stability <strong>of</strong> group D<strong>and</strong> the least stable group B.Consider the following scenario: a building owner in the central U.S. is making aselection for a ro<strong>of</strong> system <strong>and</strong> he decides upon a conventional <strong>PVC</strong> ro<strong>of</strong> system. Fournew, white, flexible membranes are <strong>of</strong>fered as options, each made by a differentsupplier. All four membranes carry the same warranty <strong>and</strong> sales literature for eachclaim to provide the same features. The price difference between the four is, on a scale<strong>of</strong> the total ro<strong>of</strong>ing cost (membrane, insulation, fastenings, <strong>and</strong> labor), about 2-percent.If the criteria <strong>of</strong> selection is price, what price difference would be appropriate to <strong>of</strong>fsetthe difference in impact performance between the four membranes?18
To enhance the dramatic difference in performance, compare the individual sample datafor group B (Table 11) <strong>and</strong> group D (Table 12) along with the hail simulation results.Impact testing is the seminal event uncovering the physical deterioration <strong>of</strong> anembrittled membrane <strong>and</strong> placing an owner at significant risk.SampleNo.State( A ) ( B ) ( C ) ( D ) ( D/B ) ( D/A )UV- Hidden Flap ExposedPlasticizer% %Factored Plasticizer MembraneLoss byLost ChangeAge <strong>of</strong> Ro<strong>of</strong> Content, % Content, %UV YearFailure Point,Size inInches1 TX 6.21 26.8 20.6 6.2 23.13 0.998 1.002 AZ 8.84 29.1 26.1 3.0 10.31 0.339 1.003 TX 7.91 28.8 21.8 7.0 24.31 0.885 1.004 TX 7.21 27.2 22.9 4.3 15.81 0.596 1.005 TX 6.81 29.1 25.3 3.8 13.06 0.558 1.006 SC 6.58 29.2 23.7 5.5 18.84 0.836 1.007 LA 5.91 28.2 21.8 6.4 22.70 1.083 1.008 TX 5.91 27.7 22.6 5.1 18.41 0.863 1.509 KS 5.82 31.4 29.5 1.9 6.05 0.326 1.0010 TX 5.61 28.6 22.4 6.2 21.68 1.105 1.0011 LA 4.81 27.9 22.0 5.9 21.15 1.227 1.0012 TX 4.51 26.2 23.2 3.0 11.45 0.665 1.0013 TX 4.01 24.1 20.0 4.1 17.01 1.022 1.0014 ID 3.39 26.5 25.6 0.9 3.40 0.265 2.5015 MN 2.70 27.0 26.3 0.7 2.59 0.259 2.5016 IA 2.51 26.1 22.5 3.6 13.79 1.434 1.0017 MN 2.36 25.9 24.0 1.9 7.34 0.805 3.0018 TX 2.30 25.2 19.6 5.6 22.22 2.435 1.0019 CO 2.30 26.2 25.1 1.1 4.20 0.478 2.5020 MN 2.19 26.5 24.4 2.1 7.92 0.959 2.5021 IL 1.69 25.8 24.9 0.9 3.49 0.533 2.50Mean Summaries: 4.74 27.3 23.5 3.8 13.81% 0.802Table 11: Group B test results-- plasticizer loss <strong>and</strong> impact simulation (all samples)19
SampleNo.State( A ) ( B ) ( C ) ( D ) ( D/B ) ( D/A )UV-FactoredAge <strong>of</strong> Ro<strong>of</strong>Hidden FlapPlasticizerContent, %ExposedMembraneContent, %%Lost%ChangedPlasticizerLoss byUV YearFailurePoint, Sizein Inches1 OK 11.14 34.3 27.7 6.6 19.24 0.592 2.52 TX 9.92 33.6 30.8 2.8 8.33 0.282 no failure3 TX 9.32 33.0 30.1 2.9 8.79 0.311 3.04 CO 7.84 33.1 33.1 0.0 0.00 0.000 3.05 TX 7.31 34.5 31.7 2.8 8.12 0.383 3.06 KS 7.13 33.0 31.2 1.8 5.45 0.252 2.57 KS 6.95 33.0 31.4 1.6 4.85 0.230 2.58 TX 6.51 36.0 33.7 2.3 6.39 0.353 3.09 OK 6.47 35.1 32.4 2.7 7.69 0.417 no failure10 TX 6.01 36.4 34.6 1.8 4.95 0.300 no failure11 NE 5.80 34.3 32.6 1.7 4.96 0.293 no failure12 IA 5.76 34.6 31.4 3.2 9.25 0.556 3.013 CO 5.75 36.4 36.2 0.2 0.55 0.035 no failure14 TX 5.71 35.7 35.7 0.0 0.00 0.000 no failure15 TX 5.51 35.6 35.0 0.6 1.69 0.109 no failure16 IA 5.28 33.3 33.2 0.1 0.30 0.019 no failure17 TX 4.27 36.0 35.4 0.6 1.67 0.141 no failure18 IL 3.66 36.2 36.2 0.0 0.00 0.000 no failure19 TX 2.50 36.5 36.5 0.0 0.00 0.000 no failure20 MN 2.24 36.2 36.1 0.1 0.28 0.045 no failure21 IA 2.03 36.1 36.1 0.0 0.00 0.000 no failureMean Summaries: 6.05 34.90 33.39 1.51 4.34% 0.248Table 12: Group D test results-- plasticizer loss <strong>and</strong> hail simulation (all samples)The data comparison <strong>of</strong> samples from group B <strong>and</strong> group D reveal dramaticperformance differences in the hail simulation testing. All <strong>of</strong> group B membranes failed.Group B membrane samples 16 <strong>and</strong> 18 were newer than three years old but fracturedwith ice spheres as small as 1-inch (25 mm). In consideration, no testing was madewith spheres less than 1-inch (25 mm) in diameter. Therefore, underst<strong>and</strong>ably the 1/4inch (12 mm) ice (or large sleet) might have damaged the membrane. On the otherh<strong>and</strong>, the hail simulation testing for group D indicates a vast difference in impactperformance.20
The relationship between aging <strong>and</strong> plasticizer loss by UV year for both groups B <strong>and</strong> Dis provided in Graphs 1 <strong>and</strong> 2.Group B: Plasticizer Loss, by UV YearPlasticizer Loss, % contentby weight8765432100.00 2.00 4.00 6.00 8.00 10.00<strong>Aging</strong>, by UV yearsGraph 1: Group B plasticizer loss by UV yearGroup D: Plasticizer Loss, by UV yearPlasticizer loss, % content,by weight765432100 2 4 6 8 10 12<strong>Aging</strong>, by UV yearsGraph 2: Group D plasticizer loss by UV yearA glance <strong>of</strong> the graphs provides two quick observations. The cluster <strong>of</strong> data for group Dis much tighter than group B. This visual observation is consistent with PearsonCorrelation Analysis in Table 8. Furthermore, plasticizer loss in the samples in group Ddoes not actually begin until the sixth year. At least at the outset, group D plasticizeringredients appear to be vastly more stable in the membrane to those in group B. Thevisual comparison <strong>of</strong> the scatter patterns <strong>of</strong> the two graphs also reveal that group D21
produces a far more predictable product, year-after-year, than group B. This differencemight be attributable to plasticizer selection <strong>and</strong>/or manufacturing quality control.5.0 DISCUSSIONSRegarding the Test ProceduresAlternatives to Plasticizer AnalysisPlasticizer extraction with a solvent mixture proves a reliable test for liquid monomericplasticizers. However, the solvents used are environmentally aggressive. <strong>Jim</strong> Koontzsuggests in earlier research that changes in specific gravity might potentially be asimple alternative method for determining changes in plasticizer content as a result <strong>of</strong>exposure. 4 However, this suggested alternative has not been defined into an acceptedst<strong>and</strong>ard.Membrane ThicknessAs mentioned previously, …..changes in membrane thickness -- measuring the hiddenflap against exposed roll -- provide an indication <strong>of</strong> plasticizer loss. In Table 7, themean measure <strong>of</strong> reduction in thickness was greatest for group B; this group also hadthe greatest loss <strong>of</strong> plasticizer. Owners may be better served laying membranesamples on the ro<strong>of</strong> (Photograph 3) <strong>and</strong> making periodic measurements <strong>of</strong> thicknesscompared to original membrane samples that should be filed with the contractdocuments. Although there is no empirical data to support that loose flaps <strong>of</strong>membrane age at the same rate as an installed, sealed membrane, common sensesuggests this opinion.Photo 3: Membrane test strips mounted at ro<strong>of</strong> center22
Testing SimulationIn some cases laboratory procedures may be conservative in comparison to actual hailevents. The angle <strong>of</strong> impact, the cooled surfaces, <strong>and</strong> the density <strong>of</strong> ice spheres allsubject the target assemblies to severe conditions. The hail simulation procedurediscussed here is an invitation to st<strong>and</strong>ardized future test activities. Vickie Crenshaw<strong>and</strong> <strong>Jim</strong> Koontz report various code agencies <strong>and</strong> insurance groups do not agree abouttest procedures. 7 However, in relation to this hail simulation, the results obtainedprovide meaningful comparison <strong>of</strong> performance <strong>of</strong> four manufacturing groups in thesame test procedure.Regarding the Test ResultsThe Role <strong>of</strong> Reinforcement: Little has been mentioned about the role <strong>of</strong> thereinforcement scrim in preventing impact fracture. The study focused on plasticizer loss<strong>and</strong> its correlation with fracture with only casual mention <strong>of</strong> polymer crystallization orfabric reinforcements. Mechanical separation <strong>of</strong> the top layer <strong>of</strong> film revealed thereinforcements among the four manufacturing groups are not identical. Two <strong>of</strong> the fourreinforcements had identical, tight weave <strong>and</strong> warp, one had a smaller count <strong>of</strong> threadsin its square grid, <strong>and</strong> the fourth has a distinct pattern where the weave <strong>and</strong> warp werenot square to each other. These differences in fabric characteristics add anotherimportant variable to membrane impact performance.But what is the action <strong>of</strong> impact fracture? Impact fractures from hailstones are usuallyconcentric arches <strong>of</strong> fractures (Photo 1). It is proposed that the failure mode at impactis about membrane distortion as opposed to an instantaneous surface shatter. A closeupview <strong>and</strong> slow-motion impact would reveal fractures not in a single moment <strong>of</strong>contact but rather in a timed sequence <strong>of</strong> elongation <strong>and</strong> subsequent fractures. As theprojectile drives deeper additional distortion would create additional, outer rings <strong>of</strong>fractures. In this view, what role would reinforcement play in the prevention <strong>of</strong> fracturefailure? It is conjectured that the reinforcement would provide a limit to distortion. Thestronger <strong>and</strong> tighter the fabric weave, the more limited the distortion.However, if the film blend has lost flexibility, it is suggested that the fractures will appear(in the slow-motion view) at the moment when the elongation properties <strong>of</strong> the fabricexceed the elongation capabilities <strong>of</strong> the film. This consideration will come into playlater in this study when there is a discussion about what an owner can do to mitigatedamage from hail.Test Result AnomaliesThroughout the analysis <strong>of</strong> results there were odd, inexplicable data points. As anexample, Sample 9 on Table 11, the amount <strong>of</strong> plasticizer loss for a near 6 year old ro<strong>of</strong>membrane was a mere 1.9 %, yet there was fracture with 1-inch sphere. Against theaging data points around that sample, a greater degree <strong>of</strong> plasticizer loss would havebeen expected. Then again, Sample 18 <strong>of</strong> group B shows dramatic loss for a relatively23
new sample. Another example is found in Sample 1 on Table 12. The significant level<strong>of</strong> plasticizer loss for this sample (19.24 %) was not characteristic for this group. Thisdata point is also the lone, high data point on Graph 2.For these reasons, the authors consider hail simulation result to be indicative ratherthan definitive <strong>of</strong> a relationship between plasticizer loss <strong>and</strong> impact damage. Theseanomalies may be the result <strong>of</strong> excess “play” in one or more variables such as tensionor formula dispersion.6.0 CONCLUSIONS1. The older a <strong>PVC</strong> membrane, the more vulnerable the membrane to impactdamage. While this is true <strong>of</strong> all ro<strong>of</strong> membranes eroding or becoming morerigid, with exposed <strong>PVC</strong> membranes, this vulnerability is a particular concern.2. Not all <strong>PVC</strong> membranes are <strong>of</strong> the same quality. The data on plasticizer loss<strong>and</strong> impact resistance demonstrates one <strong>of</strong> the four manufacturers provides asuperior product to the U.S. low-slope ro<strong>of</strong>ing market.3. The data suggests an initial higher content <strong>of</strong> plasticizer provides a better startingpoint than a lower level. What content <strong>of</strong> monomeric plasticizer is appropriate fora <strong>PVC</strong> membrane to be sold in hail states? The data suggests less than 32%would be reason for concern depending upon the quality, type, <strong>and</strong> stability <strong>of</strong> theplasticizing agent(s). More significantly, the data suggests beginning a servicelife below 32% plasticizer content with instable plasticizers invites impactvulnerability. The data also suggests that plasticizer levels below 28% innominal 50 mil (1.2 mm) membrane would be a concern in hail-prone locations <strong>of</strong>the central United States.7.0 RECOMMENDATIONS1. On behalf <strong>of</strong> building owners in the central United States, the ro<strong>of</strong>ing industryneeds focused research into hail protection <strong>of</strong> all classes <strong>of</strong> ro<strong>of</strong>ing systemsachieving the level <strong>of</strong> expertise <strong>and</strong> consensus now taken for granted for windengineering.2. Building owners in hail-prone states should dem<strong>and</strong> suppliers, regardless <strong>of</strong>class <strong>of</strong> ro<strong>of</strong> system, provide warranty coverage against small hail, 1-1/2-inch (38mm) or less. Conventional <strong>PVC</strong> ro<strong>of</strong>s in hail-prone locations must be monitoredfor degradation. This monitoring should be a timely measurement <strong>of</strong> reducedthickness, increased durometer hardness, rising specific gravity <strong>and</strong>/or plasticizerextraction analysis. Samples <strong>and</strong> lot numbers <strong>of</strong> new membranes should be filedin contract documents, providing a “benchmark” for degradation measurement.3. <strong>PVC</strong> membrane manufacturers have a market opportunity in definingspecifications <strong>and</strong> warranties reflecting hail engineering. Thicker membranes, 60mils (1.5 mm) <strong>and</strong> greater, may provide increased impact resistance. It st<strong>and</strong>s to24
eason that if plasticizer migrates from the top surface at a fixed rate, the supply<strong>of</strong> additional thickness would provide a deeper reservoir <strong>of</strong> plasticizer, reducingthe percentage <strong>of</strong> plasticizer lost over a fixed period <strong>of</strong> time. Comparatively, theuse <strong>of</strong> harder substrates in the ro<strong>of</strong> specification may reduce the extent <strong>of</strong> haildamage <strong>and</strong> allow insulation salvage. In this scenario, limited membranedistortion by a hard substrate also limits the extent <strong>of</strong> fractures. Carefulinvestigation proves a 4 year old <strong>PVC</strong> ro<strong>of</strong> with a hard substrate survived a 3-1/2-inch (88 mm) hailstorm in the spring <strong>of</strong> 2002. No funding or effort was made inrepair <strong>of</strong> the ro<strong>of</strong> system. Beliefs hold that the hard substrate was critical to thispositive result.4. For hail-prone sections <strong>of</strong> the central U.S., monitoring <strong>of</strong> monomeric-plasticized<strong>PVC</strong> ro<strong>of</strong> systems should begin between 2 <strong>and</strong> 8 years, depending upon thequality <strong>of</strong> the supplied membrane.The authors acknowledge the support <strong>of</strong> Target Corp. <strong>and</strong> make special mention <strong>of</strong>appreciation for the lifelong contribution <strong>of</strong> research into hail by Mr. Stanley A.Changnon.8.0 REFERENCES1S.A. Changnon, "Thunderstorms Across the Nation", Changnon Climatologist,Mahomet, IL (USA), p. 57.2 National Climatic Data Center, www.ncdc.noaa.gov/oa/climate/severeweather/extremes.html3 S. Konopacki <strong>and</strong> H. Akbari, "Measured Energy Savings <strong>and</strong> Dem<strong>and</strong> Reduction froma Reflective Ro<strong>of</strong> Membrane on a Large Retail Store in Austin," Lawrence BerkleyNational Laboratory, Berkley, CA, June 2001.4 <strong>Jim</strong> Koontz, "Field Evaluation <strong>and</strong> Laboratory Testing <strong>of</strong> <strong>PVC</strong> Ro<strong>of</strong>ing Systems,"Proceedings <strong>of</strong> the Fourth International Symposium on Ro<strong>of</strong>ing Technology, NRCA,Rosemont, IL, 1997.5 National Climatic Data Center,www.cpc.ncep.noaa.gov/products/stratosphere/uv_index/gif_files/janavg.gif6 Richard A. Schleusner <strong>and</strong> Paul C. Jennings, "An Energy Method for RelativeEstimates <strong>of</strong> <strong>Hail</strong> Intensity," Bull. Amer. Meteorol. Soc. Vol. 41, No. 7, July 1960.7 Vickie Crenshaw <strong>and</strong> <strong>Jim</strong> Koontz, "Simulated <strong>Hail</strong> Damage <strong>and</strong> Impact ResistanceTest Procedures for Ro<strong>of</strong> Coverings <strong>and</strong> <strong>Membranes</strong>," RCI Interface, Vol XIX, No. 5,May, 2001.8 J.A. Laurie, "<strong>Hail</strong> <strong>and</strong> its Effects on Buildings, " <strong>Research</strong> Report No. 176, NBRI,Pretoria, SA, August, 1960.9 E.G. Bilham <strong>and</strong> E.F. Relf, "The Dynamics <strong>of</strong> Large <strong>Hail</strong>stones," Royal MeteorologicalSociety, Vol 63, 1937, p. 149.25

![Wm] - National Roofing Contractors Association](https://img.yumpu.com/36696816/1/190x245/wm-national-roofing-contractors-association.jpg?quality=85)