POLARIMETRY OF EPSILON AURIGAE: INITIAL ... - JSARA
POLARIMETRY OF EPSILON AURIGAE: INITIAL ... - JSARA
POLARIMETRY OF EPSILON AURIGAE: INITIAL ... - JSARA

Create successful ePaper yourself
Turn your PDF publications into a flip-book with our unique Google optimized e-Paper software.
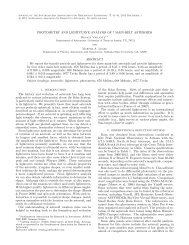
Journal of the Southeastern Association for Research in Astronomy, 5, 51-55, 2012 February 1c○ 2012. Southeastern Association for Research in Astronomy. All rights reserved.<strong>POLARIMETRY</strong> <strong>OF</strong> <strong>EPSILON</strong> <strong>AURIGAE</strong>: <strong>INITIAL</strong> OBSERVATIONS <strong>OF</strong> THE 2009-2011 ECLIPSEJohn A. C. Burdette 1Department of Physics and Astonomy, East Tennessee State UniversityJohnson City, TN 37614andGary D. HensonDepartment of Physics and Astronomy, East Tennessee State University,Johnson City, TN 37614ABSTRACTEpsilon Aurigae is an eclipsing binary system consisting of an F0 supergiant (200 R ⊙ ) and a cool,opaque edge-on disk (2000 R ⊙ ) possibly encompassing a second star. V-band polarimetry data forEpsilon Aurigae’s 2009-2011eclipse is being obtained to better understand the system’s geometry andthe nature of its two components. Several polarized and non-polarized standard stars are also beingobserved in order to characterize the instrumental polarization and sources of measurement error inthe polarimeter configuration and the measurement procedures for observations. We report here onthe status of these observations at the midpoint of the eclipse and include a preliminary analysis ofnoise and instrumental effects in the measurements.Subject headings: Polarization — Stars: eclipsing binaries — Methods: observational — Techniques:polarimetry1. INTRODUCTIONEpsilon Aurigae is an eclipsing binary system consistingof an F0 supergiant and a cool, opaque edgeondisk. The supergiant is known to pulsate andthe disk may be protoplanetary matter encompassinga protostellar object making Epsilon Aurigae a uniquecandidate for inquiry. The system’s orbital periodis 27 years with a primary eclipse duration of approximately2 years. During the primary eclipse, thedisk passes in front of the supergiant creating a flatbottomedpartial eclipse. This provides a unique opportunityto obtain information about the disk as itoccults the supergiant. An international campaign isunderway to observe the current eclipse which beganin fall 2009 and will continue through early 2011 (seehttp://www.hposoft.com/Campaign09.html for details).We are contributing polarized light observations andtheir interpretation to this campaign. Polarized lightfrom the limb of the supergiant is presumed to be thedominant source of polarization intrinsic to the system.Bothnon-radialpulsationsin thesupergiantandthepartialeclipse create asymmetries leading to a net polarization.Observations of variations in this polarization willcontain clues to characterizing the geometry of the diskand the supergiant’s pulsations (Kemp et al. 1986, Henson1989).For polarized light measurements, linear polarizationdescribes a constant angle of electric field orientationwhile circular polarization describes an electric field thatrotates as it propagates. Polarized light is described bythe four Stoke’s parameters I, Q, U, and V which measureintensitiesoflightanditspolarizedcomponents.Usingthe equatorial reference frame, the I value describestotal intensity, Q describes differences between North-Electronic address: burdettj@etsu.edu; hensong@mail.etsu.edu1 Southeastern Association for Research in Astronomy (SARA)NSF-REU Summer InternSouth (+Q) and East-West (−Q) linearly polarized intensities,U describes differences between linearly polarizedintensities oriented at +/−45 ◦ (+/−U respectively)from North-South, and V describes the differences betweenright and left circular intensities. Only linear polarizationmeasurements (Q and U) were collected here.2. OBSERVATIONSA polarimeter is attached to the 14-inch Schmidt-Cassegrain telescope at East Tennessee State University’sPowell Observatory to collect data from polarizedsources. The configuration is such that the polarizedcomponents of light collected by the telescope are reorientedby a rotatable half-wave plate and are then splitinto orthogonally polarized components by a Wollastonprism serving as an analyzer. A CCD camera then imagesthe two beams, known as the ordinary and extraordinaryrays (o−ray and e−ray respectively). The configurationof the polarimeter is illustrated in Figure 1.Fig. 1.— Polarimeter schematic taken from Hall & andHenson (2010).
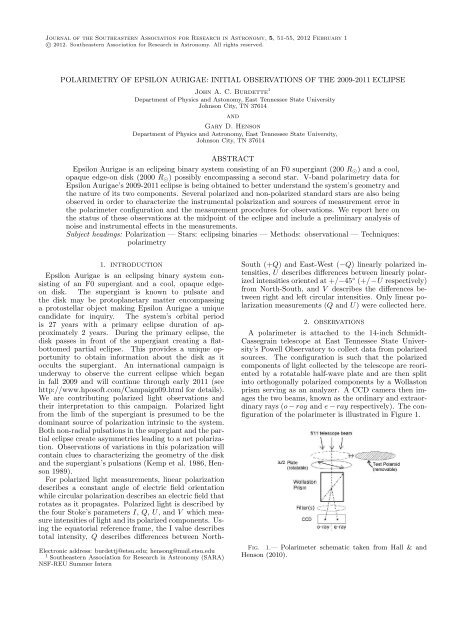
52 Burdette and HensonA single data point consists of sixteen images differentiatedby 22.5 ◦ rotations of the half-wave plate. Thoughonly 90 ◦ of rotation (four images) are necessary to obtain+/−Q and +/−U values, the half-wave plate is rotatedfor 360 ◦ and all data for the complete rotation areaveraged in order to minimize instrumental effects anderror due to imperfections in the half-wave plate and/orprism orientation relative to incident light. A more detaileddescription of the polarimeter configuration andmeasurement procedure can be found in Hall & Henson(2010).2.1. Epsilon Aurigae PolarimetryThe polarimetry data for Epsilon Aurigae presentedhere were collected from fall 2009 to early summer 2010.Typical exposure times for a single waveplate positionranged from 10 to 20 seconds, though longer exposureswere taken for the last few observations. A set of 8 to16 data points, each consisting of 16 images, was used tocalculate the final normalized Q and U values for eachnight. For all images, bias, dark, and flat fields wereapplied using MIRA software. MIRA was then used toperform aperture photometry in order to determine netcounts for the o −ray and e−ray image in each CCDframe. The intensity difference between the o−ray ande−ray was used to calculate +/−Q and +/−U values,which were in turn used to determine net Q and U values.The net linear polarization of light, P, was thencalculated from net Q and U. For one 16-image datapoint, the calculations are outlined below.First, a corrective term was calculated to account forasymmetriesintheopticalpathsoftheo−ray ande−ray(Equation (1)). Here, I o represents intensity of the o −ray, I e represents intensity of the e−ray, and subscriptnumbers represent the image number in the half-waveplate rotation sequence.C 1 =[Io1× I o3× I o2× I ]14o4I e3 I e1 I e4 I e2(1)Additional corrective terms are calculated similarlywhere each subsequent C value depends upon the nextfour o−ray and e−ray intensities. This corrective termwas then used in conjunction with the intensity ratios todetermine a fractional polarization value for each imageas shown below:⎡ ⎤( )Ie1I o1P 1 = ⎣ 1−C 1( ) ⎦ (2)1+CIe11 I o1For each group of 16 images, Q and U values werecalculated by summing the appropriate fractional polarizationvalues from Equation (2). These Q and U valueswere then used to determine polarization as outlined inEquations (3), (4,) and (5) below:∑ 4n=1Q net =4n−3 −P 4n−1 ]8(3)∑ 4n=1U net =4n −P 4n−2 ].8√(4)P net = Q 2 net +Unet 2 (5)The outline above is shown to indicate the dependenceof final polarization values on the intensities of star imageson the CCD. Thus, the precision of o − ray ande−ray intensitieslimitstheprecisionofthefractionalpolarizationcalculation,andthesignal-to-noiseratio(S/N)for the polarized flux is further limited by the small fractionalpolarizationofincidentlight.Amorecompletedescriptionfor every step in the calculations can be foundin Hall & Henson (2010).The set of V-band fractional polarization measurementsfor Epsilon Aurigae spanning fall 2009 to summer2010 is illustrated in Figure 2. For these measurements,typical uncertainties per nightly point are on the orderof 0.001 fractional polarization or 0.1%. The uncertaintyshown here is the standard deviation among the set of 8to 16 data points acquired each night. The total linearpolarization, P, is shown in the top curve with the individual,normalized Q and U Stokes parameters plottedbelow. We have chosen not to display the polarizationposition angle in this figure since following the changesin Q and U provide more insight to the eclipse geometry.In addition, there is a known interstellar componentclosely aligned with the U parameter which dominatesthe mean level of polarization (Kemp et al. 1986). Wehave not removed this component from the data shownhere. Approximate dates for the start of the ingress andfull eclipse phases are shown at the bottom of the U parametercurve. Visual inspection of these curves showslong period, small amplitude variations in both the Qand U parameters. Such variability is known to arisefrom pulsations in the F0 supergiant which dominate thepolarization curves both in and out of eclipse (Henson1989). We see no obvious evidence of any major changesin the curves as the eclipse is progressing. It is possiblethe polarization changes from the supergiant pulsationsare masking eclipse effects.For this paper, we are only presenting these initial polarizationcurves in a simple qualitative manner. Observationsof Epsilon Aurigae are continuing through theentire eclipse time interval and beyond. A more detailedanalysis will be presented once data for the entire eclipseand for sufficiently establishing the pulsation behaviorare obtained. Because variations in the polarization aresmall, the amount of observational uncertainty must beminimized in order to better interpret and model the observedchanges. The measurement error shown in Figure2 is larger than desired, but also larger than expected forthe polarimeter instrument. We address this issue in thefollowing section.3. SOURCES <strong>OF</strong> MEASUREMENT ERRORThe polarimeter was installed during summer 2008,but modifications were required and the alignment of theoptical arrangement was refined that fall. Standard starmeasurements were obtained in the first months of operation,but were limited and incomplete (Hall & Henson2010). Several bright unpolarized and strongly polarizedstandard stars are continually being observed tomore precisely determine the instrumental polarizationand the limit of precision for the polarized light measurements.In this paper we focus mainly on sources oferror for a measurement. Because there are several op-
Polarimetry of Epsilon Aurigae 530.03P0.02Fractional Polarization0.010-0.01QU-0.02IngressFull Eclipse-0.030 50 100 150 200 250Julian Date - 2455100Fig. 2.— V band fractional polarization curves for Epsilon Aurigae. The approximate dates for eclipse ingress and for fulleclipse are indicated at the bottom of the U parameter curve.tical components involved in the polarimeter, it is easyfor imperfections in their alignment and/or behavior toaffect the incident light.The standard stars were observed and the images reducedwith a procedure identical to that used on EpsilonAurigae. Exposure times varied due to intensity differencesbetween objects, but in all cases the exposure timewas chosen to obtain the maximum number of countswithout saturating individual pixels. This was necessaryto obtain the highest S/N possible as required for theweak polarized light signals. Our measured values, theassociated measurement errors, and the expected valuesfor the corresponding objects are reported in Table 1.Included in this table are measurements performed byHall & Henson (2010) in late 2008 and early 2009 forcomparison.The measurements show that a small level of instrumentalpolarization is present in agreement with Hall &Henson (2010). Moreimportantly for this discussion, themagnitude of the error in these measurements for eventhe brightest objects is on the order of 0.1% or greater.We note particularly that for the two brightest stars,Vega and Arcturus, integration times were significantlyincreased for the 2010 measurements over the 2009 measurements.However, the averagepolarization values andmeasurementerrorswereveryconsistentbetweenthetwosets of observationsindicating the smallest achievable errorto be limited to the level of 0.1%.For polarimetry observations of Epsilon Aurigae, measurementerror on the order of 0.025% is desired. Thislevel of precision is needed to resolve changes in the Pvalue due to the supergiant’s pulsations versus effects ofthe eclipse. With errorsonthe orderof0.1%it is difficultto distinguish between these two sources of polarization.As Figure 2 shows, the error in the measurement canequal or exceed the magnitude of the variability in thepolarization. Thus, weareinvestigatingwhetherthe trueerrors in the measurements may be smaller than thosepresented here. If this is the case, more accurate conclusionsmay be drawn concerning the sources and themagnitudes of the variation in polarized light.With an ideal optical configuration, photometric errordepends only upon photon noise. The S/N for a singlestar image, i.e. either the o − ray or e − ray, collectedwith an ideal optical configuration is given as:S/N = √ N (6)where N is the number of photons detected. However,since only a small fraction of these photons represent thepolarization signal for each half-wave plate position, the
54 Burdette and HensonTABLE 1V Band Standard Star PolarizationStar Mag. Accepted P net (%) a 2009 2010Observed P net (%) Nights Observed b Observed P net (%) Nights Observed bAltair 0.77 0 0.1±0.1 2 0.3±0.2 3Arcturus -0.04 0 0.1±0.1 3 0.2±0.1 4Deneb 1.25 0 – – 0.3±0.2 2Vega 0.03 0 0.2±0.1 5 0.2±0.1 4HD 154445 5.70 3.67±0.05 3.8±0.7 3 3.7±0.5 3HD 187929 3.5-4.5 1.8 1.6±0.2 1 1.9±0.5 1a Bright Stars are expected to have zero polarization, highly polarized standards taken from Gehrels(1974)b See text for comments on average integration times for each star per nightS/N for the polarization is greatly reduced. Patat &Romaniello (2006) define the S/N for our rotating halfwaveplate measurements as:S/N =1√ n×Ep(7)where n is the total number of half-wave plate positionangles per data point and E p is the desired precision ofthe measurement. Thus, to attain error on the order of.02% for 16 half-wave plate positions, a S/N of 1250 foreach o − ray or e − ray image for each CCD frame isdesired. Since our images are slightly defocused (see thevignetting discussion below), we were able to use longerintegration times to increase the S/N above the benchmarkof1250.However,therewasnonoticeableimprovementin the measurement error. The error remained onthe order of 0.1% for the bright standard stars. Thus,the limiting factor does not appear to be photon noise.Patat & Romaniello (2006) present a detailed erroranalysis for a similar polarimeter configuration. In thatanalysis,imperfectionsinthehalf-waveplateandWollastonprism were shown to contribute measurement errorsonthe orderof0.05%. Contributionstoerrordue to nonidealoptics can be placed into two categories: geometricasymmetry and imperfections in the optical behavior ofan element.An ideal polarimeter is oriented in such a manner thatincident light travels through each optical componentnormal to its surface. If this is not the case, severalissues arise. A tilted wave-plate will refract light, whichin turn scatters off of the prism, imparting it with somepolarization. A tilted prism will cause the o − ray ande−ray to follow optical paths of differing length, causingthemtobeincidentonthe CCDatdifferingangles. Sincea CCD measures fewer counts as incident light strikes itat an angle, this can cause fewer counts to register for eitherray. Although the polarimeter has been constructedto position all elements to have surfaces perpendicularto the light path, we are aware of vignetting issues dueto the small diameter of our Wollaston prism. This maybe a significant noise contribution since this vignettingcauses focus issues. The two beams cannot achieve theirbest focus simultaneously, so we focus the two beams toobtain similar FWHM values.Issues with the optical behavior of the elements can bedescribed succinctly. An imperfect half-wave plate willnot reorientpolarized light perfectly. Thus, Q and U valuesmaybeslightlydistortedasnet countsfor+/−Qand+/−U vary. An imperfect Wollaston prism will not splitpolarized light into components that are 100% orthogonal.Thus, the o −ray and e − ray will be slightly different,again distorting Q and U values. Such behaviorsaffect the efficiency of the polarimeter while introducingmeasurement error.In addition to the above instrumental effects, Patat &Romaniello (2006) also describe how the nature of flatfieldingcalibration was found to be problematic for polarimetry.Our common sky-source for flat-field imagesis the twilight sky. Sky light, however, is polarized, soflat-field measurements must account for this in someway. The half-wave plate alignment was initially optimizedfor the +Q position. We took care to point thetelescope toward the western horizon where sunlight wasforward scattered to minimize polarization in flat-fieldimages. Such a location above the setting sun should, ingeneral, provide a neutral point in the skylight polarization(Lee 1998). However, during flat-field acquisitions,subtle intensity variations were seen between wave platerotations. Thus, images from all 16 position angles wereaveraged to create a master Q and U flat with the intentof minimizing effects due to twilight sky polarization.The background sky conditions due to moonlightandlightcloudsduringdatacollectionalsocreateabackgroundsky polarization. This background polarizationfurther decreasesthe S/N ofthe polarized light measurement.4. CONCLUSIONSOur initial polarized light observations of the currentEpsilon Aurigae eclipse show variability at levels comparableto the 1984-1986 eclipse. However, we have notbeen able to clearly distinguish between eclipse effectsand those caused by the pulsations in the supergiant inthe data presented here. However, we note that thesedata cover only the period through mid-eclipse and thelargest eclipse effect was observed during egress for the1984-1986 eclipse (Kemp et al. 1986). We have confirmedthat a small level of instrumental polarization ispresent for the instrument being used for the observationsand that it appears to be constant over time. Themeasurement error has been found to be much largerthan desired which could potentially limit the interpretationof the variability. We suspect that the flat-fieldingcalibration is the most likely source of the large measurementerrorandarecontinuingtoexploreothertechniquessuch as the use of dome-flats. The goal is to obtain measurementerrors on the order of 0.02% to better resolvethe difference between the effects of the eclipse versusthe supergiant pulsations in the polarized light from the
Polarimetry of Epsilon Aurigae 55system.This project was funded by the National Science FoundationResearch Experiences for Undergraduates (REU)program through grant NSF AST-1004872.Gehrels, T. 1974, Planets, Stars, and Nebulae studied withphotopolarimetry (Tucson: The University of Arizona Press)Hall, S. W. & Henson, G. D. 2010, <strong>JSARA</strong>, 4, 2Henson, G. D., 1989, PhD dissertation, University of OregonKemp, J. C., Henson, G. D., Kraus, D. J., Beardsley, I. S., Carroll,L. C., Ake, T. B., Simon, T., and Collins, G. W. 1986, AJ, 300,L11REFERENCESPatat, F., & Romaniello, M. 2006, PASP, 118, 146Lee, R. L. 1998, Applied Optics, 37, 1465