Advanced Lithium-Ion Batteries for Plug-in Hybrid-Electric Vehicles
Advanced Lithium-Ion Batteries for Plug-in Hybrid-Electric Vehicles
Advanced Lithium-Ion Batteries for Plug-in Hybrid-Electric Vehicles

Create successful ePaper yourself
Turn your PDF publications into a flip-book with our unique Google optimized e-Paper software.
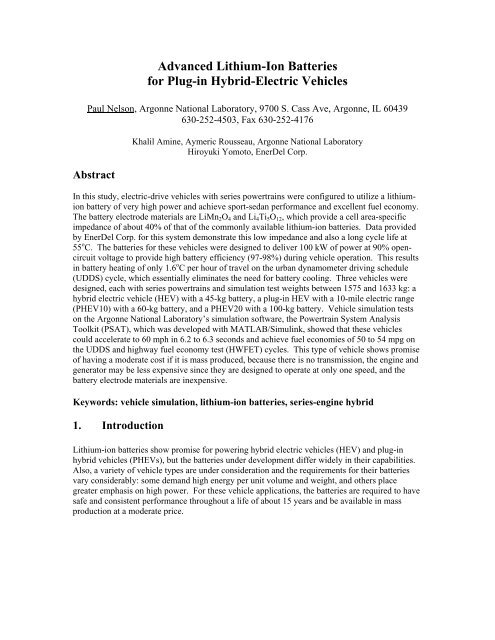
<strong>Advanced</strong> <strong>Lithium</strong>-<strong>Ion</strong> <strong>Batteries</strong><br />
<strong>for</strong> <strong>Plug</strong>-<strong>in</strong> <strong>Hybrid</strong>-<strong>Electric</strong> <strong>Vehicles</strong><br />
Paul Nelson, Argonne National Laboratory, 9700 S. Cass Ave, Argonne, IL 60439<br />
630-252-4503, Fax 630-252-4176<br />
Abstract<br />
Khalil Am<strong>in</strong>e, Aymeric Rousseau, Argonne National Laboratory<br />
Hiroyuki Yomoto, EnerDel Corp.<br />
In this study, electric-drive vehicles with series powertra<strong>in</strong>s were configured to utilize a lithiumion<br />
battery of very high power and achieve sport-sedan per<strong>for</strong>mance and excellent fuel economy.<br />
The battery electrode materials are LiMn2O4 and Li4Ti5O12, which provide a cell area-specific<br />
impedance of about 40% of that of the commonly available lithium-ion batteries. Data provided<br />
by EnerDel Corp. <strong>for</strong> this system demonstrate this low impedance and also a long cycle life at<br />
55 o C. The batteries <strong>for</strong> these vehicles were designed to deliver 100 kW of power at 90% opencircuit<br />
voltage to provide high battery efficiency (97-98%) dur<strong>in</strong>g vehicle operation. This results<br />
<strong>in</strong> battery heat<strong>in</strong>g of only 1.6 o C per hour of travel on the urban dynamometer driv<strong>in</strong>g schedule<br />
(UDDS) cycle, which essentially elim<strong>in</strong>ates the need <strong>for</strong> battery cool<strong>in</strong>g. Three vehicles were<br />
designed, each with series powertra<strong>in</strong>s and simulation test weights between 1575 and 1633 kg: a<br />
hybrid electric vehicle (HEV) with a 45-kg battery, a plug-<strong>in</strong> HEV with a 10-mile electric range<br />
(PHEV10) with a 60-kg battery, and a PHEV20 with a 100-kg battery. Vehicle simulation tests<br />
on the Argonne National Laboratory’s simulation software, the Powertra<strong>in</strong> System Analysis<br />
Toolkit (PSAT), which was developed with MATLAB/Simul<strong>in</strong>k, showed that these vehicles<br />
could accelerate to 60 mph <strong>in</strong> 6.2 to 6.3 seconds and achieve fuel economies of 50 to 54 mpg on<br />
the UDDS and highway fuel economy test (HWFET) cycles. This type of vehicle shows promise<br />
of hav<strong>in</strong>g a moderate cost if it is mass produced, because there is no transmission, the eng<strong>in</strong>e and<br />
generator may be less expensive s<strong>in</strong>ce they are designed to operate at only one speed, and the<br />
battery electrode materials are <strong>in</strong>expensive.<br />
Keywords: vehicle simulation, lithium-ion batteries, series-eng<strong>in</strong>e hybrid<br />
1. Introduction<br />
<strong>Lithium</strong>-ion batteries show promise <strong>for</strong> power<strong>in</strong>g hybrid electric vehicles (HEV) and plug-<strong>in</strong><br />
hybrid vehicles (PHEVs), but the batteries under development differ widely <strong>in</strong> their capabilities.<br />
Also, a variety of vehicle types are under consideration and the requirements <strong>for</strong> their batteries<br />
vary considerably: some demand high energy per unit volume and weight, and others place<br />
greater emphasis on high power. For these vehicle applications, the batteries are required to have<br />
safe and consistent per<strong>for</strong>mance throughout a life of about 15 years and be available <strong>in</strong> mass<br />
production at a moderate price.
2. Status of <strong>Advanced</strong> Battery Development<br />
Table 1 presents the characteristics of several lithium-ion batteries <strong>in</strong> various stages of<br />
development. These batteries promise markedly different levels of per<strong>for</strong>mance <strong>for</strong> the various<br />
criteria <strong>for</strong> which batteries are evaluated <strong>for</strong> the HEV and PHEV applications.<br />
The LiNi0.8Co0.15Al0.05O2 (NCA)-graphite system has good power and energy characteristics<br />
because of its high voltage, good electrode specific capacities and good area-specific impedance<br />
(ASI) [1, 2]. Projections show it would have a moderate cost <strong>in</strong> production and good life if the<br />
state of charge (SOC) is ma<strong>in</strong>ta<strong>in</strong>ed between 90% and 30%. Work rema<strong>in</strong>s to be done to <strong>in</strong>crease<br />
the useful fraction of the (SOC) range and achieve excellent battery life (15 years). Also, at<br />
present the NCA electrode has a tendency to release significant amounts of oxygen dur<strong>in</strong>g<br />
thermal runaway, result<strong>in</strong>g <strong>in</strong> oxidation of the electrolyte [3,4]. The graphite electrode adds<br />
chemically bound energy to such a catastrophic <strong>in</strong>cident.<br />
Table 1. Selected <strong>Lithium</strong>-<strong>Ion</strong> Battery Systems <strong>for</strong> <strong>Plug</strong>-In <strong>Hybrid</strong> <strong>Electric</strong> <strong>Vehicles</strong><br />
System NCA- LFP- MS- MNS- MN-<br />
Electrodes<br />
Graphite Graphite TiO TiO Graphite<br />
Positive LiNi0.8Co0.15Al0.05O2 LiFePO4 LiMn2O4 LiMn1.5Ni0.5O4<br />
Negative<br />
Capacity, mAh/g<br />
Graphite Graphite Li4Ti5O12 Li4Ti5O12<br />
Positive<br />
155<br />
162 100 130<br />
275<br />
Negative<br />
290<br />
290 170 170<br />
290<br />
Voltage, 50%<br />
SOC<br />
3.6 3.35 2.52 3.14 3.9<br />
ASI <strong>for</strong> 10-s<br />
Pulse, ohm-cm 2<br />
25 25 9.2 100 25<br />
Safety Fair Good Excellent Excellent Excellent<br />
Life Potential Good Good Excellent Unknown Unknown<br />
Cost Moderate Moderate Low Moderate Moderate<br />
Status Pilot Scale Pilot<br />
Scale<br />
Develop. Research Research<br />
Li1.2Mn0.6Ni0.2O2<br />
Graphite<br />
The LiFePO4 (LFP) electrode is more stable and does not generate oxygen dur<strong>in</strong>g heat<strong>in</strong>g and,<br />
thus, appears to be safer at this time than the NCA electrode. Otherwise, the per<strong>for</strong>mances of the<br />
first two systems <strong>in</strong> Table 1 are expected to be similar, but the LFP-graphite system shows<br />
promise of a slightly lower raw material cost. However, develop<strong>in</strong>g a low-cost process <strong>for</strong><br />
prepar<strong>in</strong>g nano-LiFePO4 material, which is required <strong>for</strong> good power, requires additional ef<strong>for</strong>t.<br />
The third system <strong>in</strong> Table 1, MS-TiO, has electrodes with low capacity, and the couple has lower<br />
voltage than those of the first two systems. The lithium-sp<strong>in</strong>el positive electrode does not <strong>for</strong>m a<br />
good couple with a graphite negative electrode because manganese dissolves <strong>in</strong> the electrolyte<br />
and poisons the graphite electrode [5-8]. Aga<strong>in</strong>st a lithium-titanate electrode, however, it <strong>for</strong>ms a<br />
very stable couple, albeit with a low voltage. The titanate electrode has a voltage that is 1.5 V<br />
higher than that of lithium, whereas a good graphite electrode is only about 0.1 V higher. The
comb<strong>in</strong>ation of low voltage and low specific capacities <strong>for</strong> both electrodes <strong>in</strong> the MS-TiO system<br />
results <strong>in</strong> lower specific energy <strong>for</strong> the battery than <strong>for</strong> most lithium-ion systems. This is<br />
somewhat mitigated by the very stable per<strong>for</strong>mance and long cycle life <strong>for</strong> 100% discharges, as<br />
discussed below, which permit operat<strong>in</strong>g MS-TiO batteries over the SOC range of 100% to 10%<br />
<strong>for</strong> the PHEV application. Another favorable characteristic of the MS-TiO system is very low<br />
ASI, which results <strong>in</strong> very high power. The safety characteristics appear to be excellent; it is very<br />
tolerant of excessive voltage upon charg<strong>in</strong>g, with a much reduced likelihood of lithium deposition,<br />
and the stored chemical energy <strong>in</strong> the system is very low when compared with that of systems<br />
with graphite electrodes. As will be shown by the data that follow, the cycle life <strong>for</strong> the MS-TiO<br />
system is excellent. Cost projections are only tentative, but the MS-TiO system appears to have<br />
<strong>in</strong>herent advantages over the other systems <strong>in</strong> that its electrode materials have low cost and are<br />
plentiful.<br />
The fourth system <strong>in</strong> Table 1, MNS-TiO, is similar to the MS-TiO system, but with a manganesenickel<br />
sp<strong>in</strong>el positive electrode that operates at a very high voltage versus lithium (4.8 V at full<br />
charge) and with improved capacity relative to manganese sp<strong>in</strong>el. At the present time the ASI is<br />
higher than <strong>for</strong> the MN-TiO system, but it is believed that this can be improved sufficiently to<br />
achieve the required power (100 kW <strong>for</strong> the PHEVs <strong>in</strong> this study) <strong>for</strong> a 40-mile range PHEV.<br />
The highest capacity positive electrode <strong>in</strong> Table 1 is <strong>in</strong> the MN-graphite system developed at<br />
Argonne [9,10]. This would result <strong>in</strong> the lowest battery weight <strong>for</strong> a 40-mile PHEV <strong>for</strong> the<br />
batteries reviewed <strong>in</strong> Table 1. This system requires more development work, but it illustrates the<br />
improvements <strong>in</strong> battery per<strong>for</strong>mance that may come <strong>in</strong> the future.<br />
3. Sp<strong>in</strong>el-Titanate Battery Per<strong>for</strong>mance Model<strong>in</strong>g<br />
3.1 Approach<br />
Despite its low capacity and low voltage, we have studied the MS-TiO system to determ<strong>in</strong>e if a<br />
battery-vehicle comb<strong>in</strong>ation could be found that exploits the very high power of the MS-TiO<br />
system. A type of vehicle that may be particularly enhanced by very high battery power is one<br />
with a series-connected powertra<strong>in</strong> with sport-sedan per<strong>for</strong>mance. For such a vehicle to achieve<br />
high fuel economy, the eng<strong>in</strong>e should operate close to its peak efficiency, which requires that the<br />
battery have high power to accept charg<strong>in</strong>g at a high rate. There<strong>for</strong>e, we decided to design a<br />
battery that could discharge at the 100-kW rate <strong>for</strong> a 10-s burst at 90% open-circuit voltage<br />
(OCV) so that the overall battery efficiency would exceed 97% <strong>for</strong> most vehicle-driv<strong>in</strong>g cycles.<br />
The high battery power would also make possible higher vehicle per<strong>for</strong>mance than is usually<br />
expected of HEVs and more like that of a sport-sedan.<br />
Through a collaboration between Argonne and EnerDel, experimental data became available that<br />
establish the low area-specific impedance of the MS-TiO system and the promis<strong>in</strong>g long cycle<br />
life <strong>for</strong> deep discharges, which justify the assumption that the battery can be operated between<br />
100% and 10% SOC. Two types of model<strong>in</strong>g were required to characterize the battery <strong>for</strong><br />
vehicle simulation studies: (1) design model<strong>in</strong>g to determ<strong>in</strong>e the battery weight, volume and<br />
electrical per<strong>for</strong>mance and (2) impedance model<strong>in</strong>g. The experimental data and model<strong>in</strong>g are<br />
discussed below.
3.2 Experimental Data<br />
Tests with a 1.8-Ah MS-TiO cell demonstrated outstand<strong>in</strong>g power; 97% of the capacity measured<br />
at the 1C discharge rate was delivered at the 50C rate (Fig. 1) [11]. These results were correlated<br />
to obta<strong>in</strong> the impedance equations required <strong>for</strong> the vehicle simulation tests.<br />
The capacity stability was demonstrated <strong>in</strong> tests <strong>in</strong> which the entire cell capacity was discharged<br />
and charged at the 5C rate at an elevated temperature of 55 o C to accelerate degradation. After<br />
2,300 cycles there was little <strong>in</strong>dication of capacity loss (Fig. 2) [11]. Pulse power<br />
characterization tests were carried out at 30 o C after 1,000 and 2,000 cycles and demonstrated<br />
little loss of power with cycl<strong>in</strong>g, and <strong>in</strong>cidentally, restored the full <strong>in</strong>itial capacity. The promis<strong>in</strong>g<br />
results obta<strong>in</strong>ed <strong>in</strong> these aggressive tests at high temperature <strong>in</strong>dicate that MS-TiO batteries may<br />
be able to achieve the 5,000 cycles required <strong>for</strong> the PHEV application.<br />
Voltage(V)<br />
3.0<br />
2.8<br />
2.6<br />
2.4<br />
2.2<br />
2.0<br />
1.8<br />
1.6<br />
1.4<br />
0 10 20 30 40 50 60 70 80 90 100 110<br />
% of 1C Capacity<br />
Figure 1. <strong>Lithium</strong>-Manganese Sp<strong>in</strong>el/<strong>Lithium</strong>-Titanate 1.8-Ah Cell Charged<br />
at 1C Rate and Discharged at Vary<strong>in</strong>g Rates at 30 o C [11]<br />
2C<br />
5C<br />
10C<br />
20C<br />
30C<br />
40C<br />
50C
Capacity (Ah)<br />
2.0<br />
1.8<br />
1.6<br />
1.4<br />
1.2<br />
1.0<br />
0.8<br />
0.6<br />
0.4<br />
0.2<br />
Figure 2. Deep Discharg<strong>in</strong>g of <strong>Lithium</strong>-Manganese Sp<strong>in</strong>el/<strong>Lithium</strong>-Titanate Cell<br />
to Demonstrate Long Cycle Life [11]<br />
3.3 Battery Design Model<strong>in</strong>g<br />
55o 55 C<br />
5C charge<br />
5C discharge<br />
100% DOD<br />
oC 5C charge<br />
5C discharge<br />
100% DOD<br />
0.0<br />
0 500 1000 1500 2000 2500<br />
Cycle Number<br />
We have developed a method, based on Excel spreadsheets, <strong>for</strong> design<strong>in</strong>g cells and batteries that<br />
has been applied <strong>for</strong> several battery systems. In recent years, the method has been used primarily<br />
<strong>for</strong> design<strong>in</strong>g lithium-ion batteries <strong>for</strong> HEVs and PHEVs [12,13]. One <strong>for</strong>m of <strong>in</strong>put <strong>for</strong> this<br />
method is test results from measurements of capacity and ASI on small cells with areas of only a<br />
few square centimeters. It is also possible to accept data from larger cells by account<strong>in</strong>g <strong>for</strong> the<br />
resistance of the current collection system <strong>in</strong> the tested cells. The method calculates the volumes<br />
and weights of all of the cell and battery components and the electrical per<strong>for</strong>mance of the battery.<br />
By this method, three batteries were designed <strong>for</strong> a series-connected vehicle from the data <strong>in</strong><br />
Table 1 <strong>for</strong> the MS-TiO system and from other proprietary <strong>in</strong>put. The results are shown <strong>in</strong> Tables<br />
2 and 3.
Table 2. Cell Parameters <strong>for</strong> <strong>Lithium</strong>-Manganese Sp<strong>in</strong>el/<strong>Lithium</strong>-Titanate<br />
<strong>Batteries</strong> <strong>for</strong> HEVs and PHEVs<br />
Cell Parameters HEV<br />
10-Mile*<br />
PHEV<br />
20-Mile*<br />
PHEV<br />
Cell Capacity (1/C rate), Ah 10.0 16.6 33.3<br />
Positive First Charge Load<strong>in</strong>g Density, mAh/cm 2 0.54 0.88 1.79<br />
Negative-to-Positive 1 st Charge Capacity Ratio 1.0 1.0 1.0<br />
Maximum Voltage on Charg<strong>in</strong>g, V 2.7 2.7 2.7<br />
Average Voltage on Discharge, V 2.51 2.51 2.51<br />
Positive Electrode<br />
Active Material Li1.06Mn1.94O4 Li1.06Mn1.94O4 Li1.06Mn1.94O4<br />
Thickness of Coat<strong>in</strong>g (each side), µm 25 40 82<br />
Negative Electrode Material<br />
Active material Li4Ti5O12 Li4Ti5O12 Li4Ti5O12<br />
Thickness of Coat<strong>in</strong>g (each side), µm 21 34 70<br />
Total Cell Area, cm 2 20,500 20,500 20,500<br />
Cell Dimensions, mm<br />
Height 189 219 219<br />
Width 104 116 187<br />
Thickness 12.2 12.4 12.5<br />
Cell Weight, g 471 648 1102<br />
Power, W 1251 1251 1251<br />
Cell Specific Power, kW/kg 2.66 1.93 1.14<br />
Cell Specific Energy (1/C rate), Wh/kg 53 64 76<br />
*Based upon energy usage of 300 Wh/mile.
Table 3. Battery Parameters <strong>for</strong> <strong>Lithium</strong>-Manganese Sp<strong>in</strong>el/<strong>Lithium</strong>-Titanate<br />
<strong>Batteries</strong> <strong>for</strong> HEVs and PHEVs<br />
Battery Parameters HEV<br />
10-Mile*<br />
PHEV<br />
20-Mile*<br />
PHEV<br />
Number of Cells <strong>in</strong> Battery 80 80 80<br />
Number of Modules (10 cells each) 8 8 8<br />
Energy Storage (1-h rate), kWh 2.0 3.3 6.7<br />
Useable Energy<br />
HEV, 60% to 35% SOC 0.50<br />
PHEV, 100% to 10% SOC 3.0 6.0<br />
Discharge Power (10 s), kW 100 100 100<br />
Discharge Voltage af Full Power (50% SOC), V 181 181 181<br />
% of Open Circuit Voltage 90 90 90<br />
Power Density, kW/L 3.59 2.81 1.81<br />
Current on Discharge, A<br />
At Rated Power (50% SOC, 90% OCV) 552.5 552.5 552.5<br />
Maximum Allowed (30 s) 560.0 560.0 560.0<br />
Maximum Regeneration Power, kW<br />
Short-Term (2-s regen brak<strong>in</strong>g) 100 100 100<br />
Long-Term (up to 60 s) 70 70 70<br />
Maximum Charge Voltage, V 216 216 216<br />
Insulated Battery Wall Thickness, mm 7 7 8<br />
Battery Dimensions, mm<br />
Length 852 973 973<br />
Width 266 270 274<br />
Height 123 135 207<br />
Volume, L 28 36 55<br />
Weight, kg 45 60 100<br />
Total Weight of Cells, % of Battery Weight 84 86 88<br />
Cool<strong>in</strong>g Fluid (exterior of modules only) Air Air Air<br />
*Based upon energy usage of approximately 300 Wh/mile.
3.4 Impedance Model<strong>in</strong>g<br />
On the basis of the data shown <strong>in</strong> Figures 1 and 2, the impedance of the experimental cell was<br />
modeled to fit Equation (1) <strong>in</strong> Figure 3 [14].<br />
V L<br />
I L Ro<br />
Rp 1 Rp2<br />
Equation (1) 1000*(OCV-V L)/I L = R = Ro+Rp 1*Ip 1/I L+Rp 2*Ip 2/I L<br />
Where, OCV = open circuit voltage, V<br />
VL = cell voltage, V<br />
R = total cell impedance, milliohms<br />
Ro = cell <strong>in</strong>ternal ohmic resistance, milliohms<br />
Rp1 = first <strong>in</strong>ternal polarization resistance, milliohms<br />
Rp2 = second <strong>in</strong>ternal polarization resistance, milliohms<br />
IL = cell load current, A<br />
Ip1 = current through first polarization resistance, A<br />
Ip2 = current through second polarization resistance, A<br />
The values <strong>for</strong> Ip1 and Ip2 are derived by <strong>in</strong>tegration of the differential equation:<br />
Equation (2) dlp/dt = (IL-Ip)/τ<br />
Ip 1<br />
Ip2<br />
OCV<br />
Figure 3. Impedance Model <strong>for</strong> <strong>Lithium</strong>-Manganese Sp<strong>in</strong>el/<strong>Lithium</strong>-Titanate <strong>Batteries</strong> [14]<br />
The results were adjusted to simulate a 1-Ah cell to facilitate use <strong>in</strong> calculat<strong>in</strong>g battery impedance<br />
<strong>for</strong> any desired capacity and number of cells and are shown <strong>in</strong> Table 4, <strong>in</strong> which the values of<br />
Tau1 and Tau2 are time constants expressed <strong>in</strong> seconds <strong>for</strong> the two polarization resistances <strong>in</strong> the<br />
model.<br />
The impedance parameters <strong>for</strong> the 1-Ah Cell of Table 4 were applied <strong>for</strong> the 100-kW batteries of<br />
Table 3 with the result illustrated <strong>in</strong> Table 5.
Table 4. Parameters <strong>for</strong> Calculat<strong>in</strong>g Impedance of a 1-Ah <strong>Lithium</strong>-Manganese<br />
Sp<strong>in</strong>el/<strong>Lithium</strong>-Titanate Cell<br />
DOD, % OCV Ro Rp1 Rp2 Tau1 Tau2<br />
0 2.661 0.00320 0.00220 0.00100 10 270<br />
10 2.621 0.00320 0.00220 0.00120 10 270<br />
20 2.593 0.00320 0.00209 0.00130 10 270<br />
30 2.569 0.00320 0.00220 0.00130 10 270<br />
40 2.543 0.00320 0.00230 0.00140 10 270<br />
50 2.514 0.00320 0.00266 0.00140 10 270<br />
60 2.483 0.00320 0.00313 0.00132 10 270<br />
70 2.446 0.00320 0.00355 0.00108 10 270<br />
80 2.408 0.00320 0.00420 0.00100 10 270<br />
90 2.368 0.00320 0.00500 0.00100 10 270<br />
95 2.336 0.00380 0.00600 0.00100 10 270<br />
100 1.6 0.00440 0.00700 0.00100 10 270<br />
Table 5. Impedance, Voltage, and Current <strong>for</strong> 10-second Power Burst<br />
<strong>for</strong> 100-kW <strong>Lithium</strong>-Manganese Sp<strong>in</strong>el/<strong>Lithium</strong>-Titanate <strong>Batteries</strong><br />
10-s Burst Discharge at 100 kW<br />
SOC, % R-10s V %OCV A<br />
10-s Burst Power<br />
at 560 A, kW<br />
100 0.0342 195.4 91.8 511.8 108.5<br />
90 0.0343 191.8 91.5 521.3 106.7<br />
80 0.0338 189.6 91.4 527.3 105.6<br />
70 0.0343 187.2 91.1 534.2 104.3<br />
60 0.0348 184.6 90.7 541.7 103.0<br />
50 0.0364 181.0 90.0 552.5 101.2<br />
40 0.0386 176.8 89.0 565.6 99.1<br />
30 0.0405 172.2 88.0 580.8 96.9<br />
20 0.0435 166.5 86.5 600.4 94.2<br />
10 0.0472 160.0 84.4 625.2 91.3<br />
5 0.0562 149.2 79.9 670.1 87.0<br />
0 0.0652<br />
4. Vehicle Simulation <strong>for</strong> High-Power <strong>Batteries</strong><br />
4.1 Approach<br />
The Powertra<strong>in</strong> System Analysis Tool (PSAT) [15, 16], developed with MATLAB/Simul<strong>in</strong>k, is a<br />
vehicle-model<strong>in</strong>g package used to simulate per<strong>for</strong>mance and fuel economy. It allows one to<br />
realistically estimate the wheel torque needed to achieve a desired speed by send<strong>in</strong>g commands to<br />
different components, such as throttle position <strong>for</strong> the eng<strong>in</strong>e, displacement <strong>for</strong> the clutch, gear<br />
number <strong>for</strong> the transmission, or mechanical brak<strong>in</strong>g <strong>for</strong> the wheels. In this way, we can model a<br />
driver who follows a predef<strong>in</strong>ed speed cycle. Moreover, as components <strong>in</strong> PSAT react to<br />
commands realistically, we can employ advanced component models, take <strong>in</strong>to account transient
effects (e.g., eng<strong>in</strong>e start<strong>in</strong>g, clutch engagement/disengagement, or shift<strong>in</strong>g), and develop realistic<br />
control strategies. F<strong>in</strong>ally, by us<strong>in</strong>g test data measured at Argonne’s <strong>Advanced</strong> Powertra<strong>in</strong><br />
Research Facility (APRF), PSAT has been shown to predict the fuel economy of several hybrid<br />
vehicles with<strong>in</strong> 5% on the comb<strong>in</strong>ed cycle. PSAT is the primary vehicle simulation package used<br />
to support the U.S. Department of Energy’s (DOE’s) FreedomCAR research and development<br />
activities.<br />
4.2 Vehicle Characteristics<br />
Several vehicles were sized <strong>for</strong> different specifications based on the same vehicle attributes:<br />
o HEV<br />
o PHEV with 10 miles All <strong>Electric</strong> Range (AER)<br />
o PHEV with 20 miles All <strong>Electric</strong> Range (AER)<br />
The ma<strong>in</strong> component masses are shown <strong>in</strong> Table 6 and Table 7 lists the ma<strong>in</strong><br />
characteristics of the simulated midsize car.<br />
Table 6. Mass of Vehicle Components (kg)<br />
Component HEV PHEV10 PHEV20<br />
Eng<strong>in</strong>e Mass 120 120 120<br />
Generator Mass 86 86 87<br />
Motor Mass 144 144 146<br />
Battery Mass 45 60 100<br />
Vehicle Mass 1575 1590 1633<br />
Table 7. Vehicle Ma<strong>in</strong> Specifications<br />
Component Specifications<br />
Eng<strong>in</strong>e 2004 US Prius<br />
<strong>Electric</strong> mach<strong>in</strong>e Ballard IPT - Induction<br />
S<strong>in</strong>gle Gear Ratio 2<br />
F<strong>in</strong>al Drive Ratio 3.8<br />
Frontal Area 2.1 m 2<br />
Drag Coefficient 0.25<br />
Roll<strong>in</strong>g Resist. 0.007 (plus speed related term)<br />
Wheel radius 0.317 m<br />
As shown <strong>in</strong> Figure 4, the configuration selected is a series eng<strong>in</strong>e hybrid, very similar to the one<br />
used <strong>in</strong> the GM Volt [17].
Figure 4. Series Eng<strong>in</strong>e Configuration<br />
Five driv<strong>in</strong>g cycles are considered <strong>in</strong> the study to evaluate the impact of advanced lithium-ion<br />
batteries on fuel economy: UDDS (urban dynamometer driv<strong>in</strong>g schedule), HWFET (highway fuel<br />
economy test), LA92 (1992 test data from Los Angeles), NEDC (new European driv<strong>in</strong>g cycle)<br />
and Ford ATDS. The ma<strong>in</strong> characteristics of each cycle are summarized <strong>in</strong> Table 8.<br />
Table 8. Drive Cycle Characteristics<br />
Unit UDDS HWFET LA92 ATDS NEDC<br />
Duration s 1372 764 1435 1799 1180<br />
Distance km/mi 11.92/7.45 16.38/10.24 15.7/9.81 25.2/15.75 10.9/6.84<br />
Average Speed mph 19.5 48.26 24.6 31.5 20.86<br />
Average Accel m/s 2 0.5 0.19 0.67 0.55 0.59<br />
Average Decel m/s 2 -0.57 -0.22 -0.75 -0.55 -0.78<br />
Number stops 17 1 16 18 13<br />
Percent Stops 18.92 0.65 16.3 20.73 24.9<br />
Note that all the simulations per<strong>for</strong>med <strong>in</strong> PSAT represent hot conditions.<br />
4.3 Component Siz<strong>in</strong>g Algorithm<br />
The components of the different vehicles were sized to meet the same vehicle per<strong>for</strong>mances:<br />
• 0-60 mph <strong>in</strong> less than 7sec<br />
• Gradeability of 6% at 65 mph<br />
To quickly size the component models of the powertra<strong>in</strong>, an automated siz<strong>in</strong>g process was<br />
developed. A flow chart illustrat<strong>in</strong>g the siz<strong>in</strong>g process logic is shown <strong>in</strong> Fig. 5. While the eng<strong>in</strong>e<br />
power is the only variable <strong>for</strong> conventional vehicles, HEVs have two variables: eng<strong>in</strong>e power and<br />
electric power. In that case, the eng<strong>in</strong>e is sized to meet the gradeability requirements while the<br />
battery is sized to meet the per<strong>for</strong>mance requirements. In the study, we also <strong>in</strong>sure that the<br />
vehicle can capture the entire energy from regenerative brak<strong>in</strong>g dur<strong>in</strong>g decelerations on the<br />
UDDS.<br />
Similar to the HEV configuration, the eng<strong>in</strong>e and generator powers are sized to meet the<br />
gradeability requirements. In addition to HEVs, the battery power has to be sized to follow the<br />
UDDS driv<strong>in</strong>g cycle while <strong>in</strong> all-electrical mode. F<strong>in</strong>ally, the battery energy is sized to achieve
the required AER of the vehicle. The AER is def<strong>in</strong>ed as the distance the vehicle can travel on the<br />
UDDS without start<strong>in</strong>g the eng<strong>in</strong>e. Note that a separate control algorithm is used to simulate the<br />
AER. This algorithm <strong>for</strong>ces the eng<strong>in</strong>e to rema<strong>in</strong> off throughout the cycle, regardless of the<br />
torque request from the driver.<br />
No<br />
No<br />
Figure 5. PHEV Component Siz<strong>in</strong>g Process<br />
The ma<strong>in</strong> component characteristics result<strong>in</strong>g from the siz<strong>in</strong>g algorithm are described <strong>in</strong> Table 3.<br />
Table 9. Component Siz<strong>in</strong>g Results<br />
HEV PHEV10 PHEV20<br />
Eng<strong>in</strong>e Power kW 100 100 102<br />
Generator Power kW 95 95 96<br />
Motor Power kW 130 130 132<br />
Battery Power kW 100 100 100<br />
Vehicle Mass kg 1575 1590 1633<br />
Accel. Time 0-60 mph s 6.2 6.2 6.3<br />
4.4 Control Strategy Philosophy<br />
Vehicle Assumptions<br />
Motor Power<br />
Battery Power<br />
Eng<strong>in</strong>e Power<br />
Battery Energy<br />
Yes<br />
Convergence<br />
The control strategy of the PHEVs can be separated <strong>in</strong>to two dist<strong>in</strong>ct modes, as shown <strong>in</strong> Fig. 6:<br />
• Charge-Deplet<strong>in</strong>g (CD) Mode: Vehicle operation on the electric drive, eng<strong>in</strong>e<br />
subsystem or both with a net decrease <strong>in</strong> battery SOC.<br />
• Charge-Susta<strong>in</strong><strong>in</strong>g (CS): Vehicle operation on the electric drive, eng<strong>in</strong>e<br />
subsystem or both with a ‘constant’ battery state-of-charge (i.e., with<strong>in</strong> a<br />
narrow range), which is similar to that <strong>in</strong> current production HEVs.<br />
Dur<strong>in</strong>g a simulation, the eng<strong>in</strong>e is turned on when the battery SOC is low or the power requested<br />
at the wheel cannot be provided by the battery alone. Turn<strong>in</strong>g the eng<strong>in</strong>e on expends fuel but<br />
conserves battery energy, so that more miles can be traveled be<strong>for</strong>e the battery reaches its<br />
discharged state. When the eng<strong>in</strong>e is ON, it is operated close to its best efficiency curve. As a
esult, the battery is be<strong>in</strong>g charged by the eng<strong>in</strong>e dur<strong>in</strong>g low power requests, lead<strong>in</strong>g to lower<br />
electrical consumption.<br />
The <strong>in</strong>itial SOC of the battery, which is also the battery’s maximum charge, is 100%, and the<br />
f<strong>in</strong>al SOC of the battery, which is also the battery’s m<strong>in</strong>imum charge, is 10%. For the CD mode,<br />
the eng<strong>in</strong>e logic was written <strong>in</strong> StateFlow and used several conditions, such as battery SOC,<br />
motor power limits, and vehicle speed, to determ<strong>in</strong>e when the eng<strong>in</strong>e should turn on and the<br />
output torque of the eng<strong>in</strong>e. The logic of the CS mode was similar to that of current HEVs.<br />
100<br />
80<br />
60<br />
40<br />
20<br />
0<br />
veh_l<strong>in</strong>_spd_out [mile/h]<br />
eng_pwr_out [kW]<br />
ess_soc_abs [%]<br />
-20<br />
0 500 1000 1500<br />
time<br />
2000 2500 3000<br />
4.5 Fuel Economy Results<br />
Figure 6. Control Strategy SOC Behavior on the UDDS<br />
As previously mentioned, several driv<strong>in</strong>g cycles have been considered to evaluate the benefits of<br />
the advanced lithium-ion batteries on PHEVs. Table 4 summarizes the electrical consumption on<br />
each PHEV vehicle on the first cycle of each drive cycle. These results highlight the differences<br />
between the different drive cycles. As expected, the standardized drive cycles (UDDS, HWFET<br />
and NEDC) require a lower electrical consumption than the cycles that are more “real-world”.<br />
The ATDS is the most aggressive drive cycle.<br />
Table 10. PHEV <strong>Electric</strong>al In<strong>for</strong>mation<br />
UDDS HWFET NEDC LA92 ATDS<br />
10 miles Elec Cons. First Cycle (Wh/mile) 224.6 204.3 234.1 282.6 190.4(1)<br />
AER All <strong>Electric</strong> Range (miles) 13.8 14.3 12.8 10.3 9.5<br />
20 miles Elec Cons. First Cycle (Wh/mile) 257.9 209.9 241.6 297.9 300.8<br />
AER All <strong>Electric</strong> Range (miles) 26.6 28.6 26.5 20.4 19.9<br />
(1) Eng<strong>in</strong>e started dur<strong>in</strong>g the first cycle
Because the primary goal of PHEVs is to maximize the fuel displacement, the follow<strong>in</strong>g analysis<br />
focuses on fuel consumption. Figure 7 shows the evolution of the fuel economy when each cycle<br />
is repeated 10 times.<br />
Fuel Economy (mpg)<br />
Figure 7. Fuel Economy Evolution on UDDS and HWFET<br />
The benefit of high-power batteries is noticeable on the more aggressive driv<strong>in</strong>g cycles (Fig. 8).<br />
When an eng<strong>in</strong>e start would have been necessary <strong>for</strong> low power batteries, the <strong>in</strong>itial distance can<br />
be per<strong>for</strong>med <strong>in</strong> EV mode without any help from the eng<strong>in</strong>e. Note, however, that previous<br />
studies [18] have demonstrated the need to know the trip distance to properly m<strong>in</strong>imize fuel<br />
consumption. However, higher battery power allows additional flexibility <strong>in</strong> decid<strong>in</strong>g when to<br />
start the eng<strong>in</strong>e.<br />
Fuel Economy (mpg)<br />
400<br />
350<br />
300<br />
250<br />
200<br />
150<br />
100<br />
50<br />
0<br />
50<br />
45<br />
40<br />
35<br />
30<br />
25<br />
20<br />
15<br />
10<br />
5<br />
0<br />
Series HEV<br />
Series PHEV 10AER<br />
Series PHEV 20AER<br />
1 2 3 4 5 6 7 8 9 10<br />
UDDS Cycle Number<br />
Series HEV<br />
Series PHEV 10AER<br />
Series PHEV 20AER<br />
1 2 3 4 5 6 7 8 9 10<br />
LA92 Cycle Number<br />
Figure 8. Fuel Economy Evolution on LA92 and ATDS<br />
Table 5 shows the charge susta<strong>in</strong><strong>in</strong>g fuel economies of the different vehicles. Due to <strong>in</strong>creased<br />
vehicle mass, the fuel economy decreases slightly with an <strong>in</strong>crease <strong>in</strong> All <strong>Electric</strong> Range.<br />
Fuel Economy (mpg)<br />
Fuel Economy (mpg)<br />
300<br />
250<br />
200<br />
150<br />
100<br />
50<br />
0<br />
120<br />
100<br />
80<br />
60<br />
40<br />
20<br />
Series HEV<br />
Series PHEV 10AER<br />
Series PHEV 20AER<br />
1 2 3 4 5 6 7 8 9 10<br />
HWFET Cycle Number<br />
0<br />
Series HEV<br />
Series PHEV 10AER<br />
Series PHEV 20AER<br />
1 2 3 4 5 6 7 8 9 10<br />
ATDS Cycle Number
Table 11. Charge Susta<strong>in</strong><strong>in</strong>g Fuel Economy (mpg)<br />
UDDS HWFET NEDC LA92 ATDS<br />
HEV 51.9 54.4 52.3 39.3 40.0<br />
PHEV 10 51 53.3 51.5 38.6 38.8<br />
PHEV 20 49.6 52 50.5 37.9 38<br />
Figure 9 shows the evolution of the electrical consumption <strong>for</strong> the UDDS and ATDS drive cycles.<br />
The impact of the cycle aggressiveness can be seen by the slope of the electrical consumption. In<br />
the case of the ATDS, the slope is much stiffer than <strong>for</strong> the UDDS.<br />
<strong>Electric</strong>al Consumption (Wh/mile)<br />
300<br />
250<br />
200<br />
150<br />
100<br />
50<br />
0<br />
1 2 3 4 5 6 7 8 9 10<br />
-50<br />
Figure 9. <strong>Electric</strong>al Consumption Evolution on UDDS and ATDS<br />
The efficiencies of the vehicle components are very high as illustrated <strong>in</strong> Table 11 <strong>for</strong> theUDDS<br />
cycle. Improvement <strong>in</strong> the fuel economy <strong>for</strong> these vehicles could be achieved by <strong>in</strong>creas<strong>in</strong>g the<br />
motor efficiency. An additional motor of low power (30-50 kW) could be provided to be used<br />
under light loads under which it could operate at higher efficiency than the high-power motor<br />
(130 kW) <strong>in</strong> the evaluated designs.<br />
Table 11. Component Average Efficiencies (%) on UDDS<br />
Component HEV PHEV10 PHEV20<br />
Eng<strong>in</strong>e 36.9 37.2 37.2<br />
Generator 91.9 91.9 91.9<br />
Motor 80.4 80.4 80.4<br />
Battery 98.4 97.5 97.4<br />
Gear 97.5 97.5 97.5<br />
The high battery efficiency, results <strong>in</strong> very little battery heat<strong>in</strong>g. One hour of travel on the UDDS<br />
cycle would heat up the PHEV10 battery by only1.6 o C under adiabatic conditions.<br />
5. Conclusions<br />
UDDS Cycle Number<br />
Series HEV<br />
Series PHEV 10AER<br />
Series PHEV 20AER<br />
0<br />
1 2 3 4 5 6 7 8 9 10<br />
High vehicle per<strong>for</strong>mance, of the type expected from sport sedans, and high fuel economy can be<br />
achieved at the same time by a vehicle hav<strong>in</strong>g a series powertra<strong>in</strong> and a high-power manganese<br />
sp<strong>in</strong>el/lithium titanate battery. Further improvement <strong>in</strong> fuel economy might result from<br />
improv<strong>in</strong>g the motor efficiency. This battery can provide high power at such high battery<br />
efficiency that battery cool<strong>in</strong>g is virtually unnecessary. This type of vehicle shows promise of<br />
<strong>Electric</strong>al Consumption (Wh/mile)<br />
350<br />
300<br />
250<br />
200<br />
150<br />
100<br />
50<br />
-50<br />
Series HEV<br />
ATDS Cycle Number<br />
Series PHEV 10AER<br />
Series PHEV 20AER
hav<strong>in</strong>g a moderate cost if it is mass produced because there is no transmission, the eng<strong>in</strong>e and<br />
generator may be less expensive s<strong>in</strong>ce they are designed to operate at only one speed and power,<br />
and the battery electrode materials are <strong>in</strong>expensive.<br />
6. Acknowledgements<br />
This work was supported by DOE’s FreedomCAR and Vehicle Technology Office under the<br />
direction of Tien Duong and David Howell of that program. The submitted manuscript has been<br />
created by the UChicago Argonne, LLC, Operator of Argonne National Laboratory (“Argonne”).<br />
Arrgonne, a U.S. Department of Energy Office of Science laboratory, is operated under Contract<br />
No. DE-AC02-06CH11357. The U.S. Government reta<strong>in</strong>s <strong>for</strong> itself, and others act<strong>in</strong>g on its<br />
behalf, a paid-up nonexclusive, irrevocable worldwide license <strong>in</strong> said article to reproduce, prepare<br />
derivative works, distribute copies to the public, and per<strong>for</strong>m publicly and display publicly, by or<br />
on behalf of the Government.<br />
7. References<br />
[1] Am<strong>in</strong>e, K., Chen, C.H., Liu, J., Hammond, M., Jansen, A., Dees, D., Bloom, I., Vissers, D. and<br />
Henriksen, G.,Journal of Power Sources, 97-8:684-687, 2001.<br />
[2] Abraham, D.P., Liu, J, Chen, C.H, Am<strong>in</strong>e, K., Journal of Power Sources 119:511-516 Sp. Iss. SI, 2003.<br />
[3] Belharouak I, Lu, W.Q., Vissers, D., et al. Electrochemistry Communications 8(2):329-335, 2006.<br />
[4] Doughty, D.H., Roth, E.P., Crafts, C.C., Nagasubramanian, G., Henriksen, G., and Am<strong>in</strong>e, K., Journal<br />
of Power Sources, 146:116-120, 2005.<br />
[5] Am<strong>in</strong>e, K., Liu, J. and Belharouak, I., Electrochemistry Communications, 7:669-673, 2005.<br />
[6] Am<strong>in</strong>e, K., Liu, J., Belharouak, I., Kang, S. H., Bloom, I., Vissers, D. and Henriksen, Journal of<br />
Power Sources, 146:111-115, 2005.<br />
[7] Am<strong>in</strong>e, K., Liu, J., Kang, S., et al., Journal of Power Sources 129, 1:14-19, 2004.<br />
[8] Chen, Z. and Am<strong>in</strong>e, K., Journal of the Electrochemical Society 153(2):A316-A320 2006.<br />
[9] Kang, S.H., Sun, Y.K. and Am<strong>in</strong>e, K. Electrochemical and Solid State Letters 6(9):A183-A186, 2003.<br />
[10 Kang, S.H., and Am<strong>in</strong>e, K., Journal of Power Sources, 146:654-657, 2005.<br />
[11] Am<strong>in</strong>e, K., and Belharoauk, I., Liu, J., Tan, T., Yumoto, H. and Ota, N., Abstract No: 2F09, 48th<br />
Battery Symposium <strong>in</strong> Japan,.<br />
[12] Nelson, P., Dees, D., and Am<strong>in</strong>e, K. and Henriksen, G., J. Power Sources 110(2); 349, 2002.<br />
[13] Nelson, P., Bloom, I., and Am<strong>in</strong>e, K., Henriksen, G., J. Power Sources 110(2); 437, 2002.<br />
[14] Nelson, P., Liu, J., Am<strong>in</strong>e, K.,Henriksen, G., ECS Proc. Vol. (F1) Power Sources Model<strong>in</strong>g, 2003.<br />
[15] Argonne National Laboratory, PSAT (Powertra<strong>in</strong> Systems Analysis Toolkit),<br />
http://www.transportation.anl.gov/.<br />
[16] Rousseau, A., Sharer, P., and Besnier, F., “Feasibility of Reusable Vehicle Model<strong>in</strong>g: Application to<br />
<strong>Hybrid</strong> <strong>Vehicles</strong>,” SAE paper 2004-01-1618, SAE World Congress, Detroit,<br />
http://www.eere.energy.gov/vehiclesandfuels, March 2004.<br />
[17] http://www.gm-volt.com/<br />
[18] Karbowski, D., Rousseau, A., Pagerit, S., and Sharer, P., “<strong>Plug</strong>-<strong>in</strong> Vehicle Control Strategy: From<br />
Global Optimization to Real Time Application”, 22th International <strong>Electric</strong> Vehicle Symposium (EVS22),<br />
Yokohama, October 2006.
8. Authors<br />
Paul Nelson, Chemical Eng<strong>in</strong>eer, Argonne National Laboratory, 9700 South Cass<br />
Avenue, Argonne, IL 60439-4815, USA.<br />
Paul Nelson is experienced <strong>in</strong> battery development and model<strong>in</strong>g. He received his PH.D<br />
<strong>in</strong> Chemical Eng<strong>in</strong>eer<strong>in</strong>g from Northwestern University <strong>in</strong> 1958 and an MBA degree<br />
from the University of Chicago <strong>in</strong> 1977.<br />
Khalil Am<strong>in</strong>e, Senior Scientist, Argonne National Laboratory, 9700 South Cass Avenue,<br />
Argonne, IL 60439-4815, USA.<br />
Dr. Am<strong>in</strong>e is a senior scientist and manager of the advanced battery program at Argonne<br />
National Laboratory s<strong>in</strong>ce 1998. He manages and directs the development of advanced<br />
chemistries and battery systems at Argonne <strong>for</strong> HEV and PHEV applications. He<br />
obta<strong>in</strong>ed his Ph.D <strong>in</strong> material sciences at CNRS Laboratory, Bordeaux University <strong>in</strong><br />
1989.<br />
Hiroyuki Yumoto, Director of Cell Development, leads EnerDel's lithium ion cell<br />
activities. Mr. Yumoto has a Bachelors degree <strong>in</strong> Industrial Chemistry and a Masters<br />
degree <strong>in</strong> Polymer Chemistry both from Kyoto University and also a Masters degree <strong>in</strong><br />
Material Science from University of Southern Cali<strong>for</strong>nia.<br />
Aymeric Rousseau, Research Eng<strong>in</strong>eer, Argonne National Laboratory, 9700 South Cass<br />
Avenue, Argonne, IL 60439-4815, USA, arousseau@anl.gov<br />
Aymeric Rousseau is head of the <strong>Advanced</strong> Powertra<strong>in</strong> <strong>Vehicles</strong> Model<strong>in</strong>g Department<br />
at Argonne National Laboratory. He received his eng<strong>in</strong>eer<strong>in</strong>g diploma at the Industrial<br />
System Eng<strong>in</strong>eer<strong>in</strong>g School <strong>in</strong> La Rochelle, France, <strong>in</strong> 1997.