Route D12/13/14: Presentation for Public ... - Metrobus Studies
Route D12/13/14: Presentation for Public ... - Metrobus Studies
Route D12/13/14: Presentation for Public ... - Metrobus Studies

You also want an ePaper? Increase the reach of your titles
YUMPU automatically turns print PDFs into web optimized ePapers that Google loves.
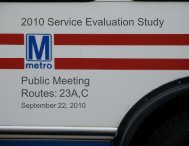
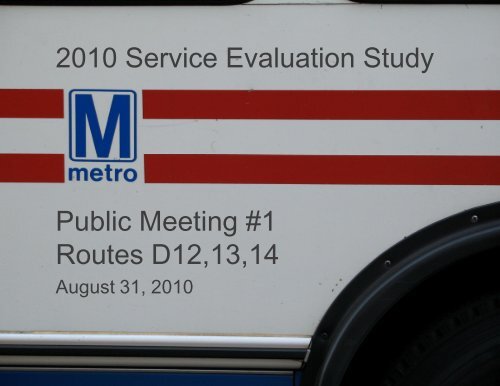
2010 Service Evaluation Study<strong>Public</strong> Meeting #1<strong>Route</strong>s <strong>D12</strong>,<strong>13</strong>,<strong>14</strong>August 31, 20101
What Will We Be Doing At This Meeting?• Introduce project team• Describe study purpose and background• Review project schedule• Review transit assessment• Roundtable discussion of service issues• Describe next steps• Explain how you can participate2
Project Staff• Girum Meseret, WMATA• Tim Rosenberger, PB• Brian Laverty, PB3
What is the Purpose of this Project?• Examine the service efficiency of variousroutes to improve:–on-time per<strong>for</strong>mance–reliability–frequency–travel time, and–bus stop amenities4
Project Background• Why this project?–WMATA and partner jurisdictions aretaking a systematic look at bus routesthroughout the region• What is the goal of the study?–Recommend service improvements aspart of annual budget process5
Project Background• Project Methodology–Collect and analyze data–Talk to bus operators, service planners,and passengers–Develop and evaluate service changeplans–Develop recommendations andimplementation strategy6
Project Schedule• Collate and Analyze Data: July-August 2010• <strong>Public</strong> meeting, 8/31/2010• Develop and Evaluate Service Change Plans:October 2010• Prepare Draft Recommendation: October 2010• <strong>Public</strong> meeting to discuss preliminaryrecommendations, 10/19/2010• Final recommendations, January 20117
<strong>D12</strong>,<strong>13</strong>,<strong>14</strong> History• Implemented in current <strong>for</strong>m in 2001 withopening of Branch Avenue Station• Be<strong>for</strong>e 2001, <strong>D12</strong> ran between SouthernAvenue Station and Marlow Heights• After 2001, <strong>D12</strong> extended to SuitlandStation• Be<strong>for</strong>e 2001, D<strong>13</strong>,<strong>14</strong> were originallysegments of M, P, and W routes8
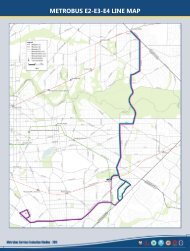
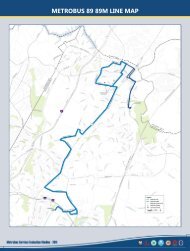
<strong>D12</strong>,<strong>13</strong>,<strong>14</strong> <strong>Route</strong> Map9
Transit Service Assessment
Service Characteristics<strong>D12</strong> D<strong>13</strong> D<strong>14</strong>Weekdays Saturdays Sundays Weekdays Weekdays Saturdays SundaysTypical Daily Run Time 49-50 min 54-61 min 49-54 min 71 min 60 min 74-75 min 64-65 minTypical AM Peak Run Time 49-51 min 49-54 min 49-50 min 71 min 70 min 69 min 50-64 minTypical PM Peak Run Time 55-56 min 54-61 min 53-54 min 71 min 60 min 74-75 min 66-68 minTypical Off Peak Run Time 46-51 min 47-61 min 48-54 min - 50-60 min 69-75 min 62-66 minService Hours: 19:48 17:44 11:50 6:01 19:40 17:28 <strong>14</strong>:02Daily Trips: 123 70 49 123 123 70 49Typical AM Peak Headway: 20-30 min 60 min 60 min 20-25 min 20-25 min 60 min 60 minTypical Midday Headway: 60 min 60 min 60 min - 60 min 60 min 60 minTypical PM Peak Headway: 24-32 min 60 min 60 min 22-29 min 22-29 min 60 min 60 minTypical Evening Headway: 64 min 60 min 60 min - 50-60 min 60 min 60 min11
Fare Payment12
Weekday <strong>D12</strong> On-Time Per<strong>for</strong>mance100%90%80%70%60%50%40%On TimeLateEarly30%20%10%0%Early AM AM Peak Midday PM Peak NightOn-time per<strong>for</strong>mance represents average <strong>for</strong> all daily trips.Early = more than two minutes early; Late = more than seven minutes late.<strong>13</strong>
Weekday D<strong>13</strong> On-Time Per<strong>for</strong>mance90%80%70%60%50%40%30%On TimeLateEarly20%10%0%AM PeakPM PeakOn-time per<strong>for</strong>mance represents average <strong>for</strong> all daily trips.Early = more than two minutes early; Late = more than seven minutes late.<strong>14</strong>
Weekday D<strong>14</strong> On-Time Per<strong>for</strong>mance100%90%80%70%60%50%40%On TimeLateEarly30%20%10%0%Early AM AM Peak Midday PM Peak NightOn-time per<strong>for</strong>mance represents average <strong>for</strong> all daily trips.Early = more than two minutes early; Late = more than seven minutes late.15
Ridership and Farebox RecoveryWeekdays(<strong>D12</strong>,<strong>13</strong>,<strong>14</strong>)Saturdays(<strong>D12</strong>,<strong>14</strong>)Sundays(<strong>D12</strong>,<strong>14</strong>)Average Daily Boardings 4,580 2,580 1,590Boardings/Mile 3 3 2Boardings/Trip 38 37 33Farebox Recovery 25.8% 20.8% 20.4%16
Ridership6,000<strong>Route</strong> <strong>D12</strong>,<strong>13</strong>,<strong>14</strong> Six-year Average Daily RidershipAverage Daily Ridership5,0004,0003,0002,0001,000WeekdaySaturdaySunday0Jul 2004Oct 2004Jan 2005Apr 2005Jul 2005Oct 2005Jan 2006Apr 2006Jul 2006Oct 2006Jan 2007Apr 2007Jul 2007Oct 2007Jan 2008Apr 2008Jul 2008Oct 2008Jan 2009Apr 2009Jul 2009Oct 2009Jan 2010Apr 201017
<strong>D12</strong> Boardings and Alightings—Eastbound<strong>D12</strong> Eastbound Weekday Daily Boardings and Alightings7006005004003002001000Southern Ave StationIndian HeadHwy/Southern AveKennebec/GlassmanorHelmont/DundalkOxon Hill/LivingstonSt Barnabas/VirginiaSt Barnabas/Holly TreeMarlow Heights MacysSt Barnabas/Bed<strong>for</strong>dSuitland StationBOARDINGSALIGHTINGS18
<strong>D12</strong> Boardings and Alightings—Westbound<strong>D12</strong> Westbound Weekday Daily Boardings and Alightings8007006005004003002001000Suitland StationMarlow Heights MacysMarlow Heights P&RSt Barnabas/Holly TreeSt Barnabas/VirginiaOxon Hill/LivingstonHelmont/DundalkKennebec/GlassmanorIndian HeadHwy/Southern AveSouthern Ave StationBOARDINGSALIGHTINGS19
D<strong>13</strong>,<strong>14</strong> Boardings and Alightings—EastboundD<strong>13</strong>,<strong>14</strong> Eastbound Weekday Daily Boardings and Alightings7006005004003002001000Southern Ave Stationndian HeadHwy/Southern AveKennebec/GlassmanorWilson Bridge/BrooksideLeyte/LindsaySt Barnabas/J HansonLaneHaras Place LoopCamp SpringsSuitland/RegencySuitland StationBOARDINGSALIGHTINGS20
D<strong>13</strong>,<strong>14</strong> Boardings and Alightings—WestboundD<strong>13</strong>,<strong>14</strong> Westbound Weekday Daily Boardings and Alightings8007006005004003002001000Suitland StationSuitland/RegencyAllentown/Old BranchCamp SpringsHaras Place LoopLeyte/LindsayWilson Bridge/BrooksideKennebec/GlassmanorIndian HeadHwy/Southern AveSouthern Ave StationBOARDINGSALIGHTINGS21
<strong>D12</strong> Capacity and LoadingEastboundWestboundLoad Point Load Factor Load Point Load FactorAM Peak St. Barnabas/Holly Tree <strong>13</strong>.3% Indian Head Hwy/Southern Ave 32.0%Midday Helmont/Dundalk 22.5% Indian Head Hwy/Southern Ave 44.6%PM Peak Southern Ave Station 30.4% Suitland Station 32.7%Night Southern Ave Station 29.5% St. Barnabas/Holly Tree 23.1%22
D<strong>13</strong>,<strong>14</strong> Capacity and LoadingEastboundWestboundLoad Point Load Factor Load Point Load FactorAM Peak Suitland/Regency Pkwy 28.5% Indian Head Hwy/Southern Ave 36.3%Midday Suitland/Regency Pkwy 22.5% Kennebec/Glassmanor 27.3%PM Peak Southern Ave Station 30.4% Suitland Station 32.7%Night Southern Ave Station 29.4% Suitland Station 23.3%23
Busiest <strong>D12</strong>,<strong>13</strong>,<strong>14</strong> StopsStop LocationAverageWeekdayBoardingsSouthern Avenue Station (Bus Bay M) 1,502Suitland Station (Bus Bay C) 1,106Kennebec Street and Glassmanor Drive 354Indian Head Highway and Southern Avenue 266Regency Parkway and Andrew Jackson Middle School 255Oxon Hill Road and Riverside Plaza Apartments 191St. Barnabas Road and Virginia Lane crossing 190Helmont Drive and Dundalk Drive 175Everhart Place and Corning Avenue 172Leyte Drive and Lindsay Drive 16624
Bus Stop AmenitiesAmenityAll Stops RequiringNew or ImprovedAmenitiesPercent of All StopsRequiring New orImproved AmenitiesBus Stop SignIn<strong>for</strong>mation Case*System Map*5’x8’ Pedestrian PadRear Pedestrian Pad*Sidewalk at Least 4’ WideTrash Can*Shelter*Seating*LightingNextBus LED*47 16%15 58%19 73%209 69%22 85%103 34%15 58%17 65%18 69%193 64%3 12%*Based on limited boarding data from about nine percent of the routes’ stops25
Customer ComplaintsType of ComplaintNumber ofComplaintsNo Show 59Driver Behavior 51Late Arrival 50Complaints loggedbetween June 2009and May 2010Pass Up 26Early Departure 20Stop Change 5Overcrowding 3Mechanical Malfunction 2Bunching 1Total 21726
Traffic Assessment
Observed and Scheduled Run TimesAM PeakCategory<strong>D12</strong> D<strong>13</strong> D<strong>14</strong>EB WB EB WB EB WBAverage Run Time, inminutes (scheduled)50 (49) 55 (54) - 73 (71) 73 (74) 78 (69)Average Speed* 16 mph 16 mph 16 mph 16 mph 16 mph 16 mphPM PeakCategory<strong>D12</strong> D<strong>13</strong> D<strong>14</strong>EB WB EB WB EB WBAverage Run Time, inminutes (scheduled)59 (54) 59 (55) 74 (65) - 80 (76) 86 (71)Average Speed*<strong>14</strong>.6 mph <strong>14</strong>.6 mph <strong>14</strong>.6 mph <strong>14</strong>.6 mph <strong>14</strong>.6 mph <strong>14</strong>.6 mph* For all three routes28
AM Peak Traffic (Weekday)29
AM Peak Average Travel Speed (Weekday)30
PM Peak Traffic (Weekday)31
PM Peak Average Travel Speed (Weekday)32
Summary of Operator Comments• Need more time during weekdays, including end-of-route recoverytime• Bus bunching most problematic during AM and PM peak periods• Standing loads when leaving the Metrorail Stations• Afternoon Census Bureau traffic creates difficulty <strong>for</strong> buses leavingSuitland Station• Most <strong>D12</strong> passengers exit be<strong>for</strong>e Oxon Hill Road• Difficulty clearing traffic signals at Oxon Hill Road and Virginia Lane• Hispanic population in Birchwood may need Spanish signage• Difficult to turn left from Birchwood Drive to Livingston Road due toshopping center traffic• Complaints about rowdy high school students33
<strong>D12</strong>,<strong>13</strong>,<strong>14</strong> Summary• Average daily ridership is up 10% between 2004-10• Southern Avenue and Glassmanor areas have high ridership• Ridership lowers considerably on D<strong>13</strong>,<strong>14</strong> as route operates farthereast in Prince George’s County• Imbalanced run time, with <strong>D12</strong> (55 min) shorter than the D<strong>13</strong>,<strong>14</strong> (70min)• <strong>Route</strong> is less productive than <strong>Metrobus</strong> average• Missed trips are an issue (0.45% of trips are missed) and lead incomplaints from the public• Rider behavior is a top contributor to incidents on the route• <strong>Route</strong> has 20-35% late time points in PM Peak and Night periods• The average run times show the route operates 8-15 minutes longerthan the allotted schedule during peak periods34
Roundtable Discussion• Break up into small groups.• Each group will have a moderator.• Moderator will run through a list ofquestions.• Each group will appoint a representativeto summarize their discussion.35
Next Steps• Incorporate public comments– Next public meeting 10/19/2010• Develop and evaluate alternative serviceimprovement plans• Prepare recommendations• Develop implementation plan• Incorporate into budget process• Implement phased improvements36
How Can You Participate?• Project Hot Line:– 202-370-2915• Website:– www.<strong>Metrobus</strong>-<strong>Studies</strong>.com37