1. Defining Stock Structure - Institute of Fisheries Management
1. Defining Stock Structure - Institute of Fisheries Management
1. Defining Stock Structure - Institute of Fisheries Management

You also want an ePaper? Increase the reach of your titles
YUMPU automatically turns print PDFs into web optimized ePapers that Google loves.
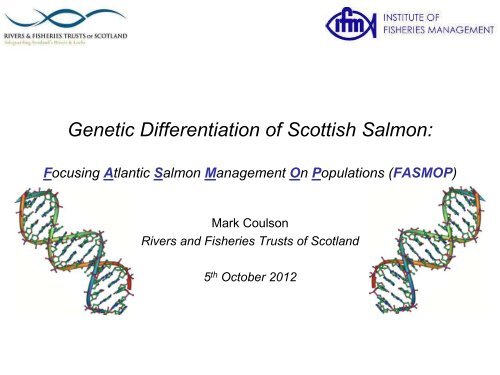
Genetic Differentiation <strong>of</strong> Scottish Salmon:Focusing Atlantic Salmon <strong>Management</strong> On Populations (FASMOP)Mark CoulsonRivers and <strong>Fisheries</strong> Trusts <strong>of</strong> Scotland5 th October 2012
FASMOP<strong>1.</strong> <strong>Defining</strong> stock structure2. Genetic assignment3. Hatchery contribution4. Farm vs. wild geneticinteractions
. . .24 <strong>Fisheries</strong> Trusts & Boards18,000 salmon genotypes750 sites300 riversPOPMODFASMOPSALSEAFASMOPGeneticcharacterisation<strong>of</strong> ScottishSalmonIndividual <strong>Fisheries</strong> Trusts
<strong>1.</strong> <strong>Defining</strong> <strong>Stock</strong> <strong>Structure</strong> – a matter <strong>of</strong> scaleSALSEA - Courtesy <strong>of</strong> J. Gilbey (MSS)• Differences between rivers?• Differences within individual rivers?• geography (e.g. lochs, falls, barriers, etc.)• life-history traits (e.g. run-timing)• environmental (pH, water temp., etc.)• others• Screen individuals for 17 genetic markers(‘microsatellites’)• Do the genetic variants differ between locations?
Cromarty FirthClyde<strong>Defining</strong> <strong>Stock</strong> <strong>Structure</strong>DeveronArgyllForthAyrshireGallowayNithOuter Hebrides
<strong>1.</strong> <strong>Defining</strong> <strong>Stock</strong> <strong>Structure</strong>To date, analyses have shown a wide breadth <strong>of</strong> results in theDegree <strong>of</strong> genetic differences within and among rivers across Scotland
<strong>1.</strong> <strong>Defining</strong> <strong>Stock</strong> <strong>Structure</strong>• SNP chip = 5,500 SNPs• ~30 samples/sitescreened• Spreadsheet with approx.1,900 rows and 5,500columns <strong>of</strong> data
Microsatellites vs. SNPsMicrosatellitesSNPs• High information per marker• Can screen 10s• Greater effort to standardize• Higher genotyping error rate• Assumed to be ‘neutral’• > 20 years experience• Low information per marker• Can screen 100s – 1000s• Easier standardization• Lower genotyping error rate• ‘neutral’ and ‘functional’• Developing technology…ACTTGGCAGTC...…ACTTGTCAGTC...
<strong>1.</strong> <strong>Defining</strong> <strong>Stock</strong> <strong>Structure</strong> - SNPs• up to 10x moredifferentiation• beginning to definestructure where nonecould be detectedwith other markers• rapidly improvingtechnology allowingfor more coverage <strong>of</strong>the genome• will be the way wecan identify geneticmarkes associatedwith particular traitsBUT,not there just yet!
<strong>1.</strong> <strong>Defining</strong> <strong>Stock</strong> <strong>Structure</strong>To date, analyses have shown a wide breadth <strong>of</strong> results in theDegree <strong>of</strong> genetic differences within and among rivers across Scotland
2. Genetic Assignment - Microsatellites
2. Genetic Assignment - Microsatellites
3. Hatchery contributionRiver SpeyHatcheryoperation123XXX123
Parentage assignment• Single genetic marker• Each parent passes on1 <strong>of</strong> their 2 copies• Offspring gets 1 copyfrom mother + 1 copyfrom fatherXPotential parents• Applied across multiplemarkers (17) makesmost ‘parents’ VERYunlikelyOffspring
The genetic markersMarkerNumber<strong>of</strong> variantsSP2201 35SP2210 13SPG7 26Ssa202 16SsaD144 38SsaD157 35SP1605 12SP1608 59SP2216 20Ssa171 27Ssa14 4Ssa289 9SP3016 18Ssa197 29SsaD48 66SsaD71 55SsaF43 12• Error rate in generating “geneticfingerprint” (< 1%)• Prob. <strong>of</strong> 2 individuals having samegenetic pr<strong>of</strong>ile ~ 3.5 x10 -32• Prob. <strong>of</strong> 2 FULL-SIBS havingsame genetic pr<strong>of</strong>ile ~ 5.5 x10 -9Colony (Owens & Wang 2009)
+16.3% in cities as compared with + 6.3% in nations.New Record Heights were reached in 2004: Commercial Bednights were up by 16.3% andInternational Bednights up by 19.4%.Low-cost carriers are drivers for growth.Trends in City Tourism:LARGEST OUTBOUND SOURCE MARKETS FOR EUROPEAN CITIES TOURISM IN 20041st: USA2nd: UK3rd: GERMANY(WHEREAS) THE FASTEST GROWING NATIONAL OUTBOUND SOURCE MARKET FOR ECTIN THE YEARS 1998-2004:SPAIN- GROWTH RATE OF 40.5%UK – GROWTH RATE OF 38.6%FRANCE – GROWTH RATE OF 26.2%ITALY AND GERMANY SHOWING STEADY RATEWEAKEST: USA, SWEDEN AND JAPANHIGHLIGHTS:CITY TOURISM ACCOUNTS FOR 38% SHARE OF TOTAL EUROPEAN OUTBOUND TRIPVOLUMES60% Leisure City Breaks17% Business Related23% Visits to Friends and RelativesCITIES ATTRACT A PROPORTIONALLY HIGHER NUMBER OF FOREIGN VISITORS TONATIONSHence, city tourism developed into major national export income generators (by calculating theVAT VALUE spent by foreign visitors)FACTORS AFFECTING FUTURE GROWTH OF EUROPEAN CITIES TOURISM:STRENGTHS:INCREASING TRANSPORT AVAILABILITY OF DIRECT LINKS:- Low Cost Carrier Phenomenon- High Speed Train Networks- Increasing Connections And Links Between ModesHIGHER EDUCATION RATES INCREASE DEMAND FOR TOURISM WITH CULTURE,HISTORY AND ART PROVIDED BY CITIESNEW CITY TRAVEL SERVICESCITY CARD, SPECIAL EVENTS, CULTURAL OFFERSKNOWLEDGE SHARING & COOPERATION PRACTICED BY ECT ENHANCES STANDARDSInternational Workshop Report 2006 Page 17 <strong>of</strong> 40
Assigning genetic parentageHatchery breeding recordsF1XM1F2XM2F3XM3F4XM4F5XM5Sample <strong>of</strong> potential <strong>of</strong>fspring(rod-catch)Sample <strong>of</strong> broodstock
Assigning genetic parentageSample <strong>of</strong> adult malesF1XM1F2XM2F3XM3F4XM4F5XM5Sample <strong>of</strong> juvenilesMORE TO COME!!!confirm withbreeding records!!!Sample <strong>of</strong> adult females
4. Farm-wild genetic interactionssamplefish farmConsiderations:-source <strong>of</strong> farmed fish?-baseline data for farmed fish?-detection <strong>of</strong> introgression?wildfarmedintrogressed
Proportion correctly assigned4. Farm-wild genetic interactions• Set <strong>of</strong> 60 SNPs distinguish between Norwegian wild & Norwegianfarmed fish• apply to Scotland - distinguish between Norwegian farmed and Scottishwild!!!12 farmed samples13 wild samplesNumber <strong>of</strong> SNPsKarlsson et al. (2011)
Baseline data – sample analysisNorwegian wildScottish wildNorwegian farmedScottish farm strain35 SNPs
Freshwater Farm escapes• Loch Shin• Loch Ness• Lochaber (Shlatach)• Each <strong>of</strong> these systemshad sampled putativedirect escapes (scales, findamage, etc.)• Genetic data consistentwith these samplesrepresenting farmedsalmon• What about mixedancestry?
Norwegian farm Scottish wild Lochaber Loch Ness
Sample siteFreshwater cages
Managing Interactions Project• Development <strong>of</strong> programme <strong>of</strong>sampling along aquaculturezone• Representative west coastsamples– ‘affected’ & ‘unaffected’ sites• Farms?• Screen with 70 geneticmarkers for farm vs. wildidentification• Individuals <strong>of</strong> mixed ancestry?
Where next with genetics?• <strong>Defining</strong> stock structure• Genetic assignment• Hatchery contribution• Farm-wild genetic interactions• Others• Markers associated with traits <strong>of</strong> interest?• Estimating population sizes?
AcknowledgmentsRAFTSCallum SinclairAndrew WallaceFASMOP Steering GroupLucy Webster (former)Anja Armstrong (former)Marine Scotland ScienceJohn GilbeyEef CauwelierLee StradmeyerIndividual <strong>Fisheries</strong> Trusts & BoardsCIGENE (Norway)Matthew KentSigbjørn LienFundingScottish GovernmentScottish Natural HeritageIndividual Trusts & BoardsFishmongers’ CompanyUHIEric Verspoor