
Create successful ePaper yourself
Turn your PDF publications into a flip-book with our unique Google optimized e-Paper software.
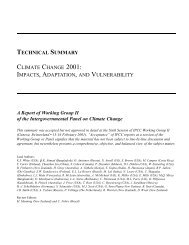
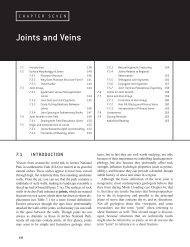
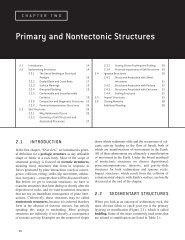
2917-CH10.pdf 11/20/03 5:13 PM Page 238C H A P T E R T E N<strong>Folds</strong> <strong>and</strong> <strong>Folding</strong>10.1 Introduction 23810.2 Anatomy of a Folded Surface 23910.2.1 Fold Facing: Antiform, Synform,Anticline, <strong>and</strong> Syncline 24110.3 Fold Classification 24310.3.1 Fold Orientation 24410.3.2 Fold Shape in Profile 24510.4 Fold Systems 24610.4.1 The Enveloping Surface 24710.4.2 Fold Symmetry <strong>and</strong> Fold Vergence 24810.5 Some Special Fold Geometries 25010.6 Superposed <strong>Folding</strong> 25210.6.1 The Principle of Fold Superposition 25210.6.2 Fold Interference Patterns 25410.6.3 Fold Style 25510.6.4 A Few Philosophical Points 25710.7 The Mechanics of <strong>Folding</strong> 25710.7.1 Passive <strong>Folding</strong> <strong>and</strong> Active <strong>Folding</strong> 25710.7.2 Buckle <strong>Folds</strong> 25910.7.3 Folded Multilayers 26210.8 Kinematic Models of <strong>Folding</strong> 26210.8.1 Flexural Slip/Flow <strong>Folding</strong> 26210.8.2 Neutral-Surface <strong>Folding</strong> 26310.8.3 Shear <strong>Folding</strong> 26410.8.4 Fold Shape Modification 26510.8.5 A Natural Example 26510.9 A Possible Sequence of Events 26610.10 Closing Remarks 267Additional Reading 26810.1 INTRODUCTIONAsk a structural geologist, or any other geologist forthat matter, about their favorite structure <strong>and</strong> chancesare that they will choose folds. If you have seen a foldin the field you will have marveled at its appearance(Figure 10.1). Let’s face it, it is pretty unbelievable thathard rocks are able to change shape in such a dramaticway. In simple terms, a fold is a structural feature thatis formed when planar surfaces are bent or curved. Ifsuch surfaces (like bedding, cleavage, inclusions) arenot available you will not see a fold even thoughthe rock was deformed. <strong>Folding</strong> is a manifestation ofductile deformation because it can develop withoutfracturing, <strong>and</strong> the deformation is (heterogeneously)distributed over the entire structure. Rather than fracturing,processes such as grain sliding, kinking, dissolution,<strong>and</strong> crystal plasticity dominate. Looking at afold from a kinematic perspective, you realize thatstrain in this structure cannot be the same everywhere.We recognize distinct segments in a fold, such as thehinge area <strong>and</strong> the limbs, the inner <strong>and</strong> the outer arc,each of which reflect different strain histories, regardlessof scale.Why do folds exist, how do rocks do it, <strong>and</strong> whatdoes folding mean for regional analysis? These <strong>and</strong>other questions were first asked quite some time ago<strong>and</strong> much of what we know today about folds <strong>and</strong> foldingwas well established before the 1980s. The geometryof folds tells us something about, for example, thedegree <strong>and</strong> orientation of strain, which in turn providescritical information about the deformation history of aregion. Much of the work in recent years representsrefinements of some of the earlier work; we can applyincreasingly sophisticated numerical <strong>and</strong> experimentalapproaches. Yet, the fundamental observations remainessentially intact. Therefore, in this chapter we willmainly look at some of the first principles of folding238
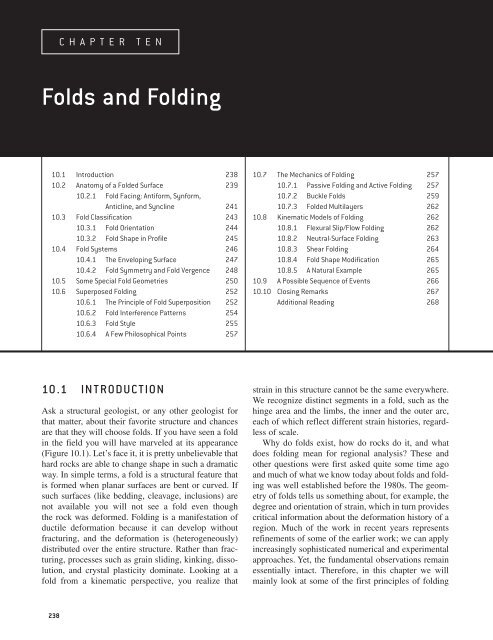
2917-CH10.pdf 11/20/03 5:13 PM Page 239FIGURE 10.1 Large-scale recumbent fold in the Caledonides of northeast Greenl<strong>and</strong>. Theheight of the cliff is about 800 m <strong>and</strong> the view is to the Northwest. (Kildedalen)<strong>and</strong> their application to structural analysis. First, however,we discuss the basic vocabulary needed to communicateabout folds <strong>and</strong> fold systems.HingeareaHingeline10.2 ANATOMY OF A FOLDEDSURFACEThe schematic illustration in Figure 10.2 shows thebasic geometric elements of a fold. The hinge area isthe region of greatest curvature <strong>and</strong> separates the twolimbs. The line of greatest curvature in a folded surfaceis called the hinge line. You may think of a limb as theless curved portion of a fold. In a limb there is a pointwhere the sense of curvature changes, called theinflection point. <strong>Folds</strong> with a straight hinge line (Figure10.3a) are called cylindrical folds when the foldedProfileplaneFIGURE 10.2Fold axisThe terminology of a fold.InflectionpointAxial surface10.2 ANATOMY OF A FOLDED SURFACE239
2917-CH10.pdf 11/20/03 5:13 PM Page 240(a)FIGURE 10.3 A cylindrical fold (a) is characterized by a straight hinge line <strong>and</strong> anoncylindrical fold (b) by a curved hinge line. The axial surface may be planar, as in (a) <strong>and</strong> (b), orcurved (c).(b)(c)surface can wrap partway around a cylinder. If this isnot the case <strong>and</strong> the hinge line curves, the folds arecalled noncylindrical (Figure 10.3b). In reality the lateralextent of cylindrical folds is restricted to the outcropscale or even less, because over greater distancesthe hinge line of folds typically curves. Neverthelessyou will find that we may conveniently treat naturalfolds as cylindrical by dividing them into segmentswith straight hinge lines.A cylindrical surface consists of an infinite numberof lines that are parallel to a generator line. This generatorline is called the fold axis, which, when movedparallel to itself through space, outlines the folded surface.In the case of cylindrical folds the fold axis is ofcourse parallel to the hinge line. 1 The topographicallyhighest <strong>and</strong> lowest points of a fold are called the crest<strong>and</strong> trough, respectively, <strong>and</strong> these do not necessarilycoincide with hinge lines. The surface containing thehinge lines from consecutive folded surfaces in a foldis the axial surface (Figures 10.2 <strong>and</strong> 10.3). The termaxial plane is loosely used by some, but the surface isnot necessarily planar as seen in Figure 10.3c (recallthe distinction between surface <strong>and</strong> plane). Moreover,the axial surface does not necessarily divide the foldinto equal halves that are mirror images of one another.The reference plane used to describe fold shape iscalled the fold profile plane, which is perpendicular tothe hinge line (Figure 10.2). Note that the profile planeis not the same as a cross section through the fold,which is any vertical plane through a body, much likethe sides of a slice of layered cake. If the hinge line isnot horizontal, then the profile plane is not parallel to1 Sometimes fold axis is used as a synonym for hinge line, but this is notcorrect.lL aρ2aL wρlL w /2FIGURE 10.4 The interlimb angle (ρ), the wavelength(L w ), the amplitude (a), <strong>and</strong> the arc length (L a ) of a fold systemin profile.the cross-sectional plane, which has implication for thefold geometry description.The angle between fold limbs as measured in the profileplane is called the interlimb angle (Figure 10.4).Intuitively you realize that the interlimb angle offers aqualitative estimate of the intensity of folding; thesmaller the interlimb angle, the greater the intensity offolding. Finally, we recognize the amplitude, wavelength,<strong>and</strong> arc length of a fold in profile. These termsare used in the same manner as they are in wavephysics, because folds tend to look a bit like harmonicfunctions (such as a sine curve). The wavelength isdefined as the distance between two hinges of the sameorientation, while the arc length is this distance measuredover the folded surface; the amplitude is half theheight of the structure measured from crest to trough(Figure 10.4). These <strong>and</strong> other terms associated withfolds are summarized in Table 10.1.When successive layers in a folded stack haveapproximately the same wavelength <strong>and</strong> amplitude, theal240 FOLDS AND FOLDING
2917-CH10.pdf 11/20/03 5:13 PM Page 241TABLE 10.1VOCABULARY OF A FOLDAmplitudeArc lengthAxial surfaceCrestCross sectionCulminationCylindrical foldDepressionFold axisHingeHinge lineInflection pointLimbNoncylindrical foldProfile planeTroughWavelengthHalf the height of the structure measured from crest to troughThe distance between two hinges of the same orientation measured over the folded surfaceThe surface containing the hinge lines from consecutive folded surfacesThe topographically highest point of a fold, which need not coincide with the fold hingeA vertical plane through a foldHigh point of the hinge line in a noncylindrical foldFold in which a straight hinge line parallels the fold axis; in other words, the folded surface wrapspartway around a cylinderLow point of the hinge line in a noncylindrical foldFold generator in cylindrical foldsThe region of greatest curvature in a foldThe line of greatest curvatureThe position in a limb where the sense of curvature changesLess curved portion of a foldFold with a curved hinge lineThe surface perpendicular to the hinge lineThe topographically lowest point of a fold, which need not coincide with the fold hingeThe distance between two hinges of the same orientationfolds are called harmonic. If some layers have differentwavelengths <strong>and</strong>/or amplitudes, the folds aredisharmonic (Figure 10.5). In extreme circumstances,a series of folded layers may be totally decoupled fromunfolded layers above or below. When this happens, adetachment horizon exists between folded <strong>and</strong>unfolded layers.10.2.1 Fold Facing: Antiform, Synform,Anticline, <strong>and</strong> SynclineTake a deep breath. We have already sprung a sizablearray of terms on you, but before we explore the significanceof folding, we have yet to add a few more.Maybe you will find comfort in the knowledge thatgenerations of students before you have plowed theirway through this terminology, happily discovering thatin the end it really is important for the description <strong>and</strong>interpretation of regional deformation. Having saidthis, now draw a fold on a piece of paper. Chances arethat you place the hinge area at the top of the structure,outlining something like a sharp mountain. In fact, apsychological study among geologists found thisinvariably to be true (just look at your neighbor’ssketch). 2 This particular fold geometry is called anantiform. The opposite geometry, when the hingezone is at the bottom (outlining a valley), is called asynform. The explanation for the modifiers “anti” <strong>and</strong>“syn” is that the limbs dip away from or toward thecenter of the fold, respectively. You will find that manygeologists use the terms anticline <strong>and</strong> syncline as synonymsfor antiform <strong>and</strong> synform, but this is incorrect.The terms anticline <strong>and</strong> syncline imply that the stratigraphicyounging direction in the folded beds isknown. This is an important distinction for regionalanalysis, so let’s look at this in some detail.Imagine a sequence of beds that is laid down in abasin over a period of many millions of years. Obviously,the youngest bed lies at the top while the oldestbed is at the bottom of the pile (this is Steno’s Law ofSuperposition). When we fold this sequence into a2 This is not (yet) linked to any criminal behavior.10.2 ANATOMY OF A FOLDED SURFACE241
2917-CH10.pdf 11/20/03 5:13 PM Page 242FIGURE 10.5 Small-scale disharmonic folds in anhydrite of the Permian Castile Formation inthe Delaware Basin of Texas. White layers are anhydrite; dark layers consist of calcite that is rich inorganic material (hence the dark color). Note that detachments occur in the organic-rich calcitelayers <strong>and</strong> that the fold shapes (including box folds) in the anhydrite vary as a function of layerthickness.242 FOLDS AND FOLDING
2917-CH10.pdf 11/20/03 5:13 PM Page 243O(a)Y(c)OYYOY(b)O(d)cleavage, axial planar to second foldsgraded bed indicating “way up”facing direction(e)structures upward-facing folds. Now turn theoriginal sequence upside down: the oldest bednow lies at the top <strong>and</strong> the youngest bed at thebottom (Figure 10.6c <strong>and</strong> 10.6d). While we generatethe same geometry of antiforms <strong>and</strong> synforms,the younging direction is opposite to whatwe had before. In this antiform, the beds youngtoward the core, while in the synform thebeds young away from the core. Both cases aredownward-facing folds, <strong>and</strong> an antiform withthis younging characteristic is therefore called adownward-facing antiform; analogously, we recognizea downward-facing synform. 3 Rememberthat when you find downward-facing folds in thefield, you immediately know that some secondaryprocess has inverted the normal stratigraphicsequence; that is, we cannot violate the Law ofSuperposition. Downward-facing folds are not asuncommon as one might guess. They are typicallyfound in areas containing an early “generation”of regional folds with horizontal axial surfaces,which are quite common in collisionalmountain belts. Subsequent folding of these earlystructures generates a series of upward- <strong>and</strong>downward-facing folds, as shown in Figure10.6e. But we must not get ahead of ourselves;the principle of superposed folding isdiscussed in a later section of this chapter.DownwardfacingUpwardfacingDownwardfacingUpwardfacing10.3 FOLD CLASSIFICATION(f)FIGURE 10.6 Antiforms, synforms, <strong>and</strong> fold facing. An upwardfacingantiform (a) is also called an anticline <strong>and</strong> an upward-facingsynform (b) is called a syncline. Downward-facing antiforms (c) <strong>and</strong>downward-facing synforms reflect an early history that placed the bedsupside down prior to folding. These forms may occur in a regioncontaining two generations of folding (e). The corresponding facing inmap view across this area is shown in (f). Younging direction isindicated by O → Y arrow.Now that we have established a basic vocabularywe can further classify folds. The classification offolds is based on four components:1. Fold shape in three dimensions, primarilydistinguishing between cylindrical folds<strong>and</strong> noncylindrical folds (Figure 10.3).2. Fold facing, separating upward-facing folds<strong>and</strong> downward-facing folds (Figure 10.6).3. Fold orientation.4. Fold shape in the profile plane.series of antiforms <strong>and</strong> synforms, we see that the oldestbed lies in the core of the antiform <strong>and</strong> the youngestbed lies in the core of the synform (Figure 10.6a <strong>and</strong>10.6b). Under these circumstances we call them anticlines<strong>and</strong> synclines, respectively. In an anticline thebeds young away from the core; in a syncline the bedsyoung toward the core. In both cases the youngingdirection points (or faces) upward, so we call theseThe first two components, three-dimensional foldshape <strong>and</strong> fold facing, have already been introduced(Figures 10.3 <strong>and</strong> 10.6, respectively). In this section3 The antiform <strong>and</strong> synform have the younging characteristics of a syncline<strong>and</strong> anticline, respectively, <strong>and</strong> are therefore also called antiformal syncline<strong>and</strong> synformal anticline, respectively.10.3 FOLD CLASSIFICATION243
2917-CH10.pdf 11/20/03 5:14 PM Page 244FIGURE 10.7An asymmetric, plunging fold (the Sheep Mountain Anticline in Wyoming, USA).we concentrate on the other two components of foldclassification: fold orientation <strong>and</strong> fold shape.10.3.1 Fold OrientationLooking at the curved surface of a natural fold makesone wonder if there is any one representative measurementfor the structure (Figure 10.7). Taking your compassto the folded surface will give you a large numberof different readings for dip, <strong>and</strong> dip <strong>and</strong> strike (or dipdirection) if the fold is noncylindrical. In folds withlimbs that are relatively straight, you will find that all themeasurements in a single limb are pretty much alike(Figure 10.8), but in folds with curving limbs this willnot be the case. So what do we measure if we want togive the orientation of a fold to another geologist? Thefirst measurement we take is the orientation of the hingeline (Figure 10.9). On the scale of an outcrop the hingeline is typically fairly straight, <strong>and</strong> we determine itsplunge (say, 20°) <strong>and</strong> direction of plunge (say, 190°).We now say that the fold is shallowly plunging to theSouth. Secondly, we measure the orientation of the axialsurface. We measure a dip direction/dip of 270°/70° forthe axial surface, which completes our description of thefold: a shallowly south-plunging, upright fold. Rememberthat the hinge line always lies in the axial surface.Test your measurements in a spherical projection to seewhether this relationship holds. What constrains termslike shallow <strong>and</strong> upright? As a practical convention weuse the angular ranges shown in Table 10.2.In Figure 10.10 we show some representative combinationsof hinge line <strong>and</strong> axial surface orientationswith their terminology. A fold with a horizontal axialsurface by definition must have a horizontal hinge line,<strong>and</strong> is called a recumbent fold (Figure 10.1). In theEuropean Alps, for example, large-scale recumbent244 FOLDS AND FOLDING
2917-CH10.pdf 11/20/03 5:14 PM Page 245FIGURE 10.8Chevron folds in Franciscan chert of California, USA (Marin County).NTABLE 10.2FOLD CLASSIFICATIONBY ORIENTATIONAxial surfaceHingelineFIGURE 10.9 Fold orientation. Note that the axial surfaceis a plane whose orientation is given by dip <strong>and</strong> strike (or dipdirection), whereas the hinge is a line whose orientation isgiven by plunge <strong>and</strong> bearing.folds are often associated with thrust faulting, <strong>and</strong> theyare called nappes (see Figure 9.1). A term that is usedfor a steeply plunging, inclined fold is a reclined fold.In all cases remember that your field measurementswill be no more accurate than ±2° (compass accuracy),but that the feature you measure will probably varyover an even greater angle of ±5°–10°. Thus, the valuesin Table 10.2 serve as a guide <strong>and</strong> should not beapplied too strictly; they are not carved in stone.Plunge of Hinge LineDip of Axial SurfaceHorizontal: 0°–10° Recumbent: 0°–10°Shallow: 10°–30° Inclined: 10°–70°Intermediate: 30°–60° Upright: 70°–90°Steep: 60°–80°Vertical: 80°–90°10.3.2 Fold Shape in ProfileThe profile plane of a fold is defined as the plane perpendicularto the hinge line (Figure 10.2). The foldshape in profile (as viewed, by convention, down theplunge) allows further classification of folds. Becausethe profile plane is perpendicular to the hinge line, weneed not concern ourselves with the orientation of thefold. Fold shape in profile describes the interlimbangle <strong>and</strong> any changes in bed thickness. The interlimb10.3 FOLD CLASSIFICATION245
2917-CH10.pdf 11/20/03 5:14 PM Page 246VerticalTABLE 10.3FOLD CLASSIFICATIONBY INTERLIMB ANGLEUpright plungingUpright horizontalIsoclinal 0°–10°Tight 10°–60°Open 60°–120°Gentle 120°–180°Inclined plungingReclinedInclined horizontalRecumbentFIGURE 10.10 Fold classification based on theorientation of the hinge line <strong>and</strong> the axial surface (shaded).angle of a fold is the angle between the limbs. Weassume that the limbs are relatively planar or we usethe tangent at the inflection points (Figure 10.4). Thevalues corresponding to the various terms are listed inTable 10.3. As with those in Table 10.2, they serve onlyas a rough guide.The second characteristic of fold shape in profile isany change in bed thickness across the structure. If youlook at Figure 10.11a, you will notice that the bedthickness does not change appreciably as we go fromone limb of the fold to the other. In contrast, the fold inFigure 10.11b has thin limbs <strong>and</strong> a relatively thickhinge area. We quantify these observations by using amethod called dip-isogon analysis. Dip isogons connectpoints on the upper <strong>and</strong> lower boundary of afolded layer where the layers have the same dip relativeto a reference frame (Figure 10.12). The constructionmethod is explained step by step in all structuralgeology laboratory manuals, to which you arereferred. 4 Three classes are recognized: convergentdip isogons (Class 1), parallel dip isogons (Class 2),<strong>and</strong> divergent dip isogons (Class 3). The terms “convergence”<strong>and</strong> “divergence” are used with respect tothe core of the fold; 5 when the dip isogons intersect ina point in the core of the fold, the fold is called con-4 Graphically, the dip isogon classification plots angle α versus normalizeddistance between the two tangents defining a dip isogon.5The same terminology returns with cleavage (Chapter 12).vergent, <strong>and</strong> vice versa. The two geometries shown inFigure 10.11 are special cases. Dip isogons that areperpendicular to bedding throughout the fold define aparallel fold, whereas dip isogons that are parallel toeach other characterize a similar fold. This terminology(especially the use of “parallel”) may be confusing,but remember that parallel <strong>and</strong> similar describe thegeometric relationship between the top <strong>and</strong> bottomsurfaces of a folded layer; they do not describe therelationship between individual dip isogons in a fold.Parallel <strong>and</strong> similar folds anchor the finer fivefold subdivisionthat is used mainly for detailed description. Inthe field, loosely using the terms similar (representingClass 2 <strong>and</strong> 3) <strong>and</strong> parallel (representing Class 1A, 1B,<strong>and</strong> 1C) is usually sufficient to describe the fold shapein profile.So we added two more components to our descriptionof a fold. Now as a test, sketch a shallowly plunging,upright, tight, similar, downward-facing synformin the margin of the text. Hopefully these terms havebecome sufficiently clear that the task, unlike itsdescription, is relatively simple. The only parameterwe have excluded in our classification is fold size. Tospecify this we can use terms like microfold (microscopicsize; up to millimeter scale), mesofold (h<strong>and</strong>specimen to small outcrop size; centimeter to meterscale), <strong>and</strong> macrofold (mountain size <strong>and</strong> larger; hundredsto thous<strong>and</strong>s of meters). Although the lengthydescription above is certainly not pretty, it ends upbeing very informative <strong>and</strong> complete. Remember thatthe goal of any good description is first to recall thecharacteristics for yourself, <strong>and</strong> secondly to relay thisinformation in an underst<strong>and</strong>able <strong>and</strong> unequivocalfashion to someone else.10.4 FOLD SYSTEMSOur treatment of folds so far has concentrated mostlyon single antiforms <strong>and</strong> synforms. When we have aseries of antiforms <strong>and</strong> synforms, we call this a fold246 FOLDS AND FOLDING
2917-CH10.pdf 11/20/03 5:14 PM Page 247FIGURE 10.11 Parallel folds (a)maintain a constant layer thicknessacross the folded surface, meaning,t 1t t 1 = t 2 = t 3 , but the layer thickness2t 1 T 1t 2 T 2t 3T 3(a)t 3T 1T 2T 3(b)parallel to the axial surface varies(T 1 < T 2 < T 3 ). Note that parallelism musteventually break down in the cores offolds because of space limitation, whichis illustrated by the small disharmonicfolds in (a). In similar folds (b), the layerthickness parallel to the axial surfaceremains constant, so, T 1 = T 2 = T 3 , but thethickness across the folded surfacevaries (t 1 > t 2 > t 3 ). Similar folds do notproduce the space problem inherent inparallel folds.0α3050α6070(a) Class 1A (b) Class 1B (parallel) (c) Class 1C(d) Class 2 (similar) (e) Class 3FIGURE 10.12 Fold classificationbased on dip isogon analysis. In Class 1A(a) the construction of a single dipisogon is shown, which connects thetangents to the upper <strong>and</strong> lowerboundary of the folded layer with equalangle (α) relative to a reference frame;dip isogons at 10° intervals are shownfor each class. Class 1 folds (a–c) haveconvergent dip isogon patterns; dipisogons in Class 2 folds (d) are parallel;Class 3 folds (e) have divergent dipisogon patterns. In this classification,parallel (b) <strong>and</strong> similar (d) folds arelabeled as Class 1B <strong>and</strong> Class 2,respectively.system. The information we can obtain from fold systemsprovides some of the most powerful informationfor the interpretation of regional structure, <strong>and</strong>involves such elements as fold symmetry, fold vergence,<strong>and</strong> the enveloping surface. We start with thelast of these.10.4.1 The Enveloping SurfaceDraw an imaginary plane that is tangential to the hingezones of a series of small folds in a layer (surface A,Figure 10.13). We call this surface the enveloping surface.It contains all the antiformal or synformal hinges. 6Figure 10.13 also shows that we can draw an additionalenveloping surface (surface B) when we connect the6 In the case of folds with horizontal or shallowly dipping axial surfaces, werefer to these as crests <strong>and</strong> troughs, respectively.hinges of the curved enveloping surface A. We call theenveloping surface for the largest folds the first-orderenveloping surface (here surface B). The envelopingsurfaces of successively smaller structures have ahigher order (second-order enveloping surface, thirdorderenveloping surface, <strong>and</strong> so on). The first-orderenveloping surface is typically of regional scale, whilehigher-order enveloping surfaces may go down as lowas the thin-section scale. But what is the point of determiningthe enveloping surface? With decreasing order,the enveloping surfaces reduce the structural informationof a folded area into increasingly simple patterns.For example, the second-order enveloping surface inFigure 10.13 shows that the small-scale folds define alarger-scale fold pattern consisting of antiforms <strong>and</strong>synforms. These large-scale structures have also beendesignated by the terms anticlinorium <strong>and</strong> synclinorium,respectively. Unfortunately the use of theseterms suggests upward-facing structures, which is not10.4 FOLD SYSTEMS247
2917-CH10.pdf 11/20/03 5:14 PM Page 248always intended. The presence of anticlinoria<strong>and</strong> synclinoria implies that many smallfolds are somehow related, even thoughthey vary in shape <strong>and</strong> position in the largerstructure. It is important to realize that theorientations of these small folds (both hingeline <strong>and</strong> axial surface) are often the same,<strong>and</strong> also that these parameters approximatelyparallel that of the anticlinorium <strong>and</strong>synclinorium. For that reason, these smallfolds are sometimes called parasitic folds,because they are related to a larger structure.The geometric relationship between parasiticfolds <strong>and</strong> regional structures offers apowerful concept in structural analysis,which states that the orientation of small(high-order) structures is representative ofthe orientation of regional (low-order) structures.7 Thus, the orientations of the hinge line<strong>and</strong> the axial surface of a small fold can predictthese elements for a large regional foldthat is otherwise not exposed; in Figure 10.13Axialsurfaceyou indeed see that this is the case. Obviously, this“rule” serves only as a convenient working hypothesis,but it has proven to be very robust in regional mapping.Use this rule on a field trip <strong>and</strong> surprise friend <strong>and</strong> foewith your quick insight into regional structure.10.4.2 Fold Symmetry <strong>and</strong> Fold Vergence7 This is otherwise known as Pumpelly’s Rule, after the nineteenth-centuryAmerican geologist Raphael Pumpelly.NEnvelopingsurface BHinge lineEnvelopingsurface AFIGURE 10.13 The enveloping surface connects the antiform (orsynform) hinges of consecutive folds (surface A). If this imaginary surfaceappears to be folded itself, we may construct yet a higher-order envelopingsurface (surface B). Note that the orientations (hinge line <strong>and</strong> axial surface) ofthe small folds <strong>and</strong> the large-scale folds are very similar.The relationship between the enveloping surface <strong>and</strong>the axial surface of folds also enables us to describethe symmetry of folds. If the enveloping surface <strong>and</strong>the axial surface are approximately perpendicular(±10°), we have symmetric folds (Figure 10.14a); otherwisethe folds are asymmetric (Figure 10.14b). Inthe case of an isolated fold, an enveloping surface cannotbe defined. To determine if a fold is symmetric orasymmetric we use the median surface, which is thesurface that passes through the inflection points ofopposing limbs. If the axial surface is perpendicular tothe median surface, then the fold is symmetric; otherwisethe fold is asymmetric. There are other definitionsof fold symmetry that involve, for example, the relativesteepness of limbs, but these descriptions of fold symmetryare often ambiguous <strong>and</strong> should not be used.Now let’s look at a practical application of foldsymmetry. The second-order enveloping surfacedefined by the small folds of Figure 10.13 outlines alarge antiform-synform pair. The small folds (the parasiticfolds) show characteristic shapes <strong>and</strong> asymmetriesas we move along the second-order enveloping surface.On the west limb of the large antiform, the minor foldsare asymmetric <strong>and</strong> have what we call a clockwiseasymmetry when looking down the plunge of the fold.In the hinge area, the folds are symmetrical, becausethe axial surface is perpendicular to the enveloping surface.In fact, as we move from the limb toward thehinge area, the clockwise asymmetry becomes progressivelyless, until the fold is symmetrical. As we moveinto the east limb of the antiform, the fold asymmetryreturns, but now with the opposite sense to that in thewest limb; in the east limb the asymmetry is counterclockwise.Note that clockwise <strong>and</strong> counterclockwiseAxial surface(a)EnvelopingsurfaceMedian surface(b)FIGURE 10.14 Symmetric (a) <strong>and</strong> asymmetric folds(b) are defined by the angular relationship between the axialsurface <strong>and</strong> the enveloping surface.248 FOLDS AND FOLDING
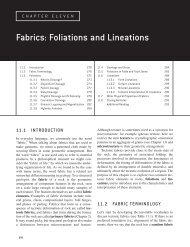
2917-CH10.pdf 11/20/03 5:14 PM Page 249are defined by the rotation ofthe axial surface relative to ahypothetical symmetricalfold (Figure 10.15). In thepast, parasitic folds wereerroneously given the geneticname “drag folds,” because itwas assumed that the apparentrotation of the axial surfacesreflects drag betweenthe layers during folding.Rather, these minor folds areprobably symmetrical in theincipient stages of regionalfolding <strong>and</strong> become moreasymmetrical when the largefolds tighten. So, across alarge fold the vergence 8 ofparasitic folds changes in acharacteristic manner thatAxial surfaceallows us to predict the location of the hinge area oflarge antiforms <strong>and</strong> synforms (Figure 10.16). Usingparasitic folds, we may even predict the orientation ofthese large regional folds (see previous section).There is need for some caution when folds are notplunging; that is, in horizontal upright folds wheredown-plunge observations cannot be defined. If weview the structure in Figure 10.16 from the oppositeside, the clockwise folds become counterclockwise(just hold the page with Figure 10.16 facing the light,viewing it from the back)! This situation is not as confusingas it seems at first. Imagine an antiform that iscut by a road perpendicular to the axial surface. Theasymmetry of parasitic folds in this large structureappears clockwise or counterclockwise on oppositesides of the road. However, in both cases they make thesame prediction for the location of the hinge area. Aslong as you define the direction in which you view theminor structure, there is no problem using fold vergenceas a mapping tool in an area. A practical tip is tocopy the geometry of Figure 10.16 into the back ofyour field notebook. Matching field observation withasymmetries in your sketch, which may require somerotation of your notebook, will ensure a reliable applicationof this mapping tool. In any case, rememberthat a pattern of fold vergence opposite to that in Figure10.16 (a “Christmas-tree” geometry) cannot be8 Do not confuse fold vergence with fold facing.9 In fact, this geometry is diagnostic of the presence of at least two foldgenerations.Enveloping surfaceFIGURE 10.15 Fold vergence, clockwise (a) <strong>and</strong> counterclockwise (b), is defined by theapparent rotation of the axial surface from a hypothetical symmetric fold into the observedasymmetric fold, without changing the orientation of the enveloping surface. In a givengeographic coordinate system we may also say east-verging (a) <strong>and</strong> west-verging (b) folds forclockwise <strong>and</strong> counterclockwise folds, respectively (for this example). In all descriptions we arelooking down the plunge of the fold.WClockwise (Z )WWAxial surfaceSymmetrical (M )(a)(b)Enveloping surfaceEEECounterclockwise (S )FIGURE 10.16 Characteristic fold vergence of parasiticfolds across a large-scale antiform. Looking down the plunge,the parasitic fold changes from clockwise asymmetry (eastvergingin the geographic coordinate system) to symmetric tocounterclockwise asymmetry (west-verging) when going fromW to E. You may also find that some geologists use the terms Z-,M-, <strong>and</strong> S-folds for this progression (for obvious reasons)."Yes""No"FIGURE 10.17 Right <strong>and</strong> wrong in fold vergence. It isuseful to copy the images in Figures 10.16 <strong>and</strong> 10.17 in yourfield notebook for reference.produced in a single fold generation (Figure 10.17). 9 24910.4 FOLD SYSTEMS
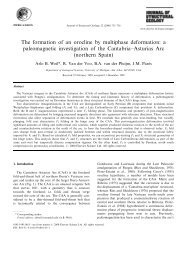
2917-CH10.pdf 11/20/03 5:14 PM Page 250FIGURE 10.18Monocline in the Big Horn Mountains (Wyoming, USA).10.5 SOME SPECIAL FOLDGEOMETRIESWe end the descriptive part of this chapter with a fewspecial fold geometries that you may encounter in yourfield career. Monoclines are fold structures with onlyone tilted limb; the beds on either side of the tilted limbare horizontal. Monoclines typically result from a verticaloffset in the subsurface near the tilted portion of thestructure. The fault uplifts a block of relatively rigidigneous or metamorphic rock, <strong>and</strong> the overlying sedimentarylayers drape over the edge of the uplifted blockto form the monocline (Figure 10.18). Spectacular examplesare found in the Colorado Plateau of the westernUnited States. Kink folds are small folds (less than ameter) that are characterized by straight limbs <strong>and</strong> sharphinges. Typically they occur in finely laminated (that is,strongly anisotropic) rocks, such as shales <strong>and</strong> slates(Figure 10.19). Sharply bending a deck of cards is a goodanalogy for the kinking process, because kink folds areformed by displacements between individual laminae(individual cards in the analogy). Chevron folds (Figure10.8) are the larger-scale equivalent of kink folds.The term box fold describes a geometry that is prettyself-explanatory (Figure 10.5). In order for a box fold toform, a layer must be detached from the underlying <strong>and</strong>overlying layers. They are therefore common in areaswith weak basal layers, such as in the Jura Mountains ofSwitzerl<strong>and</strong>. Ptygmatic folds are irregular <strong>and</strong> isolatedFIGURE 10.19 Kink folds in mica-rich portion ofgreywackes of the Cantabrian Mountains (northern Spain).250 FOLDS AND FOLDING
2917-CH10.pdf 11/20/03 5:14 PM Page 251FIGURE 10.20 Ptygmatic folds in the Grenville Supergroup (Ontario, Canada); hammer forscale. Note the wavelength variation as a function of layer thickness.fold structures that typically occur as tightly foldedveins or thin layers of strongly contrasting lithology(<strong>and</strong>, thus, contrasting competency; Figure 10.20). Mostmetamorphic regions around the world contain ptygmaticfolds, which, unglamorously, resemble intestines.Doubly plunging folds are structures with hinge linesthat laterally change curvature. Along the trend of plungethe folds may die out or even change from antiforms tosynforms. The high point of the hinge line in a doublyplunging fold is called the culmination <strong>and</strong> the lowpoint along the same hinge line is called a depression.The change in plunge angle is normally less than 50°.When additional folds are present, changes in plungemay result in en echelon folds, in which a graduallyopening fold is replaced by a neighboring, graduallytightening fold of opposite form. Such a geometry occurson all scales, from h<strong>and</strong> specimens (Figure 10.21) to thesize of mountain ranges (such as the Valley-<strong>and</strong>-Ridge ofthe central Appalachians). Note that doubly plungingfolds are, by definition, noncylindrical. Sheath folds 10show extreme hinge line curvature, to the extent thathinge line curvature approaches parallelism (change inplunge up to 180°!). What is typically found in outcropis the elliptical cross section of the nose of the fold (seeFigure 12.28); however, such a pattern itself does notnecessarily imply a section through a sheath fold. Anydoubly plunging fold may give the same outcrop pattern,but only when a highly curved hinge line is visible can10 They resemble the sheath of a sword; the more imaginative term is condomfold.FIGURE 10.21 En echelon folds on the scale ofcentimeters; coin for scale.10.5 SOME SPECIAL FOLD GEOMETRIES251
2917-CH10.pdf 11/20/03 5:14 PM Page 252sheath folds be recognized as such. Sheath folds are producedby taking a mildly doubly plunging fold <strong>and</strong>“pulling” at its crest, as occurs in zones of high shearstrain. We return to the formation <strong>and</strong> significance ofthese structures in Chapter 12, which deals with ductileshear zones.Finally, two additional fold types have been studiedextensively in recent years because of their associationwith hydrocarbon potential in fold-thrust belts,namely, fault-bend folds <strong>and</strong> fault-propagation folds.Because of their intimate association with thrusting,we further examine their formation <strong>and</strong> significance inChapter 18 (“Fold-Thrust Belts”). At this point wemerely include them for completeness: fault-bendfolds are formed as thrust sheets move over irregularitiesin the thrust plane (such as ramps), whereas faultpropagationfolds are accommodation structuresabove the frontal tip of a thrust.10.6 SUPERPOSED FOLDINGStructural geologists use the term fold generation torefer to groups of folds that formed at approximatelythe same time interval <strong>and</strong> under similar kinematicconditions. Commonly we find several fold generationsin an area, which are labeled by the letter F (forFold) <strong>and</strong> a number reflecting the relative order oftheir formation: F 1 folds form first, followed by F 2folds, F 3 folds, <strong>and</strong> so on. Several fold generationsmay in turn form during an orogenic phase (such asthe Siluro-Devonian “Acadian” phase in theAppalachians or the Cretaceous-Tertiary “Laramide”phase in the North American Cordillera), which isnoted by the letter D (for Deformation). In any mountainbelt several phases may be present, which arelabeled D 1 , D 2 , <strong>and</strong> so on, each containing one ormore generations of folds. For example, theAppalachian Orogeny of the eastern United Statescontains three main deformation phases (Taconic,Acadian, <strong>and</strong> Alleghenian). From the onset it isimportant to realize that neither a deformation phasenor each of the individual fold generations have to bepresent everywhere along the orogen, nor do theyoccur everywhere at the same time. On a regionalscale deformation is irregularly distributed <strong>and</strong> commonlydiachronous. You can imagine that fold generations<strong>and</strong> deformation phase can rapidly becomepretty complex. So we’ll stick to two fold generationsto examine the principles of superposed folding,which allows us to unravel the sequence (that is, relativetiming) of folding.Generation is a relative time concept <strong>and</strong> onlyimplies “older than” or “younger than”; you are theyounger generation in the eyes of your parents. Thereare methods to determine the absolute ages of folds,such as dating of minerals that formed during folding,but we will not get into them here. The relative timeprinciple of superposed folding 11 is simple: folds of alater generation are superimposed on folds of an earliergeneration. The determination of this temporalsequence, however, is not straightforward <strong>and</strong> requirescareful spatial analysis. Superposed folding is a widespreadphenomenon that is not restricted to high-grademetamorphic areas. Even in regions below the greenschistfacies (temperatures below ∼300°C), superposedfolding is found. It is worthwhile therefore togive attention to this topic, after which we close thissection with the concept of fold style that is used toplace our findings on fold generations in a regionalcontext.10.6.1 The Principle of Fold SuperpositionFigure 10.22 shows a field photograph of a complexfold geometry that contains two fold generations. Howdo we know this from looking at the picture <strong>and</strong> howcan we separate F 1 <strong>and</strong> F 2 folds in this pattern? <strong>Folds</strong>uperposition is simple at its root, but the conceptrequires the ability to visualize <strong>and</strong> analyze sometimesvery complex three-dimensional geometries. Let usfirst start with the rule: a superposed fold must beyounger than the structure it folds. This merelyrestates the Law of Superposition such that it applies tofolding. Unless a fold was present previously, it cannotbe modified by a younger fold. How do we determinethe criteria by which one obtains this temporal relationship?We begin with an example.Figure 10.23a shows a sequence of recumbent foldsthat we will call F A ; the associated axial surface iscalled S A . We now superimpose a series of uprightfolds of approximately the same scale (F B with axialsurface S B ; Figure 10.23c). The superimposition of F Bon F A produces the interference pattern shown in Figure10.23b. Elements of both fold generations are preserved;for example, the recumbent nature of F A is stillthere, but its limbs are now folded. Similarly, theupright F B folds remain visible, but they are superposedon a pattern that repeats <strong>and</strong> inverts bedding(from the recumbent F A folds). The way to determinethe temporal relationship from our interference patternis to invoke the rule of superposition. Both the bedding11 Also called fold superimposition or fold overprinting.252 FOLDS AND FOLDING
2917-CH10.pdf 11/20/03 5:14 PM Page 253FIGURE 10.22Fold interference pattern of Type 3 (“refolded fold”) geometry.S BF AF BAxial planecleavageS AS AS A1 mS B(a)(b)FIGURE 10.23 Dissecting a fold interference pattern. The cross sections show F A recumbentfolds (a) that are overprinted by F B upright folds (b), producing the fold interference pattern in (c).S B(c)<strong>and</strong> S A are folded, but S B is essentially planar. So, bedding<strong>and</strong> S A were already present before S B ; consequently,the upright folds must be F 2 , which areyounger than the recumbent F 1 folds. The axial surfacesmay not be always visible in the field (althoughaxial plane foliations are common; Chapter 11), butyou can always use an imaginary axial surface to evaluatethese complex folding patterns. Now examine thispattern yourself with an analog. Take a piece of paper<strong>and</strong> fold it in two (our F 1 fold) <strong>and</strong> orient it into arecumbent orientation. Then fold the paper again tocreate an upright fold (our F 2 fold) whose hinge parallelsthe hinge of the recumbent fold. Voilà, you get thepattern of Figure 10.23b. If you are comfortable with10.6 SUPERPOSED FOLDING253
2917-CH10.pdf 11/20/03 5:14 PM Page 254this example, we will proceed with the four basic foldinterference patterns.10.6.2 Fold Interference PatternsFour basic patterns are recognized from the superimpositionof upright F 2 folds on F 1 folds of variableorientation (Figure 10.24). Looking at these fold interferencetypes you will notice that we produced Type 3using the piece of folded paper above. Types 0 <strong>and</strong> 2can equally well be examined by folding a piece ofpaper, but Type 1 requires additional crumpling.Instead of describing these patterns in confusingwords, look at Figure 10.24 <strong>and</strong> reproduce the geometrieswith a piece of paper <strong>and</strong> your h<strong>and</strong>s. Anapproach that may offer further insight is to make fold(a) Type 0 (b) Type 1Axial surfaceb 1b 2a 21 21. First foldgeometry2. Second-generationdisplacements33. Resulting geometry(c) Type 2 (d) Type 3121233FIGURE 10.24 The four basic patterns arising from fold superposition. The analysis assumesthat F 2 shear folds (a 2 is the relative shear direction <strong>and</strong> b 2 is the hinge line) are superimposed ona preexisting F 1 fold of variable orientation. Shear folds are modeled by moving a deck of cards. Theshaded surface is the S 1 axial surface.254 FOLDS AND FOLDING
2917-CH10.pdf 11/20/03 5:14 PM Page 255interference patterns using a few thin layers of coloredmodeling clay, which can then be cut with a knife tosee the effect of intersecting surfaces. Open a refreshingdrink <strong>and</strong> start your experimentation. ...Welcome back from spending time with clay, paper,<strong>and</strong> Figure 10.24. We now turn to some important propertiesof the various fold interference types. Type 0 is aspecial condition, because the hinge lines <strong>and</strong> the axialsurfaces of both fold generations are parallel. As a consequence,F 1 is merely tightened by the superimpositionof F 2 . You realize that, practically, Type 0 cannot be recognizedin the field as an interference type by geometryalone (that’s why we use the number 0). Type 1 is alsocalled a “dome-<strong>and</strong>-basin” structure <strong>and</strong> resembles anegg carton. Both the axial surfaces <strong>and</strong> the hinge lines ofthe two generations are perpendicular, producing thischaracteristic geometry (Figure 10.24a). Type 2 is perhapsthe most difficult geometry to visualize, but foldinga piece of paper helps enormously. In outcrop, we oftensee a section through this geometry that resembles a“mushroom” pattern (Figure 10.24b). Note that this outcroppattern is only generated in the horizontal surfacethat intersects Type 2; if we take another cut, say vertical,the outcrop pattern is quite different. Finally, Type 3(Fig-ure 10.24c) is sometimes referred to as the “refoldedfold” pattern, which is a misnomer because all four typesare refolded folds. We just present the name so that youhave heard it, <strong>and</strong> because very few people are otherwiseable to remember the corresponding numbers of thetypes. We recommend that you use the descriptive terms“dome-<strong>and</strong>-basin,” “mushroom,” <strong>and</strong> “refolded-fold,”however flawed, instead of the abstract Type 1, Type 2,<strong>and</strong> Type 3, respectively.Interference patterns are a function of the spatialrelationship between hinge lines <strong>and</strong> axial surfaces ofthe fold generations, as well as the sectional surface inwhich we view the resulting patterns. Thus, the analysisof fold superposition is a three-dimensional problem.The four types that are shown in Figure 10.24 areonly end-member configurations in an infinite array ofpossibilities. Figure 10.25 is a summary diagram thatshows patterns from varying the spatial relationshipsbetween fold generations, as well as the observationsurface (or, the outcrop). Even more so than before,underst<strong>and</strong>ing these patterns requires self-study. Ultimately,interference patterns reward you with completeinformation on the sequence <strong>and</strong> orientation of foldgenerations. So, again take your time.The fold interference patterns we have analyzed areproduced when fold generations of similar scale aresuperimposed. If the scales are very different theremay be no interference pattern visible on the outcropscale, <strong>and</strong> only through regional structural analysisdoes the large-scale structure appear. After some fieldwork it is therefore not uncommon to find one or moreadditional fold generations that only show on the mapscale. A reexamination of some puzzling field notes<strong>and</strong> outcrop sketches may all of a sudden be explainedby recognizing this missing fold generation.The presence of multiple fold generations has majorimplications for the interpretation of the deformationhistory of your area. First, it implies that the kinematicconditions have changed to produce a fold generationwith different orientation than before (except Type 0);so the deformation regime must somehow havechanged. Secondly, folds of the first generation willhave variable orientations depending on where they aremeasured in the fold superposition pattern. Orientation,therefore, is not a characteristic of fold generationsin multiply deformed areas <strong>and</strong> should be usedcarefully as a mapping tool (see below). That leaves afinal question: How do we recognize folds of a certaingeneration in the absence of interference patterns ateach <strong>and</strong> every locality in our area? For this we turn tothe powerful concept of fold style.10.6.3 Fold StyleWhen we encounter a number of folds in our field area,the logical question of their significance arises. Arethey part of the same generation or do they representseveral generations? Say that, at one locality in ourarea, we are actually able to determine a sequence ofF 1 <strong>and</strong> F 2 folds, so we know that there are at least twogenerations. From our experience with superposedfolding, we are also aware that only F 2 folds have anorientation that may persist over any distance, <strong>and</strong> thatthe orientation of F 1 folds depends entirely on theirposition in the fold interference pattern (we measuretheir orientation nonetheless because the distributionshould “fit” the pattern). We now are at an outcropwhere we only find one fold, which is not in the exactsame orientation as either F 1 or F 2 in the previous outcrop.Nonetheless we wish to predict to which generationit belongs, <strong>and</strong> for that we use characteristics foreach fold generation that are grouped under the termfold style. The fold style characteristics are listed inTable 10.4.The four elements of Table 10.4, parallel/similar, interlimbangle, cylindrical/noncylindrical, <strong>and</strong> foliations/lineations, are used to describe the style of a fold. Thefirst three have been discussed in detail <strong>and</strong> need nofurther clarification. Foliations <strong>and</strong> lineations will havemore meaning after you read Chapter 11, but thisfourth characteristic is included here because of itsdiscriminatory ability. For example, an axial plane10.6 SUPERPOSED FOLDING255
2917-CH10.pdf 11/20/03 5:14 PM Page 256a 1Axialsurfacec a 21bb 21c 2First foldsSecondfoldsb aAxial21surfacec 2a 2α βc 1γ δb 1Angular relationships(a)A B C DEγ0° 30° 60° 90°AB90°DP OP60° FNCJ, KαOMILHG30°F30°E0°90°60°βGN0°HMLKJIFIGURE 10.25 Geometric axes describing the orientation of fold generations F 1 <strong>and</strong> F 2 (a),<strong>and</strong> corresponding interference patterns (b). In all patterns, the layering was initially parallel to thefront face of the cube. F 1 resembles case D; F 2 is similar to the folding in case D, but with differentorientations. Axial surface S 1 is shown with dotted lines <strong>and</strong> axial surface S 2 with dashed lines.(b)256 FOLDS AND FOLDING
2917-CH10.pdf 11/20/03 5:14 PM Page 257TABLE 10.4THE CHARACTERISTICELEMENTS OF FOLD STYLE• In profile plane, is the fold classified as parallel orsimilar (or a further refinement)?• What is the interlimb angle in profile?• In three dimensions, is the fold cylindrical ornoncylindrical?• Is there an associated axial plane foliation <strong>and</strong>/orlineation present, <strong>and</strong> of what type are they?Note that orientation <strong>and</strong> symmetry are not style criteria.crenulation cleavage may be a characteristic of F 2folds, <strong>and</strong> the presence of a mineral lineation mayreflect special metamorphic conditions that onlyoccurred during the first fold generation. Notablyabsent in our list are fold orientation <strong>and</strong> fold symmetry,which are not style criteria. Discriminating a foldgeneration on its orientation may only work for the lastfold generation; the older ones most likely havebecome variably oriented. Secondly, we alreadylearned that fold symmetry may change within asingle-generation, large fold (Figure 10.16). So, justlike orientation, symmetry is not a style criterion.10.6.4 A Few Philosophical PointsWe close the section on superposed folding with a fewconsiderations. You will often find that it is not possiblein any single outcrop to determine the completesequence of fold generations, because discriminatoryinterference patterns may not be exposed, or one ormore generations may not be visible at all. However,by combining information from several outcrops aswell as using fold style you should eventually be ableto obtain a reasonable fold sequence. As you map, youshould continue to test this hypothesis, <strong>and</strong> after a thoroughjob the foundation on which you base the foldingsequence will be firm. Only then will the time havecome to place your findings in a regional kinematicpicture. For example, you may find that the first generationof folds is recumbent, which we quite commonlyassociate with nappe style, <strong>and</strong> that the secondfold generation is upright, reflecting folding of thethrust sequence. Maybe yet a third fold generationreflects a very different shortening direction, possiblyrelated to a different orogenic phase. We may also findsmall kink folds in well-foliated rocks that completethe deformation sequence. Although the possibilitiesseem limitless, reasonable interpretations are not.There is sometimes a tendency to recognize toomany fold generations by structural geologists. In theend, the number of fold generations should be basedonly on interference patterns, on either local orregional scales. Practically, in any one outcrop youmay be able to see two or three fold generations, <strong>and</strong>regionally perhaps a couple more. Remember thatstructural analysis is not helped by proposing anunnecessarily long <strong>and</strong> complex sequence of fold generations,because each generation must reflect a correspondingdeformation regime. One can reasonablyexpect only so many different tectonic patterns. Withthese musings <strong>and</strong> a closing field example of a Type 1fold interference pattern (Figure 10.26), we leave thedescriptive part of folds <strong>and</strong> field analysis to turn ourattention to the mechanics of folding.10.7 THE MECHANICSOF FOLDINGWhy does folding occur? After spending so much timeon the description of folds, this is a question whosetime has come. Well, if you ever saw a car collision youdo not need to be reminded that forces can cause folding.12 Indeed, forces applied to rocks cause folding, butwe will see that forces alone are not sufficient to formfolds. Consider a block of clay that is reshaped byexternal forces (from your h<strong>and</strong>s). The block willchange form, but in doing so the internal structure doesnot show any folds (Figure 10.27a). After we add irregularlyshaped layers of different color but with the samematerial properties to the block, we get folds when theirregularities are amplified (Figure 10.27b). If we addstraight, thin sheets of rubber to our clay block <strong>and</strong> aforce is applied, folds also appear (Figure 10.27c).These experiments provide us with a fundamental subdivisionof folding based on the mechanical role of layers:passive folding <strong>and</strong> active folding.10.7.1 Passive <strong>Folding</strong> <strong>and</strong> Active <strong>Folding</strong>During passive folding the layering of a material hasno mechanical significance. In the color-b<strong>and</strong>ed clayblock, folds are formed by the amplification of small12 This recurring analogy does not reflect the authors’ personal experiences.10.7 THE MECHANICS OF FOLDING257
2917-CH10.pdf 11/20/03 5:14 PM Page 258FIGURE 10.26for scale.Fold interference pattern of Type 1 (“dome-<strong>and</strong>-basin”) geometry; compass(a)(b)(c)FIGURE 10.27 Compression of a clay block of uniformcolor (a), with irregularly shaped layers of different colors (b),or with uniform colored layers separated by thin sheets ofrubber (c).perturbations in the b<strong>and</strong>s, but the strain pattern in theblock is unaffected by the presence of these layers.Squeezing multicolor toothpaste on a counter top is afresh <strong>and</strong> minty experiment where complex folding patternsare visible only because of the color contrast; ifyou do the same experiment with single-color toothpasteyou will not see folds, even though the internalstructure of the two blobs is similar. We find suchtoothpaste-like behavior in nature where rocks have littleor no competency contrast between layers. Elevatedtemperatures can produce the right conditions for passivefolding <strong>and</strong> it is common to find toothpaste-likestructures in deformed metamorphic rocks. Rocks thatwere deformed at or near their melting temperature(that is, a high homologous temperature, T h = T/T m ) arecalled migmatites, which often contain wonderfullycomplex fold structures (see Figure 2.22). Similarly,passive folding occurs in glaciers that deform close totheir melting temperature. Passive folds are the ampli-258 FOLDS AND FOLDING
2917-CH10.pdf 11/20/03 5:14 PM Page 259fication of natural irregularities in the layers, or are aconsequence of differential flow in a volume of rock.But don’t think that passive folds have to be chaotic inappearance because of this. Sheath folds in a shear zoneare another natural example of passive folding <strong>and</strong> typicallyshow very consistent orientation <strong>and</strong> style.During active folding, also called flexural folding,the layering has mechanical significance. This meansthat the presence of layers with different competencydirectly affects the strain pattern in the deforming body<strong>and</strong> that there is contrasting behavior between layers.There are two dynamic conditions that we distinguishfor active folding: bending <strong>and</strong> buckling. In bending, theapplied force is oriented at an oblique angle to the layering(Figure 10.28a). In nature this may occur duringbasin formation or loading of a lithospheric plate (alsocalled flexural loading), or during the development ofmonoclines over fault blocks. In buckling, the forceis oriented parallel to the mechanical anisotropy (Figure10.28b), the most common situation for folding.Let’s see what happens in a series of analog experimentsof active folding, in this case buckling (Figure10.29). We surround a b<strong>and</strong> of rubber with foam ina plastic box that is open at one end, at which we placea plunger. As we push on the plunger, the b<strong>and</strong> of rubberforms a series of folds. The surrounding foam (the“matrix”) accommodates the shape of the rubber b<strong>and</strong>by filling the gaps that would otherwise be present. Werepeat the experiment with a thinner b<strong>and</strong> of rubber<strong>and</strong> the same foam. Now we produce several morefolds <strong>and</strong> the weaker foam again accommodates thisnew pattern. So, in spite of applying the same force<strong>and</strong> producing the same bulk shortening strain, thefolding patterns are different as a function of the thicknessof the rubber b<strong>and</strong>. In other words, the rubberb<strong>and</strong> introduces a mechanical anisotropy.10.7.2 Buckle <strong>Folds</strong>We return to the above rubber b<strong>and</strong>–foam experiments,where we saw that the thickness of the b<strong>and</strong> somehowaffects the fold shape, to explore some systematicproperties of buckle folds. The applied force (<strong>and</strong> thusstress), the bulk strain (the distance the plunger movesinto our box), the strain rate (the speed at which theplunger moves), <strong>and</strong> the ambient conditions (roomtemperature <strong>and</strong> pressure) are assumed to be the samein all experiments; only thickness, t, of the layer varies.We notice that with increasing thickness the wavelength<strong>and</strong> arc length become larger. Secondly, ifwe use b<strong>and</strong>s of equal thickness but with differentFIGURE 10.28FoamRubber b<strong>and</strong>(a)(b)Bending (a) <strong>and</strong> buckling (b) of a layer.(a)(b)(c)FIGURE 10.29 Line drawings of deformation experimentswith transparent boxes containing foam, <strong>and</strong> rubber b<strong>and</strong>s. In(a), four starting settings are shown that contain, from left toright, foam only (with marker line added), a thin, a medium, <strong>and</strong>a thick rubber b<strong>and</strong>. When applying the same displacement,shown in (b), the setups respond differently. The foam-only boxshows thickening of the marker line, but no folding. The boxeswith rubber b<strong>and</strong>s show folds with arc lengths varying as afunction of thickness of each b<strong>and</strong>. When using more than oneb<strong>and</strong> (c), the behavior depends on the combination of b<strong>and</strong>s<strong>and</strong> their thicknesses, with the effect of the thicker b<strong>and</strong>sbeing dominant.10.7 THE MECHANICS OF FOLDING259
2917-CH10.pdf 11/20/03 5:14 PM Page 260stiffness, we find that arc length of the stifferlayer is larger than that of the weaker layer. So,we find that both thickness <strong>and</strong> the parameter“stiffness” increase the wavelength. In nature,we are not really dealing with elastic layers.<strong>Folds</strong> are permanent strain features, so it ismore useful to consider this problem in termsof viscous behavior or even more complex rheologicmodels (such as elastico-viscous or nonlinearviscosity; Chapter 5). For our currentpurposes we assume simple, Newtonian (linear)viscous behavior.Using Newtonian viscosity, the theoreticalarc length–thickness relationship for a layerwith viscosity η L surrounded by a matrix withviscosity η M is:L = 2πt (η L /6η M ) 1/3 Eq. 10.1Average wavelength of fold (m)10 510 410 310 210110 –110 –2This equation, which is known as the Biot-Ramberg equation, 13 tells us that arc length(L) is directly proportional to thickness <strong>and</strong> tothe cube root of the viscosity ratio. Therefore, ifwe know the arc length/thickness ratio of alayer, we can obtain the viscosity ratio. ReorganizingEquation 10.1, we getη L /η M = 0.024 (L/t) 3 Eq. 10.2This formulation states that the viscosity ratio is proportionalto the cube of the L/t ratio. The measurementsof folded s<strong>and</strong>stone layers in sedimentary rocks, shownin Figure 10.30, give a viscosity ratio of about 475. Weintentionally say “about,” because Figure 10.30 is alog–log plot, meaning that a small change in L/t ratiowill result in a large change in viscosity ratio. Note thatthe same analysis for our box experiments aboveproduces a viscosity contrast on the order of 1000,meaning that these experiments are a reasonableapproximation of low-grade s<strong>and</strong>stone deformation.There is an important consequence when the viscosityratio of layer <strong>and</strong> matrix is small (say,
2917-CH10.pdf 11/20/03 5:14 PM Page 26133% 63% 78% η L /η M42.117.55.2FIGURE 10.31 Finite-element modeling of single-layer buckling for various viscositycontrasts between layer (η L ) <strong>and</strong> matrix (η M ), <strong>and</strong> shortening strains (%). The short marksrepresent the orientation of the long axis of the strain ellipse in profile plane.orientation of the x-axis in Figure 10.31. The strainpattern is increasingly homogeneous with decreasingviscosity contrast. Indeed, no viscosity contrast (η L /η M= 1) reflects the situation in which there is no moremechanical significance to the layer (see the foamonlybox experiment in Figure 10.29).These analyses of folding are entirely based onNewtonian-viscous behavior of both the layer <strong>and</strong> thematrix. However, it is likely that folding under elevatedconditions of pressure <strong>and</strong> temperature involvesnonlinear rheologies, in which the viscosity is stressdependent (Chapter 5). Without going into anydetails, we only mention that appropriate nonlinearrheologies result in lower values of L/t as well assmall to negligible components of layer-parallelshortening. Natural folds in metamorphic terrainstypically have low L/t ratios (L/t < 10), suggestingthat nonlinear viscous rheology, <strong>and</strong> therefore crystal-plasticprocesses, are indeed important duringfolding under these conditions.10.7 THE MECHANICS OF FOLDING261
2917-CH10.pdf 11/20/03 5:14 PM Page 26210.7.3 Folded MultilayersOur discussion so far has focused on folding of a singlelayer in a weaker matrix. While this situationoccurs in nature, it is not representative. What happenswhen several layers are present? Again we turn to oursimple experimental setup (Figure 10.29), but now usetwo rubber b<strong>and</strong>s of equal thickness to see what foldsdevelop. Can you explain why the results differ fromthose of our previous single-layer experiments? Thewavelength in the multilayer experiment is greater <strong>and</strong>the two layers seem to act as a thicker single layer. Inanother experiment we combine a thick <strong>and</strong> a thinlayer (Figure 10.29). In this case, the thin layer doesnot at all give the fold shape predicted from singlelayertheory, while the thick layer behaves pretty muchthe same as predicted from the single-layer experiment.In fact, the thin layer mimics the shape of thethick layer, indicating that its behavior is dominated bythat of the thick layer. We can try many other combinations,which all show that the behavior of a multilayersystem is sensitive to the interaction betweenlayers. The previous Biot-Ramberg buckling theory,therefore, only applies when layers in natural rocks aresufficiently far removed from one another to avoidinteraction. We can theoretically determine the regionover which the effect of a buckled layer in a weakermatrix dies off to negligible values. This is known asthe contact strain zone (CSZ). The width of this contactstrain zone (2d CSZ , where d CSZ is the distance measuredfrom the midpoint of the buckled layer) is a functionof the arc length:d CSZ = 2/πL Eq. 10.4Practically this means that the width of the CSZ isslightly greater than the arc length of a fold, whichseems supported by field observations on natural folds.Interacting layers require a relatively simple extensionof the theory of folding, if we assume a stack consistingof several superposed thin layers that are free tomove relative to one another (that is, no coupling). Thecorresponding equation for this multilayer case isL a = 2πt (Nη L /6η M ) 1/3 Eq. 10.5where L a is the arc length of the multilayer, N is thenumber of layers, <strong>and</strong> the space between the layers isinfinitely small. Note that this is not the same as theequation for a single layer with the same thickness(N ⋅ t). If we calculate the ratio of the arc length of a systemwith N superposed multilayers (L m ) <strong>and</strong> a systemwith a single layer of thickness Nt (L s ) by dividingEquation 10.1 (with t = Nt) <strong>and</strong> Equation 10.5, we getL s /L m = N 2/3 Eq. 10.6This shows that the arc length of N multilayers ofthickness t is less than that of a single layer with thicknessNt. This scenario is certainly not applicable to allgeologic conditions. Commonly we find that layers ofone viscosity alternate with layers of another viscosity.For example, a turbidite sequence contains alternatinglayers of s<strong>and</strong>stone <strong>and</strong> shale. In this case the analysisis considerably more complex <strong>and</strong>, because increasinglyrestrictive assumptions have to be made (includingthe spacing between layers), we stop here. Themain point is that multilayers behave much like a thicksingle layer, but the resulting arc length in a multilayersystem will be less than that of a single layer.10.8 KINEMATIC MODELSOF FOLDINGThe distinction we made earlier between active <strong>and</strong>passive folds describes the mechanical role of layersunder an imposed stress, but this says little about theinner workings of the folded layer <strong>and</strong> the associatedstrain pattern. To this end, we differentiate betweenthree fundamental models, flexural folding, neutralsurfacefolding, <strong>and</strong> shear folding, as well as modificationof folds by superimposed strain; each of thesehave distinct properties <strong>and</strong> characteristics. Thesemodels are compared with natural examples in thefinal section.10.8.1 Flexural Slip/Flow <strong>Folding</strong>Take a phone book or a deck of playing cards, <strong>and</strong>bend it into a fold. 15 The ability to produce the fold isachieved by slip on the surfaces of the cards relative toone another, without appreciable distortion within thesurface of any individual card (they remain of the samesize). If we place small marker circles on the top surfaceas well as on the sides of the card stack for use asa strain gauge, we see that strain only accumulates insurfaces that are at an angle to the individual cards15 Computer punch cards are well suited, but remain only in the possessionof old structural geology instructors.262 FOLDS AND FOLDING
2917-CH10.pdf 11/20/03 5:14 PM Page 263(that is, the sides) when we fold the deck. The circlesbecome ellipses in the profile plane (Figure 10.32) <strong>and</strong>on the other side of the folded deck parallel to thehinge line. Within the plane of each card, however,there is no strain, as seen from the fact that the circleson the top card in the deck remain circles. <strong>Folds</strong> thatform from slip between layers are called flexural slipfolds. The amount of slip between the layers increasesaway from the hinge zone <strong>and</strong> reaches a maximum atthe inflection point. Moreover, the amount of slip isproportional to limb dip: slip increases with increasingdip. The card deck analogy highlights three importantcharacteristics of flexural slip folding. First, at eachpoint in the profile plane the strain ratio <strong>and</strong> orientationdiffer. Second, in three dimensions the strain stateof the fold is plane strain (X > Y = 1 > Z), with the orientationof the intermediate strain axis (Y) parallel tothe hinge line. Third, a geometric consequence of theflexural slip model is that the fold is cylindrical <strong>and</strong>parallel (Class 1B); the bed thickness in flexural slipfolds does not change. The geometric consequences offlexural slip folding are not diagnostic of the model,because they also occur in other models (see neutralsurfacefolding to follow). The strain pattern, however,is. Chevron folds (Figure 10.8) <strong>and</strong> kink folds (Figure10.19) are examples of flexural slip folding in naturalrocks that form because of a strong layeranisotropy. Slip that occurs on individual grains withina layer, without the presence of visible slip surfaces, wecall flexural flow folding. 16 Although they differ in afew details, the geometric <strong>and</strong> kinematic consequencesof both flexural slip <strong>and</strong> flexural flow folding are alike.A diagnostic feature of flexural slip folding that canbe used in field analysis is that any original angular relationshipin the slip surface before folding (say, flutecasts in the bedding surfaces of turbidites) will maintainthis angular relationship across the fold, because there isno strain on the top <strong>and</strong> bottom of the folded surface.Consequently, a lineation at an angle to the hinge linewill distribute as a cone around the hinge line with thatangle (a small-circle pattern in spherical projection).10.8.2 Neutral-Surface <strong>Folding</strong>When we bend a layer of clay or a metal bar we obtaina fold geometry that seems identical to one producedby flexural folding, but with a distinctly different strain16 Flexural flow folding has also been used to describe the migration ofmaterial from the limbs to the hinge area of folds, but we do not adopt thisusage here.FIGURE 10.32 The characteristic strain pattern offlexural folding in the fold profile plane (the plane perpendicularto the hinge line).NeutralsurfaceNeutral surfaceFIGURE 10.33 The strain pattern of neutral-surfacefolding in the fold profile plane.pattern. This is illustrated by tracking the distortion ofcircles drawn on the sides of the undeformed layer(Figure 10.33). On all three surfaces we find that circleshave become ellipses, including the folded top <strong>and</strong>bottom surface. On the top folded surface, the longaxis of each ellipse is perpendicular to the hinge line,but on the bottom the long axis is parallel to the hingeline. In the profile plane the long axis is parallel or perpendicularto the top <strong>and</strong> bottom surfaces of the foldedlayer, depending on where we are in that plane (Figure10.33). There must, therefore, be a surface in thefold where there is no strain. This zero-strain surfacegives the model its name, neutral-surface fold. Tryingto mimic this behavior with the deck of cards used10.8 KINEMATIC MODELS OF FOLDING263
2917-CH10.pdf 11/20/03 5:14 PM Page 264earlier will require some muscle power, because thecards in the outer arc need to stretch while those in theinner arc are compressed.The fold shape from neutral-surface folding is parallel<strong>and</strong> cylindrical, with the intermediate bulk strainaxis parallel to the fold axis. These geometric characteristics<strong>and</strong> plane strain conditions also hold for flexuralslip folding, so they are not diagnostic for eithermodel; their strain patterns, however, are. Because strainaccumulates in the folded surfaces during neutralsurfacefolding, the orientation of any feature on thesesurfaces changes with position in the fold. In the outerarc an initial angle with the hinge line increases, whilein the inner arc this angle decreases. So, the angle offlute marks with the hinge line on the top surface of thefolded layer increases, while on the bottom surface thisangle decreases. In both cases the orientations in anyindividual surface describe neither a cone nor a plane(or small circle <strong>and</strong> great circle in spherical projection,respectively). Only in the neutral surface is the angleunchanged <strong>and</strong> does the linear feature describe a conearound the hinge line. It is not easy to use this criterionas a field tool unless one measures lineations fromindividual top <strong>and</strong> bottom layers in a fold. The strainpattern in the profile plane, however, is more characteristic,<strong>and</strong> is (cumbersomely) called tangential longitudinalstrain. Note that the position of the neutralsurface is not restricted to the middle of the fold, nordoes it necessarily occur at the same relative positionacross the fold. In extreme cases the neutral surface maycoincide with the outer arc, in which case the long axisof each strain ellipse in the profile plane is perpendicularto the folded surface. Is it possible to have the neutralsurface at the inner arc? Answer this question to testyour underst<strong>and</strong>ing of neutral-surface folding beforemoving on to the third <strong>and</strong> final folding model.10.8.3 Shear <strong>Folding</strong>To represent shear folding, we again turn to a deck ofcards, but now we draw a layer on the sides of thedeck. When we differentially move the cards relative toone another we produce a fold by a mechanism calledshear folding (Figure 10.34). The fold shape varieswith the amount <strong>and</strong> sense of displacement betweenindividual cards <strong>and</strong> the layer has no mechanical significance;that is, shear folds are passive features.While slip occurs on individual cards, the slip surface<strong>and</strong> the slip vector are not parallel to the folded surface,as they are with flexural folding. Circles drawnon the deck before we shear the cards show that thereis no strain in the surface of individual cards, but thereis strain in the other surfaces. The overall strain state isFIGURE 10.34Circularsectionsthrough strainellipsoidThe strain pattern of shear folding.plane strain, but the hinge line is not by definition perpendicularto the displacement vector, nor parallel tothe intermediate (Y) strain axis. Most notably, the foldswe produce have a distinct shape, because the trace ofthe layer on each card remains equal in length aftershearing. As a consequence, we produce similar folds(Class 2). It is about time that we produced this classof folds, which are common in the field, while ourmodels so far only generated parallel folds, which arenot. Much of the charm of shear folding lies in the abilityto form similar folds, which are only formed by theother two mechanisms after additional modification(see Section 10.8.4).In nature, there are no playing cards slipping pastone another. Axial plane cleavage (which is discussedin Chapter 11) may act as shear planes, 17 but rocksmostly flow as a continuum. Shear folds can be formedin regions where the flow field is heterogeneous, suchas in glaciers (see fold geometry in Figure 10.1). Inshear zones, relatively narrow regions with high shearstrains (Chapter 12), a mylonitic foliation is common<strong>and</strong> may act as a shear plane for shear folding. In fact,sheath folds are a spectacular example of the developmentof such passive folds.17 Axial plane cleavage cannot exactly parallel the finite XY principal planeof strain, as this is not a shear plane.264 FOLDS AND FOLDING
2917-CH10.pdf 11/20/03 5:14 PM Page 26510.8.4 Fold Shape ModificationThe appeal of shear folding is the formation of similar(Class 2) folds, whereas both flexural folding <strong>and</strong>neutral-surface folding produce parallel (Class 1B) folds.What happens in the latter scenarios when we allowmodification of the fold shape? Experiments <strong>and</strong> geometricarguments place a limit on the degree of strainthat can be accumulated by fold tightening in parallelfolds. You may have noticed this when folding the carddeck, where the inner arc region increasingly experiencesspace problems as the fold tightens (Figure10.11a). Material that occupies the inner arc regionmay be able to accommodate this space crunch, muchlike the foam does in our box experiments. However,as the fold tightens, the later strain increments willincreasingly affect the entire fold structure (limbs <strong>and</strong>hinge equally), resulting in superimposed homogeneousstrain. This strain component has a pronouncedeffect on the fold shape.Figure 10.35 shows the effect of superimposedhomogeneous strains (constant volume, plain strain)with 20% shortening (X/Z = 1.6) <strong>and</strong> 60% shortening(X/Z = 6.3) on shape <strong>and</strong> corresponding strain distributionsin a flexural fold <strong>and</strong> a neutral-surface fold. Yousee that initially parallel folds change shape by thinningof the limbs relative to the hinge area, resulting ina geometry that approaches similar folds (Class 1C).Perfectly similar (Class 2) folds are only achieved at aninfinite X/Z ratio, which is obviously unrealistic. Areminder on strain superimposition. In Chapter 4 youlearned that strain is a second-rank tensor, <strong>and</strong> that tensorsare not commutative; that is, a ij ⋅ b ij ≠ b ij ⋅ a ij . Thisimplies that we get different finite strains when wereverse the sequence of parallel folding <strong>and</strong> homogeneousstrain, or simultaneously add homogeneousstrain during folding. The implications of these scenariosare explored in more advanced texts, as theyrequire tensor calculations.In all models we fail to produce Class 3 folds, whichpose the final challenge. One likely scenario for the formationof Class 3 folds lies in the interaction betweenlayers of different competency in a multilayered system.Consider a sequence of shale <strong>and</strong> s<strong>and</strong>stone layers(Figure 10.36). As we shorten the sequence, the strong(competent) s<strong>and</strong>stone layers form Class 1B to 1C folds(as outlined above). The weaker (less competent) interveningshale layers accommodate the shape of thefolded s<strong>and</strong>stone layers when they are in the contactstrain zone. This means that folds of Class 3 will beformed in intervening shale when the s<strong>and</strong>stone layersare closely spaced, <strong>and</strong> folds of Class 1C to 2 when thes<strong>and</strong>stone layers are farther apart.– xz = 6.3– xz = 1.6FIGURE 10.35 The effect of superimposed homogeneousstrain on (a) a flexural <strong>and</strong> (b) a neutral-surface fold. Constantvolume, plane strain with X/Z = 1.6 (20% shortening), <strong>and</strong>X/Z = 6.3 (60% shortening) are shown.(a)(b)10.8.5 A Natural ExampleHow well does all this theory apply to nature? Toanswer this, we look at an example of a parallel fold ina limestone-pebble conglomerate. Strain values thatwere measured from pebbles across the folded layergive an estimate of the overall strain pattern (Figure10.37a). When comparing this pattern with thosepredicted for flexural folding (Figure 10.37c) <strong>and</strong>10.8 KINEMATIC MODELS OF FOLDING265
2917-CH10.pdf 11/20/03 5:14 PM Page 266FIGURE 10.36 <strong>Folding</strong> of a multilayer consisting of s<strong>and</strong>stone(stippled) <strong>and</strong> shale layers. The incompetent shale layers accommodate thestrong s<strong>and</strong>stone layers. This results in Class 3 <strong>and</strong> Class 2 folds in shalewhen the s<strong>and</strong>stone layers are closely <strong>and</strong> more widely spaced, respectively.The s<strong>and</strong>stone layer forms Class 1 folds.1C31C3231Cneutral-surface folding (Figure 10.37d), wesee that the natural pattern most resemblesthat predicted by neutral-surface folding.The x-axis is parallel to the folded surface inthe outer arc <strong>and</strong> perpendicular to this surfacein the inner arc. Yet the magnitude ofthe strain ratios predicted by neutral-surfacefolding is too low in the natural pattern, sothe pattern requires additional modificationto match the natural fold. One solution isshown in Figure 10.37b, where prefoldingcompaction (nonconstant volume, layer-perpendicularshortening) is followed by neutral-surfacefolding, during which materialis preferentially removed from the inner arc.Dissolution <strong>and</strong> material transport duringfolding are quite common in natural rocks.Quartz <strong>and</strong> calcite veins in folded rocks areexamples of this transport. Other naturalfolds show that flexural folding <strong>and</strong> shearfolding are the dominant mechanisms, so allour folding models offer reasonable firstorderapproximations to the inner workingsof a folded layer.The example in Figure 10.37 emphasizesthat strain in folds is highly heterogeneous,but we can nonetheless estimate the bulkshortening strain from the fold shape byadapting Equation 4.1. The bulk strain isgiven byObserved(a)Neutral-surface folding<strong>and</strong> fold modification(b)e = (W – L)/L Eq. 10.7where L is the arc length <strong>and</strong> W is the wavelength.Applying this to our example weobtain a value for e of approximately –0.35,or ∼35% bulk-shortening strain. 18Flexural foldingNeutral-surface folding(c)(d)FIGURE 10.37 Strain pattern in a natural fold of limestone-pebbleconglomerate (a). This pattern more closely resembles the strain predicted inneutral-surface folding (d) than in flexural folding (c). With furthermodification, which consists of initial compaction <strong>and</strong> material transportaway from the inner arc region, a strain pattern much like that observed inthe natural sample can be produced (b).10.9 A POSSIBLESEQUENCEOF EVENTSWe close the chapter on folding by an interpretivesequence of events in the formationof a single-layer fold. Immediately follow-18 If compaction does not lengthen the layer, this longitudinalstrain estimate is tectonic strain.266 FOLDS AND FOLDING
2917-CH10.pdf 11/20/03 5:14 PM Page 267FIGURE 10.38 <strong>Folding</strong> scenario with the correspondingstrain states at each step. An initial layer (a) undergoes 20%compaction (b). This is followed by layer-parallel shortening(c) <strong>and</strong> buckling (d). The final stage is a homogeneousshortening strain which transforms the parallel fold into asimilar fold. The finite strain in the layer is indicated at eachstep; the incremental strain (dashed) <strong>and</strong> finite strain (solid)ellipses of the system are shown in the upper right. Strain ratiosare shown for each step. It is assumed that volume loss occursonly at the compaction stage (b).ing deposition of the bed, compaction reduces itsthickness. We use an intermediate value of 20% layerperpendicularshortening strain for this first componentin our example (i.e., X c /Z c = 1.25), which represents20% area loss (Figure 10.38b); in nature,compactional strains range from 0% to 50%. Duringthe first stage of buckling, the competent layer changesdimensions by layer-parallel shortening (lps). Yourecall that layer thickening is more important at lowviscosity ratios, so in our example we assume 20%layer-parallel shortening. This constant-volume,homogeneous strain component (conveniently)restores the finite strain ellipse to a circle (X f /Z f = 1),but the corresponding lps strain ratio X lps /Z lps is 1.25(Figure 10.38c). Continued shortening results in theinitiation <strong>and</strong> growth of a parallel fold by flexural folding,with a characteristic arc length (L) as a function ofthe thickness (t) of the layer <strong>and</strong> the linear viscosityratio (η L /η M ). We can estimate the viscosity ratio of thesystem by measuring the ratio L/t <strong>and</strong> the strain ratioX lps /Z lps of the layer. Until this buckling stage, thestrain has been homogeneous, but after fold initiationthe strain is heterogeneous, with coaxial strain dominatingthe hinge area <strong>and</strong> non-coaxial strain dominatingin the limbs of the fold (Figure 10.38d). The bulkfinite strain of the system is represented by the ratioX b /Z b (i.e., 4). When resistance to further folding hasbeen reached, continued shortening is achieved bysuperimposed homogeneous strain (Figure 10.38e).The end result of these stages produces a similar foldwith a strain pattern that varies as a function of thedegree of compactional strain, the operative foldmechanism, the viscosity ratio, <strong>and</strong> the degree ofsuperimposed homogeneous strain. The finite strainratio X f /Z f for our history is 11, which corresponds to atotal layer-parallel shortening strain of ∼70%.One can vary this scenario in many ways by simplychanging the values of the strain ratio at each step, butalso by introducing volume loss during the stages ofbuckling <strong>and</strong> superimposed homogeneous strain.Examining alternative scenarios will give you a goodidea of folding <strong>and</strong> strain distributions under differentconditions; modern imaging programs for personalcomputers offer a simple way to experiment. Forexample, in metamorphic rocks there is little competencycontrast between the layers, <strong>and</strong> layer-parallelthickening may be much more important than in lowgradesedimentary beds. Moreover, elevated temperatureconditions promote grain dissolution <strong>and</strong> transportof material. It is therefore particularly instructive toexamine the history of a system experiencing 50%10.9 A POSSIBLE SEQUENCE OF EVENTS267
2917-CH10.pdf 11/20/03 5:14 PM Page 268FIGURE 10.39 Large recumbent fold in Nagelhorn, Switzerl<strong>and</strong>, showing the characteristic nappe style of deformation in thispart of the European Alps.volume loss (∆ =–0.5) during the buckling <strong>and</strong> superimposedhomogeneous strain stages. This represents ageologically reasonable condition we will return to inthe chapter on rock fabrics (Chapter 11).10.10 CLOSING REMARKSHopefully you did not lose sight of the natural beautyof folds after learning so much about description, terminology,<strong>and</strong> mechanics. <strong>Folds</strong> are simply fascinatingto look at, <strong>and</strong> the bigger the better (Figure 10.39). Westudy them to underst<strong>and</strong> the conditions <strong>and</strong> significanceof deformed rocks <strong>and</strong> regions. <strong>Folding</strong> patternsare good representations of the orientation of regionalstrain, <strong>and</strong> we can follow regional strain changes withtime through the analysis of fold superposition. Superposedfolding presents a particular challenge thatawakens the puzzler in us. Fold generations should bebased only on fold superimposition patterns, perhapsaided by fold style for correlation between outcrops.As a “tongue-in-cheek” rule, the number of fold generationsshould always be much less than the numberof folds you have encountered in the field.<strong>Folds</strong> are strain indicators, but the mechanical contrastbetween neighboring layers <strong>and</strong> with the matriximplies that strain data is representative of the foldedlayer, <strong>and</strong> not necessarily of the bulk rock. This is nota crippling limitation for regional analysis, nor is theproblem unique to folds; it holds for all strain markers.Strain within a fold is markedly heterogeneous<strong>and</strong> the local pattern may be very different fromregional conditions. The relationship of folds toregional stress is even less straightforward because ofthe mechanical interaction between layers with contrastingcompetency. Nonetheless, in many circumstances,folds may also tell us about these <strong>and</strong> otherrheologic properties of rocks.Although most of this chapter focuses on single-layerfolding, the material should give you sufficient insightto tackle the literature on multilayer systems <strong>and</strong> otheradvanced topics on folding (such as nonlinear materialrheologies). You are hopefully itching to go out into thefield <strong>and</strong> test some of these concepts <strong>and</strong> ideas; otherwisea few additional laboratory experiments may satisfyyour appetite until summer comes around. Finally,you will find that folds are commonly associated withother structural fabrics, such as foliations <strong>and</strong> lineations;these features are the topic of the next chapter.268 FOLDS AND FOLDING
2917-CH10.pdf 11/20/03 5:14 PM Page 269ADDITIONAL READINGBiot, M. A., 1961. Theory of folding of stratified viscoelasticmedia <strong>and</strong> its implication in tectonics <strong>and</strong>orogenesis. Geological Society of America Bulletin,72, 1595–1620.Currie, J. B., Patnode, H. W., <strong>and</strong> Trump, R. P., 1962.Development of folds in sedimentary strata. GeologicalSociety of America Bulletin,73, 655–674.Dietrich, J. H., 1970. Computer experiments onmechanics of finite amplitude folds. CanadianJournal of Earth Sciences, 7, 467–476.Hudleston, P. J., <strong>and</strong> Lan, L., 1993. Information fromfold shapes. Journal of Structural Geology, 15,253–264.Latham, J., 1985. A numerical investigation <strong>and</strong> geologicaldiscussion of the relationship between folding,kinking <strong>and</strong> faulting. Journal of StructuralGeology, 7, 237–249.Price, N. J., <strong>and</strong> Cosgrove, J. W., 1990. Analysis ofgeological structures. Cambridge University Press:Cambridge.Ramberg, H., 1963. Strain distribution <strong>and</strong> geometryof folds. Bulletin of the Geological Institute, Universityof Uppsala, 42, 1–20.Ramsay, J. G., <strong>and</strong> Huber, M. I., 1987. The techniquesof modern structural geology, volume 2: folds <strong>and</strong>fractures. Academic Press.Sherwin, J., <strong>and</strong> Chapple, W. M., 1968. Wavelengthsof single layer folds: a comparison between theory<strong>and</strong> observation. American Journal of Science, 266,167–179.Thiessen, R. L., <strong>and</strong> Means, W. D., 1980. Classificationof fold interference patterns: a reexamination.Journal of Structural Geology, 2, 311–316.ADDITIONAL READING269