Locating and Estimating Our Emissions from Sources of Dioxins and ...
Locating and Estimating Our Emissions from Sources of Dioxins and ...
Locating and Estimating Our Emissions from Sources of Dioxins and ...

You also want an ePaper? Increase the reach of your titles
YUMPU automatically turns print PDFs into web optimized ePapers that Google loves.
EPA-454/R-97-003LOCATING AND ESTIMATINGAIR EMISSIONSFROM SOURCES OFDIOXINS AND FURANSOffice <strong>of</strong> Air Quality Planning And St<strong>and</strong>ardsOffice <strong>of</strong> Air And RadiationU.S. Environmental Protection AgencyResearch Triangle Park, North Carolina 27711May 1997
DisclaimerThis report has been reviewed by the Office Of Air Quality Planning And St<strong>and</strong>ards, U.S.Environmental Protection Agency, <strong>and</strong> has been approved for publication. Any mention <strong>of</strong> tradenames or commercial products is not intended to constitute endorsement or recommendation foruse.EPA-454/R-97-003ii
EXECUTIVE SUMMARYThe 1990 Clean Air Act Amendments contain a list <strong>of</strong> 189 hazardous air pollutants(HAPs) which the U.S. Environmental Protection Agency (EPA) must study, identify sources <strong>of</strong>,a<strong>and</strong> determine if regulations are warranted. Two <strong>of</strong> these HAPs, chlorinated dibenzo-p-dioxins(CDD) <strong>and</strong> chlorinated dibenz<strong>of</strong>urans (CDF), are the subject <strong>of</strong> this document. This documentdescribes the properties <strong>of</strong> dioxins <strong>and</strong> furans as air pollutants, defines their origin, identifiessource categories <strong>of</strong> air emissions, <strong>and</strong> provides dioxin <strong>and</strong> furan emissions data in terms <strong>of</strong>emission factors <strong>and</strong> national emissions estimates. This document is a part <strong>of</strong> an ongoing EPAseries designed to assist the general public at large, but primarily to assist State/local airregulatory agencies in identifying sources <strong>of</strong> HAPs <strong>and</strong> determining emission estimates.A dioxin is any compound that contains the dibenzo-p-dioxin nucleus, <strong>and</strong> a furanis any compound that contains the dibenz<strong>of</strong>uran nucleus. The term isomers refers to compoundswith the same empirical formulas. The term homologues refers to compounds within the sameseries (e.g., CDD or CDF), but with a different number <strong>of</strong> chlorine atoms (tetra-CDD,penta-CDF, etc.). The 2,3,7,8-TCDD <strong>and</strong> 2,3,7,8-TCDF compounds represent the most toxiccompounds <strong>of</strong> their respective families. The nationwide emissions estimate <strong>of</strong> dioxins <strong>and</strong> furanspresented in this document are based on the two 2,3,7,8 compounds <strong>and</strong>, to the extentpracticable, the base year 1990. In a limited number <strong>of</strong> cases where more recent data wereavailable (e.g., on-road mobile sources), a different base year was used (1991 or 1992) forestimating nationwide emissions.CDD <strong>and</strong> CDF have no known technical use <strong>and</strong> are not intentionally produced.They are formed as unwanted byproducts <strong>of</strong> certain chemical processes during the manufacture <strong>of</strong>chlorinated intermediates <strong>and</strong> in the combustion <strong>of</strong> chlorinated materials. <strong>Dioxins</strong> <strong>and</strong> furans areemitted into the atmosphere <strong>from</strong> a wide variety <strong>of</strong> processes such as waste incineration,aCaprolactam was delisted <strong>from</strong> the list <strong>of</strong> HAPs (Federal Register Volume 61, page 30816,June 18, 1996).iii
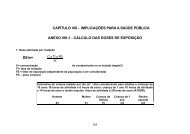
combustion <strong>of</strong> solid <strong>and</strong> liquid fuels in stationary sources for heat <strong>and</strong> power generation,crematories, iron <strong>and</strong> steel foundries/scrap metal melting, combustion-aided metal recovery, kraftpulp <strong>and</strong> paper production/black liquor combustion, internal combustion engines, carbonregeneration, forest fires, organic chemical manufacture <strong>and</strong> use, <strong>and</strong> Portl<strong>and</strong> cementmanufacture.The toxicity equivalency factor (TEF) method is an interim procedure for assessingthe risks associated with exposures to complex mixtures <strong>of</strong> CDD/CDF. This method relates thetoxicity <strong>of</strong> the 210 structurally related pollutants (135 CDF <strong>and</strong> 75 CDD), <strong>and</strong> the toxicity <strong>of</strong> themost highly studied dibenzo-p-dioxin, 2,3,7,8-TCDD. The TEF method is used as a reference inrelating the toxicity <strong>of</strong> the other 209 compounds (i.e., in terms <strong>of</strong> equivalent amounts <strong>of</strong>2,3,7,8-TCDD). This approach simplifies risk assessments, including assessments <strong>of</strong> exposure tomixtures <strong>of</strong> CDD <strong>and</strong> CDF such as incinerator flyash, hazardous wastes, contaminated soils, <strong>and</strong>biological media. In 1989, as a result <strong>of</strong> the active involvement <strong>of</strong> EPA in an international effortaimed at adopting a common set <strong>of</strong> TEFs, a set <strong>of</strong> TEFs were agreed upon <strong>and</strong> implemented <strong>and</strong>were called International TEFs/89 (I-TEFs/89). Toxicity estimates, expressed in terms <strong>of</strong> toxicequivalents (TEQs), or equivalent amounts <strong>of</strong> 2,3,7,8-TCDD, are generated by using the TEF toconvert the concentration <strong>of</strong> a given CDD/CDF into an equivalent concentration <strong>of</strong>2,3,7,8-TCDD. The I-TEQs/89 are obtained by applying the I-TEFs/89 to the congener-specificdata <strong>and</strong> summing the results. Some emission factors <strong>and</strong> the national emission totals in thisdocument are presented as TEQs.Table ES-1 presents national emissions estimates <strong>of</strong> 2,3,7,8,-TCDD,2,3,7,8-TCDF, <strong>and</strong> 2,3,7,8-TCDD toxic equivalent (TEQs). As shown in the table, nationalemissions for 2,3,7,8-TCDD, 2,3,7,8-TCDF, <strong>and</strong> 2,3,7,8-TCDD TEQ are estimated to be0.085 pounds, 1.01 pounds, <strong>and</strong> 4.30 pounds, respectively.iv
TABLE ES-1. NATIONAL DIOXIN AND FURAN EMISSIONS aU.S. <strong>Emissions</strong> (lb/yr)cSource Categoryb 2,3,7,8-TCDD 2,3,7,8-TCDF 2,3,7,8-TCDD TEQBase Year <strong>of</strong>EstimatedMunicipal Waste Combustion NA NA 1.61 1995-2 -1 -1Residential Coal Combustion 1.16x10 3.05x10 4.68x10 1990-1Secondary Aluminum Smelters NA NA 3.8x10 1990-1Medical Waste Incineration NA NA 3.32x10 1995e -2 -2 -1Utility Coal Combustion 2.8x10 6.8x10 3.0x10 1990-3 -3 -1Industrial Wood Combustion 6.65x10 9.51x10 2.25x10 1990-3 -1 -1On-road Mobile <strong>Sources</strong> 8.06x10 1.27x10 1.98x10 1992-1Forest Fires NA NA 1.90x10 1989-1Portl<strong>and</strong> Cement: Hazardous Waste NA NA 1.3x10 1996Portl<strong>and</strong> Cement: Non-Hazardous NA NA-11.2x10 1990Waste Fired KilnsWood Treatment NA NA-27.62x10 1988-4 -2 -2Residential Wood Combustion 8.62x10 3.01x10 6.76x10 1990-4 -1 -2Sewage Sludge Incineration 9.5x10 3.42x10 5.29x10 1992-4 -2 -2Hazardous Waste Incineration 2.40x10 2.73x10 4.9x10 1992-3 -2 -2Iron <strong>and</strong> Steel Foundries 2.52x10 8.08x10 3.75x10 1990e -3 -3 -2Utility Residual Oil Combustion 8.00x10 5.80x10 2.2x10 1990-2 -2Secondary Copper Smelters 1.36x10 e 1.36x10 1990-3 -2 -3Secondary Lead Smelters 1.95x10 1.20x10 8.49x10 1990Residential Distillate Fuel Combustion-32.82x10-32.67x10-37.57x10 1990Lightweight Aggregate Kilns NA NA-36.92x10 1996(Hazardous waste-fired)Pulp <strong>and</strong> Paper- Kraft Recovery NA NA-46.84x10 1990FurnacesWaste Tire Incineration-51.19x10-52.98x10-45.94x10 1990Drum <strong>and</strong> Barrel-52.12x10-43.70x10-45.01x10 1990Reclamation/IncinerationCarbon Regeneration/ Reactivation-51.51x10-59.77x10-42.49x10 1990-8 -7Crematories 1.83x10 1.33x10 NAIndustrial Waste Incineration NA NA NAMunicipal Solid Waste L<strong>and</strong>fills NA NA NAOrganic Chemical Manufacturing NA NA NAPCB Fires NA NA NAScrap Metal Incineration NA NA NA-2Total 8.53x10 1.01 4.30a Estimates presented here are those that were available at the time this document was published. Ongoing efforts <strong>and</strong>studies by the U.S. EPA will most likely generate new estimates <strong>and</strong> the reader should contact the EnvironmentalProtection Agency for the most recent estimates.b Source categories are ranked in the order <strong>of</strong> their contribution to total 2,3,7,8-TCDD TEQ emissions.c Emission estimates are in pounds per year. To convert to kilograms per year, multiply by 0.454.d This is the year that the emissions estimate represents.e The value presented for this source category is a draft estimate <strong>and</strong> has not yet been finalized by the EPA.NA = Not Availablev
Some <strong>of</strong> the estimates for the non-fuel combustion sources were obtained <strong>from</strong>reports submitted under the Superfund Amendment <strong>and</strong> Reauthorization Act (SARA), Title III,Section 313. Other estimates were either calculated <strong>from</strong> national activity data <strong>and</strong> the bestavailable emission factor, or taken <strong>from</strong> other existing EPA inventories such as those preparedunder a Maximum Achievable Control Technology (MACT) st<strong>and</strong>ard development program (e.g.,the national emissions estimate for municipal waste combustors).In addition to dioxin <strong>and</strong> furan source <strong>and</strong> emissions information, several sampling<strong>and</strong> analytical methods are provided that have been employed for determining CDD <strong>and</strong> CDFemissions.vi
TABLE OF CONTENTSSectionPageList <strong>of</strong> Tables ....................................................... xiiList <strong>of</strong> Figures ...................................................... xvi1.0 PURPOSE OF DOCUMENT .......................................... 1-12.0 OVERVIEW OF DOCUMENT CONTENTS .............................. 2-13.0 BACKGROUND .................................................... 3-13.1 NATURE OF POLLUTANT ..................................... 3-13.2 FORMATION OF CHLORINATED DIBENZO-p-DIOXINS ANDCHLORINATED DIBENZOFURANS ............................. 3-63.2.1 Combustion Factors Affecting Dioxin/Furan <strong>Emissions</strong> ............ 3-7Incomplete Destruction <strong>of</strong> CDD/CDF in Fuel ................... 3-8In-Furnace Formation ..................................... 3-8Downstream Formation .................................... 3-93.3 TOXIC EQUIVALENCY CONCEPTS AND METHODOLOGY ......... 3-93.4 OVERVIEW OF EMISSIONS ................................... 3-114.0 EMISSIONS SOURCES .............................................. 4-14.1 WASTE INCINERATION ....................................... 4-14.1.1 Municipal Waste Combustion ............................... 4-2Process Descriptions ...................................... 4-2Emission Control Techniques .............................. 4-14Emission Factors ........................................ 4-17Source Locations ....................................... 4-174.1.2 Medical Waste Incineration ................................ 4-21Process Descriptions ..................................... 4-21Emission Control Techniques .............................. 4-26Emission Factors ........................................ 4-28Source Locations ....................................... 4-284.1.3 Sewage Sludge Incineration ............................... 4-33Process Description ..................................... 4-34Emission Control Techniques .............................. 4-39vii
TABLE OF CONTENTS, continuedSectionPageEmission Factors ........................................ 4-40Source Locations ....................................... 4-414.1.4 Hazardous Waste Incineration .............................. 4-41Process Descriptions ..................................... 4-47Emission Control Techniques .............................. 4-50Emission Factors ........................................ 4-50Source Locations ....................................... 4-524.1.5 Industrial Waste Incineration ............................... 4-54Process Description ..................................... 4-54Emission Control Techniques .............................. 4-55Emission Factors ........................................ 4-55Source Locations ....................................... 4-564.2 COMBUSTION OF SOLID AND LIQUID FUELS IN STATIONARYSOURCES FOR HEAT AND POWER GENERATION ............... 4-564.2.1 Utility Sector .......................................... 4-58Process Description ..................................... 4-58Emission Control Techniques .............................. 4-59Emission Factors ........................................ 4-59Source Locations ....................................... 4-594.2.2 Industrial Sector ........................................ 4-62Process Description ..................................... 4-62Emission Control Techniques .............................. 4-67Emission Factors ........................................ 4-68Bleached Kraft Mill Sludge Burning in Wood-FiredBoilers ............................................... 4-71Source Locations ....................................... 4-724.2.3 Residential Sector ....................................... 4-72Process Description ..................................... 4-73Emission Control Techniques .............................. 4-74Emission Factors ........................................ 4-76Source Locations ....................................... 4-814.2.4 Waste Tire Incineration ................................... 4-81Process Description ..................................... 4-82Emission Control Techniques .............................. 4-82Emission Factors ........................................ 4-82Source Locations ....................................... 4-83viii
TABLE OF CONTENTS, continuedSectionPage4.3 CREMATORIES ................................................... 4-834.3.1 Process Description ..................................... 4-834.3.2 Emission Factors ........................................ 4-844.3.3 Source Location ........................................ 4-874.4 IRON AND STEEL FOUNDRIES/SCRAP METAL MELTING ......... 4-874.4.1 Process Description ..................................... 4-874.4.2 Emission Control Techniques .............................. 4-914.4.3 Emission Factors ........................................ 4-924.4.4 Source Location ........................................ 4-944.5 COMBUSTION-AIDED METAL RECOVERY ..................... 4-944.5.1 Secondary Copper Smelters ............................... 4-95Process Description ..................................... 4-95Emission Control Techniques .............................. 4-98Emission Factors ........................................ 4-984.5.2 Secondary Aluminum Production ........................... 4-99Process Description .................................... 4-101<strong>Emissions</strong> ............................................ 4-1074.5.3 Secondary Lead Production .............................. 4-110Process Description .................................... 4-110Emission Control Techniques ............................. 4-122Emission Factors ....................................... 4-1244.5.4 Scrap Metal Incinerators ................................. 4-125Process Description .................................... 4-127Emission Control Techniques ............................. 4-129Emission Factors ....................................... 4-1294.5.5 Drum <strong>and</strong> Barrel Reclamation Furnaces ..................... 4-130Process Description .................................... 4-130Emission Control Techniques ............................. 4-133Emission Factors ....................................... 4-133Source Locations ...................................... 4-1334.6 PULP AND PAPER PRODUCTION - KRAFT RECOVERY BOILERS .. 4-1354.6.1 Process Description .................................... 4-1354.6.2 Emission Control Techniques ............................. 4-1414.6.3 Emission Factors ....................................... 4-1414.6.4 Source Locations ...................................... 4-1424.7 ON-ROAD MOBILE SOURCES ................................ 4-1424.7.1 Process Description .................................... 4-1444.7.2 Emission Control Techniques ............................. 4-147ix
TABLE OF CONTENTS, continuedSectionPage4.7.3 Emission Factors ....................................... 4-1474.7.4 Source Locations ...................................... 4-1484.8 CARBON REGENERATION .................................. 4-1494.8.1 Process Description .................................... 4-1504.8.2 Emission Control Techniques ............................. 4-1544.8.3 <strong>Emissions</strong> <strong>and</strong> Emission Factors ........................... 4-1554.8.4 Source Locations ...................................... 4-1604.9 OPEN BURNING AND ACCIDENTAL FIRES .................... 4-1604.9.1 Forest Fires <strong>and</strong> Agricultural Burning ....................... 4-160Process Description .................................... 4-160Emission Factors ....................................... 4-161Source Locations ...................................... 4-1624.9.2 Miscellaneous Open Refuse Burning <strong>and</strong> Structure Fires ......... 4-163Process Description .................................... 4-163Emission Factors ....................................... 4-1644.9.3 Polychlorinated Biphenyls Fires ............................ 4-164Process Description .................................... 4-164<strong>Emissions</strong> Data ........................................ 4-165Source Locations ...................................... 4-1664.10 MUNICIPAL SOLID WASTE LANDFILLS ....................... 4-1664.10.1 Process Description .................................... 4-1674.10.2 Emission Control Techniques ............................. 4-1684.10.3 Emission Factors ....................................... 4-1694.11 ORGANIC CHEMICALS MANUFACTURE AND USE ............. 4-1694.11.1 General Chemical Formation Mechanisms .................... 4-1694.11.2 Chlorophenols ......................................... 4-172Chlorophenol Use ...................................... 4-174Dioxin <strong>and</strong> Furan Contamination in the Manufacture<strong>and</strong> Use <strong>of</strong> Chlorophenols .......................... 4-1744.11.3 Brominated Compounds ................................. 4-1794.12 PORTLAND CEMENT PRODUCTION .......................... 4-1804.12.1 Process Description .................................... 4-1804.12.2 Emission Control Techniques ............................. 4-1854.12.3 Emission Factors ....................................... 4-1874.12.4 Source Locations ...................................... 4-187x
TABLE OF CONTENTS, continuedSectionPage5.0 SOURCE TEST PROCEDURES ........................................ 5-15.1 SAMPLE COLLECTION ....................................... 5-15.2 SAMPLE RECOVERY AND PREPARATION ....................... 5-65.3 QUANTITATIVE ANALYSIS ................................... 5-86.0 REFERENCES ..................................................... 6-1APPENDIX AMETHODS FOR ESTIMATING NATIONAL CDD/CDF EMISSIONSxi
LIST OF TABLESTablePage3-1 Possible CDD <strong>and</strong> CDF Isomers ......................................... 3-33-2 Physical <strong>and</strong> Chemical Properties <strong>of</strong> Selected <strong>Dioxins</strong> <strong>and</strong> Furans ................ 3-43-3 International Toxicity Equivalency Factors/89 (I-TEFs/89) .................... 3-123-4 National 2,3,7,8-TCDD <strong>Emissions</strong> ...................................... 3-143-5 National 2,3,7,8-TCDF <strong>Emissions</strong> ...................................... 3-153-6 National 2,3,7,8-TCDD TEQ <strong>Emissions</strong> .................................. 3-164-1 Average CDD/CDF Emission Factors for Municipal Waste Combustors .......... 4-184-2 Summary <strong>of</strong> Geographical Distribution <strong>of</strong> MWC Facilities .................... 4-204-3 CDD Emission Factors for Controlled-Air Medical WasteIncinerators ....................................................... 4-294-4 CDF Emission Factors for Controlled-Air Medical WasteIncinerators ....................................................... 4-314-5 CDD <strong>and</strong> CDF Emission Factors for Rotary Kiln Medical WasteIncinerators ....................................................... 4-334-6 CDD <strong>and</strong> CDF Emission Factors for Multiple-Hearth Sewage Sludge Incinerators .. 4-424-7 CDD <strong>and</strong> CDF Emission Factors for Fluidized-Bed Sewage Sludge Incinerators ... 4-464-8 Summary <strong>of</strong> Total CDD/CDF Concentrations Measured at Hazardous WasteThermal Destruction Facilities ......................................... 4-514-9 CDD/CDF Emission Factors for a Hazardous Waste Incinerator BurningPCB-Contaminated Sediments ......................................... 4-534-10 CDD/CDF Emission Factors for an Industrial Waste Incinerator ............... 4-57xii
LIST OF TABLES, continuedTablePage4-27 CDD/CDF Emission Factors for Secondary Lead Smelting ................... 4-1264-28 CDD/CDF Flue Gas Concentrations <strong>and</strong> Emission Factors for a ScrapWire <strong>and</strong> Transformer Incinerator ..................................... 4-1314-29 CDD/CDF Emission Concentrations <strong>and</strong> Emission Factors for a Drum <strong>and</strong> BarrelReclamation Facility ................................................ 4-1344-30 Summary <strong>of</strong> Total CDD/CDF <strong>Emissions</strong> <strong>and</strong> Emission Factors <strong>from</strong> KraftRecovery Furnaces ................................................. 4-1434-31 Distribution <strong>of</strong> Kraft Pulp Mills in the United States (1997) .................. 4-1444-32 Emission Factors for On-Road Mobile <strong>Sources</strong> ........................... 4-1494-33 Types <strong>of</strong> Equipment Used for Activated Carbon Regeneration ................ 4-1524-34 CDD/CDF Concentrations in the Flue Gas <strong>and</strong> Ash <strong>from</strong> a Fluidized-bedCarbon Regeneration Furnace ........................................ 4-1564-35 CDD/CDF Concentrations <strong>and</strong> Emission Factors for a HorizontalInfrared Carbon Regeneration Furnace .................................. 4-1574-36 CDD/CDF <strong>Emissions</strong> Data <strong>from</strong> a Multiple-Hearth Carbon Regeneration Furnace . 4-1584-37 Carbon Regeneration Furnace Emission Factors ........................... 4-1594-38 Estimates <strong>of</strong> the Number <strong>and</strong> Type <strong>of</strong> PCB-Containing ElectricalEquipment in the United States (1988) .................................. 4-1674-39 Emission Factors <strong>from</strong> a L<strong>and</strong>fill Gas Combustion System ................... 4-1704-40 Some Commercial Chlorophenol Products <strong>and</strong> Derivatives that may beContaminated with <strong>Dioxins</strong> or Furans ................................... 4-1754-41 Dioxin Contaminants Associated with Chlorobenzenes ...................... 4-1794-42 Industrial Brominated Compounds ..................................... 4-181xiv
LIST OF TABLES, continuedTablePage4-43 Brominated Compounds with the Potential for BDD/BDF Formation ........... 4-1834-44 CDD/CDF Emission Factors for Dry Process Portl<strong>and</strong> Cement Kilns ........... 4-1884-45 CDD/CDF Emission Factors for Wet Process Portl<strong>and</strong> Cement Kilns ........... 4-1914-46 Summary <strong>of</strong> Portl<strong>and</strong> Cement Plant Capacity Information ................... 4-1935-1 Comparison <strong>of</strong> MM5 <strong>and</strong> SASS Characteristics ............................. 5-4xv
LIST OF FIGURESFigurePage4-1 Typical Mass Burn Waterwall Combustor ................................. 4-44-2 Typical Mass Burn Rotary Waterwall Combustor ............................ 4-64-3 Typical Modular Starved-Air Combustor with Transfer Rams .................. 4-94-4 Typical Modular Excess-Air Combustor .................................. 4-104-5 Typical RDF-Fired Spreader Stoker Boiler ................................ 4-124-6 Fluidized-Bed Combustor ............................................ 4-154-7 Controlled-Air Incinerator ............................................ 4-224-8 Excess-Air Incinerator ............................................... 4-244-9 Rotary Kiln Incinerator .............................................. 4-274-10 Cross Section <strong>of</strong> a Typical Multiple Hearth Furnace ......................... 4-354-11 Cross Section <strong>of</strong> an Electric Infrared Furnace .............................. 4-384-12 One-Cell Dutch Oven-Type Boiler ...................................... 4-644-13 Schematic Process Flow Diagram for a Dutch Oven Boiler .................... 4-654-14 Simplified Diagram <strong>of</strong> a Freest<strong>and</strong>ing Noncatalytic Woodstove ................ 4-754-15 Process Flow Diagram for a Typical S<strong>and</strong>-Cast Iron <strong>and</strong> Steel Foundry .......... 4-894-16 Emission Points in a Typical Iron <strong>and</strong> Steel Foundry ........................ 4-904-17 Secondary Copper Recovery Process Flow Diagram ........................ 4-964-18a Process Diagram for a Typical Secondary Aluminum Processing Industry ....... 4-1024-18b Process for a Typical Secondary Aluminum Processing Industry ............... 4-1034-19 APROS Delacquering <strong>and</strong> Preheating Process ............................ 4-105xvi
LIST OF FIGURES, continuedFigurePage4-20 Simplified Process Flow Diagram for Secondary Lead Smelting ............... 4-1134-21 Cross-sectional View <strong>of</strong> a Typical Stationary Reverberatory Furnace ........... 4-1154-22 Cross-section <strong>of</strong> a Typical Blast Furnace ................................ 4-1184-23 Side-view <strong>of</strong> a Typical Rotary Reverberatory Furnace ...................... 4-1204-24 Cross-sectional View <strong>of</strong> an Electric Furnace for Processing Slag .............. 4-1234-25 Scrap Metal Incinerator Process Flow Diagram ........................... 4-1284-26 Drum <strong>and</strong> Barrel Incinerator Process Flow Diagram ........................ 4-1324-27 Typical Kraft Pulping <strong>and</strong> Recovery Process ............................. 4-1364-28 Direct Contact Evaporator Recovery Furnace ............................ 4-1384-29 Nondirect Contact Evaporator Recovery Furnace .......................... 4-1394-30 Cross-Section <strong>of</strong> a Typical Multiple-Hearth Furnace ....................... 4-1514-31 Process Flow Diagram <strong>of</strong> Carbon Regeneration Process ..................... 4-1534-32 Mechanisms for Halogenated Dioxin <strong>and</strong> Furan Production .................. 4-1714-33 Dioxin Concentration Versus Temperature ............................... 4-1734-34 Schematic Drawing <strong>of</strong> a Pressure Treating Plant ........................... 4-1784-35 Process Diagram <strong>of</strong> Portl<strong>and</strong> Cement Manufacturing by Dry Processwith Preheater .................................................... 4-1865-1 Modified Method 5 Sampling Train Configuration ........................... 5-25-2 Schematic <strong>of</strong> a SASS Train ............................................ 5-3xvii
SECTION 1.0PURPOSE OF DOCUMENTThe Environmental Protection Agency (EPA) <strong>and</strong> State <strong>and</strong> local air pollutioncontrol agencies are becoming increasingly aware <strong>of</strong> the presence <strong>of</strong> substances in the ambient airthat may be toxic at certain concentrations. This awareness has led to attempts to identifysource/receptor relationships for these substances <strong>and</strong> to develop control programs to regulatetoxic emissions. Unfortunately, very little information is available on the ambient airconcentrations <strong>of</strong> these substances or on the sources that may be discharging them to theatmosphere.To assist groups interested in inventorying air emissions <strong>of</strong> various potentiallytoxic substances, EPA is preparing a series <strong>of</strong> documents that compiles available information onsources <strong>and</strong> emissions. Existing documents in the series are listed below. In addition, newdocuments currently under development will address lead <strong>and</strong> lead compounds, <strong>and</strong> arsenic.Substance or Source CategoryAcrylonitrileBenzene (under revision)1,3-ButadieneCadmiumCarbon TetrachlorideChlorobenzenes (revised)Chlor<strong>of</strong>ormEPA Publication NumberEPA-450/4-84-007aEPA-450/4-84-007qEPA-454/R-96-008EPA-454/R-93-040EPA-450/4-84-007bEPA-454/R-93-044EPA-450/4-84-007c1-1
Substance or Source CategoryChromiumChromium (supplement)Coal <strong>and</strong> Oil Combustion <strong>Sources</strong>Cyanide CompoundsEpichlorohydrinEthylene OxideEthylene DichlorideFormaldehydeManganeseMedical Waste IncineratorsMercury <strong>and</strong> Mercury CompoundsMethyl Chlor<strong>of</strong>ormMethyl Ethyl KetoneMethylene ChlorideMunicipal Waste CombustorsNickelOrganic Liquid Storage TanksPerchloroethylene <strong>and</strong> TrichloroethylenePhosgenePolychlorinated Biphenyls (PCB)Polycyclic Organic Matter (POM)(under revision)Sewage Sludge IncinerationStyreneTolueneVinylidene ChlorideXylenesEPA Publication NumberEPA-450/4-84-007gEPA-450/2-89-002EPA-450/2-89-001EPA-454/R-93-041EPA-450/4-84-007jEPA-450/4-84-007lEPA-450/4-84-007dEPA-450/2-91-012EPA-450/4-84-007hEPA-454/R-93-053EPA-453/R-93-023EPA-454/R-93-045EPA-454/R-93-046EPA-454/R-93-006EPA-450/2-89-006EPA-450/4-84-007fEPA-450/4-88-004EPA-450/2-90-013EPA-450/4-84-007iEPA-450/4-84-007nEPA-450/4-84-007pEPA-450/2-90-009EPA-454/R-93-011EPA-454/R-93-047EPA-450/4-84-007kEPA-454/R-93-0481-2
This document deals specifically with chlorinated dibenzo-p-dioxins (CDD) <strong>and</strong>chlorinated dibenz<strong>of</strong>urans (CDF). Its intended audience includes federal, state <strong>and</strong> local airpollution personnel <strong>and</strong> others who are interested in locating potential emitters <strong>of</strong> dioxins <strong>and</strong>/orfurans <strong>and</strong> in making gross emissions estimates.The available data on some potential sources <strong>of</strong> CDD/CDF emissions are limited<strong>and</strong> the configurations <strong>of</strong> many sources will not be the same as those described here. Therefore,this document is best used as a primer to inform air pollution personnel about: (1) the types <strong>of</strong>sources that may emit CDD/CDF, (2) process variations that may be expected within thesesources, <strong>and</strong> (3) available emissions information that indicates the potential for CDD/CDF to bereleased into the air <strong>from</strong> each operation.The reader is strongly cautioned against using the emissions information containedin this document to try to develop an exact assessment <strong>of</strong> emissions <strong>from</strong> any particular facility.Available data are insufficient to develop statistical estimates <strong>of</strong> the accuracy <strong>of</strong> these emissionfactors, so no estimate can be made <strong>of</strong> the error that could result when these factors are used tocalculate emissions <strong>from</strong> any given facility. It is possible, in some cases, that order-<strong>of</strong>-magnitudedifferences could result between actual <strong>and</strong> calculated emissions, depending on differences insource configurations, control equipment, <strong>and</strong> operating practices. Thus, in situations where anaccurate assessment <strong>of</strong> CDD/CDF emissions is necessary, source-specific information should beobtained to confirm the existence <strong>of</strong> particular emitting operations, the types <strong>and</strong> effectiveness <strong>of</strong>control measures, <strong>and</strong> the impact <strong>of</strong> operating practices. A source test should be considered asthe best means to determine air emissions directly <strong>from</strong> a facility or operation.An effort was made during the development <strong>of</strong> this report to compare information<strong>and</strong> data with recently published reports, collectively referred to as the Dioxin ReassessmentReports by the Office <strong>of</strong> Health <strong>and</strong> Environmental Assessment ([OHEA]; this <strong>of</strong>fice is nownamed the National Center for Environmental Assessment), U.S. Environmental ProtectionAgency, Washington, DC. The data presented in this document were, for the most part,1-3
developed <strong>from</strong> the same information sources <strong>and</strong> are consistent between the two reports as wellas with the most recent version <strong>of</strong> EPA's Compilation <strong>of</strong> Air Pollutant Emission Factors(AP-42). 1As st<strong>and</strong>ard procedure, L&E documents are sent to government, industry, <strong>and</strong>environmental groups wherever EPA is aware <strong>of</strong> expertise. These groups are given theopportunity to review a document, comment, <strong>and</strong> provide additional data where applicable.Although this document has undergone extensive review, there may still be shortcomings.Comments subsequent to publication are welcome <strong>and</strong> will be addressed in future revisions <strong>and</strong> inrelated products based on available time <strong>and</strong> resources. In addition, any comments on thecontents or usefulness <strong>of</strong> this document are welcome, as is any information on processdescriptions, operating practices, control measures, <strong>and</strong> emissions information that would enableEPA to update <strong>and</strong> improve the document's contents. All comments should be sent to:Dallas SafrietEmission Factor <strong>and</strong> Inventory Group (MD-14)Office <strong>of</strong> Air Quality Planning <strong>and</strong> St<strong>and</strong>ardsU. S. Environmental Protection AgencyResearch Triangle Park, North Carolina 277111-4
SECTION 2.0OVERVIEW OF DOCUMENT CONTENTSAs noted in Section 1.0, the purpose <strong>of</strong> this document is to assist federal, state,<strong>and</strong> local air pollution agencies <strong>and</strong> others who are interested in locating potential air emitters <strong>of</strong>CDD/CDF <strong>and</strong> making preliminary estimates <strong>of</strong> air emissions there<strong>from</strong>. Because <strong>of</strong> the limitedbackground data available, the information summarized in this document does not <strong>and</strong> should notbe assumed to represent the source configuration or emissions associated with any particularfacility.This section provides an overview <strong>of</strong> the contents <strong>of</strong> this document. It brieflyoutlines the nature, extent, <strong>and</strong> format <strong>of</strong> the material presented in the remaining sections.Section 3.0 <strong>of</strong> this document provides a brief summary <strong>of</strong> the physical <strong>and</strong>chemical characteristics <strong>of</strong> CDD/CDF, their basic formation mechanisms, a brief discussion <strong>of</strong>toxic equivalency (TEQ) concepts <strong>and</strong> methodology, <strong>and</strong> a summary <strong>of</strong> national CDD/CDFemissions expressed as TEQs.Section 4.0 focuses on major sources <strong>of</strong> CDD/CDF air emissions. The followinggroups <strong>of</strong> emission sources are presented: waste incineration; combustion <strong>of</strong> solid <strong>and</strong> liquid fuelsin stationary sources for heat <strong>and</strong> power generation; crematories; iron <strong>and</strong> steel foundries;combustion-aided metal recovery; kraft pulp <strong>and</strong> paper production - black liquor combustion;internal combustion engines; carbon regeneration; open burning <strong>and</strong> accidental fires; municipalsolid waste l<strong>and</strong>fills; organic chemicals manufacture <strong>and</strong> use; <strong>and</strong> Portl<strong>and</strong> cement production.2-1
Within each group, there may be several unique but related sources. For each air emission sourcedescribed in Section 4.0, a discussion <strong>of</strong> the process, potential emission control techniques,available emission factor information, <strong>and</strong> source location information are summarized. Because<strong>of</strong> limited information, emission factors could not be developed for all the air emission sourcespresented. Further, those emission factors presented vary in their representativeness <strong>of</strong> the airemission source they describe. Each section should be read carefully to ensure an underst<strong>and</strong>ing<strong>of</strong> the basis for the emission factors presented.Section 5.0 summarizes available procedures for source sampling <strong>and</strong> analysis <strong>of</strong>CDD/CDF. EPA does not prescribe nor endorse any non-EPA sampling or analytical procedurepresented in Section 5.0. Consequently, this document merely provides an overview <strong>of</strong> applicablesource sampling procedures, citing references for those interested in conducting source tests.References are listed in Section 6.0.Appendix A provides a brief description <strong>of</strong> the basis for the national emissionestimates appearing in Section 3.0. For each source, the emission estimation technique isdescribed <strong>and</strong> an example calculation, if applicable, is included.Each emission factor listed in Section 4.0 was assigned an emission factor qualityrating (A, B, C, D, E, or U) based on the criteria for assigning data quality ratings <strong>and</strong> emissionfactor ratings as required in the document Technical Procedures for Developing AP-42 Emission2Factors <strong>and</strong> Preparing AP-42 Sections. The criteria for assigning the quality ratings to sourcetest data are as follows:A - Rated. Test(s) was performed by a sound methodology <strong>and</strong> reported inenough detail for adequate validation. These tests are not necessarily EPAreference test methods, although such reference methods are certainly to be usedas a guide.B - Rated. Test(s) was performed by a generally sound methodology but lackedenough detail for adequate validation.2-2
C - Rated. Test(s) was based on a nonvalidated or draft methodology or lacked asignificant amount <strong>of</strong> background data.D - Rated. Test(s) was based on a generally unacceptable method but may providean order-<strong>of</strong>-magnitude value for the source.Once the (data) quality ratings for the source tests had been assigned, these ratingsalong with the number <strong>of</strong> source tests available for a given emission point were evaluated.Because <strong>of</strong> the almost impossible task <strong>of</strong> assigning a meaningful confidence limit to industryspecificvariables (e.g., sample size versus sample population, industry <strong>and</strong> facility variability,method <strong>of</strong> measurement), the use <strong>of</strong> a statistical confidence interval for establishing arepresentative emission factor for each source category was not practical. Therefore, somesubjective quality rating was necessary. The following rating system was used to describe thequality <strong>of</strong> emission factors in this document.A - Excellent. The emission factor was developed only <strong>from</strong> A-rated test datataken <strong>from</strong> many r<strong>and</strong>omly chosen facilities in the industry population. The sourcecategory is specific enough to minimize variability within the source categorypopulation.B - Above average. The emission factor was developed only <strong>from</strong> A-rated testdata <strong>from</strong> a reasonable number <strong>of</strong> facilities. Although no specific bias is evident, itis not clear if the facilities tested represent a r<strong>and</strong>om sample <strong>of</strong> the industry. Aswith the A rating, the source category is specific enough to minimize variabilitywithin the source category population.C - Average. The emission factor was developed only <strong>from</strong> A- <strong>and</strong> B-rated testdata <strong>from</strong> a reasonable number <strong>of</strong> facilities. Although no specific bias is evident, itis not clear if the facilities tested represent a r<strong>and</strong>om sample <strong>of</strong> the industry. Aswith the A rating, the source category is specific enough to minimize variabilitywithin the source category population.D - Below average. The emission factor was developed only <strong>from</strong> A- <strong>and</strong> B-ratedtest data <strong>from</strong> a small number <strong>of</strong> facilities, <strong>and</strong> there may be reason to suspect thatthese facilities do not represent a r<strong>and</strong>om sample <strong>of</strong> the industry. There also maybe evidence <strong>of</strong> variability within the source category population.2-3
E - Poor. The emission factor was developed <strong>from</strong> C- <strong>and</strong> D-rated test data, <strong>and</strong>there may be reason to suspect that the facilities tested do not represent a r<strong>and</strong>omsample <strong>of</strong> the industry. There also may be evidence <strong>of</strong> variability within the sourcecategory population.U - Unrated or Unratable. The emission factor was developed <strong>from</strong> suspect datawith no supporting documentation to accurately apply an A through E rating. A"U" rating may be applied in the following circumstances: 3U1 = Mass Balance (for example, estimating air emissions basedon raw material input, product recovery efficiency, <strong>and</strong>percent control).U2 = Source test deficiencies (such as inadequate qualityassurance/quality control, questionable source test methods,only one source test).U3 = Technology transfer.U4 = Engineering judgement.U5 = Lack <strong>of</strong> supporting documentation.This document does not contain any discussion <strong>of</strong> health or other environmentaleffects <strong>of</strong> CDD/CDF emissions, nor does it include any discussion <strong>of</strong> ambient air levels <strong>of</strong>CDD/CDF.2-4
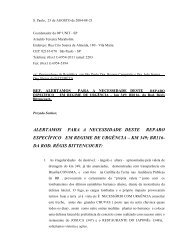
SECTION 3.0BACKGROUNDThis section discusses the nature <strong>of</strong> dioxins <strong>and</strong> furans, their formationmechanisms, <strong>and</strong> toxic equivalency concepts <strong>and</strong> methodology. A summary <strong>of</strong> national emissionslevels, expressed as TEQs, is also included in this section.3.1 NATURE OF POLLUTANTA dioxin is any compound that contains the dibenzo-p-dioxin nucleus. A furan isany compound that contains the dibenz<strong>of</strong>uran nucleus. The general formulas are shown below:Each <strong>of</strong> the positions numbered 1 through 4 <strong>and</strong> 6 through 9 can be substitutedwith a chlorine or other halogen atom, an organic radical, or, if no other substituent is indicated inthe formula or in its chemical name, a hydrogen atom.3-1
The only differences between members within a dioxin or a furan family are in thenature <strong>and</strong> position <strong>of</strong> substituents. Most environmental interest is with the chlorinated species <strong>of</strong>dioxins <strong>and</strong> furans which have very similar chemical properties. 4The term isomers refers to compounds with the same empirical formulas. Theterm homologues refers to compounds within the same series (e.g., CDD or CDF), but with adifferent number <strong>of</strong> chlorine atoms (i.e., tetra-CDD, penta-CDF, etc.). In all, there are75 possible CDD <strong>and</strong> 135 possible CDF. The number <strong>of</strong> possible isomers per number <strong>of</strong> chlorineatoms is given in Table 3-1.abbreviated as follows:Throughout this document the various homologues <strong>of</strong> CDD <strong>and</strong> CDF areT = tetraPe = pentaHx = hexaHp = heptaO = octaFor example, hexa-CDD is abbreviated as HxCDD.The CDD/CDF represent a series <strong>of</strong> homologues with volatility decreasing as thenumber <strong>of</strong> chlorine atoms incorporated into the molecules increases. Because <strong>of</strong> the general lack<strong>of</strong> solubility in water <strong>and</strong> overall low volatility, the CDD/CDF are far more likely to be found insoil or as condensed on particulate matter than as gaseous pollutants in the air. If the CDD/CDForiginate <strong>from</strong> a stationary source where elevated temperatures are encountered, the members <strong>of</strong>the series containing four or more chlorine atoms tend to occur mostly as condensible particulatematter, while the more volatile members <strong>of</strong> the series may exist in the gaseous state, dependingupon the exact conditions <strong>of</strong> temperature <strong>and</strong> particulate loading.3-2
TABLE 3-1. POSSIBLE CDD AND CDF ISOMERSNumber <strong>of</strong> Chlorine AtomsSource: Reference 4.Number <strong>of</strong> Possible CDDIsomersNumber <strong>of</strong> Possible CDFIsomers1 2 42 10 163 14 284 22 385 14 286 10 167 2 48 1 175 135Table 3-2 lists the chemical <strong>and</strong> physical properties <strong>of</strong> some dioxins <strong>and</strong> furans. Asindicated within the table, the physical properties <strong>of</strong> substituted dibenz<strong>of</strong>urans have not been wellinvestigated.CDD are white solids. The most toxic <strong>and</strong>, consequently, the most extensively4studied <strong>of</strong> the CDD, is 2,3,7,8-tetrachlorodibenzo-p-dioxin (TCDD). This compound isextremely lipophilic, exhibiting a high degree <strong>of</strong> solubility in fats, oils, <strong>and</strong> relatively nonpolarsolvents. 2,3,7,8-TCDD is only sparingly soluble in water.Most CDD are rather stable toward heat, acids, <strong>and</strong> alkalies, although heattreatment with an alkali (under conditions similar to alkaline extraction <strong>of</strong> tissue) completelydestroys OCDD. CDD begin to decompose at about 930 F (500 C), <strong>and</strong> at about 1470 F(800 C) virtually complete degradation <strong>of</strong> 2,3,7,8-TCDD occurs within 21 seconds. CDD aresusceptible to photodegradation in the presence <strong>of</strong> ultraviolet light, <strong>and</strong> undergo photoreductivedechlorination in the presence <strong>of</strong> an effective hydrogen donor. 63-3
TABLE 3-2. PHYSICAL AND CHEMICAL PROPERTIES OF SELECTED DIOXINS AND FURANS3-4CAS Molecular Molecular Boiling Point at 760 Vapor PressureCompound Reg. No. Formula Weight Description Melting Point ( oC) mmHg ( oC) (mmHg at 25oC)Dibenzo-p-dioxin 262-12-4 C12H8O2184.20 NA 122-123 NA 4.125x10-42,3,7,8-TCDD 1746-01-6 C12H4Cl4O2321.9 colorless needles 305-306 NA 7.4x10 -101,2,3,7,8-PeCDD 40321-76-4 C H Cl O 356.5 NA 240-241 NA NA12 3 5 21,2,3,6,7,8-HxCDD 57653-85-7 C H Cl O 390.9 NA 285-286 NA 3.6x10¹² 2 6 21,2,3,7,8,9-HxCDD 19408-74-3 C H Cl O 390.9 NA 243-244 NA NA12 2 6 2OCDD 3268-87-9 C12Cl8O2459.8 NA 330 NA NADibenz<strong>of</strong>uran 132-64-9 C12H8O 168.2 (1) crystalline solid 86-87 287 4.41x10⁻³(2) white crystals(3) leaf or needles <strong>from</strong> alcohol2,3,7,8-TCDF 51207-31-9 C12H4Cl4O 306.0 NA 226-228 NA 2.0x10⁻⁶ a2,4,6,8-TCDF NA C12H4Cl4O 306.0 NA 198-200 NA 2.5x10⁻⁶ aOCDF 39001-02-0 C12Cl8O 443.8 NA 253-254bNA 0.19x10⁻⁶ a11Source: References 4 <strong>and</strong> 5
TABLE 3-2. PHYSICAL AND CHEMICAL PROPERTIES OF SELECTED DIOXINS AND FURANS (CONTINUED)3-5Vapor(chlor<strong>of</strong>orm)Compound Density Density (g/mL) (nm)1/E c Solubilities Other Chemical/Physical Propertiesmax cDibenzo-p-dioxin NA NA 293 199.8 1 ppm at 25oC NA2,3,7,8-TCDD NA NA 310 173.6 1.4 g/L in 0-dichlorobenzene TCDD can be formed by pyrolysis0.72 g/L in chlorobenzene at 500oC for 5 hr <strong>of</strong> sodium alpha-0.57 g/L in benzene (2,4,5-trichlorophenoxy) proprionate0.37 g/L in chlor<strong>of</strong>orm0.11 g/L in acetone0.048 g/L in n-Octanol0.01 g/L in methanol2x10 -7 g/L in water1,2,3,7,8-PeCDD NA NA 308 171.4 NA NA1,2,3,6,7,8-HxCDD NA NA 316 152 NA NA1,2,3,7,8,9-HxCDD NA NA 317 104 NA NAOCDD NA NA NA NA 1.83 g/L in o-dichlorobenzene NA0.56 g/L in chlor<strong>of</strong>orm0.38 g/L in dioxaneDibenz<strong>of</strong>uran 5.8 1.0886 (at 99oC) 217 (alcohol) 4.5 (log E) 10 ppm in H O (25o2 C)Soluble in hot benzene, alcohol,NAacetone, ether, acetic acid2,3,7,8-TCDF NA NA 257,294,310,323 NA 4.38 g/L(H O) e22,3,7,8-TCDF (in trichloromethane soln.)exhibits ultraviolet absorption maxs at 309<strong>and</strong> 316 nm2,4,6,8-TCDF NA NA 259,309,316 NA NA NAOCDF NA NA NA NA NA NASource: References 4 <strong>and</strong> 5abcCalculated value.Experimental value.This is the wavelength <strong>of</strong> maximum absorption.d This is the absorption coefficient for a 1% chlor<strong>of</strong>orm solution <strong>of</strong> substrate in l cm cell at the max. To convert this to the molar absorption coefficient (M-1 c m-1), multiply by o ne-tenth <strong>of</strong> themolecular weight.e Estimated value.NA = Not Available
Dibenz<strong>of</strong>uran is relatively stable toward alkalies <strong>and</strong> acids. The pyrolysis <strong>of</strong> thiscompound for 1.4 seconds in nitrogen at 0.6 atmosphere <strong>and</strong> 1536 F (830 C) caused only54.5 percent decomposition, <strong>and</strong> no decomposition is observed below 1536 F (830 C). Theproducts <strong>of</strong> decomposition are toluene, styrene, indene, durene, naphthalene, water, hydrogen,carbon, o-ethylphenol <strong>and</strong> polyphenyl ether. Alkyl- or halogen-substituted dibenz<strong>of</strong>urans areexpected to be less soluble in water <strong>and</strong> more soluble in organic solvents than dibenz<strong>of</strong>uranbecause these compounds are less polar than dibenz<strong>of</strong>uran.3.2 FORMATION OF CHLORINATED DIBENZO-p-DIOXINS ANDCHLORINATED DIBENZOFURANSCDD <strong>and</strong> CDF have no known technical use <strong>and</strong> are not intentionally produced.They are formed as unwanted byproducts <strong>of</strong> certain chemical processes during the manufacture <strong>of</strong>7chlorinated intermediates <strong>and</strong> in the combustion <strong>of</strong> chlorinated materials. The chlorinatedprecursors include polychlorinated biphenyls (PCB), polychlorinated phenols, <strong>and</strong> polyvinylchloride (PVC).The manufacture <strong>of</strong> chlorophenols <strong>and</strong> the reaction <strong>of</strong> chlorophenols withchlorobenzenes yield CDD as byproducts. Polyvinyl chloride is known to give a small yield <strong>of</strong>chlorobenzene on pyrolysis, <strong>and</strong> chlorobenzenes themselves pyrolize in the presence <strong>of</strong> air to yieldCDD <strong>and</strong> CDF. Polychlorinated phenols give CDD at high temperatures, <strong>and</strong> PCB produce CDF8on laboratory pyrolysis in the presence <strong>of</strong> air. Possible routes <strong>of</strong> formation <strong>of</strong> CDD <strong>and</strong> CDF areillustrated in the diagram on the next page.In the case <strong>of</strong> pyrolysis or combustion <strong>of</strong> chlorinated phenols, the absence <strong>of</strong>oxygen stimulates the production <strong>of</strong> CDD, indicating that the yield <strong>of</strong> CDD is the netresult <strong>of</strong> thermal decomposition <strong>of</strong> polychlorinated phenols to water, carbon dioxide, etc., <strong>and</strong> the8thermal formation <strong>of</strong> CDD precursors.3-6
y living organisms.There is no evidence to suggest that dioxins <strong>and</strong> furans are formed biosynthetically3.2.1 Combustion Factors Affecting Dioxin/Furan <strong>Emissions</strong>There are three general mechanisms that can result in emissions <strong>of</strong> CDD/CDF <strong>from</strong>combustion systems: (1) incomplete destruction <strong>of</strong> CDD/CDF present in the fuel source duringthe combustion process, (2) in-furnace formation <strong>of</strong> CDD/CDF <strong>from</strong> "precursor" materials, <strong>and</strong>(3) low temperature downstream formation in the flue gas ductwork or across the air pollutioncontrol device. An overview <strong>of</strong> the combustion factors affecting CDD/CDF emissions ispresented below.3-7
Incomplete Destruction <strong>of</strong> CDD/CDF in FuelCDD/CDF have been detected in several materials (fuels) during combustion. Ifthe combustion process is inefficient, a portion <strong>of</strong> the CDD/CDF in these materials can escape<strong>from</strong> the combustion system <strong>and</strong> be emitted into the atmosphere. However, the fuel-<strong>and</strong>-airmixing processes <strong>and</strong> temperatures in most combustion systems are sufficient to destroy most <strong>of</strong>the CDD/CDF that may be in the original material. Exceptions to this are structural fires in whichCDD/CDF contaminated building materials exist, or small combustors (e.g., wood stoves or fireplaces) where combustion conditions may be non-ideal. Based on the operating characteristics <strong>of</strong>most combustion systems <strong>and</strong> the low levels <strong>of</strong> CDD/CDF in most materials, emissions <strong>of</strong>CDD/CDF due to incomplete destruction during combustion are expected to be small comparedto the other two mechanisms.In-Furnace FormationIn-furnace formation refers to the formation <strong>of</strong> CDD/CDF during the combustionprocess. During combustion, various ring-structure hydrocarbon species (referred to as"precursors") are formed as intermediate reaction products. If chlorine is also present, thesespecies can react with each other to form CDD/CDF. The most frequently identified precursors9are chlorobenzenes, chlorophenols, <strong>and</strong> chlorinated biphenyls. CDD/CDF may also be formed<strong>from</strong> the reaction <strong>of</strong> complex organic molecules <strong>and</strong> chlorine. Several studies have identifiedstrong correlations between chlorine content <strong>and</strong> CDD/CDF emissions during combustion tests. 9In-furnace formation <strong>of</strong> CDD/CDF is also related to combustion practices.CDD/CDF are generally formed in greater quantities during combustion upsets or when mixing <strong>of</strong>air <strong>and</strong> combustible hydrocarbon is poor, since higher levels <strong>of</strong> organics can escape the furnace atthese times. Good correlations exist between CO <strong>and</strong> CDD/CDF when CO emissions are high, asCO generally indicates poor combustion. Insufficient mixing among air, fuel, <strong>and</strong> combustionproducts has been identified as an important cause <strong>of</strong> increased CDD/CDF formation. The3-8
potential for release <strong>of</strong> CDD/CDF <strong>from</strong> the combustion chamber is minimized by operating thefurnace to achieve low CO levels. 9,10Downstream FormationRecent studies have shown that CDD/CDF also forms downstream <strong>of</strong> the furnacein ductwork or in air pollution control devices. Available data indicate that aromatic structuresassociated with carbon in the fly ash can be converted to CDD/CDF through reactions withinorganic chlorine. This process is referred to as "de novo" synthesis. CDD/CDF are generallyformed through de novo synthesis at temperatures ranging <strong>from</strong> 392 F to 932 F (200 C to500 C), with maximum formation rates occurring near 572 F (300 C). Several studies havebeen conducted on CDD/CDF downstream formation in MWCs <strong>and</strong> are discussed in greaterdetail in Section 4.1 <strong>of</strong> this report.3.3 TOXIC EQUIVALENCY CONCEPTS AND METHODOLOGYThe toxicity equivalency factor (TEF) method is an interim procedure for assessingthe risks associated with exposures to complex mixtures <strong>of</strong> CDD/CDF. This method relates thetoxicity <strong>of</strong> the 210 structurally related chemical pollutants (135 CDF <strong>and</strong> 75 CDD) <strong>and</strong> is basedon limited data available <strong>from</strong> in vivo <strong>and</strong> in vitro toxicity testing. The toxicity <strong>of</strong> the most highlystudied dibenzo-p-dioxin, 2,3,7,8-TCDD, is used as a reference in relating the toxicity <strong>of</strong> the other209 compounds (i.e., in terms <strong>of</strong> equivalent amounts <strong>of</strong> 2,3,7,8-TCDD). This approach simplifiesrisk assessments, including assessments <strong>of</strong> exposure to mixtures <strong>of</strong> CDD <strong>and</strong> CDF such as11incinerator flyash, hazardous wastes, contaminated soils, <strong>and</strong> biological media. In 1989, as aresult <strong>of</strong> the active involvement <strong>of</strong> EPA in an international effort aimed at adopting a common set11<strong>of</strong> TEFs, International TEFs/89, or I-TEFs/89, were implemented. The concepts <strong>and</strong>methodologies are presented in this document only because some emission factors <strong>and</strong> nationalemission totals were found in the literature as TEQs.3-9
A strong structure-activity relationship exists between the chemical structure <strong>of</strong> aparticular CDD/CDF homologue <strong>and</strong> its ability to elicit a biological/toxic response in variousin vivo <strong>and</strong> in vitro test systems. Congeners in which the 2,3,7, <strong>and</strong> 8 lateral positions areoccupied with chlorines (the "2,3,7,8-substituted homologues") are much more active than theother homologues (the "non-2,3,7,8-substituted homologues"). 11Available data on short-term in vitro toxicity studies for CDD/CDF are used tosupplement the lack <strong>of</strong> long-term in vivo results for these compounds. These toxicity estimates,expressed in terms <strong>of</strong> toxic equivalents (TEQs), or equivalent amounts <strong>of</strong> 2,3,7,8-TCDD, aregenerated by using the TEF to convert the concentration <strong>of</strong> a given CDD/CDF into an equivalentconcentration <strong>of</strong> 2,3,7,8-TCDD. The I-TEQs/89 are obtained by applying the I-TEFs/89 to thecongener-specific data <strong>and</strong> summing the results. In assigning TEFs, priority is normally given tothe results <strong>from</strong> long-term studies followed by the results <strong>from</strong> short-term, whole-animal studies.Among the remaining short-term in vivo <strong>and</strong> in vitro data, the results <strong>of</strong> enzyme induction studiestake high priority because a good correlation has generally been observed between enzymeinduction activity <strong>and</strong> short-term, whole-animal results. 11The I-TEF/89 approach expresses the TEFs as a rounded order <strong>of</strong> magnitudebecause, with the exception <strong>of</strong> the I-TEF/89 for PeCDF, the I-TEFs/89s are only crudeapproximations <strong>of</strong> relative toxicities. A value <strong>of</strong> 0.5 is assigned to 2,3,4,7,8-PeCDF;1,2,3,7,8-PeCDF is assigned a value <strong>of</strong> 0.05. This higher value for the 2,3,4,7,8-PeCDF issupported by data <strong>from</strong> in vivo <strong>and</strong> in vitro studies <strong>and</strong> is the only instance in which theI-TEFs/89s depart <strong>from</strong> the guiding principle <strong>of</strong> simplicity in which TEFs are expressed asrounded orders <strong>of</strong> magnitude. The I-TEF/89 scheme assigns a value <strong>of</strong> zero tonon-2,3,7,8-substituted homologues.In general, an assessment <strong>of</strong> the human health risk <strong>of</strong> a mixture <strong>of</strong> CDD <strong>and</strong> CDFusing the TEF approach involves the following steps: 111. Analytical determination <strong>of</strong> the CDD <strong>and</strong> CDF in the sample.3-10
2. Multiplication <strong>of</strong> homologue concentrations in the sample by TEFs toexpress the concentration in terms <strong>of</strong> 2,3,7,8-TCDD equivalents.3. Summation <strong>of</strong> the products in Step 2 to obtain the total 2,3,7,8-TCDDequivalents in the sample.4. Determination <strong>of</strong> human exposure to the mixture in question, expressed interms <strong>of</strong> 2,3,7,8-TCDD equivalents.5. Combination <strong>of</strong> exposure <strong>from</strong> Step 4 with toxicity information on2,3,7,8-TCDD (usually carcinogenicity <strong>and</strong>/or reproductive effects) toestimate risks associated with the mixture.In cases where the concentrations <strong>of</strong> homologues are known:2,3,7,8-TCDD Equivalents =(TEF <strong>of</strong> each 2,3,7,8-CDD/CDF homologue)x the concentration <strong>of</strong> the respective homologue+ (TEF <strong>of</strong> each non-2,3,7,8-CDD/CDF homologue)x the concentration <strong>of</strong> the respective homologueTable 3-3 lists I-TEFs/89s for some CDD <strong>and</strong> CDF.3.4 OVERVIEW OF EMISSIONSCDD <strong>and</strong> CDF are not chemically manufactured but are byproducts <strong>of</strong> certainchemical processes during the manufacture <strong>of</strong> chlorinated intermediates <strong>and</strong> in the combustion <strong>of</strong>chlorinated materials. <strong>Sources</strong> <strong>of</strong> CDD/CDF emissions include waste incineration, stationary fuelcombustion, crematories, metal foundries <strong>and</strong> recovery facilities, kraft pulp <strong>and</strong> paper production,internal combustion engines, carbon regeneration, biomass burning, organic chemicalmanufacture, <strong>and</strong> Portl<strong>and</strong> cement manufacture. These sources <strong>of</strong> CDD/CDF emissions aredescribed in Section 4.0 <strong>of</strong> this document.3-11
TABLE 3-3. INTERNATIONAL TOXICITY EQUIVALENCY FACTORS/89(I-TEFs/89)HomologueI-TEFs/892,3,7,8-TCDD 11,2,3,7,8-PeCDD 0.51,2,3,4,7,8-HxCDD 0.11,2,3,7,8,9-HxCDD 0.11,2,3,6,7,8-HxCDD 0.11,2,3,4,6,7,8-HpCDD 0.01OCDD 0.0012,3,7,8-TCDF 0.12,3,4,7,8-PeCDF 0.51,2,3,7,8-PeCDF 0.051,2,3,4,7,8-HxCDF 0.11,2,3,6,7,8-HxCDF 0.11,2,3,7,8,9-HxCDF 0.12,3,4,6,7,8-HxCDF 0.11,2,3,4,6,7,8-HpCDF 0.011,2,3,4,7,8,9-HpCDF 0.01OCDF 0.001Source: Reference 11.3-12
National emission estimates for each category/subcategory were developed usingone <strong>of</strong> two basic approaches. The first, <strong>and</strong> preferred approach was to utilize emission estimatesdeveloped by the Emission St<strong>and</strong>ards Division (ESD)/ Office <strong>of</strong> Air Quality Planning <strong>and</strong>St<strong>and</strong>ards (OAQPS) project teams responsible for developing Maximum Achievable ControlTechnology (MACT) st<strong>and</strong>ards, or other EPA projects where in-depth evaluation <strong>and</strong>characterization <strong>of</strong> the source categories were conducted (e.g., Secondary Lead SmeltingNESHAP Program). The second approach was to use category-specific national activity data(throughput, production, fuel use, etc.), emission factors, <strong>and</strong> available information on industrycharacteristics <strong>and</strong> control levels to develop a national emission estimate. The availability <strong>and</strong>overall quality <strong>of</strong> national activity data varies by category. Preferred sources <strong>of</strong> national activitydata are trade associations <strong>and</strong> statistics compiled by various government entities (the EPA,Department <strong>of</strong> Energy, Energy Information Administration [EIA]). Emission factors derived<strong>from</strong> actual source test data were used wherever possible. An attempt was made to utilizeemission factors that reflect the st<strong>and</strong>ard emission control methods used by each source category.In addition, supplemental information on three source categories was included based on findingsin a recent OHEA (now named the National Center for Environmental Assessment) study.Several national emission estimates were taken <strong>from</strong> recent studies by the Office <strong>of</strong>Air Quality Planning <strong>and</strong> St<strong>and</strong>ards, <strong>and</strong> some <strong>of</strong> the results are expressed in units <strong>of</strong> EPA-TEQs.The EPA adopted the International Methodology in 1989; thus, any data presented as anEPA-TEQ should be equivalent to an International (I)-TEQ value.Estimates <strong>of</strong> national CDD/CDF emissions are shown in Tables 3-4 through 3-6.Tables 3-4 through 3-6 present the national emissions <strong>of</strong> 2,3,7,8-TCDD, 2,3,7,8-TCDF, <strong>and</strong>2,3,7,8-TCDD TEQ for each source category, respectively. The source categories are presentedin the order <strong>of</strong> their relative contributions to the total pollutant emissions. Appendix A describesthe basis for the estimates. For some source categories discussed in this document, data were notavailable to estimate national emissions, <strong>and</strong> are so noted within Tables 3-4 through 3-6 <strong>and</strong> inAppendix A.3-13
Source Categoryb2,3,7,8-TCDD<strong>Emissions</strong> (lb/yr)cBase Year <strong>of</strong>EstimatedUtility Coal Combustione 2.8x10 -2 1990Secondary Copper Smelters 1.36x10 -2 1990Residential Coal Combustion 1.16x10 -2 1990On-road Mobile <strong>Sources</strong> 8.06x10 -3 1992Utility Residual Oil Combustione 8.00x10 -3 1990Industrial Wood Combustion 6.65x10 -3 1990Residential Distillate Fuel Combustion 2.82x10 -3 1990Iron <strong>and</strong> Steel Foundries 2.52x10 -3 1990Secondary Lead Smelters 1.95x10 -3 1990Sewage Sludge Incineration 9.5Ex10 -4 1992Residential Wood Combustion 8.62x10 -4 1990Hazardous Waste Incineration 2.40x10 -4 1992Drum <strong>and</strong> Barrel 2.12x10 -5 1990Carbon Regeneration /Reactivation 1.51x10 -5 1990Waste Tire Incineration 1.19x10 -5 1990Crematories 1.83x10 -8 1991Forest FiresNALightweight Aggregate KilnsNAMedical Waste IncinerationNAMunicipal Waste CombustionNAPortl<strong>and</strong> Cement: Non-HazardousNAPortl<strong>and</strong> Cement: Hazardous WasteNAPulp <strong>and</strong> Paper- Kraft RecoveryNASecondary Aluminum SmeltersNAWood TreatmentNAIndustrial Waste IncinerationNAMunicipal Solid Waste L<strong>and</strong>fillsNAOrganic Chemical ManufacturingNAPCB FiresNAScrap Metal IncinerationNATotal 8.53x10 -2a Estimates presented here are those that were available at the time this document was published. Ongoing efforts <strong>and</strong> studies by the U.S.EPA will most likely generate new estimates <strong>and</strong> the reader should contact the Environmental Protection Agency for the most recentestimates.bcdeSource categories are ranked in the order <strong>of</strong> their contribution to total 2,3,7,8-TCDD emissions.Emission estimates are in pounds per year. To convert to kilograms per year, multiply by 0.454.This is the year that the emissions estimate represents.The value presented for this source category is a draft estimate <strong>and</strong> has not yet been finalized by the EPA.NA = Not Available.TABLE 3-4. NATIONAL 2,3,7,8-TCDD EMISSIONS a3-14
Source CategorybTABLE 3-5. NATIONAL 2,3,7,8-TCDF EMISSIONS a2,3,7,8-TCDF<strong>Emissions</strong> (lb/yr)cBase Year <strong>of</strong>EstimatedSewage Sludge Incineration 3.42x10 -1 1992Residential Coal Combustion 3.05x10 -1 1990On-road Mobile <strong>Sources</strong> 1.27x10 -1 1992Iron <strong>and</strong> Steel Foundries 8.08x10 -2 1990Utility Coal Combustione 6.80x10 -2 1990Residential Wood Combustion 3.01x10 -2 1990Hazardous Waste Incineration 2.73x10 -2 1992Secondary Lead Smelters 1.20x10 -2 1990Industrial Wood Combustion 9.51x10 -3 1990Utility Residual Oil Combustione 5.80x10 -3 1990Residential Distillate Fuel Combustion 2.68x10 -3 1990Drum <strong>and</strong> Barrel Reclamation/Incineration 3.70x10 -4 1990Carbon Regeneration /Reactivation 9.78x10 -5 1990Waste Tire Incineration 2.98x10 -5 1990Crematories 1.33x10 -7 1991Forest FiresNALightweight Aggregate Kilns (HazardousNAMedical Waste IncinerationNAMunicipal Waste CombustionNAPortl<strong>and</strong> Cement: Hazardous Waste FiredNAPortl<strong>and</strong> Cement: Non-Hazardous WasteNAPulp <strong>and</strong> Paper- Kraft Recovery FurnacesNASecondary Aluminum SmeltersNASecondary Copper SmeltersNAWood TreatmentNAIndustrial Waste IncinerationNAMunicipal Solid Waste L<strong>and</strong>fillsNAOrganic Chemical ManufacturingNAPCB FiresNAScrap Metal IncinerationNATotal 1.01abcdeEstimates presented here are those that were available at the time this document was published. Ongoing efforts <strong>and</strong> studies by the U.S.EPA will most likely generate new estimates <strong>and</strong> the reader should contact the Environmental Protection Agency for the most recentestimates.Source categories are ranked in the order <strong>of</strong> their contribution to total 2,3,7,8-TCDF emissions.Emission estimates are in pounds per year. To convert to kilograms per year, multiply by 0.454.This is the year that the emissions estimate represents.The value presented for this source category is a draft estimate <strong>and</strong> has not yet been finalized by the EPA.NA = Not Available.3-15
Source CategorybTABLE 3-6. NATIONAL 2,3,7,8-TCDD TEQ EMISSIONS a2,3,7,8-TCDD TEQ<strong>Emissions</strong> (lb/yr)cBase Year <strong>of</strong>EstimatedMunicipal Waste Combustion 1.61 1995Residential Coal Combustion 4.68x10 -1 1990Secondary Aluminum Smelters 3.8x10 -1 1990Medical Waste Incineration 3.32x10 -1 1995Utility Coal Combustione 3.0x10 -1 1990Industrial Wood Combustion 2.25x10 -1 1990On-road Mobile <strong>Sources</strong> 1.98x10 -1 1992Forst Fires 1.90x10 -1 1989Portl<strong>and</strong> Cement: Hazardous Waste Fired 1.3x10 -1 1996Portl<strong>and</strong> Cement: Non-Hazardous Waste 1.2x10 -1 1990Wood Treatment 7.62x10 -2 1988Residential Wood Combustion 6.76x10 -2 1990Sewage Sludge Incineration 5.29x10 -2 1992Hazardous Waste Incineration 4.9x10 -2 1992Iron <strong>and</strong> Steel Foundries 3.75x10 -2 1990Utility Residual Oil Combustione 2.2x10 -2 1990Secondary Copper Smelters 1.36x10 -2 1990Secondary Lead Smelters-fired) 8.49x10 -3 1990Residential Distillate Fuel Combustion 7.57x10 -3 1990Lightweight Aggregate Kilns (Hazardous 6.92x10 -3 1996Pulp <strong>and</strong> Paper-Kraft Recovery Furnaces 6.84x10 -4 1990Waste Tire Incineration Recovery Furnaces 5.94x10 -4 1990Drum <strong>and</strong> Barrel Reclamation/Incineration 5.01x10 -4 1990Carbon Regeneration/Reactivation 2.49x10 -4 1990CrematoriesNAIndustrial Waste IncinerationNAMunicipal Solid Waste L<strong>and</strong>fillsNAOrganic Chemical ManufacturingNAPCB FiresNAScrap Metal IncinerationNATotal 4.30abcdeEstimates presented here are those that were available at the time this document was published. Ongoing efforts <strong>and</strong> studies by the U.S.EPA will most likely generate new estimates <strong>and</strong> the reader should contact the Environmental Protection Agency for the most recentestimates.Source categories are ranked in the order <strong>of</strong> their contribution to total 2,3,7,8-TCDD TEQ emissions.Emission estimates are in pounds per year. To convert to kilograms per year, multiply by 0.454.This is the year that the emissions estimate represents.The value presented for this source category is a draft estimate <strong>and</strong> has not yet been finalized by the EPA.NA = Not Available.3-16
It should also be noted that estimates for some source categories were available for2,3,7,8-TCDD TEQ only (see Tables 3-4, 3-5, <strong>and</strong> 3-6) due to the limited amount <strong>of</strong> information(such as activity data or an emission factor in non-TEQ units) available at the time this documentwas prepared.For the municipal waste combustion <strong>and</strong> medical waste incineration categories,results <strong>from</strong> recent EPA MACT st<strong>and</strong>ard development studies are presented. The new estimatesidentify a baseline dioxin level for estimated dioxin emissions for 1995. The new estimates forthese categories are based on an extensive database <strong>and</strong> are considered by EPA to be the mostaccurate estimates available at this time. 12,13EPA's Office <strong>of</strong> Research <strong>and</strong> Development (ORD) has received emissions data foron-road mobile sources that are more current than the data presented in this document <strong>and</strong> is inthe process <strong>of</strong> developing emission factors <strong>from</strong> the data. When ORD completes their evaluation<strong>of</strong> the data, the emission factors will be publicly available.3-17
SECTION 4.0EMISSIONS SOURCES<strong>Sources</strong> <strong>of</strong> atmospheric emissions <strong>of</strong> CDD/CDF are described in this section.Many <strong>of</strong> the source categories discussed in this section emit CDD/CDF <strong>from</strong> a fuel combustionprocess. Process descriptions <strong>and</strong> flow diagrams are included in the discussions as appropriate.Emission factors for the processes are presented when available, <strong>and</strong> control technologies <strong>and</strong>source locations are described.There are few emission control techniques that are dedicated solely to reducingCDD/CDF emissions, <strong>and</strong> therefore data on the effectiveness <strong>of</strong> control strategies in reducingCDD/CDF emissions are limited. In many cases, the emission factor data available are for bothcontrolled <strong>and</strong> uncontrolled processes <strong>and</strong>/or units, <strong>and</strong> are presented within this section, whereavailable.4.1 WASTE INCINERATIONThis section discusses CDD/CDF emissions <strong>from</strong> waste incineration. Types <strong>of</strong>waste incineration that are potential sources <strong>of</strong> CDD/CDF emissions include (1) municipal wastecombustion, (2) medical waste incineration, (3) sewage sludge incineration, (4) hazardous wasteincineration, <strong>and</strong> (5) industrial waste incineration. The following sections provide descriptions <strong>of</strong>these processes <strong>and</strong> present associated emission factors.4-1
4.1.1 Municipal Waste CombustionMunicipal wastes are combusted primarily to reduce waste volume before disposal.Municipal waste combustion is used as an alternative to l<strong>and</strong>filling; heat energy recovery may alsobe associated with the process. The wastes burned in municipal waste combustors (MWCs) comeprimarily <strong>from</strong> residential sources; however, in some areas, commercial <strong>and</strong> industrial sourcescontribute significant quantities to the total waste load. 14There are approximately 160 MWC facilities with capacities greater than1535 megagrams per day (Mg/day) [39 tons per day (tpd)]. Smaller facilities serve specializedneeds such as prisons <strong>and</strong> remote communities where conditions are unsuitable for l<strong>and</strong>fills. Thissection focuses on MWCs with capacities greater than or equal to 35 Mg/day (39 tpd) <strong>of</strong>municipal solid waste (MSW) because this population represents the majority <strong>of</strong> MWC facilities inthe United States. Also, emission information on the smaller facilities is limited.Process DescriptionsThe majority <strong>of</strong> MWCs can be grouped under three main design types: mass burn,modular, <strong>and</strong> refuse-derived fuel (RDF)-fired. Some MWCs fire only RDF, but RDF may also beco-fired with other fuels. A fourth type <strong>of</strong> MWC, fluidized-bed, is less common <strong>and</strong> can beconsidered a subset <strong>of</strong> the RDF technology. Within the three major combustor categories, thereare a number <strong>of</strong> different designs. The more common designs <strong>and</strong> their associated processes aredescribed in this section.Mass Burn Combustors--Mass burn combustors use gravity or mechanical ramsystems to feed MSW onto a moving grate where the waste is combusted. Historically, mass burncombustors have been used to combust MSW that has not been preprocessed except to removeitems too large to go through the feed system. Waste that has been processed to remove4-2
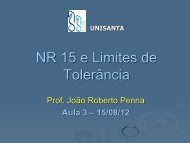
ecyclable materials can also be combusted in these units. Mass burn combustors range in size<strong>from</strong> 46 to 900 Mg/day (50 to 1000 tpd) <strong>and</strong> are assembled in the field. 16Mass burn combustors can be divided into mass burn/waterwall (MB/WW), massburn rotary waterwall combustors (MB/RC), <strong>and</strong> mass burn/refractory-wall (MB/REF) designs.Newer units are mainly waterwall designs, which are used to recover heat for production <strong>of</strong> steam<strong>and</strong>/or electricity.Mass Burn Waterwall Combustors: A typical MB/WW combustor is shown inFigure 4-1. Waste is delivered by an overhead crane to a feed hopper, which feeds the waste intothe combustion chamber. Most modern MB/WW facilities have reciprocating or roller grates thatmove the waste through the combustion chamber. The primary purpose <strong>of</strong> all types <strong>of</strong> grates is toagitate the waste bed to ensure good mixing <strong>of</strong> the waste with undergrate air <strong>and</strong> to move thewaste uniformly through the combustor.Combustion air is added to the waste <strong>from</strong> beneath each grate section throughunderfire air plenums. As the waste bed burns, overfire air is introduced through rows <strong>of</strong> highpressurenozzles located in the side walls <strong>of</strong> the combustor to oxidize hydrocarbon-rich gases <strong>and</strong>complete the combustion process. Properly designed <strong>and</strong> operated overfire air systems areessential for good mixing <strong>and</strong> burnout <strong>of</strong> organics in the flue gas.The combustor walls are constructed <strong>of</strong> metal tubes that contain pressurized water<strong>and</strong> recover radiant heat <strong>from</strong> the combustion chamber. Flue gases exiting the combustor passthrough additional heat recovery sections (i.e., superheater, economizer) <strong>and</strong> are then routed toone or more air pollution control devices such as an electrostatic precipitator (ESP).Typically, MB/WW MWCs are operated with 80 to 100 percent excess air, with25 to 40 percent <strong>of</strong> the total air supplied as overfire air <strong>and</strong> 60 to 75 percent as underfire air.4-3
OverheadCraneSteamDrumFeedBinWaterWallSectionGeneratorSuperheaterSteamEconomizerAirPollutionControlDevice4-4Forced DraftFanDryingGrateInduced DraftFanStackCombustionGrateBurnoutGrateFeed PitSecondaryFanRiddlingConveyorQuenchTankVibratingConveyorBeltConveyorTotalAshDischargeFigure 4-1. Typical Mass Burn Waterwall CombustorSource: Reference 16.
Mass Burn Rotary Waterwall Combustor: Figure 4-2 shows a typical MB/RCcombustor. Waste is conveyed to a feed chute <strong>and</strong> fed to the rotary combustion chamber. Therotary combustion chamber sits at a slight angle <strong>and</strong> rotates at about 10 revolutions per hour,causing the waste to advance <strong>and</strong> tumble as it burns. The combustion cylinder consists <strong>of</strong>alternating watertubes <strong>and</strong> perforated steel plates. 17Preheated combustion air enters the combustor through the perforated plates. Asthe combustor cylinder rotates, combustion air is introduced both through <strong>and</strong> above the wastebed. Combustion air is also supplied to the afterburning grate <strong>and</strong> through the overfire air jetslocated above the rotary combustor outlet in the boiler chamber. An MB/RC combustor normallyoperates at about 50 percent excess air.Heat recovery occurs in the rotary chamber water tubes, the boiler waterwall, thesuperheater, <strong>and</strong> in the economizer. From the economizer, the flue gas is routed to one or moreair pollution control devices.Mass Burn Refractory-Wall Combustors: Numerous MB/REF combustors were16in operation prior to 1970. The goal <strong>of</strong> these units was to achieve waste reduction; energyrecovery mechanisms were generally not incorporated into their design. By today's st<strong>and</strong>ards,these units were frequently poorly designed <strong>and</strong> operated <strong>and</strong>, as a result, had significantemissions <strong>of</strong> particulate matter (PM) <strong>and</strong> other pollutants. Because <strong>of</strong> environmental restrictionsimposed on large combustion devices by the EPA in the early 1970s, most MB/REF facilitiesclosed. Most <strong>of</strong> the approximately 25 MB/REF plants that still operate or that were built in the1970s <strong>and</strong> 1980s have installed ESPs to reduce PM emissions, <strong>and</strong> several have installed heatrecovery boilers. 17MB/REF combustors have several designs. One design involves a batch-fedupright combustor that may be cylindrical or rectangular in shape.4-5
SuperheaterSteamDrumConvectionSectionMSWFeedChuteFeedChuteThroatRadiantSectionWaterDrumEconomizer4-6ResistanceDoorShroudTireCombustorBarrelBranchPipeRingHeaderCoaxialLineFlueGasRamFeedingSystemRingHeaderWindboxAfterburningGrateRotaryJointSupportFrameWindboxHopperResidueConveyorFigure 4-2. Typical Mass Burn Rotary Waterwall CombustorSource: Reference 16.
This design does not provide for agitation or mixing <strong>of</strong> the waste. This type <strong>of</strong> combustor wasprevalent in the 1950s, but only three units were reported to be in operation in 1989. 17A second, more common design consists <strong>of</strong> rectangular combustion chambers withtraveling, rocking, or reciprocating grates. The traveling grate moves on a set <strong>of</strong> sprockets <strong>and</strong>provides agitation to the waste bed as it advances through the combustor. Waste burnout isinhibited by fuel-bed thickness <strong>and</strong> there is considerable potential for unburned waste to bedischarged into the bottom ash pit unless fuel feeding, grate speeds, <strong>and</strong> combustion air flows <strong>and</strong>distributions are well controlled. Some designs incorporate rocking or reciprocating grates thatagitate <strong>and</strong> aerate the waste bed as it advances through the combustor chamber, therebyimproving contact between the waste <strong>and</strong> combustion air <strong>and</strong> increasing the burnout <strong>of</strong>combustibles. A rotary kiln may be added to the end <strong>of</strong> the grate system to complete combustion.MB/REF combustors typically operate at higher excess air rates than do MB/WWcombustors. This is because MB/REF combustors do not contain a heat transfer medium such asthe waterwalls, thus requiring high excess air levels to prevent excessive temperatures <strong>and</strong>damage to the combustor.One adverse effect <strong>of</strong> higher excess air levels is the potential for increasedcarryover <strong>of</strong> PM <strong>from</strong> the combustion chamber <strong>and</strong>, therefore, increased stack emission rates. Itis hypothesized that high PM carryover may also contribute to increased CDD/CDF emissions byproviding increased surface area for downstream catalytic formation. Also, there is a potential forhigher excess air levels to quench the combustion reactions, thus reducing destruction <strong>of</strong> organicspecies.Modular Combustors--Modular combustors are similar to mass burn combustors inthat the waste burned has not been preprocessed, but modular combustors are generally smaller insize (4.5 to 103 Mg/day [5 to 140 tpd]) <strong>and</strong> are shop-fabricated. The most common type <strong>of</strong>modular combustor is the starved-air or controlled-air type (MOD/SA). Another type, which is4-7
similar <strong>from</strong> a combustion st<strong>and</strong>point to the larger MB/WW systems, is referred to as an excessaircombustor (MOD/EA).Modular Starved-Air Combustors: A typical MOD/SA combustor is shown inFigure 4-3. The basic design includes two separate combustion chambers, referred to as theprimary <strong>and</strong> secondary chambers. Waste is batch-fed to the primary chamber by a hydraulicallyactivated ram <strong>and</strong> is moved through the chamber by either hydraulic transfer rams or reciprocatinggrates. Waste retention times in the primary chamber are long, lasting up to 12 hours.Combustion air is introduced into the primary chamber at substoichiometric levels,corresponding to about 40 to 60 percent theoretical air <strong>and</strong> resulting in a flue gas rich in unburnedhydrocarbons. As the hot, hydrocarbon-rich gases flow to the secondary combustion chamber,they mix with excess air to complete the burning process. Additional combustion air is introducedas secondary air <strong>and</strong> results in excess air levels for the complete system <strong>of</strong> 80 to 150 percent.The walls <strong>of</strong> both the primary <strong>and</strong> secondary combustion chambers are refractorylined.Early MOD/SA combustors did not include heat recovery, but a waste heat boiler iscommon in newer units, with two or more combustion modules sometimes manifolded to a sharedboiler.The high combustion temperatures <strong>and</strong> mixing <strong>of</strong> flue gas with additional air in thesecondary combustion chamber provide good combustion, resulting in relatively low organicemissions. Because <strong>of</strong> the limited amount <strong>of</strong> combustion air introduced through the primarychamber, gas velocities in the primary chamber <strong>and</strong> the amount <strong>of</strong> entrained particulate are low.Thus, uncontrolled PM emissions <strong>from</strong> MOD/SA units are relatively low. As a result, manyexisting MOD/SA, especially the smaller ones, do not have air pollution controls.Modular Excess-Air Combustors: A typical MOD/EA MWC is shown inFigure 4-4. The basic design is similar to that <strong>of</strong> MOD/SA units <strong>and</strong> includes refractory-lined4-8
To Stack orWaste Heat BoilerSecondaryAirSecondaryChamberSecondaryGas Burner4-9FeedChutePrimaryGas BurnerWaste Tipping FloorFire DoorTransfer RamsPrimary ChamberRamFeederChargeHopperPrimary AirAshQuenchSource: Reference 16.Figure 4-3. Typical Modular Starved-Air Combustor with Transfer Rams
ControlRoomProcessRoomIsolationDamperFlue Gas Recirculation (FGR)ManifoldFGRMixingZoneO 2UnderfireAirTTertiaryChamberSecondaryChamber4-10TippingRoomHopperDoorHopperLoaderFiredoorWaterCooledRAM(s)Heat RecoveryPlenumTOverfireFGRUnderfireFGRReliefDoorAsh ConveyorAshTrough<strong>and</strong>ConveyorSource: Reference 16.Figure 4-4. Typical Modular Excess-Air Combustor
primary <strong>and</strong> secondary combustion chambers <strong>and</strong> a boiler to recover waste heat. Facilities withmultiple combustors may have a tertiary chamber where flue gases <strong>from</strong> each combustor aremixed prior to entering the heat recovery boiler.Unlike MOD/SA combustors, MOD/EA combustors typically operate at about100 percent excess air in the primary chamber, but may vary between 50 <strong>and</strong> 250 percent excessair. MOD/EA combustors also use recirculated flue gas for combustion air to maintain desiredtemperatures in the combustion chambers. Because <strong>of</strong> higher air velocities, PM emissions <strong>from</strong>MOD/EA combustors are higher than those <strong>from</strong> MOD/SA combustors.Refuse-Derived Fuel-Fired Combustors: RDF is MSW that has been processed tovarying degrees, <strong>from</strong> simple removal <strong>of</strong> bulky <strong>and</strong> noncombustible items accompanied byshredding, to extensive processing to produce a finely divided fuel suitable for co-firing inpulverized coal-fired boilers. Processing MSW to RDF generally raises the heating value <strong>of</strong> thewaste slightly because many <strong>of</strong> the noncombustible items have been removed.Individual RDF combustors range <strong>from</strong> about 290 to 1,270 Mg/day (320 to161,400 tpd) <strong>and</strong> they are field-erected. There are three major types <strong>of</strong> RDF-fired combustors:dedicated RDF combustors, coal/RDF co-fired combustors, <strong>and</strong> fluidized-bed combustors(FBCs). Each type is discussed in the following paragraphs.Dedicated Refuse-Derived Fuel-Fired Combustors: Most combustors that aredesigned to burn RDF as a primary fuel are boilers that use spreader-stokers <strong>and</strong> fire RDF in asemisuspension mode. A typical RDF spreader-stoker boiler is shown in Figure 4-5. RDF is fedinto the combustor through a feed chute using air-swept distributors, which allows a portion <strong>of</strong>the feed to burn in suspension <strong>and</strong> the remainder to burn out after falling on a horizontal4-11
SuperheaterBoilerTubesAirPollutionControlDevice4-12RDFFeedChuteOverfireAirGasFlowInducedDraft FanStackEconomizerRDFDistributorOverfireAirGas BurnersForcedDraft FanTravelingGrateAsh QuenchChamberUnderfireAirAsh RemovalSteam CoilAir PreheaterSource: Reference 16.Figure 4-5. Typical RDF-Fired Spreader Stoker Boiler
traveling grate. The traveling grate moves <strong>from</strong> the rear to the front <strong>of</strong> the furnace <strong>and</strong> distributorsettings are adjusted so that most <strong>of</strong> the waste l<strong>and</strong>s on the rear two-thirds <strong>of</strong> the grate. Thisallows more time for combustion to be completed on the grate. Underfire air <strong>and</strong> overfire air areintroduced to enhance combustion, <strong>and</strong> these combustors typically operate at 80 to 100 percentexcess air. Waterwall tubes, a superheater, <strong>and</strong> an economizer are used to recover heat forproduction <strong>of</strong> steam <strong>and</strong>/or electricity.Co-fired Combustors: RDF can be co-fired in various types <strong>of</strong> coal-fired boilers,including pulverized coal-fired <strong>and</strong> cyclone-fired boilers. In a pulverized coal-fired system, coal ispulverized into a powder <strong>and</strong> injected into the combustor through burners located on thecombustor walls. RDF with a particle size <strong>of</strong> 5 cm (2 in.) or less in diameter is introduced into thecombustor by air transport injectors that are located above or even with the coal injectors. Asignificant portion <strong>of</strong> the larger, partially burned particles become disengaged <strong>from</strong> the gas flow<strong>and</strong> fall onto grates at the bottom <strong>of</strong> the furnace where combustion is completed. MostRDF/pulverized coal-fired units operate with 50 percent excess air, in contrast to units firing coalalone, which may use as little as 25 percent excess air. Furnace exit temperatures are generally inexcess <strong>of</strong> 1,095 C (2,000 F), which is higher than in other MWCs. 16In an RDF/coal-fired, cyclone-fired combustor, crushed coal is injected into oneend <strong>of</strong> a horizontal combustion cylinder. Primary air (about 20 percent <strong>of</strong> the total combustionair) is introduced tangentially to the burner, which causes the coal to move in a swirling pattern.The RDF is injected into the combustion chamber along with the secondary air in the sametangential direction through ports in the top <strong>of</strong> the cylinder. The cyclone operates at temperaturesexceeding 1,370 C (2,500 F), which melts the coal <strong>and</strong> RDF ash into a liquid slag. Because <strong>of</strong>the swirling motion, most <strong>of</strong> the incoming coal <strong>and</strong> RDF gets caught in the slag layer on thecombustor walls, where it burns rapidly.4-13
Fluidized-Bed Combustors: In an FBC, waste is combusted in a turbulent bed <strong>of</strong>noncombustible material such as limestone, s<strong>and</strong>, silica, or aluminum. The RDF may be injectedinto or above the bed through ports in the combustor wall. Other wastes <strong>and</strong> supplemental fuelmay be blended with the RDF outside the combustor or added through separate openings. Thecombustion bed is suspended or "fluidized" through the introduction <strong>of</strong> underfire air at a high flowrate. Overfire air is used to complete the combustion process. Waste-fired FBCs typicallyoperate at 30 to 100 percent excess air levels <strong>and</strong> at bed temperatures around 815 C (1,500 F).A typical FBC is presented in Figure 4-6.Emission Control Techniques<strong>Emissions</strong> <strong>of</strong> CDD/CDF <strong>and</strong> other organics <strong>from</strong> MWCs are most effectivelycontrolled first by following good combustion practices (GCP) <strong>and</strong>, secondly by proper operation<strong>of</strong> an effective air pollution control system. GCP minimizes in-furnace dioxin generation,minimizes PM carryover, <strong>and</strong> minimizes low-temperature secondary formation <strong>of</strong> CDD/CDF.Minimizing in-furnace generation <strong>of</strong> CDD/CDF is accomplished by optimizing waste feedingprocedures, achieving adequate combustion temperatures, providing the proper amount <strong>and</strong>distribution <strong>of</strong> combustion air, <strong>and</strong> optimizing the mixing process. Following these practices willpromote complete combustion <strong>of</strong> the waste <strong>and</strong> destruction <strong>of</strong> CDD/CDF <strong>and</strong> other organics.Organics, including CDD/CDF, can exist in the vapor phase or can be condensedor absorbed onto fine particulate <strong>and</strong> exist as PM; therefore, minimization <strong>of</strong> PM carryover <strong>from</strong>the combustion chamber into the flue gas can result in a decrease in CDD/CDF emissions. PMcarryover can be minimized by maintaining appropriate operating load, combustion air flow rates,<strong>and</strong> air distributions. For a given combustor design, total air flows are directly related tooperating load because each combustor is designed to maintain a relatively constant excess airlevel. As operating load increases above design limits, air flows increase proportionally <strong>and</strong> thepotential for PM entrainment <strong>and</strong> carryover increases. Therefore, a limit on maximum operatingload can assist in minimizing CDD/CDF emissions. 174-14
Figure 4-6. Fluidized-Bed CombustorSource: Reference 18.4-15
Secondary CDD/CDF formation downstream <strong>from</strong> the furnace can occur in PMcontrol devices (e.g., ESPs). CDD/CDF formation can occur in the presence <strong>of</strong> excess oxygenover a wide range <strong>of</strong> temperatures, with maximum formation rates occurring near 570 F17(300 C). At temperatures above 570 F, thermal degradation <strong>of</strong> CDD/CDF can occur. Atlower temperatures, the rate <strong>of</strong> CDD/CDF formation decreases. At PM control devicetemperatures <strong>of</strong> 300 to 570 F (150 to 300 C), CDD/CDF concentrations vary by approximately afactor <strong>of</strong> two for each 86 F (30 C) change in temperature (e.g., reducing the operatingtemperature <strong>of</strong> the PM control device <strong>from</strong> 356 F (180 C) to 302 F (150 C) will reduceCDD/CDF emissions by a factor <strong>of</strong> approximately two. To reduce emissions <strong>of</strong> CDD/CDF, themaximum inlet temperature on the PM control device should be reduced to the lowest practicaloperating temperature, typically below 450 F (e.g., by using a spray dryer or water sprays incombination with the PM control device). 17Most MWCs constructed since the late 1980s have a spray dryer installedupstream <strong>of</strong> the PM control device to control acid gas emissions. The PM control deviceoperating temperature <strong>of</strong> these systems is typically 275 to 302 F (135 to 150 C). On someMWCs, duct sorbent injection (DSI) is used rather than a spray dryer. Depending on design <strong>and</strong>operating practices, the flue gas temperature entering the PM control device can be as low as248 F (120 C) or as high as 392 F (200 C). Because <strong>of</strong> the wide variation in the PM controldevice temperature <strong>of</strong> DSI systems, CDD/CDF emission factors can vary significantly.Based on recent testing programs, the EPA has found that additional CDD/CDFcontrol is achieved by injecting activated carbon into the flue gas. For example, during EPA testsat a commercial MWC, activated carbon injection achieved significant more CDD/CDF removalthan the reduction level achieved by a spray dryer/ESP scrubbing system alone. 194-16
Emission FactorsThe emission factors presented in Table 4-1 were developed <strong>from</strong> a compilation <strong>of</strong>data published on 107 separate test reports. Emission factors for uncontrolled <strong>and</strong> controlledlevels <strong>of</strong> operation based on various APCDs are included. For some types <strong>of</strong> units <strong>and</strong> APCDs,there is a large amount <strong>of</strong> data available, while other categories have little data. The readershould refer to the EPA Background Information Documents (BIDs) developed for the NSPS,which provide detailed analyses <strong>of</strong> specific unit performances capabilities, APCDs, <strong>and</strong> emissionslevels.The user <strong>of</strong> these emission factors should recognize that the values reported hereare averages <strong>and</strong> may not be representative <strong>of</strong> a particular facility. <strong>Emissions</strong> <strong>from</strong> MWCs mayvary significantly due to the composition <strong>of</strong> the waste, the extent <strong>of</strong> GCP, APCD operatingtemperatures, <strong>and</strong> various other factors.It is apparent <strong>from</strong> the data in Table 4-1 that CDD/CDF emissions vary greatlybetween combustor types. <strong>Emissions</strong> variability is attributable to widely differing wastecompositions being combusted, combustor operating practices, <strong>and</strong> control device effectiveness.Source LocationsOf the 160 MWCs with capacities greater than 36 Mg/day (40 tpd) in operation inthe United States, 53 percent are mass burn, 31 percent are modular, <strong>and</strong> 15 percent are RDF. Ofthe total MWC capacity in the United States (101,000 Mg/day [111,400 tpd]), about 69 percent is20in mass burn facilities, 26 percent in RDF facilities, <strong>and</strong> 5 percent in modular facilities.Table 4-2 presents the geographic distribution <strong>of</strong> facilities <strong>and</strong> their capacities.4-17
TABLE 4-1. AVERAGE CDD/CDF EMISSION FACTORS FOR MUNICIPAL WASTE COMBUSTORSakg/MgCombustor Type SCC Control Deviceblb/ton RefuseCombustedRefuseCombustedFactor QualityRating ReferenceMass Burn Waterwall 5-01-001-05/ Uncontrolled-61.7x10-78.4x10 A 165-03-001-125-01-001-05/ Electrostatic Precipitator-61.2x10-75.8x10 A 165-03-001-125-01-001-05/ Spray Dryer/Electrostatic-76.2x10-73.1x10 A 165-03-001-12 Precipitator-7 -85-01-001-05/ Duct Sorbent Injection/Fabric 1.6x10 8.0x10 C 165-03-001-12 Filterc5-01-001-05/ Spray Dryer/Fabric Filter-86.6x10-83.3x10 A 165-03-001-124-185-03-001-12 Duct Sorbent-74.8x10-72.4x10 E 12Injection/ElectrostaticPrecipitatorMass Burn/Rotary 5-01-001-06/ Duct Sorbent 9.2x10 4.6x10 D 16Waterwall 5-03-001-13 Injection/Fabric Filter c -8 -85-01-001-06/ Spray Dryer/Fabric-85.3x10-82.7x10 B 165-03-001-13 FilterMass Burn/Refractory 5-01-001-04/ Uncontrolled-51.5x10-67.5x10 D 16Wall 5-03-001-115-01-001-04/ Electrostatic-57.2x10-53.6x10 D 165-03-001-11 Precipitator5-03-001-11 Injection/ElectrostaticPrecipitator c5-01-001-04/ Duct Sorbent-74.6x10-72.3x10 E 16
TABLE 4-1. AVERAGE CDD/CDF EMISSION FACTORS FOR MUNICIPAL WASTE COMBUSTORS a (CONTINUED)lb/tonRefuse kg/Mg Refuse Factor QualityCombustor Type SCC Control DevicebCombusted Combusted Rating ReferenceModular/Excess Air 5-01-001-07/5- Electrostatic-62.2x10-61.1x10 C 1603-001-15 Precipitator5-01-001-07/5- Duct Sorbent 6.2x10 3.1x10 E 1603-001-15 Injection/Fabric Filter c -8 -8-6 -6RDF-fired 5-01-001-03 Uncontrolled 9.5x10 4.7x10 D 16Electrostatic-51.7x10-68.5x10 B 16Precipitator4-19Spray-71.1x10-85.3x10 D 16Dryer/ElectrostaticPrecipitatorSpray Dryer/Fabric-82.4x10-81.2x10 E 16FilterDuct Sorbent-61.3x10-76.7x10 E 12Injection/ElectrostaticPrecipitatorRDF-fired/Fluidized Bed 5-01-001-08 Duct Sorbent-76.2x10-73.1x10 E 12Injection/Electrified Gravel BedModular Starved Air 5-01-001-01/5- Uncontrolled-62.9x10-61.5x10 D 1603-001-145-01-001-01/5- Electrostatic-63.8x10-61.9x10 C 1603-001-14 Precipitator5-03-001-14 Duct Sorbent-86.5x10-83.2x10 E 12Injection/Fabric FilterabcEmission factors represent total TCDD/TCDF through OCDD/OCDF emissions.Uncontrolled = emissions measured at inlet to control device.Emission factors for duct sorbent injection systems are based on test data for systems with PM control device operating temperatures <strong>of</strong> approximately 390 F (200 C) for massburn/waterwall, 375 F (190 C) for mass burn/RC, 300 F (150 C) for mass burn/refractory wall, <strong>and</strong> 250 F (120 C) for modular/excess air. Emission factors can be adjustedT/30by a factor <strong>of</strong> two for each 86 F (30 C) change in actual temperature (adjusted EF = reported EF x 2 , where T is the temperature difference in C between the actual PMcontrol device temperature <strong>and</strong> the temperature upon which the reported EF is based).
TABLE 4-2. SUMMARY OF GEOGRAPHICAL DISTRIBUTION OF MWC FACILITIESState Number <strong>of</strong> Facilities State MWC Capacity (tpd)Percentage <strong>of</strong> Total MWC Capacity inthe United StatesAK 2 170
4.1.2 Medical Waste IncinerationMedical waste incineration is the burning <strong>of</strong> medical wastes produced by hospitalsor similar facilities such as veterinary facilities, <strong>and</strong> research facilities. Medical wastes includeboth infectious wastes <strong>and</strong> non-infectious, or housekeeping wastes.The primary purposes <strong>of</strong> medical waste incinerators (MWIs) are to render thewaste innocuous <strong>and</strong> to reduce the volume <strong>and</strong> mass <strong>of</strong> the waste. These objectives areaccomplished by: (1) exposing the waste to high temperatures over a sufficiently long period <strong>of</strong>time to destroy threatening organisms; <strong>and</strong> (2) burning the combustible portion <strong>of</strong> the waste. Thedisadvantages <strong>of</strong> incinerating medical wastes include the generation <strong>of</strong> ash requiring disposal <strong>and</strong>the potential release <strong>of</strong> air toxic emissions. 21Medical waste composition, like municipal solid waste, is highly variable. Thecomposition <strong>of</strong> medical waste is approximately 55 percent paper, 30 percent plastics, <strong>and</strong>10 percent water. 21Process DescriptionsThere are three major types <strong>of</strong> medical waste incinerators: (1) controlled-air, alsoknown as starved-air, (2) excess-air, <strong>and</strong> (3) rotary kiln. The majority <strong>of</strong> MWIs in use in theUnited States are controlled-air, with excess-air incinerators <strong>and</strong> rotary kilns comprising a smallpercentage. 22Controlled-Air Incinerators--Controlled-air incineration has become the mostwidely used MWI technology in recent years, <strong>and</strong> it now dominates the market for new systems athospitals <strong>and</strong> similar medical facilities. This technology is also known as starved-air incineration,two-stage incineration, <strong>and</strong> modular combustion. Figure 4-7 presents a typical controlled-airincinerator.4-21
Carbon Dioxide,Water Vapor<strong>and</strong> ExcessOxygen <strong>and</strong> Nitrogento AtmosphereAirAirMain Burner forMinimum CombustionTemperatureUpperChamberVolatile Contentis Burned inUpper ChamberExcess AirConditionStarved-AirCondition inLower ChamberLowerChamberControlledUnderfire Airfor BurningDown WasteWasteFeedFigure 4-7. Controlled-Air IncineratorSource: Reference 21.4-22
Combustion <strong>of</strong> waste in controlled-air incinerators occurs in two stages. In thefirst stage, waste is fed into the lower primary combustion chamber, which is operated atsubstoichiometric levels <strong>of</strong> air combustion--hence the name controlled-air. Combustion air isintroduced into the primary chamber beneath the incinerator hearth <strong>and</strong> below the burning bed <strong>of</strong>waste. This air is referred to as the primary or underfire air. In the primary chamber, themoisture content <strong>of</strong> the waste is reduced <strong>and</strong> the volatile components <strong>of</strong> the waste are vaporized.Because <strong>of</strong> the low air addition rates in the primary chamber <strong>and</strong> the correspondingly low flue gasvelocities <strong>and</strong> turbulence levels, the amount <strong>of</strong> solids (PM) entrained in the gases leaving theprimary chamber is minimized. Temperatures in the primary chamber are relatively low because<strong>of</strong> the low air-to-fuel ratio, usually ranging <strong>from</strong> 1,400 to 1,800 F (760 to 985 C). 22The hot gases flow to the upper secondary chamber (second stage), where excesscombustion air is added to incinerate the volatile compounds. Temperatures in the secondarychamber may range <strong>from</strong> 1,800 to 2,000 F (985 to 1,095 C). Optimization <strong>of</strong> controlled-airincinerators requires thorough mixing <strong>of</strong> the gases in the secondary chamber <strong>and</strong> prolongingresidence time in order to maximize incineration <strong>of</strong> the wastes. The primary <strong>and</strong> secondarychambers may be equipped with auxiliary burners to h<strong>and</strong>le wastes with high moisture content orto assist in burnout during start-up or shut-down. 22Excess-Air Incinerators--Excess-air incinerators are typically small modular units<strong>and</strong> are referred to as batch incinerators, multiple-chamber incinerators, or retort incinerators.Excess-air incinerators typically appear to be a compact cube <strong>from</strong> the outside <strong>and</strong> have a series<strong>of</strong> chambers <strong>and</strong> baffles on the inside. Although they can be operated continuously, they areusually operated in a batch mode. Figure 4-8 presents a typical excess-air incinerator.4-23
Figure 4-8. Excess-Air IncineratorSource: Reference 22.4-24
As with controlled-air incinerators, incineration <strong>of</strong> waste in excess-air incineratorsoccurs in two stages. Waste is fed through a door into the primary combustion chamber. Thecharging door is then closed <strong>and</strong> an afterburner is ignited to bring the secondary combustionchamber to a target temperature, typically 1,600 to 1,800 F (870 to 985 C). When the targettemperature is reached, the primary burner is ignited. The moisture in the waste is reduced <strong>and</strong>the waste is incinerated by heat <strong>from</strong> the primary chamber burner as well as by radiant heat <strong>from</strong>the chamber walls. 22Volatile components in the waste are vaporized, <strong>and</strong> the hot gases flow out <strong>of</strong> theprimary chamber through a flame port that connects the primary chamber to the secondary, ormixing, chamber. Secondary combustion air is added through the flame port <strong>and</strong> is mixed withthe volatile components in the secondary chamber. Burners are fitted to the secondary chamberto maintain adequate temperatures for combustion <strong>of</strong> the volatile gases. The gases exiting thesecondary chamber are directed to the incinerator stack or to an air pollution control device(APCD).When the waste is consumed, the primary burner shuts <strong>of</strong>f. Typically, theafterburner shuts <strong>of</strong>f after a set time. After the primary chamber cools down, the ash is removed<strong>from</strong> the chamber floor <strong>and</strong> a new charge <strong>of</strong> waste can be added.Excess-air incinerators designed to burn general hospital waste operate at totalcombustion air levels <strong>of</strong> up to 300 percent. When only pathological wastes (animal <strong>and</strong> humanremains) are burned, excess air levels near 100 percent are more common. The level <strong>of</strong> excess-aircontrols the secondary chamber temperature. Optimization <strong>of</strong> excess-air incinerators involvesmaintaining high temperatures with afterburners <strong>and</strong> prolonging residence times <strong>of</strong> the gases in thesecondary chamber.4-25
Rotary Kiln Incinerators--A typical rotary kiln incinerator is presented inFigure 4-9. Rotary kiln incinerators, like the incinerator types already presented, are designedwith a primary chamber where waste is heated <strong>and</strong> volatilized <strong>and</strong> a secondary chamber wherecombustion is completed. The primary chamber consists <strong>of</strong> a horizontal, rotating kiln that isslightly inclined to allow the waste material to migrate <strong>from</strong> the feed end to the ash discharge endas the kiln rotates. The waste feed rate is controlled by regulating the rate <strong>of</strong> rotation <strong>and</strong> theincline angle <strong>of</strong> the kiln.Combustion air enters the primary chamber through a port. An auxiliary burner isusually used to initiate combustion <strong>and</strong> to maintain desired combustion temperatures. Therotating motion <strong>of</strong> the kiln stirs the waste <strong>and</strong> increases the solids burnout rate; however, it alsoincreases the amount <strong>of</strong> PM entrained in the flue gases.Volatiles <strong>and</strong> combustion gases pass <strong>from</strong> the primary chamber to the secondarychamber, where combustion is completed. The secondary chamber is operated at belowexcess-air levels <strong>and</strong> at temperatures as high as 2,400 F (1,315 C). 22Emission Control TechniquesAs with other waste incinerators, emissions <strong>of</strong> CDD/CDF <strong>and</strong> other organics <strong>from</strong>medical waste incinerators are most effectively controlled by following good combustion practices(GCP) <strong>and</strong> by collection <strong>of</strong> PM in an APCD. GCP is defined as the combustor system design,operating, <strong>and</strong> maintenance techniques that, when applied with appropriate flue gas leaningtechniques, can minimize emissions. Examples <strong>of</strong> GCP for a municipal waste combustor areoptimizing waste feeding procedures to avoid combustion instabilities <strong>and</strong> providing adequatecombustion temperatures to ensure destruction <strong>of</strong> gas-phase organics.Organics, including CDD/CDF, can exist in the vapor phase or can be condensedor absorbed onto fine particulate; therefore, control <strong>of</strong> PM emissions can result in a decrease inCDD/CDF emissions. Control devices for PM emissions <strong>from</strong> medical waste incinerators include4-26
Exhaust Gas to Stack orAir Pollution Control DeviceWaste Feed4-27Auxiliary FuelAsh RemovalSource: Reference 22.Figure 4-9. Rotary Kiln Incinerator
ESPs, baghouses or fabric filters, <strong>and</strong> wet scrubbers. Of these devices, the most frequently usedare wet scrubbers <strong>and</strong> fabric filters. 22Based on recent studies, the EPA has found that additional CDD/CDF control isachieved by injecting activated carbon into the flue gas (as with MWCs). Adsorbed CDD/CDFare removed <strong>from</strong> the carbon bed by heating to a sufficiently high temperature or by reducing thepressure to a sufficiently low value. Typically, the adsorbtion capacity <strong>of</strong> activated carbonincreases as the molecular weight <strong>of</strong> the adsorbate increases. Also, unsaturated compounds <strong>and</strong>cyclic compounds are generally more completely adsorbed than either saturated compounds orlinear compounds. CDD/CDF have low vapor pressures <strong>and</strong> are more easily adsorbed thancompounds with higher vapor pressures.Emission FactorsTables 4-3 through 4-5 present emission factors for CDD <strong>and</strong> CDF <strong>from</strong> controlled-airincinerators <strong>and</strong> rotary kilns by control device type. Emission factors for the 2,3,7,8-TCDD <strong>and</strong>2,3,7,8-TCDF isomers <strong>and</strong> TCDD/TCDF through OCDD/OCDF homologues are provided.Source LocationsThe total number <strong>of</strong> medical waste incinerators in the United States is uncertain.A major segment <strong>of</strong> the incinerator population is in the thous<strong>and</strong>s <strong>of</strong> hospitals operating in theUnited States. It has been estimated that about 40 to 60 percent <strong>of</strong> hospitals have an incinerator23<strong>of</strong> some type on site. Of the various types <strong>of</strong> medical waste incinerators in use, the majority(>95 percent) are controlled-air (or starved-air) units, less than 2 percent are excess-air units, <strong>and</strong>less than 1 percent are rotary kiln units. 214-28
TABLE 4-3. CDD EMISSION FACTORS FOR CONTROLLED-AIR MEDICAL WASTE INCINERATORSSCC 5-01-005-05, 5-02-005-05Uncontrolled Fabric Filter Wet Scrubber4-29Factor Factor FactorQuality Quality QualityIsomer lb/ton kg/Mg Rating lb/ton kg/Mg Rating lb/ton kg/Mg RatingTCDD-8 -8 -9 -9 -10 -112,3,7,8- 5.47x10 2.73x10 E 6.72x10 3.36x10 E 1.29x10 6.45x10 E-6 -7 -7 -8 -8 -8Total TCDD 1.00x10 5.01x10 B 1.23x10 6.17x10 E 2.67x10 1.34x10 EPeCDD-10 -101,2,3,7,8- 6.08x10 3.04x10 E-10 -10Total PeCDD 5.53x10 2.77x10 EHxCDD-10 -10 -9 -101,2,3,6,7,8- 3.78x10 1.89x10 E 1.84x10 9.05x10 E-9 -10 -9 -91,2,3,7,8,9- 1.21x10 6.07x10 E 2.28x10 1.14x10 E-10 -101,2,3,4,7,8- 9.22x10 4.61x10 E-10 -10Total HxCDD 5.77x10 2.89x10 EHpCDD-9 -9 -9 -91,2,3,4,6,7,8- 5.23x10 2.62x10 E 6.94x10 3.47x10 E-9 -10Total HpCDD 1.98x10 9.91x10 E-8 -8Total OCDD 2.21x10 1.11x10 E-5 -5 -6 -6 -6 -7Total CDD 2.13x10 1.07x10 B 2.68x10 1.34x10 E 1.84x10 9.18x10 E
TABLE 4-3. CDD EMISSION FACTORS FOR CONTROLLED-AIR MEDICAL WASTE INCINERATORS (CONTINUED)DSI/FF DSI/Carbon Injection/FF DSI/ESPFactor Factor FactorQuality Quality QualityIsomer lb/ton kg/Mg Rating lb/ton kg/Mg Rating lb/ton kg/Mg RatingTCDD-10 -10 -10 -10 -10 -112,3,7,8- 5.61x10 2.81x10 E 8.23x10 4.11x10 E 1.73x10 8.65x10 E-9 -9Total TCDD 6.50x10 3.25x10 E-7 -7 -8 -8Total CDD 3.44x10 1.72x10 E 5.38x10 2.69x10 ESource: Reference 22.4-30DSIFFESP= Dry Sorbent Injection.= Fabric Filter.= Electrostatic Precipitator.
TABLE 4-4. CDF EMISSION FACTORS FOR CONTROLLED-AIR MEDICAL WASTE INCINERATORSSCC 5-01-005-05, 5-02-005-054-31Uncontrolled Fabric Filter Wet ScrubberFactor Factor FactorQuality Quality QualityIsomer lb/ton kg/Mg Rating lb/ton kg/Mg Rating lb/ton kg/Mg RatingTCDF-7 -7 -8 -8 -8 -92,3,7,8- 2.40x10 1.20x10 E 3.85x10 1.97x10 E 1.26x10 6.30x10 E-6 -6 -6 -7 -7 -7Total TCDF 7.21x10 3.61x10 B 1.28x10 6.39x10 E 4.45x10 2.22x10 EPeCDF-10 -10 -9 -101,2,3,7,8- 7.56x10 3.78x10 E 1.04x10 5.22x10 E-9 -9 -9 -92,3,4,7,8- 2.07x10 1.04x10 E 3.07x10 1.53x10 E-9 -9Total PeCDF 6.18x10 3.09x10 EHxCDF-9 -9 -9 -91,2,3,4,7,8- 7.55x10 3.77x10 E 8.96x10 4.48x10 E-9 -9 -9 -91,2,3,6,7,8- 2.53x10 1.26x10 E 3.53x10 1.76x10 E-9 -9 -9 -92,3,4,6,7,8- 7.18x10 3.59x10 E 9.59x10 4.80x10 E-10 -101,2,3,7,8,9- 3.51x10 1.76x10 E-9 -9Total HxCDF 5.10x10 2.55x10 EHpCDF-8 -9 -8 -91,2,3,4,6,7,8- 1.76x10 8.78x10 E 1.79x10 8.97x10 E-9 -9 -9 -91,2,3,4,7,8,9- 2.72x10 1.36x10 E 3.50x10 1.75x10 E-9 -10Total HpCDF 1.91x10 9.56x10 E-8 -8 -10 -10Total OCDF 7.42x10 3.71x10 E 4.91x10 2.45x10 E-5 -5 -6 -6 -6 -6Total CDF 7.15x10 3.58x10 B 8.50x10 4.25x10 E 4.92x10 2.46x10 E
TABLE 4-4. CDF EMISSION FACTORS FOR CONTROLLED-AIR MEDICAL WASTE INCINERATORS (CONTINUED)Uncontrolled Fabric Filter Wet ScrubberFactor Factor FactorQuality Quality QualityIsomer lb/ton kg/Mg Rating lb/ton kg/Mg Rating lb/ton kg/Mg RatingTCDF-9 -9 -10 -10 -9 -102,3,7,8- 4.93x10 2.47x10 E 7.31x10 3.65x10 E 1.73x10 8.66x10 E-7 -8 -8 -9Total TCDF 1.39x10 6.96x10 E 1.01x10 5.07x10 E-6 -7 -8 -8Total CDF 1.47x10 7.37x10 E 9.47x10 4.74x10 ESource: Reference 22.4-32DSIFFESP= Dry Sorbent Injection.= Fabric Filter.= Electrostatic Precipitator.
TABLE 4-5. CDD AND CDF EMISSION FACTORS FOR ROTARY KILN MEDICALWASTE INCINERATORSSCC 5-01-005-05, 5-02-005-05FACTOR QUALITY RATING: EIsomerUncontrolledSD/FFSD/CarbonInjection/FFlb/ton kg/Mg lb/ton kg/Mg lb/ton kg/Mg2,3,7,8-TCDD 6.61x10 -10 3.30x10 -10 4.52x10 -10 2.26x10 -10 6.42x10 -11 3.21x10 -11Total TCDD 7.23x10 -9 3.61x10 -9 4.16x10 -9 2.08x10 -9 1.55x10 -10 7.77x10 -11Total CDD 7.49x10 -7 3.75x10 -7 5.79x10 -8 2.90x10 -8 2.01x10 -8 1.01x10 -82,3,7,8-TCDF 1.67x10 -8 8.37x10 -9 1.68x10 -8 8.42x10 -9 4.96x10 -10 2.48x10 -10Total TCDF 2.55x10 -7 1.27x10 -7 1.92x10 -7 9.58x10 -8 1.15x10 -8 5.74x10 -9Total CDF 5.20x10 -6 2.60x10 -6 7.91x10 -7 3.96x10 -7 7.57x10 -8 3.78x10 -8Source: Reference 22.SD = Spray Dryer.FF = Fabric Filter.4.1.3 Sewage Sludge IncinerationSewage sludge incineration is used to dispose <strong>of</strong> sewage sludge generated bywastewater treatment <strong>from</strong> residential, commercial, <strong>and</strong> industrial establishments. Compared toother forms <strong>of</strong> sludge disposal, incineration has the advantages <strong>of</strong> reducing the solid mass <strong>and</strong>destroying or reducing organic matter in the sludge, as well as the potential for recovering energy.Disadvantages include the generation <strong>of</strong> ash which requires disposal <strong>and</strong> the potential release <strong>of</strong>air pollutant emissions.4-33
Process DescriptionThe first step in the process <strong>of</strong> sewage sludge incineration is to dewater the sludge.Sludge is generally dewatered until it is about 15 to 30 percent solids, at which point it will burnwithout supplemental fuel. After dewatering, the sludge is sent to the incinerator for combustion.Unburned residual ash is removed <strong>from</strong> the incinerator, usually on a continuous basis, <strong>and</strong>disposed <strong>of</strong>. A portion <strong>of</strong> the noncombustible waste, as well as unburned VOCs, are carried out<strong>of</strong> the combustor through entrainment in the exhaust gas stream. APCDs, primarily wetscrubbers, are used to remove the entrained pollutants <strong>from</strong> the exhaust gas stream. The cleanedgas stream is then exhausted to the ambient air, <strong>and</strong> the scrubber water containing the collectedpollutants is sent to the wastewater treatment plant.Several types <strong>of</strong> incinerators <strong>and</strong> incineration technologies are used for sewagesludge incineration, including: (1) multiple-hearth furnaces (MHFs), (2) fluidized-bed combustors(FBCs), (3) electric incinerators, (4) co-incineration with refuse, (5) single-hearth cyclones,(6) rotary kilns, <strong>and</strong> (7) high-pressure wet-air oxidation. The first four types/technologies aredescribed in this section. The others are not widely used in the United States <strong>and</strong>, therefore, arenot described here.Multiple-Hearth Furnaces (MHFs)--Figure 4-10 presents a typical MHF. Thebasic MHF is cylindrical in shape <strong>and</strong> is oriented vertically. The outer shell is constructed <strong>of</strong> steel<strong>and</strong> lined with refractory material <strong>and</strong> surrounds a series <strong>of</strong> horizontal refractory hearths. Ahollow, rotating shaft runs through the center <strong>of</strong> the hearths. Attached to the central shaft are therabble arms, which extend above the hearths. Each rabble arm is equipped with a number <strong>of</strong>teeth. As the central shaft rotates, the teeth on the rabble arms rake through the sludge <strong>and</strong> breakup the solid material in order to increase the surface area exposed to heat <strong>and</strong> oxygen. The teethare arranged on the arms to rake the sludge in a spiral motion, alternating in direction--<strong>from</strong> theoutside in <strong>and</strong> <strong>from</strong> the inside out--between hearths. Burners located in the sidewalls <strong>of</strong> thehearths provide supplemental heat when necessary.4-34
Furnace Exhaustto AfterburnerFloatingDamperFeedMaterialPyrolysisGasesProductCooling <strong>and</strong> CombustionAirSource: Reference 18.Figure 4-10. Cross Section <strong>of</strong> a Typical Multiple Hearth Furnace4-35
Partially dewatered sludge is fed onto the perimeter <strong>of</strong> the top hearth by conveyorsor pumps. The motion <strong>of</strong> the rabble arms rakes the sludge toward the center shaft, where it dropsthrough holes onto the next hearth below <strong>and</strong> is raked in the opposite direction. This process isrepeated on all <strong>of</strong> the subsequent hearths. Scum (material that floats on wastewater <strong>and</strong> isgenerally composed <strong>of</strong> vegetable <strong>and</strong> mineral oils, grease, hair, waxes, fats, <strong>and</strong> other materialsthat will float) may also be fed to one or more hearths. Scum may form in many treatment units,including the preparation tanks, the skimming tanks, <strong>and</strong> the sedimentation tanks. Quantities <strong>of</strong>scum are generally small compared to other wastewater solids.Most <strong>of</strong> the moisture in the sludge is evaporated in the drying zone, whichcomprise the upper hearths <strong>of</strong> an MHF. The temperature in the drying zone is typically between800 <strong>and</strong> 1,400 F (425 <strong>and</strong> 760 C). Sludge combustion occurs in the middle hearths as thetemperature is increased to between 1,500 <strong>and</strong> 1,700 F (815 <strong>and</strong> 925 C). The cooling zonecomprises the lowermost hearth(s), where the ash is cooled by the incoming combustion air.Ambient air, introduced through the hollow central shaft <strong>and</strong> rabble arms by a fan,is used to cool the shaft <strong>and</strong> arms <strong>and</strong> to provide combustion air. A portion (or all) <strong>of</strong> this air istaken <strong>from</strong> the top <strong>of</strong> the shaft <strong>and</strong> recirculated into the lowermost hearth as preheatedcombustion air. Shaft cooling air that is not circulated into the furnace is ducted into the stackdownstream <strong>of</strong> the APCDs. The combustion air flows upward through the drop holes in thehearths, countercurrent to the flow <strong>of</strong> the sludge, before being exhausted <strong>from</strong> the top hearth.Under normal operating conditions, 50 to 100 percent excess air must be added to an MHF inorder to ensure complete combustion <strong>of</strong> the sludge <strong>and</strong> destruction <strong>of</strong> organics. 18MHFs are sometimes operated with afterburners to further reduce odors <strong>and</strong>concentrations <strong>of</strong> unburned organics. In an MHF with an afterburner, furnace exhaust gases areducted to a chamber, where they are mixed with supplemental fuel <strong>and</strong> air <strong>and</strong> are completelycombusted. Some MHFs have the flexibility to allow sludge to be fed to a lower hearth, thusallowing the upper hearth(s) to function essentially as an afterburner.4-36
Fluidized-Bed Combustors (FBCs)--A typical FBC was presented earlier inFigure 4-6. FBCs are cylindrically shaped <strong>and</strong> oriented vertically with an outer shell constructed<strong>of</strong> steel <strong>and</strong> lined with refractory material. Nozzles designed to deliver blasts <strong>of</strong> air (calledtuyeres) are located at the base <strong>of</strong> the furnace within a refractory-lined grid. A bed <strong>of</strong> s<strong>and</strong>approximately 2.5 feet (0.75 meters) thick rests on the grid.Two general configurations can be distinguished on the basis <strong>of</strong> how the fluidizingair is injected into the furnace. In the hot windbox design, the combustion air is first preheated bypassing it through a heat exchanger, where heat is recovered <strong>from</strong> the hot flue gases.Alternatively, ambient air can be injected directly into the furnace <strong>from</strong> a cold windbox.Partially dewatered sludge is fed onto the furnace bed. The bed is maintained attemperatures <strong>of</strong> 1,350 to 1,500 F (725 to 825 C). Air injected through the tuyeres fluidizessimultaneously the bed <strong>of</strong> hot s<strong>and</strong> <strong>and</strong> the incoming sludge. Fluidization <strong>of</strong> the bed achievesnearly ideal mixing between the sludge <strong>and</strong> the combustion air, <strong>and</strong> the turbulence facilitates thetransfer <strong>of</strong> heat <strong>from</strong> the hot s<strong>and</strong> to the sludge. As the temperature <strong>of</strong> the sludge rapidlyincreases, evaporation <strong>of</strong> the moisture <strong>and</strong> combustion <strong>of</strong> the organic materials occur almostsimultaneously. The remaining combustible gases are burned in the area above the furnace bed(the freeboard area). The freeboard area functions essentially as an afterburner. FBCs canachieve complete combustion with 20 to 50 percent excess air. 18Electric Incinerators--A cross-section <strong>of</strong> a typical electric incinerator is presentedin Figure 4-11. An electric incinerator consists <strong>of</strong> a horizontally oriented, insulated furnace. Abelt conveyor extends through the length <strong>of</strong> the furnace, <strong>and</strong> infrared heating elements are locatedin the ro<strong>of</strong> <strong>of</strong> the furnace above the conveyor. Electric incinerators consist <strong>of</strong> a number <strong>of</strong>prefabricated modules that can be linked together to provide the necessary furnace length.4-37
4-38Figure 4-11. Cross Section <strong>of</strong> an Electric Infrared FurnaceSource: Reference 18.
Dewatered sludge is deposited on the conveyor belt at the entrance <strong>of</strong> theincinerator. A roller mechanism levels the sludge into a continuous layer approximately 1 inchthick across the width <strong>of</strong> the belt. As the sludge travels through the incinerator <strong>and</strong> beneath theheating elements, it is dried <strong>and</strong> then burned. The ash remaining on the belt is discharged into ahopper at the exit end <strong>of</strong> the incinerator.Combustion air that has been preheated by the flue gases is introduced into thefurnace above the ash hopper <strong>and</strong> is further heated by the ash. The direction <strong>of</strong> air flow iscountercurrent to the movement <strong>of</strong> the sludge on the conveyor <strong>and</strong> the exhaust gases exit thefurnace at the feed end. Excess air rates for electric incinerators vary <strong>from</strong> 20 to 70 percent.Co-incineration with Refuse--Virtually any material that can be burned can becombined with sludge in a co-combustion process. Common materials for co-incineration arecoal, municipal solid waste (MSW), wood waste, <strong>and</strong> agriculture waste. Rotary kilns <strong>and</strong> otherincinerators with feed <strong>and</strong> grate systems that will h<strong>and</strong>le sewage sludge are used for coincineration.When sludge is combined with other combustible materials in a co-combustionscheme, a furnace feed may be created that has both a low water concentration <strong>and</strong> a heat valuehigh enough to sustain combustion with little or no supplemental fuel.There are two basic methods for combusting sewage sludge with MSW: (1) byadding dewatered or dried sludge along with MSW to a municipal waste combustor, <strong>and</strong> (2) byadding processed MSW along with sludge to a sewage sludge incinerator. With the lattermethod, MSW is processed by removing noncombustibles, shredding, <strong>and</strong> screening.Emission Control Techniques<strong>Emissions</strong> <strong>of</strong> CDD/CDF <strong>and</strong> other organics <strong>from</strong> sewage sludge incinerators aremost effectively controlled by maximizing in-furnace destruction <strong>of</strong> organics <strong>and</strong> collecting PM inan APCD. In-furnace destruction <strong>of</strong> organics is accomplished by optimizing waste feeding4-39
procedures, achieving adequate combustion temperatures, providing the proper amount <strong>and</strong>distribution <strong>of</strong> combustion air, <strong>and</strong> optimizing the mixing process. Following these practices willensure more complete combustion <strong>of</strong> the waste <strong>and</strong> destruction <strong>of</strong> CDD/CDF <strong>and</strong> other organics.Organics, including CDD/CDF, can exist in the vapor phase or can be condensedor absorbed onto PM; therefore, control <strong>of</strong> PM emissions can result in a decrease in CDD/CDFemissions. Particulate emissions <strong>from</strong> sewage sludge incinerators have historically been controlledby wet scrubbers because the associated sewage treatment plant provides both a convenient watersupply to the scrubber <strong>and</strong> a means <strong>of</strong> disposing <strong>of</strong> the water after it passes through the scrubber.Other types <strong>of</strong> PM controls range <strong>from</strong> low-pressure-drop spray towers <strong>and</strong> wet cyclones tohigher-pressure-drop venturi scrubbers <strong>and</strong> venturi/impingement tray scrubber combinations.ESPs are sometimes used on incinerators that co-fire sludge with MSW.Emission FactorsThe CDD/CDF emission factors presented in this section were developed <strong>from</strong>24-31information contained in several test reports <strong>and</strong> AP-42. These reports contain results <strong>of</strong> testprograms performed at several MHFs <strong>and</strong> one FBC <strong>and</strong> include a description <strong>of</strong> each incineratortested, the number <strong>of</strong> test runs performed in each test program, <strong>and</strong> the concentrations <strong>of</strong>CDD/CDF obtained for each test run.<strong>Emissions</strong> data for electric incinerators <strong>and</strong> for facilities that co-incinerate sewagesludge with refuse were unavailable at the time this document was prepared; therefore, emissionfactors for these types <strong>of</strong> incinerators are not presented. Only data <strong>from</strong> tests that wereperformed under normal operating conditions were used to develop the emission factors in thisreport.4-40
Tables 4-6 <strong>and</strong> 4-7 present the emission factors for CDD <strong>and</strong> CDF for each MHF<strong>and</strong> FBC tested. The emission factors for MHFs are reported by the type <strong>of</strong> control deviceemployed.Source LocationsThere were 143 sewage sludge facilities in operation in the United States in 1995.Of the three main types <strong>of</strong> incinerators used, over 80 percent are <strong>of</strong> the multiple-hearth design,about 15 percent are FBCs, <strong>and</strong> about 3 percent are electric incinerators. The remainingincinerators co-fire MSW with sludge. 18,31Approximately 6.5 million dry tons (5.9 million dry megagrams) <strong>of</strong> sludge are18generated in U.S. municipal wastewater plants each year. It is estimated that 25 percent <strong>of</strong> thissludge is incinerated. Most sludge incineration facilities are located in the eastern United States,although there are a significant number on the west coast. New York has the largest number <strong>of</strong>facilities (33). Pennsylvania <strong>and</strong> Michigan have 21 <strong>and</strong> 19 sites, respectively. 18,314.1.4 Hazardous Waste IncinerationHazardous waste, as defined by the Resource Conservation <strong>and</strong> Recovery Act(RCRA) in Title 40 CFR Part 261, includes a wide variety <strong>of</strong> waste materials. Generally, adiscarded material may be a hazardous waste if (1) the waste exhibits ignitability, corrosivity,reactivity, <strong>and</strong> toxicity; or (2) if the waste meets the criteria specified by RCRA to be a listedhazardous waste. There are four categories <strong>of</strong> listed hazardous waste: (1) wastes generated <strong>from</strong>nonspecific sources (e.g., solvent wastes); (2) specific wastes generated <strong>from</strong> specific sources(e.g., petroleum refineries); (3) unused acutely hazardous commercial chemical products [listed in40 CFR §261.33(e)]; <strong>and</strong> (4) unused hazardous commercial chemical products [listed in 40 CFR§261.33(f)].4-41
TABLE 4-6. CDD AND CDF EMISSION FACTORS FOR MULTIPLE-HEARTH SEWAGESLUDGE INCINERATORS aSCC 5-01-005-15FACTOR QUALITY RATING: E4-422,3,7,8-TCDD Total TCDD Total PeCDD Total HxCDDSource Category lb/ton µg/Mg lb/ton µg/Mg lb/ton µg/Mg lb/ton µg/Mg-7 1 -9 -7 1Uncontrolled 1.3x10 6.3x10 5.4x10 2.7 1.4x10 6.8x10Controlled-9Cyclone/venturi 2.8x10 1.4-10 -1 -9Cyclone/venturi/ impingement 6.0x10 3.0x10 8.8x10 4.4-9 -1 -8 1 -9 -8 1Impingement 1.0x10 5.0x10 5.6x10 2.8x10 7.4x10 3.7 4.8x10 2.4x10Venturi/impingement/ 1.8x10 9.0x10 1.2x10 6.0x10afterburner-9 -1 -7 1-9 -8 1Venturi/impingement 4.0x10 2.0 7.6x10 3.8x10a Emission factors are reported as lb (µg) <strong>of</strong> pollutant emitted per ton (Mg) <strong>of</strong> dry sludge burned.
TABLE 4-6. CDD AND CDF EMISSION FACTORS FOR MULTIPLE-HEARTH SEWAGEaSLUDGE INCINERATORS (CONTINUED)4-43Total HpCDD Total OCDD Total Tetra through Octa CDDSource Category lb/ton µg/Mg lb/ton µg/Mg lb/ton µg/Mg-7 2 -7 2 -6 2Uncontrolled 6.8x10 3.4x10 7.4x10 3.7x10 1.7x10 8.5x10Controlled-9 -1 -9 -8Cyclone/venturi 1.6x10 8.0x10 6.8x10 3.4 1.1x10 5.6-8 1 -8 1 -7 2Cyclone/venturi/ impingement 2.8x10 1.4x10 6.7x10 3.1x10 2.2x10 1.1x10⁻⁷ 1 -7 1 -7 2Impingement 1.5x10 7.3x10 1.1x10 5.3x10 3.6x10 1.8x10Venturi/impingement/ 4.6x10 2.3x10 2.4x10 1.2x10 6.2x10 3.1x10afterburner-8 1 -8 1 -7 2-8 1 -8 1 -7 2Venturi/impingement 3.0x10 1.5x10 3.8x10 1.9x10 5.4x10 2.7x10a Emission factors are reported as lb (µg) <strong>of</strong> pollutant emitted per ton (Mg) <strong>of</strong> dry sludge burned.
TABLE 4-6. CDD AND CDF EMISSION FACTORS FOR MULTIPLE-HEARTH SEWAGEaSLUDGE INCINERATORS (CONTINUED)4-442,3,7,8-TCDF Total TCDF Total PeCDF Total HxCDFSource Category lb/ton µg/Mg lb/ton µg/Mg lb/ton µg/Mg lb/ton µg/Mg-6 2 -6 3 -6 2 -7 1Uncontrolled 1.2x10 6.2x10 3.4x10 1.7x10 2.0x10 9.8x10 2.0x10 9.9x10Controlled-8 -7 1 -8 1 -9Cyclone/venturi 1.1x10 5.6 1.0x10 5.0x10 2.2x10 1.1x10 6.8x10 3.4-7 2 -7 1 -9Cyclone/venturi/ impingement 3.8x10 1.8x10 1.1x10 5.7x10 3.6x10 1.8-7 2 -6 2 -7 2 -7 2Impingement 3.6x10 1.8x10 1.4x10 7.0x10 7.2x10 3.6x10 2.2x10 1.1x10Venturi/impingement/ 1.1x10 5.4x10 7.0x10 3.5x10 2.6x10 1.3x10 1.5x10 7.8x10afterburner-7 1 -7 2 -7 2 -7 1-8 1 -6 2 -9 -7 1Venturi/impingement 9.2x10 4.6x10 1.2x10 6.0x10 2.6x10 1.3 1.1x10 5.7x10a Emission factors are reported as lb (µg) <strong>of</strong> pollutant emitted per ton (Mg) <strong>of</strong> dry sludge burned.
TABLE 4-6. CDD AND CDF EMISSION FACTORS FOR MULTIPLE-HEARTH SEWAGEaSLUDGE INCINERATORS (CONTINUED)4-45Total HpCDF Total OCDF Total Tetra through Octa CDFSource Category lb/ton µg/Mg lb/ton µg/Mg lb/ton µg/Mg-7 2 -7 2 -6 3Uncontrolled 9.6x10 4.8x10 9.8x10 4.9x10 7.6x10 3.8x10Controlled-9 -1 -9 -1 -7 1Cyclone/venturi 1.8x10 9.0x10 1.4x10 7.0x10 1.3x10 6.6x10⁻⁹ -9 -7 2Cyclone/venturi/ impingement 5.8x10 2.9 3.6x10 1.8 5.0x10 2.5x10⁻⁷ 2 -7 2 -6 3Impingement 4.0x10 2.0x10 3.0x10 1.5x10 3.0x10 1.5x10Venturi/impingement/ 9.6x10 4.8x10 1.5x10 7.7 9.2x10 4.6x10afterburner-8 1 -8 -7 2-8 1 -8 -6 2Venturi/impingement 8.2x10 4.1x10 1.3x10 6.3 1.9x10 9.3x10Source: Reference 31.a Emission factors are reported as lb (µg) <strong>of</strong> pollutant emitted per ton (Mg) <strong>of</strong> dry sludge burned.
TABLE 4-7. CDD AND CDF EMISSION FACTORS FOR FLUIDIZED-BED SEWAGESLUDGE INCINERATORS aSCC 5-01-005-16FACTOR QUALITY RATING: EIsomerUncontrolledVenturi/Impingementlb/ton g/Mg lb/ton g/Mg2,3,7,8-TCDD 6.0x10 -10 3.0x10 -7Total TCDD 4.4x10 -9 2.2x10 -6Total PeCDD 2.2x10 -9 1.1x10 -6Total HxCDD 1.8x10 -9 9.0x10 -7Total HpCDD 1.8x10 -9 9.0x10 -7Total OCDD 8.6x10 -9 4.3x10 -62,3,7,8-TCDF 4.0x10 -10 2.0x10 -7Total TCDF 1.2x10 -8 6.2x10 -6Total PeCDF 1.0x10 -8 5.2x10 -6Total HxCDF 8.2x10 -9 4.1x10 -6Total HpCDF 3.2x10 -9 1.6x10 -6Total OCDF 2.6x10 -9 1.3x10 -6Source: Reference 31.a Emission factors are reported as lb (g) <strong>of</strong> pollutant emitted per ton (Mg) <strong>of</strong> dry sludge burned.4-46
Hazardous waste is incinerated in order to destroy the hazardous constituents <strong>of</strong>the waste <strong>and</strong>/or reduce the bulk <strong>of</strong> the waste. Hazardous waste can be burned under oxidative orpyrolytic conditions in hazardous waste incinerators designed specifically for this purpose or invarious types <strong>of</strong> industrial boilers <strong>and</strong> furnaces.The primary purpose <strong>of</strong> a hazardous waste incinerator is to destroy the hazardousconstituents <strong>of</strong> the waste. The primary purpose <strong>of</strong> burning hazardous wastes in industrial boilers<strong>and</strong> furnaces is to recover energy. These units use the recovered energy in addition to energy<strong>from</strong> a primary fuel to produce a commercially viable product such as cement, lime, or steam. Inthe process <strong>of</strong> producing energy <strong>and</strong> heat, the hazardous content or the bulk <strong>of</strong> the waste isdestroyed.Process DescriptionsSeveral types <strong>of</strong> incinerators, boilers, <strong>and</strong> furnaces are used to incinerate hazardouswaste. The most common types <strong>of</strong> each are discussed in this section.Hazardous Waste Incinerators--Five types <strong>of</strong> hazardous waste incinerators arecurrently available <strong>and</strong> in operation in the United States: liquid-injection, fume-injection, fixedhearth,fluidized-bed, <strong>and</strong> rotary kiln.Liquid-injection incinerators are usually single-chamber units <strong>and</strong> may be eithervertically or horizontally oriented. Liquid wastes are transferred <strong>from</strong> drums or tank trucks into afeed tank, where recirculation systems or mixers are used to mix the tank contents. Beforeintroduction <strong>of</strong> the waste, a gaseous auxiliary fuel (such as propane) is normally used to preheatthe incinerator system to an equilibrium temperature. The waste is then pumped <strong>from</strong> the tank<strong>and</strong> sent either directly to the incinerator or to a blending tank to be combined with other wastesbefore incineration. The waste is atomized by gas-fluid nozzles <strong>and</strong> injected into the incinerator.Liquid-injection incinerators can incinerate a wide range <strong>of</strong> liquid wastes but are unsuitable for4-47
noncombustibles, wastes with a high moisture content, inert materials, inorganic salts, <strong>and</strong>materials with a high inorganic content.Fume-injection incinerators are very similar to liquid-injection incinerators indesign <strong>and</strong> are used to destroy gaseous or fume wastes.The combustion chamber <strong>of</strong> the fixed-hearth incinerator is a stationary unit intowhich solids <strong>and</strong> sludges are introduced <strong>and</strong> burned. Units <strong>of</strong> this type may have a single(primary) combustion chamber or may have two chambers (primary <strong>and</strong> secondary). Fixed-hearthincinerators are usually equipped with oil or gas burners for start-up <strong>and</strong> for providing auxiliaryfuel as needed. Combustion in these units is enhanced by the addition <strong>of</strong> a grate system, whichallows combustion air to flow above <strong>and</strong> below the waste. Solids <strong>and</strong> sludges are fed into theprimary chamber, where they are burned. Liquid waste may be introduced into either the primaryor secondary chamber.Fluidized-bed combustors (FBCs) were previously described in the Sewage SludgeIncineration section <strong>of</strong> this report. FBCs used to dispose <strong>of</strong> hazardous waste are very similar tothose used to incinerate sewage sludge except for their additional capability <strong>of</strong> h<strong>and</strong>ling liquidwastes. FBCs are suitable for disposing <strong>of</strong> combustible solids, liquids, <strong>and</strong> gaseous wastes. Theyare not suited for irregular, bulky wastes, tarry solids, or other wastes that leave residues in thebed. 31,32Rotary kiln incinerators have a combustion chamber that is slightly inclined <strong>from</strong>the horizontal <strong>and</strong> rotates. Rotary kilns were described earlier in the Medical Waste Incinerationsection <strong>of</strong> this report. Rotary kilns are designed to incinerate many types <strong>of</strong> waste, hazardous ornonhazardous. Solid, liquid, <strong>and</strong> containerized wastes are usually fed simultaneously to the kiln,but liquid wastes also may be injected into the afterburner. The rotary kiln incinerator can be usedto destroy any form <strong>of</strong> hazardous waste material that is combustible. It has also been shown to beuseful for decontaminating noncombustible materials such as soils <strong>and</strong> capacitors. Rotary kilns4-48
are not suited for wastes with a high moisture content or that contain significant amounts <strong>of</strong> toxicmetals.Boilers--In contrast to incinerators, whose main objective is to destroy thehazardous constituents <strong>of</strong> wastes, boilers are constructed to produce steam for electricitygeneration (utility boilers) or for on-site process needs (industrial boilers). Also, hazardouswastes compose the primary feed to incinerators, whereas they are usually a supplementary fuelfor boilers. The concept <strong>of</strong> disposing <strong>of</strong> hazardous wastes in boilers has centered aroundindustrial boilers because their operation is more flexible than utility boiler operation, <strong>and</strong> they<strong>of</strong>fer the potential <strong>of</strong> destroying hazardous wastes generated on site.The primary fuels used in industrial boilers are gas, oil, coal, <strong>and</strong> wood. Industrialboilers may be distinguished by their type <strong>of</strong> fuel-firing mode. The major types <strong>of</strong> firing modesare single- or opposed-wall, tangential, cyclone, <strong>and</strong> stoker. The terms single- or opposed-wall<strong>and</strong> tangential refer to the arrangement <strong>of</strong> the burners in the combustion chamber. In cyclonefiredunits, fuel <strong>and</strong> air are introduced circumferentially into a water-cooled, cylindricalcombustion chamber. Stoker-fired boilers are designed to burn solid fuels on a bed. The bed iseither a stationary grate through which ash falls or a moving grate that dumps the ash into ahopper.Industrial Furnaces--Industrial furnaces are defined as designated devices that arean integral component <strong>of</strong> a manufacturing process <strong>and</strong> that use thermal treatment to recovermaterials or energy. Types <strong>of</strong> industrial furnaces are cement kilns, lime kilns, lightweightaggregate kilns, phosphate kilns, <strong>and</strong> coke ovens. The types <strong>of</strong> industrial furnaces are toonumerous for process descriptions to be included here. Basically, they are alike in that industrialfurnaces are used to liberate heat <strong>and</strong> transfer the heat directly or indirectly to a solid or fluidmaterial for the purpose <strong>of</strong> effecting a physical or chemical change. Industrial furnaces usuallyhave a chamber(s) in which the material is processed into a product. Their operation <strong>and</strong> function4-49
can be compared to those <strong>of</strong> a kitchen oven. Primary fuels for industrial furnaces are normally oil,gas, or coal. Waste fuels include used lube oil, hydraulic fluid, coolant oil, <strong>and</strong> metal-working oil.Emission Control Techniques<strong>Emissions</strong> <strong>of</strong> CDD/CDF <strong>from</strong> hazardous waste incinerators <strong>and</strong> industrial boilers<strong>and</strong> furnaces are most effectively controlled by GCP <strong>and</strong> collection <strong>of</strong> PM in an effective APCD.GCP can maximize destruction <strong>of</strong> organics in the furnace. Wet scrubbers <strong>and</strong> ESPs are the mostcommon APCDs used on these three types <strong>of</strong> units to control PM emissions.Emission FactorsEmission factors for CDD/CDF <strong>from</strong> hazardous waste incinerators <strong>and</strong> industrialboilers <strong>and</strong> furnaces, or information <strong>from</strong> which emission factors may be developed, are notreadily available. <strong>Emissions</strong> depend on the constituents in the waste stream being combusted, <strong>and</strong>waste streams <strong>of</strong>ten vary greatly <strong>from</strong> facility to facility. Therefore, CDD/CDF emission factorsdeveloped for one facility would be specific only to that facility. This section presents CDD/CDFemissions data (concentrations in flue gas) that were compiled during a literature review, <strong>and</strong>CDD/CDF emission factors (kg/Mg waste combusted) that were developed <strong>from</strong> data containedin a test report. 32,33<strong>Emissions</strong> data <strong>from</strong> tests at six incinerators, five boilers, three calcining kilns, <strong>and</strong>33three PCB incinerators are summarized in the literature review report. This summary is partiallyreproduced in Table 4-8. Concentrations <strong>of</strong> CDD/CDF in the flue gas at each facility are3presented in units <strong>of</strong> nanograms per cubic meter (ng/m ). Of the 17 facilities tested, only fiveemitted detectable levels <strong>of</strong> CDD or CDF. The 2,3,7,8-TCDD isomer was not detected at any <strong>of</strong>the facilities. The highest CDD levels reported were for an industrial boiler using acreosote/pentachlorophenol (PCP) waste.4-50
TABLE 4-8. SUMMARY OF TOTAL CDD/CDF CONCENTRATIONS MEASURED ATHAZARDOUS WASTE THERMAL DESTRUCTION FACILITIESFacility TypeSample(waste) aTotal CDD Total CDF(ng/m 3 ) (ng/m 3 )Commercial rotary kiln/liquid injectionFG/FA (HW) ND ND-1.7Fixed-hearth incinerator FG/FA (HW) 16 56Liquid-injection incinerator FG/FA (HW) ND NDHorizontal liquid-injection incinerator FG/FA (HW) ND 7.3Incinerator ship FG/FA (PCB) ND 0.3-34 lime/cement kilns FG (HW) ND NDFixed-hearth incinerator FG/FA (HW) ND NDRotary kiln/liquid-injection FG (PCB) ND-48 0.6-95Industrial boiler FG/FA (PCP) 75-76 NDIndustrial boiler FG/FA (HW) 0.64-0.8 NDIndustrial boiler FG/FA (HW) ND NDIndustrial boiler FG/FA (HW) ND NDIndustrial boiler FG/FA (HW) 1.1 NDSource: Reference 33.Note: 2,3,7,8-TCDD was not detected at any facility.a Information in parentheses describes waste feed.FG = Flue gases analyzed.FA = Flue gas particulate analyzed.HW = Hazardous waste.PCB = Polychlorinated biphenyls.PCP = Pentachlorophenol waste.ND = Not detected.4-51
Table 4-9 presents emission factors developed <strong>from</strong> information contained in one32test report. This report presents the results <strong>of</strong> a test program performed at EPA's IncinerationResearch Facility (IRF). Test conditions were designed to evaluate the effectiveness <strong>of</strong> varyingincinerator operating conditions on the destruction <strong>of</strong> PCB <strong>and</strong> other pollutants. The IRFincinerator is a rotary kiln equipped with an afterburner. APCDs used during the test programconsisted <strong>of</strong> a venturi scrubber followed by a packed-column scrubber. The waste feed to theincinerator was PCB-contaminated marine sediments. The sediments were spiked with PCBtransformer fluid to increase the sediment PCB content <strong>from</strong> nominally 12 lb/ton(6,000 milligrams per kilogram [mg/kg]) to 92 lb/ton (46,000 mg/kg), a level that allowed anunambiguous determination <strong>of</strong> whether a PCB destruction <strong>and</strong> removal efficiency (DRE) <strong>of</strong>99.9999 percent could be achieved. The emission factors presented in Table 4-9 were developed<strong>from</strong> data <strong>from</strong> three test runs at the facility. The 2,3,7,8- isomers <strong>and</strong> PeCDD/PeCDF throughOCDD/OCDF were detected in each test run.Overall, it appeared that emissions <strong>of</strong> CDD/CDF <strong>from</strong> hazardous wasteincinerators <strong>and</strong> industrial boilers <strong>and</strong> furnaces were not significant, but they can occur. As withother types <strong>of</strong> refuse combustion, CDD/CDF emissions <strong>from</strong> these types <strong>of</strong> facilities are highlydependent on the type <strong>of</strong> waste feed <strong>and</strong> incinerator operating practices.Source LocationsApproximately 227 hazardous waste incinerators are in operation in the UnitedStates <strong>and</strong> Puerto Rico. Texas has the most with 27 facilities (12 percent), followed by Louisiana<strong>and</strong> Ohio, each with 17 facilities (7 percent), <strong>and</strong> California with 15 facilities (7 percent). Thirtyeightstates, each with between 1 <strong>and</strong> 12 incinerators, together account for 12 percent <strong>of</strong> thetotal. 344-52
TABLE 4-9. CDD/CDF EMISSION FACTORS FOR A HAZARDOUS WASTEINCINERATOR BURNING PCB-CONTAMINATED SEDIMENTSSCC 5-03-005-01FACTOR QUALITY RATING: EIsomerDIOXINSaEmission Factors lb/ton (kg/Mg) Refuse CombustedRangeAverage Minimum Maximum-10 -11 -10 -11 -10 -112,3,7,8-TCDD 1.7x10 (8.42x10 ) 1.6x10 (7.92x10 ) 1.8x10 (8.81x10 )-10 -10 -10 -10 -10 -10Total TCDD 6.4x10 (3.22x10 ) 4.2x10 (2.11x10 ) 9.4x10 (4.70x10 )-10 -10Total PeCDD 3.8x10 (1.88x10 )-10 -10Total HxCDD 5.1x10 (2.54x10 )-10 -10Total HpCDD 9.3x10 (4.64x10 )-9 -9Total OCDD 2.5x10 (1.25x10 )-9 -9Total CDD 5.1x10 (2.56x10 )-10 -102.6x10 (1.32x10 )-10 -104.2x10 (2.11x10 )-10 -104.7x10 (2.35x10 )-9 -101.6x10 (7.92x10 )-9 -93.3x10 (1.67x10 )-10 -105.7x10 (2.85x10 )-10 -106.5x10 (3.23x10 )-9 -101.3x10 (6.55x10 )-9 -93.4x10 (1.71x10 )-9 -97.0x10 (3.52x10 )FURANS-8 -92,3,7,8-TCDF 1.9x10 (9.54x10 )-7 -8Total TCDF 1.1x10 (5.72x10 )-8 -8Total PeCDF 2.9x10 (1.43x10 )-9 -9Total HxCDF 6.5x10 (3.26x10 )-10 -10Total HpCDF 5.1x10 (2.56x10 )-10 -10Total OCDF 7.3x10 (3.63x10 )-7 -8Total CDF 1.7x10 (8.49x10 )Source: Reference 32.-8 -91.4x10 (7.13x10 )-8 -87.8x10 (3.91x10 )-8 -91.7x10 (8.55x10 )-9 -94.0x10 (1.99x10 )-10 -111.1x10 (5.28x10 )-10 -105.7x10 (2.85x10 )-7 -81.1x10 (5.68x10 )-8 -82.7x10 (1.35x10 )-7 -81.6x10 (8.19x10 )-8 -84.6x10 (2.29x10 )-9 -97.9x10 (3.96x10 )-9 -101.1x10 (5.70x10 )-10 -108.5x10 (4.23x10 )-7 -72.4x10 (1.21x10 )aEmission factors developed <strong>from</strong> three test runs at one unit. Control device = venturi scrubber <strong>and</strong> packedcolumn scrubber.4-53
There are approximately 23,000 fossil-fuel-fired industrial boilers in the United35States. The number <strong>of</strong> boilers located in each state is unknown, but with such a large number <strong>of</strong>boilers in operation, it is likely that industrial boilers are located in every state.The total number <strong>of</strong> industrial furnaces in operation in the United States isunknown. There are 143 cement plants in operation in 40 states. Texas has the largest number <strong>of</strong>facilities with 18, followed by Pennsylvania with 15. There were 137 lime production plants in38 states in operation in 1984. The state with the most facilities was Ohio with 15. Californiawas second, with 13 plants in operation. 334.1.5 Industrial Waste IncinerationIndustrial wastes are nonhazardous materials generated by a process or operation.These wastes are deemed worthless <strong>and</strong> cannot be further refined or recycled to produce aproduct. Almost all industries generate some type <strong>of</strong> waste. Industries that generate combustiblewastes such as wood, paper, or plastic sometimes incinerate their own wastes. Incineration <strong>of</strong>these wastes is a disposal method <strong>and</strong> it also provides a source <strong>of</strong> energy that can be captured <strong>and</strong>used in a process or operation. The combustion <strong>of</strong> industrial wood wastes in boilers is discussedspecifically in Section 4.2.2 <strong>of</strong> this report.Process DescriptionIndustrial wastes are usually solid materials <strong>and</strong> may be disposed <strong>of</strong> in varioustypes <strong>of</strong> incinerators or co-fired with another fuel in boilers. Combustion chambers in incineratorsused to dispose <strong>of</strong> industrial waste are usually equipped with a grate system so that air can flowover <strong>and</strong> under the waste, thereby enhancing combustion. These incinerators normally have anafterburner to aid combustion <strong>and</strong> a waste heat boiler to generate steam.4-54
Emission Control Techniques<strong>Emissions</strong> <strong>of</strong> CDD/CDF <strong>from</strong> industrial waste incinerators may be controlled byGCP (as described earlier in Section 4.1.2) <strong>and</strong> with devices such as scrubbers <strong>and</strong> fabric filtersthat are used on other incinerators to control particulate emissions. No data were available at thetime this report was prepared on the extent to which specific control devices are used onindustrial waste incinerators.Emission FactorsOnly one report <strong>of</strong> emissions testing at an industrial waste incinerator was located36for the preparation <strong>of</strong> this report. The test was performed at a facility that manufactureswooden doors <strong>and</strong> windows. Various wastes <strong>from</strong> the plant, including wood scraps, plasticcoatedwooden window frame pieces, paint sludges, paint filters, dry paint, paper, <strong>and</strong> cardboardwere burned in the incinerator. Heat generated in the incinerator was recovered using waste heatboilers.The incinerator was batch-fed <strong>and</strong> had primary <strong>and</strong> secondary combustionchambers. The secondary chamber was a refractory-lined duct with oil-fired burners. Hot gases<strong>from</strong> the secondary chamber passed through the waste heat boiler prior to being exhaustedthrough a stack. There was no pollution control device on the incinerator.Waste feed to the incinerator during testing averaged 1.19 ton/hr (1,083 kg/hr).The feed material to the incinerator consisted <strong>of</strong> crate, wood, paper, cardboard (67 percent byweight <strong>of</strong> the total feed), PCP-treated wood (6 percent by weight), painted wood (14.5 percent byweight), wood treated with PCP <strong>and</strong> coated with polyvinyl chloride (13 percent by weight),water-based paint (0.6 percent by weight), <strong>and</strong> oil-based paint (0.6 percent by weight).4-55
The CDD/CDF emission factors developed <strong>from</strong> the emissions data presented inthe test report are presented in Table 4-10. Three test runs were performed; the 2,3,7,8-isomers<strong>and</strong> TCDD/TCDF through OCDD/OCDF homologues were detected in all test runs.Because these emission factors are for a specific site, they should not be used toestimate emissions <strong>from</strong> other industrial waste incinerators without considering the differentoperating conditions <strong>and</strong> feed material composition.Source LocationsThe total number <strong>of</strong> industrial waste incinerators in operation in the United Statesis unknown. Because there are a large number <strong>of</strong> processes <strong>and</strong> operations that generatecombustible wastes, the potential number <strong>of</strong> industrial waste incinerators is very large, <strong>and</strong> someare probably located in every state.4.2 COMBUSTION OF SOLID AND LIQUID FUELS IN STATIONARYSOURCES FOR HEAT AND POWER GENERATIONThis section covers the combustion <strong>of</strong> solid <strong>and</strong> liquid fuels in stationary sourcesfor heat <strong>and</strong> power generation in the utility, industrial, <strong>and</strong> residential sectors. Potential sources<strong>of</strong> emissions in these sectors include utility plants, industrial boilers, <strong>and</strong> domestic combustionunits. These sources burn some or all <strong>of</strong> the following fuels: coal, oil, natural gas, <strong>and</strong> wood.CDD/CDF emissions <strong>from</strong> these sources may occur as a result <strong>of</strong> incomplete combustion <strong>of</strong>hydrocarbons in the furnace or downstream formation in ductwork or air pollution controldevices. However, these sources are not generally considered major sources <strong>of</strong> CDD/CDFemissions.4-56
TABLE 4-10. CDD/CDF EMISSION FACTORS FOR AN INDUSTRIALWASTE INCINERATORSCC 5-03-001-01FACTOR QUALITY RATING: EDIOXINSIsomeraEmission Factors lb/ton (kg/Mg) Refuse CombustedRangeAverage Minimum Maximum-8 -8 -8 -9 -8 -82,3,7,8-TCDD 2.5x10 (1.27x10 ) 1.1x10 (5.69x10 ) 4.2x10 (2.11x10 )-7 -7 -7 -8 -7 -7Total TCDD 4.7x10 (2.34x10 ) 2.0x10 (9.96x10 ) 7.9x10 (3.96x10 )-7 -7Total PeCDD 5.8x10 (2.89x10 )-7 -7Total HxCdd 8.0x10 (3.99x10 )-6 -7Total HpCdd 1.1x10 (5.31x10 )-7 -7Total OCDD 3.6x10 (1.81x10 )-6 -6Total CDD 3.3x10 (1.67x10 )-7 -72.8x10 (1.42x10 )-7 -75.6x10 (2.79x10 )-7 -76.7x10 (3.33x10 )-7 -72.7x10 (1.37x10 )-6 -72.0x10 (9.96x10 )-7 -79.4x10 (4.68x10 )-6 -71.1x10 (5.66x10 )-6 -71.5x10 (7.23x10 )-7 -75.1x10 (2.54x10 )-6 -64.9x10 (2.44x10 )FURANS-7 -82,3,7,8-TCDF 1.2x10 (5.89x10 )-6 -6Total TCDF 3.1x10 (1.53x10 )-6 -6Total PeCDF 3.0x10 (1.49x10 )-6 -6Total HxCDF 3.3x10 (1.67x10 )-6 -6Total HpCDF 2.2x10 (1.08x10 )-7 -7Total OCDF 3.8x10 (1.92x10 )-5 -6Total CDF 1.2x10 (6.02x10 )Source: Reference 36.-8 -86.3x10 (3.13x10 )-6 -72.0x10 (9.91x10 )-6 -62.0x10 (1.00x10 )-6 -63.0x10 (1.52x10 )-6 -71.8x10 (8.79x10 )-7 -73.0x10 (1.50x10 )-6 -69.2x10 (4.58x10 )-7 -81.9x10 (9.38x10 )-6 -64.4x10 (2.19x10 )-6 -64.1x10 (2.05x10 )-6 -63.8x10 (1.90x10 )-6 -62.6x10 (1.29x10 )-7 -75.3x10 (2.63x10 )-5 -61.56x10 (7.81x10 )aUncontrolled; three test runs.4-57
4.2.1 Utility SectorUtility boilers burn coal, oil, <strong>and</strong> natural gas to generate steam for electricityproduction. Most <strong>of</strong> the fossil fuel in the United States is consumed by the utility sector, with37coal accounting for most <strong>of</strong> the fuel used, followed by natural gas <strong>and</strong> oil. These sourcesgenerally have extremely low CDD/CDF emissions potential as the fuel used contains only smallamounts <strong>of</strong> chlorinated compounds which can form CDD/CDF.Process DescriptionUtility boilers are <strong>of</strong>ten identified by their furnace configuration <strong>and</strong> includetangentially-fired, wall-fired, cyclone-fired, <strong>and</strong> stoker-fired. The tangentially-fired boiler is basedon the concept <strong>of</strong> a single flame zone within the furnace. The air-to-fuel mixture in a tangentiallyfiredboiler projects <strong>from</strong> the four corners <strong>of</strong> the furnace along a line tangential to an imaginarycylinder located along the furnace centerline. Tangentially-fired boilers commonly burn coal.However, oil or gas may also be burned. Wall-fired boilers are characterized by multipleindividual burners located on a single wall or on opposing walls <strong>of</strong> the furnace. In contrast totangentially-fired boilers that produce a single flame, each <strong>of</strong> the burners in a wall-fired boiler hasa relatively distinct flare zone. Wall-fired boilers may burn coal, oil, or natural gas.Cyclone-fired boilers burn crushed rather than pulverized coal. Fuel <strong>and</strong> air areburned in horizontal cylinders, producing a spinning high temperature flame. Cyclone-firedboilers are almost exclusively coal-fired. Stoker-fired boilers are mostly used at older plants. Themost common stoker type is the spreader stoker. Spreader stokers are designed to feed solid fuelonto a grate within the furnace <strong>and</strong> remove ash residue. Spreader stokers are capable <strong>of</strong> burningall types <strong>of</strong> bituminous <strong>and</strong> lignite coals.Fluidized bed combustion (FBC) is a newer boiler technology that is not as widelyused as the other boiler types. In a typical FBC boiler, crushed coal in combination with inert4-58
material (s<strong>and</strong>, silica, alumina, or ash) <strong>and</strong>/or sorbent (limestone) are maintained in a highlyturbulent suspension by the upward flow <strong>of</strong> primary air <strong>from</strong> the windbox located directly belowthe combustor floor. This fluidization provides a large amount <strong>of</strong> surface contact between the air<strong>and</strong> solid particles, which promotes uniform <strong>and</strong> efficient combustion at low furnace temperatures,between 1,575 <strong>and</strong> 1,650 F (860 <strong>and</strong> 900 C) compared to 2,500 <strong>and</strong> 2,800 F (1,370 <strong>and</strong>1,540 C) for conventional coal-fired boilers. Fluidized bed combustion boilers have beendeveloped to operate at both atmospheric <strong>and</strong> pressurized conditions. 16Emission Control TechniquesBaghouses, ESPs, wet scrubbers, <strong>and</strong> spray dryers have been applied in the utilitysector. The temperature <strong>of</strong> "hot-side" ESP (located before the air preheater) <strong>of</strong> 370 C is suchthat downstream formation <strong>of</strong> CDD/CDF due to de novo synthesis <strong>of</strong> particulate matter mayoccur.Emission Factors<strong>Emissions</strong> data based on boiler tests conducted over the past several years wereobtained. Tables 4-11 <strong>and</strong> 4-12 contain draft CDD/CDF emission factors for coal-fired units <strong>and</strong>38oil-fired units, respectively. Detectable levels <strong>of</strong> CDD/CDF <strong>from</strong> gas-fired boilers were notidentified. It is important to note that these data are preliminary <strong>and</strong> have not been approved <strong>and</strong>finalized by the EPA. In addition, the emission factors are for a composite <strong>of</strong> various furnaceconfigurations <strong>and</strong> control devices. Thus, no SCCs or ratings were assigned to these data.Source LocationsThere are approximately 700 known utility boilers located throughout the UnitedStates. Because <strong>of</strong> this large number <strong>of</strong> coal-fired sources, providing site-specific locations in thisreport is not practical.4-59
IsomerTABLE 4-11. DRAFT SUMMARY OF CDD/CDF EMISSIONS FROMCOMPOSITE COAL-FIRED UTILITY BOILERSaMedian Emission Factorlb/trillion Btug/MJ2,3,7,8-TCDD 1.6x10 -6 6.9x10 -131,2,3,7,8-PeCDD 4.3x10 -6 1.8x10 -121,2,3,4,7,8-HxCDD 9.7x10 -6 4.2x10 -121,2,3,6,7,8-HxCDD 5.8x10 -6 2.5x10 -121,2,3,7,8,9-HxCDD 7.3x10 -6 3.1x10 -121,2,3,4,6,7,8-HpCDD 5.7x10 -6 2.5x10 -12Total HpCDD 1.1x10 -4 4.7x10 -11Total HxCDD 2.4x10 -5 1.0x10 -11Total OCDD 5.8x10 -5 2.5x10 -11Total PeCDD 9.8x10 -6 4.2x10 -12Total TCDD 7.1x10 -6 3.1x10 -12Total CDD 2.1x10 -4 8.9x10 -112,3,7,8-TCDF 3.9x10 -6 1.7x10 -121,2,3,7,8-PeCDF 2.4x10 -6 1.0x10 -122,3,4,7,8-PeCDF 1.0x10 -5 4.3x10 -121,2,3,4,7,8-HxCDF 1.3x10 -5 5.6x10 -121,2,3,6,7,8-HxCDF 4.0x10 -6 1.7x10 -121,2,3,7,8,9-HxCDF 8.5x10 -6 3.7x10 -122,3,4,6,7,8-HxCDF 1.6x10 -5 6.9x10 -121,2,3,4,6,7,8-HpCDF 2.0x10 -5 8.6x10 -121,2,3,4,7,8,9-HpCDF 1.7x10 -4 7.3x10 -11Total HpCDF 2.4x10 -5 1.0x10 -11Total HxCDF 1.9x10 -5 8.2x10 -12Total OCDF 1.7x10 -5 7.3x10 -12Total PeCDF 1.8x10 -5 7.7x10 -12Total TCDF 1.2x10 -5 5.2x10 -12Total CDF 9.0x10 -5 3.8x10 -11Source: Reference 38.4-60
IsomerTABLE 4-12. DRAFT SUMMARY OF CDD/CDF EMISSIONS FROMCOMPOSITE OIL-FIRED UTILITY BOILERSaMedian Emission Factorlb/trillion Btug/MJ2,3,7,8-TCDD 6.5x10 -6 2.8x10 -121,2,3,7,8-PeCDD 5.8x10 -6 2.5x10 -121,2,3,4,7,8-HxCDD 1.2x10 -5 5.2x10 -121,2,3,6,7,8-HxCDD 5.4x10 -6 2.3x10 -121,2,3,7,8,9-HxCDD 8.3x10 -6 3.6x10 -121,2,3,4,6,7,8-HpCDD 2.0x10 -5 8.6x10 -12Total HpCDD 2.0x10 -5 8.6x10 -12Total HxCDD 8.1x10 -6 3.5x10 -12Total OCDD 2.3x10 -5 9.9x10 -12Total PeCDD 5.8x10 -6 2.5x10 -12Total TCDD 5.7x10 -6 2.5x10 -12Total CDD 6.3x10 -5 2.7x10 -112,3,7,8-TCDF 4.6x10 -6 2.0x10 -121,2,3,7,8-PeCDF 4.3x10 -6 1.8x10 -122,3,4,7,8-PeCDF 4.8x10 -6 2.1x10 -121,2,3,4,7,8-HxCDF 6.1x10 -6 2.6x10 -121,2,3,6,7,8-HxCDF 3.8x10 -6 1.6x10 -121,2,3,7,8,9-HxCDF 5.8x10 -6 2.5x10 -122,3,4,6,7,8-HxCDF 4.8x10 -6 2.1x10 -121,2,3,4,6,7,8-HpCDF 9.4x10 -6 4.0x10 -121,2,3,4,7,8,9-HpCDF 1.0x10 -5 4.3x10 -12Total HpCDF 1.5x10 -6 6.5x10 -13Total HxCDF 9.6x10 -6 4.1x10 -12Total OCDF 1.0x10 -5 4.3x10 -12Total PeCDF 7.3x10 -6 3.1x10 -12Total TCDF 5.0x10 -6 2.2x10 -12Total CDF 3.3x10 -5 1.4x10 -11Source: Reference 38.4-61
Information on precise utility plant locations can be obtained by contacting utilitytrade associations such as the Electric Power Research Institute in Palo Alto, California(415-855-2000); the Edison Electric Institute in Washington, D.C. (202-828-7400); or theU.S. Department <strong>of</strong> Energy (DOE) in Washington, D.C. Publications by EPA <strong>and</strong> the DOE onthe utility industry also would be useful in determining specific facility locations, sizes, <strong>and</strong> fueluse.4.2.2 Industrial SectorIndustrial boilers are widely used in manufacturing, processing, mining, <strong>and</strong>refining, primarily to generate process steam <strong>and</strong> provide space heating. Some boilers are alsoused for electricity generation. Industrial boilers can fire fossil <strong>and</strong> non-fossil fuels. Wood is theonly non-fossil fuel discussed here, since wood-fired industrial boilers are more likely sources <strong>of</strong>CDD/CDF emissions due to the presence <strong>of</strong> CDD/CDF precursors in wood.Process DescriptionIndustrial boilers burning fossil fuels are identified by their heat transfer method.These include watertube, firetube, <strong>and</strong> cast iron. Watertube boilers are designed to pass waterthrough the inside <strong>of</strong> heat transfer tubes while the outside <strong>of</strong> the tubes is heated by direct contactwith the hot combustion gases. Industrial watertube boilers can burn coal, oil, or natural gas.Coal-fired industrial boilers are generally <strong>of</strong> the watertube design. Firing mechanisms includepulverized coal <strong>and</strong> stoker (spreader, underfeed, <strong>and</strong> overfeed stoker). The most common <strong>of</strong>these are pulverized coal boilers, especially for larger coal-fired boilers. In firetube boilers, thehot gas flows through the tubes <strong>and</strong> the water being heated circulates outside <strong>of</strong> the tubes. Mostinstalled firetube boilers burn oil or gas. In cast iron boilers, the hot gas is contained inside thetubes <strong>and</strong> the water being heated circulates outside the tubes.4-62
The burning <strong>of</strong> wood waste in boilers is mostly confined to those industries whereit is available as a byproduct. Currently, the bulk <strong>of</strong> wood residue or bark burning in industrial39boilers is carried out in forest products industrial boilers. It is burned both to obtain heat energy<strong>and</strong> to alleviate solid waste disposal problems. The bulk <strong>of</strong> wood combusted is <strong>from</strong> debarking <strong>of</strong>logs or byproducts <strong>from</strong> wood products operations where the original wood is not tainted withinorganic chlorides such as would be the case with logs stored or transported over sea water.CDD/CDF emissions <strong>from</strong> facilities burning salt-laden wood residue may be considerably higherthan <strong>from</strong> those burning salt-free wood residues, <strong>and</strong> are not considered here. Wood waste mayinclude large pieces, such as slabs, logs, <strong>and</strong> bark strips, as well as cuttings, shavings, pellets, <strong>and</strong>40sawdust.Various boiler firing configurations are used in burning wood waste. One commontype in smaller operations is the dutch oven or extension type <strong>of</strong> furnace with a flat grate (seeFigures 4-12 <strong>and</strong> 4-13). This unit is widely used because it can burn fuels with very highmoisture. Fuel is fed into the oven through apertures in a firebox <strong>and</strong> is fired in a cone-shapedpile on a flat grate. The burning is done in two stages: (1) drying <strong>and</strong> gasification, <strong>and</strong>(2) combustion <strong>of</strong> gaseous products. The first stage takes place in a cell separated <strong>from</strong> the boilersection by a bridge wall. The combustion stage takes place in the main boiler section. 39,40In another type <strong>of</strong> boiler, the fuel-cell oven, fuel is dropped onto suspended fixedgrates <strong>and</strong> is fired in a pile. The fuel cell further uses combustion air preheating <strong>and</strong> repositioning<strong>of</strong> the secondary <strong>and</strong> tertiary air injection ports to improve boiler efficiency. 40In many large operations, more conventional boilers have been modified to burnwood waste. These units may include spreader stokers with traveling grates or vibrating gratestokers, as well as tangentially fired or cyclone-fired boilers. The most widely used <strong>of</strong> theseconfigurations is the spreader stoker, which can burn dry or wet wood. Fuel is dropped in front<strong>of</strong> an air jet, which casts the fuel over a moving grate. The burning is done in three stages:(1) drying; (2) distillation <strong>and</strong> burning <strong>of</strong> volatile matter; <strong>and</strong> (3) burning <strong>of</strong> residual carbon. 394-63
FuelInTo CinderCollectors,Air Heater,<strong>and</strong> StackFuelChuteOverfireAirInDeckDropNoseAuxiliary FuelBurner(if used)OverfireAir InArchBridgeWallFuelPileAshPitUnderfireAir InFigure 4-12. One-Cell Dutch Oven-Type BoilerSource: Reference 40.4-64
Source: Reference 40.Figure 4-13. Schematic Process Flow for Dutch Oven Boiler4-65
S<strong>and</strong>er dust is <strong>of</strong>ten burned in various boiler types at plywood, particle board, <strong>and</strong>furniture plants. S<strong>and</strong>er dust contains fine wood particles with low moisture content (less than20 percent by weight). In some boilers, it is fired through a flaming horizontal torch, usually withnatural gas as an ignition aid or supplementary fuel. 40A recent development in wood-firing is FBC boilers. Refer to Section 4.2.1,Utility Sector, for a description <strong>of</strong> this boiler-type. Because <strong>of</strong> the large thermal mass representedby the hot inert bed particles, FBCs can h<strong>and</strong>le fuels with high moisture content (up to 70 percent,total basis). Fluidized beds can also h<strong>and</strong>le dirty fuels (up to 30 percent inert material). Wood ispyrolized faster in a fluidized bed than on a grate due to its immediate contact with hot bedmaterial. As a result, combustion is rapid <strong>and</strong> results in nearly complete combustion <strong>of</strong> organicmatter, thereby minimizing emission <strong>of</strong> unburned organic compounds. 40<strong>Emissions</strong> <strong>of</strong> CDD/CDF <strong>from</strong> wood-fired boilers are dependent on severalvariables: (1) wood waste composition <strong>and</strong> variability; (2) fossil fuel type <strong>and</strong> quantity, if any,co-fired with the wood waste; (3) combustor type <strong>and</strong> performance; <strong>and</strong> (4) air pollution controlsystems.The composition <strong>of</strong> wood waste has an impact on CDD/CDF emissions. Thecomposition <strong>of</strong> wood waste depends largely on the industry <strong>from</strong> which it originates. Pulpingoperations, for example, produce great quantities <strong>of</strong> bark that may contain more than 70 percentby weight moisture, along with s<strong>and</strong> <strong>and</strong> other noncombustibles. Because <strong>of</strong> this, bark boilers inpulp mills may emit considerable amounts <strong>of</strong> organic compounds to the atmosphere unless theyare well controlled. On the other h<strong>and</strong>, some operations, such as furniture manufacturing,produce a clean, dry wood waste, 5 to 50 percent by weight moisture, with relatively lowparticulate emissions when properly burned. Still other operations, such as sawmills, burn avarying mixture <strong>of</strong> bark <strong>and</strong> wood waste that results in particulate emissions somewhere betweenthose <strong>of</strong> pulp mills <strong>and</strong> furniture manufacturing. Additionally, when fossil fuels are co-fired with4-66
wood waste, the combustion efficiency is typically improved; therefore, organic emissions maydecrease.Combustor performance, especially the ability to provide ample air <strong>and</strong> fuel mixing<strong>and</strong> to maintain adequate temperatures for hydrocarbon destruction, are critical to minimizingemissions <strong>of</strong> CDD/CDF <strong>and</strong> precursor compounds. Key combustor design <strong>and</strong> operatingparameters are ample time <strong>and</strong> temperature for drying high moisture content materials, <strong>and</strong>adequate supply <strong>and</strong> proper placement <strong>of</strong> undergrate <strong>and</strong> overfire combustion air. If therequirements are satisfied, the potential for emission <strong>of</strong> CDD/CDF is significantly reduced.Emission Control Techniques<strong>Emissions</strong> controls for fossil fuel-fired industrial boilers are similar to thosepreviously described for coal-fired utility boilers. Traditionally, control devices on wood-firedboilers were intended primarily for particulate control. Mechanical collectors such asmulticyclones were most <strong>of</strong>ten used, especially on stoker-fired industrial boilers, to capture large,partially burned material <strong>and</strong> reinject it to the boiler. These devices, however, do not meet thecurrent New Source Performance St<strong>and</strong>ard for wood-fired boilers. Thus, for wood-fired utilityboilers, these multicyclones are <strong>of</strong>ten used in conjunction with secondary dust collectors,39,40including ESPs, wet scrubbers, or fabric filters. Scrubbers are most commonly venturi,although, impingement wet scrubbers are also used.On the West Coast, fabric filters are primarily used to collect chloride fumes in39boilers combusting salt-laden bark. Some gravel-bed filters have been used in lieu <strong>of</strong> fabricfilters to eliminate fabric fire hazards. Only limited numbers <strong>of</strong> wood-fired boilers use ESPs forcontrol because they are less effective at collecting high-carbon ash. Some boilers may requireadditional controls for nitrogen oxides <strong>and</strong> acid gas. Acid gas removal techniques, such as usinglimestone scrubbers, are <strong>of</strong>ten needed for boilers burning demolition debris <strong>and</strong> other chloride-39containing fuels.4-67
Several recent studies indicate that CDD/CDF emissions may increase across fabricfilters, wet scrubbers, <strong>and</strong> ESPs. This may be caused by low-temperature de novo synthesis, or atransformation reaction <strong>of</strong> CDD/CDF in the air pollution control equipment.Emission FactorsThe U.S. EPA reports emission factors (in AP-42) for wood waste combustion fortotal CDD/CDF developed <strong>from</strong> several test reports. One test was conducted on a Wellons QuadCell wood-fired boiler used for generating electricity. This boiler was tested under normal steadystateoperating conditions <strong>of</strong> 60,000 lb (27,216 kg) <strong>of</strong> steam per hour <strong>and</strong> 5 MW electricity. Thefuel consisted <strong>of</strong> coarse wood waste <strong>and</strong> coarse sawdust <strong>from</strong> non-industrial logging operations.The exhaust gas stream <strong>from</strong> the boiler passed through a multicyclone before entering the stackwhere CDD/CDF was sampled. In another study, speciated CDD/CDF data were reported <strong>from</strong> atest conducted on a wood-fired boiler exhaust in 1992. The boiler, firing wood/bark waste, wasequipped with a scrubber <strong>and</strong> produced less than 50,000 lb (22,680 kg) steam. These data are40presented in Table 4-13. Because the data are <strong>from</strong> only two tests <strong>and</strong> one <strong>of</strong> the boilers testedwas a utility boiler, it is not possible to conclude that the emission factors presented in Table 4-13are representative <strong>of</strong> the category.TABLE 4-13. TOTAL CDD/CDF EMISSION FACTORS FROMWOOD WASTE COMBUSTIONSCC 1-01-009-01/02/03, 1-02-009-01 through -07, 1-03-009-01/02/03(Utility, Industrial, <strong>and</strong> Commercial/Institutional Boilers)IsomerAverage Emission Factorlb/ton woodwaste burnedkg/Mg woodwaste burnedFactorQualityRatingTotal CDD 1.2x10 -8 6.0x10 -9 CTotal CDF 2.9x10 -8 1.5x10 -8 C2,3,7,8-TCDD 3.6x10 -11 1.8x10 -11 DSource: Reference 40.4-68
The National Council <strong>of</strong> the Paper Industry for Air <strong>and</strong> Stream Improvement Inc.(NCASI), recently summarized CDD/CDF levels measured <strong>from</strong> four industrial sources burning41wood residue <strong>and</strong>/or bark. All TEFs reported are based on the I-TEF/89 scheme, which hasbeen adopted by EPA for assessing the risks associated with CDD/CDF exposure.3 3The four wood-fired boilers tested ranged in size <strong>from</strong> 30x10 to 209x10 lb/hr4 4(1.4x10 to 9.5x10 kg/hr) steam production capacity. One boiler was operated at a steady rate <strong>of</strong>3 460x10 lb (2.7x10 kg) steam/hr during the tests <strong>and</strong> burned wood waste <strong>and</strong> sawdust in aWellons Quad Cell. This boiler is the same unit as described above <strong>and</strong> included in the emissionfactors presented in AP-42 for total CDD/CDF <strong>from</strong> wood residue combustion. The exhaustgases passed through a multicyclone before exiting through the stack. The second boiler tested3 3 4 4was also a Wellons Quad Cell operating between 30x10 to 60x10 lb (1.4x10 to 2.7x10 kg)stream/hr <strong>and</strong> burning wood chips <strong>and</strong> bark. The flue gases passed through a multicyclone <strong>and</strong> anESP before entering the stack.3The third boiler tested was a fluidized bed combustor. It operated at 209x10 lb4(9.5x10 kg) steam/hr <strong>and</strong> burned wood <strong>and</strong> agricultural waste. Air pollution control techniqueson this unit were vaporized ammonia injection for NO control, a multicyclone, <strong>and</strong> an ESP. Thexfourth boiler tested had two parallel spreader stokers. At test conditions, each boiler burned3 4wood waste <strong>and</strong> produced 110x10 lb (5.0x10 kg) steam/hr. The exhaust gases <strong>from</strong> each boiler41passed through its own dedicated ESP, <strong>and</strong> then through a common stack.NCASI also reported data <strong>from</strong> another study that tested five pulp <strong>and</strong> paperindustry boilers firing bark, wood residue, or a combination <strong>of</strong> these two fuels. During testing,3 3 5 5the boilers operated between 320x10 to 600x10 lb (1.4x10 to 2.7x10 kg) steam/hr.Table 4-14 provides a summary <strong>of</strong> the average CDD/CDF emissions (in TEQunits) <strong>from</strong> the nine boilers tested <strong>and</strong> described above. It should be noted that accurate estimates<strong>of</strong> the amount <strong>of</strong> bark or wood residue fired were not measured during the tests. However,4-69
TABLE 4-14. SUMMARY OF TOTAL CDD/CDF EMISSIONS FROM INDUSTRIAL WOODRESIDUE-FIRED BOILERSa,b c,d d,e d,f b,g b,g d,g d,f d,fUnit ID WFBA WFBB WFBC WFBD CBA WFBE WFBF CFB#5 CBF#4 Average Max Min-14-15-14-14-14-17-17-15-15-15-14I-TEF TEQ, 1.3x10 7.5x10 1.5x10 1.6x10 1.8x10 2.8x10 6.2x10 2.4x10 9.4x10 8.7x10 1.8x10 2.8x10⁻¹-1-1-1-1-4-4-2-1-1-1-4lb/dscf (ng/dscm) (2.1x10 ) (1.2x10 ) (2.4x10 ) (2.5x10 ) (2.8x10 ) (4.4x10 ) (9.9x10 ) (3.8x10 ) (1.5x10 ) (1.4x10 ) (2.8x10 ) (4.4x10 )-9I-TEF TEQ, 1.2x10 2.4x10 3.8x10⁻⁴-3-6lb/ton (µg/kg) (6.2x10 ) (1.2x10 ) (1.9x10 )wood h -9-17-12Source: Reference 41.4-70Note: All results were reported at 12 percent CO . Unit IDs are confidential identification codes for the mills, boilers, <strong>and</strong> units tested.2abcdefghFuel = wood waste <strong>and</strong> sawdust.Final control device = multicyclone.Fuel = wood chips <strong>and</strong> bark.Final control device = ESP.Fuel = wood <strong>and</strong> agriculture waste.Fuel = wood waste only.Fuel = 100 percent bark.Assuming 1,850 scf CO per million Btu, 9,000 Btu/lb dry wood, <strong>and</strong> 50 percent wood moisture.2
NCASI used an average F factor <strong>and</strong> an average heat content value for wood combustion toconvert concentrations to emission factors. An F factor is the ratio <strong>of</strong> the gas volume <strong>of</strong> theproducts <strong>of</strong> combustion to the heat content <strong>of</strong> the fuel. Using an F factor <strong>of</strong> 1,850 st<strong>and</strong>ard cubicfeet (scf) CO /MMBtu <strong>and</strong> a heat value <strong>of</strong> 9,000 Btu/lb dry wood residue (or bark), an average2-3 41industrial wood combustion emission factor <strong>of</strong> 1.2x10 µg TEQ/kg dry fuel was obtained. Thetypical moisture content <strong>of</strong> bark/wood residue is about 50 percent. Thus, an average emission-4 41factor on an as-fired basis <strong>of</strong> 6.2x10 µg TEQ/kg as-fired wood residue is obtained.Bleached Kraft Mill Sludge Burning in Wood-Fired BoilersPrimary <strong>and</strong> secondary sludges <strong>from</strong> pulp mills are increasingly dewatered <strong>and</strong>41burned in industrial bark boilers. The sludge <strong>from</strong> mills with bleaching operations can containfairly significant levels <strong>of</strong> chloride. The concern exists that CDD/CDF emissions will increasesignificantly <strong>from</strong> the addition <strong>of</strong> bleached kraft mill (BKM) sludge to the bark or wood residuefuel. NCASI reports emissions data <strong>from</strong> three tests <strong>of</strong> a spreader stoker boiler equipped with anESP, burning BKM sludge with the wood residue. Results <strong>from</strong> a second test are also reportedwhere bark <strong>and</strong> coal were burned in a spreader stoker with small amounts <strong>of</strong> BKM sludge. Theresults <strong>of</strong> these two tests suggest that the burning <strong>of</strong> BKM sludge has little impact on CDD/CDF41emissions <strong>from</strong> wood combustion. Table 4-15 presents the average emissions data <strong>from</strong> thesetests.TABLE 4-15. TOTAL CDD/CDF EMISSIONS FROM A WOOD-FIRED BOILER WHILEBURNING BLEACHED KRAFT MILL SLUDGE aAverage <strong>Emissions</strong> at 12% CO 2lb/dscfng/dscm-18 -4I-TEF TEQ 8.7x10 1.4x10b -15 -2I-TEF TEQ 1.3x10 2.1x10Source: Reference 41.a Spreader stoker equipped with an ESP; Test date, November 1993.b Fired with coal, wood residue, <strong>and</strong> BKM sludge.4-71
Source LocationsMost <strong>of</strong> the coal-fired industrial boiler sources are located in the Midwest,Appalachian, <strong>and</strong> Southeast regions. Industrial wood-fired boilers tend to be located almostexclusively at pulp <strong>and</strong> paper, lumber products, <strong>and</strong> furniture industry facilities. These industriesare concentrated in the Southeast, Gulf Coast, Appalachian, <strong>and</strong> Pacific Northwest regions. ThePacific Northwest contains many <strong>of</strong> the boilers firing salt-laden wood bark. As <strong>of</strong> 1980, therewere approximately 1,600 wood-fired boilers operating in the United States, with a total capacity<strong>of</strong> over 30,000 megawatts (MW). 40Trade associations such as the American Boiler Manufacturers Association inArlington, Virginia (703-522-7350) <strong>and</strong> the Council <strong>of</strong> Industrial Boiler Owners in FairfaxStation, Virginia (703-250-9042) can provide information on industrial boiler locations <strong>and</strong>trends.4.2.3 Residential SectorThe residential sector includes furnaces, stoves, <strong>and</strong> fireplaces burning coal, oil,gas, <strong>and</strong> wood to produce heat for individual homes. Residential coal-fired furnaces are usuallyunderfeed h<strong>and</strong>-stoked units, while oil-fired furnaces are designed with varying burnerconfigurations. Emission factors are presented in this section for both <strong>of</strong> these sources. Gasfiredfurnaces, which are unlikely sources <strong>of</strong> CDD/CDF, are not included here.Residential wood combustion devices include furnaces, fireplaces, <strong>and</strong>woodstoves. Furnaces firing wood are similar in design <strong>and</strong> operation to those burning coal.Fireplaces are used primarily for supplemental heating <strong>and</strong> for aesthetic effects. Energyefficiencies <strong>of</strong> prefabricated fireplaces are slightly higher than those <strong>of</strong> masonry fireplaces. 424-72
The combustion <strong>of</strong> fossil fuels or wood in residential units (woodstoves, furnaces,fireplaces) is a relatively slow <strong>and</strong> low-temperature process. Because combustion in theresidential sector tends to be less efficient than in other sectors, the potential to form CDD/CDFmay be greater. Also, inadequate maintenance <strong>of</strong> these units may increase potential forCDD/CDF formation on particulate matter. Furthermore, residential combustion units aregenerally not equipped with gaseous or particulate control devices.Process DescriptionIn the residential sector, coal is usually combusted in underfeed or h<strong>and</strong>-stokedfurnaces. Stoker fed units are the most common design for warm-air furnaces <strong>and</strong> for boilersused for steam or hot water production. These units are typically controlled with an automaticthermostat <strong>and</strong> designed for a specific type <strong>of</strong> coal. Other coal-fired heating units include h<strong>and</strong>fedroom heaters, metal stoves, <strong>and</strong> metal <strong>and</strong> masonry fireplaces. Most <strong>of</strong> the coal combusted in14,43all <strong>of</strong> these units is either bituminous or anthracite. These units operate at low temperatures<strong>and</strong> do not efficiently combust fuel. Generally, coal contains small quantities <strong>of</strong> chlorine <strong>and</strong>CDD/CDF precursors. Therefore, the potential for CDD/CDF formation exists.Oil-fired residential furnaces are designed with varying burner configurations, eachattempting to optimize fuel combustion efficiency. <strong>Emissions</strong> <strong>from</strong> fuel oil combustion depend onthe grade <strong>and</strong> composition <strong>of</strong> the oil, the design <strong>of</strong> the furnace, <strong>and</strong> the level <strong>of</strong> equipmentmaintenance.Important fuel oil combustion properties include pumpability, heating value, <strong>and</strong>ash content. Lighter grade oils are more easily atomized <strong>and</strong> generally exhibit better combustion44properties than heavier grade oils. Both furnace design <strong>and</strong> equipment maintenance influencecombustion efficiency. Particulate matter emissions depend most on the ash content <strong>and</strong> grade <strong>of</strong>oil fired, with lighter grade oils exhibiting lower emissions. Oil contains only small amounts <strong>of</strong>chlorine <strong>and</strong> CDD/CDF precursors.4-73
Woodstoves are used commonly in residences as space heaters to supplementconventional heating systems. Woodstoves transfer heat by radiation <strong>from</strong> the hot stove walls tothe room. Circulating stoves convert radiant energy to warm convection air. Combustionefficiencies for woodstoves are dependent on stove design <strong>and</strong> operating characteristics.Consequently, combustion efficiency <strong>and</strong> emissions vary greatly among woodstoves. Forpurposes <strong>of</strong> estimating emissions, woodstoves are classified into four categories: conventionalwoodstoves, noncatalytic woodstoves, pellet stoves, <strong>and</strong> catalytic woodstoves. These categories14,42are based on fuel type <strong>and</strong> emission reduction features. Woodstoves have a greater potentialtoemit CDD/CDF than fossil fuel-fired units due to the presence <strong>of</strong> CDD/CDF precursors present inwood. Figure 4-14 depicts a typical noncatalytic woodstove.Emission Control TechniquesAs mentioned previously, residential combustion sources do not generally use airpollution control devices. The effect <strong>of</strong> controls that are used on CDD/CDF emissions has notbeen studied.Coal-fired residential combustion sources are generally not equipped with PM orgaseous pollutant control devices. Changes in stove design <strong>and</strong> operating practices, however,have been made to effect lower PM, hydrocarbon, <strong>and</strong> CO emissions. Changes include modifiedcombustion air flow control, better thermal control <strong>and</strong> heat storage, <strong>and</strong> the use <strong>of</strong> combustioncatalysts. 14Residential oil- <strong>and</strong> wood-fired furnaces are not equipped with pollution controlequipment. Residential fireplaces do not typically employ control devices.Wood stove emissions reduction features include baffles, secondary combustionchambers, <strong>and</strong> catalytic combustors. Catalytic combustors or convertors are similar to those usedin automobiles. Wood stove control devices may lose efficiency over time. Control degradation4-74
C1-C 7BagTo Continuous Gas Analyzersto FIDProbeThermocoupleWires T Deg C7'6"20"AsbestosAluminumScale30"Figure 4-14. Simplified Diagram <strong>of</strong> a Freest<strong>and</strong>ing Noncatalytic WoodstoveSource: Reference 42.4-75
for any stoves, including noncatalytic woodstoves, may occur as a result <strong>of</strong> deteriorated seals <strong>and</strong>gaskets, misaligned baffles <strong>and</strong> bypass mechanisms, broken refractories, or other damaged42functional components. In addition, combustion efficiencies may be affected by differences inthe sealing <strong>of</strong> the chamber <strong>and</strong> control <strong>of</strong> the intake <strong>and</strong> exhaust systems. 14,43Emission Factors43Emission factors for coal-fired residential furnaces are presented in Table 4-16.These emission factors are based on average particulate CDD/CDF concentrations <strong>from</strong> chimneysoot samples collected <strong>from</strong> 7 coal stoves, <strong>and</strong> particulate emission factors obtained <strong>from</strong>42,44AP-42. These emission factors represent the maximum emission rates <strong>from</strong> these sources, aschimney soot may not be representative <strong>of</strong> the particulate actually emitted to the atmosphere.Emission factors for oil-fired residential furnaces are presented in Table 4-17.These emission factors are based on average CDD/CDF concentrations in soot measured <strong>from</strong>43,4521 furnaces used in central heating, <strong>and</strong> particulate emission rates obtained <strong>from</strong> AP-42.Emission factors for a residential wood stove, fireplace, <strong>and</strong> furnace are presentedin Table 4-18. These emission factors are based on average CDD/CDF concentrations in soot43measured at 18 combustion unit chimneys, <strong>and</strong> particulate emission rates obtained <strong>from</strong> AP-42.These emission factors represent the maximum emission rates <strong>from</strong> these sources, as chimney sootmay not be representative <strong>of</strong> the particulate actually emitted to the atmosphere.In one study, an Atlanta Stove Works freest<strong>and</strong>ing noncatalytic woodstove,depicted in Figure 4-14, was sampled. The stove combusted oak <strong>and</strong> pine aged for one year. Thestove was operated at low burn rates <strong>and</strong> low operating temperatures for maximum wood-useefficiency, which is representative <strong>of</strong> normal residential use. Burn rates for individual test runs47ranged <strong>from</strong> 2.9 to 7.7 lb/hr (1.3 to 3.5 kg/hr). Sampling for CDD/CDF emissions wasperformed at the outlet exhaust stack in each <strong>of</strong> a series <strong>of</strong> three test runs. However, no valid flue4-76
TABLE 4-16. CDD/CDF EMISSION FACTORS FOR COAL-FIREDRESIDENTIAL FURNACESFACTOR QUALITY RATING: UIsomerDIOXINSCoal Furnaces alb/ton coal burned (mg/Mg coal burned)Anthracite(AMS Code 21-04-001-000)Bituminous(AMS Code 21-04-002-000)-9 -3 -9 -32,3,7,8-TCDD 3.2x10 (1.6x10 )4.8x10 (2.4x10 )-7 -2 -7 -2Total Other TCDD 1.2x10 (6.0x10 )1.8x10 (9.0x10 )-8 -2Total PeCDD 6.2x10 (3.1x10 )-7 -2Total HxCDD 1.2x10 (6.0x10 )-7 -2Total HpCDD 1.1x10 (5.7x10 )-7 -2Total OCDD 1.5x10 (7.7x10 )-7 -1Total CDD 5.6x10 (2.9x10 )-8 -29.2x10 (4.6x10 )-7 -21.8x10 (9.0x10 )-7 -21.7x10 (8.6x10 )-7 -12.4x10 (1.2x10 )-7 -18.7x10 (4.3x10 )FURANS-8 -22,3,7,8-TCDF 8.4x10 (4.2x10 )-7 -1Total Other TCDF 7.4x10 (3.7x10 )-7 -1Total PeCDF 6.8x10 (3.4x10 )-7 -1Total HxCDF 2.6x10 (1.3x10 )-8 -2Total HpCDF 6.4x10 (3.2x10 )-9 -3Total OCDF 8.4x10 (4.2x10 )-6 -1Total CDF 1.8x10 (9.2x10 )-7 -21.3x10 (6.3x10 )-6 -11.1x10 (5.5x10 )-6 -11.1x10 (5.5x10 )-7 -13.8x10 (1.9x10 )-8 -29.4x10 (4.7x10 )-8 -31.3x10 (6.3x10 )-62.8x10 (1.41)Source: Reference 43.a Based on CDD/CDF particulate concentrations <strong>and</strong> particulate emission factors <strong>from</strong> AP-42 as follows:FuelanthracitebituminousEmission Factor611.0 lb/ton (5.5x10 mg/Mg)616.5 lb/ton (8.2x10 mg/Mg)4-77
TABLE 4-17. CDD/CDF EMISSION FACTORS FOR OIL-FIREDRESIDENTIAL FURNACESAMS 21-04-004-000, 21-04-005-000FACTOR QUALITY RATING: UOil Central Heating aIsomerlb/galmg/LDIOXINS2,3,7,8-TCDD 4.7x10 -13 5.6x10 -8Total Other TCDD 6.9x10 -13 8.3x10 -8Total PeCDD 6.8x10 -13 8.2x10 -8Total HxCDD 5.5x10 -13 6.6x10 -8Total HpCDD 5.3x10 -13 6.3x10 -8Total OCDD 5.5x10 -13 6.6x10 -8Total CDD 3.5x10 -12 4.2x10 -7FURANS2,3,7,8-TCDF 4.4x10 -13 5.3x10 -8Total Other TCDF 5.1x10 -12 6.1x10 -7Total PeCDF 3.5x10 -12 4.2x10 -7Total HxCDF 1.4x10 -12 1.7x10 -7Total HpCDF 6.1x10 -13 7.3x10 -8Total OCDF 2.5x10 -13 3.0x10 -8Total CDF 1.1x10 -11 1.4x10 -6Source: Reference 43.a Based on particulate CDD/CDF concentrations <strong>and</strong> particulate emission factors <strong>from</strong> AP-42 as follows:FueloilEmission Factor-3 22.5x10 lb/gal (3.0x10 mg/L)4-78
TABLE 4-18. AVERAGE CDD/CDF EMISSION FACTORS FOR WOOD-FIREDRESIDENTIAL COMBUSTORSFACTOR QUALITY RATING: UIsomerDIOXINSWood Stove a(AMS Code21-04-008-010)lb/ton (mg/Mg)wood burnedFireplace a(AMS Code21-04-008-001)lb/ton (mg/Mg)wood burnedWood Furnace a(AMS Code21-04-008-010)lb/ton (mg/Mg)wood burned-9 -3 -8 -2 -9 -32,3,7,8-TCDD 9.2x10 (4.6x10 ) 2.8x10 (1.4x10 ) 5.4x10 (2.7x10 )-7 -2Total Other TCDD 1.7x10 (8.6x10 )-7 -1Total PeCDD 9.8x10 (4.9x10 )-7 -1Total HxCDD 4.4x10 (2.2x10 )-7 -1Total HpCDD 3.4x10 (1.7x10 )-7 -1Total OCDD 3.0x10 (1.5x10 )-6Total CDD 2.2x10 (1.1)-7 -1NR 4.8x10 (2.4x10 )-7 -16.2x10 (3.1x10 )-8 -24.8x10 (2.4x10 )-8 -31.4x10 (7.0x10 )-8 -31.1x10 (5.6x10 )-7 -17.2x10 (3.6x10 )-7 -18.8x10 (4.4x10 )-7 -15.2x10 (2.6x10 )-7 -17.2x10 (3.6x10 )-7 -19.0x10 (4.5x10 )-63.5x10 (1.8)FURANS-7 -12,3,7,8-TCDF 4.0x10 (2.0x10 )-6Total Other TCDF 2.8x10 (1.4)-6Total PeCDF 3.4x10 (1.7)-6Total HxCDF 2.2x10 (1.1)-7 -1Total HpCDF 5.0x10 (2.5x10 )-7 -1Total OCDF 2.8x10 (1.4x10 )-6Total CDF 9.6x10 (4.8)-7 -1NA 4.8x10 (2.4x10 )-9 -38.4x10 (4.2x10 )-8 -24.0x10 (2.0x10 )-7 -14.8x10 (2.4x10 )-8 -31.1x10 (5.6x10 )-9 -32.8x10 (1.4x10 )-7 -15.4x10 (2.7x10 )-66.8x10 (3.4)-51.1x10 (5.5)-63.2x10 (1.6)-7 -15.8x10 (2.9x10 )-7 -21.2x10 (5.9x10 )-52.2x10 (11.1)Source: Reference 43.a Based on particulate CDD/CDF concentrations <strong>and</strong> emission factors <strong>from</strong> AP-42 as follows:Devicewood stovefireplacewood furnaceEmission Factor746.2 lb/ton (2.3x10 mg/Mg)730.8 lb/ton (1.5x10 mg/Mg)746.2 lb/ton (2.3x10 mg/Mg) (assumed to be identical to wood stove)NA = Not available.NR = Not reported.4-79
gas CDD/CDF emissions data were obtained because <strong>of</strong> the large amounts <strong>of</strong> hydrocarbonspresent. 46Woodstove ash <strong>and</strong> flue wipe samples showed minimal CDD/CDF content.OCDD was the only homologue detected in the ash samples analyzed. The maximum OCDDcontent <strong>of</strong> the ash samples was 0.09 ppb. Small quantities <strong>of</strong> OCDD were found in each <strong>of</strong> thetwo flue wipe samples analyzed, with HpCDD also being detected in one <strong>of</strong> the two samples. Themaximum OCDD content <strong>of</strong> the flue wipe samples was 0.6 parts per billion (ppb), <strong>and</strong> themeasured HpCDD content was 0.04 ppb. 46CDD/CDF precursor analyses were performed on samples <strong>of</strong> the wood fed to thestove. The specific CDD/CDF precursors analyzed for were chlorophenols, chlorobenzenes,PCB, <strong>and</strong> total chlorides. Chlorobenzenes, chlorophenols, <strong>and</strong> PCB were not detected in the oak<strong>and</strong> pine samples analyzed. The total chloride contents <strong>of</strong> the oak <strong>and</strong> pine samples were125 parts per million (ppm) <strong>and</strong> 49 ppm, respectively. In addition, continuous emissionsmonitoring was performed at the stove exhaust location for O . The average O content <strong>of</strong> the2 2flue gas was 17.0 percent volume. 46Three additional studies provided information on CDD concentrations in the ashcollected <strong>from</strong> 24 woodstoves. The woodstoves tested were located in rural areas in threedifferent regions <strong>of</strong> the country. Presumably, the wood being burned was untreated, that is, it hadnot been exposed to fungicides, herbicides, or wood preservatives. No analysis was done for thePeCDD homologue. For the 24 woodstoves tested, CDD concentrations in ash samples ranged<strong>from</strong> 0.007-210 ppb, with a mean concentration <strong>of</strong> 23.4 ppb. Seventeen samples were analyzedfor the 2,3,7,8-TCDD isomer. 2,3,7,8-TCDD was not detected in two samples. The detectionlimits <strong>of</strong> the samples ranged <strong>from</strong> 0.0009 to 0.0014 ppb. The other 15 samples hadconcentrations <strong>of</strong> 2,3,7,8-TCDD varying <strong>from</strong> 0.001 to 0.20 ppb, with an average concentration<strong>of</strong> 0.05 ppb. The authors <strong>of</strong> one <strong>of</strong> the studies, in which 18 woodstoves were tested, attributedsome <strong>of</strong> the variability in the results to differences in woodstove design <strong>and</strong> sampling points.4-80
They also suggested that some <strong>of</strong> the variability could potentially be attributed to fuelcontamination, although feed samples were not analyzed for CDD content. 9In another study, ash samples <strong>from</strong> the chimneys <strong>of</strong> two fireplaces were analyzedfor CDD. One fireplace was 12 years old <strong>and</strong> one was 25 years old. The latter had total CDDconcentrations <strong>of</strong> 44.7 ppb, including 1 ppb <strong>of</strong> 2,3,7,8-TCDD. Ash samples <strong>from</strong> the 12-year-oldfireplace contained 1.79 ppb CDD. No TCDD isomers were detected at a detection limit <strong>of</strong>0.04 ppb. The PeCDD homologue was not analyzed for in either <strong>of</strong> these samples. Ash samplesscraped <strong>from</strong> the flue pipe <strong>of</strong> a residential heater combusting wood found CDD levels <strong>of</strong>90.97 ppb.Source Locations47Locations <strong>of</strong> residential combustion sources are tied directly to population trends.Coal consumption for residential combustion purposes occurs mainly in the Northeast,Appalachian, <strong>and</strong> Midwest regions. Residential oil consumption is greatest in the Northeast <strong>and</strong>Mid-Atlantic regions. Wood-fired residential units are generally concentrated in heavily forestedareas <strong>of</strong> the United States, which reflects fuel selection based on availability <strong>and</strong> price. 144.2.4 Waste Tire IncinerationWaste tires are incinerated for energy recovery <strong>and</strong> disposal purposes. Tires arecombusted at tire-to-energy facilities, cement kilns, tire manufacturing facilities, <strong>and</strong> assupplemental fuel in boilers, especially in the pulp <strong>and</strong> paper industry. The U.S. EPA estimatesthat about 0.5 million metric tons (500 million kg) <strong>of</strong> tires are incinerated annually in the United48States. In 1990, 25.9 million (about 11 percent) <strong>of</strong> the 242 million tires discarded in the United48States were converted to energy. One report indicates that seven cement kilns utilized about23 percent <strong>of</strong> the scrap tires in 1990, <strong>and</strong> that one tire-to-energy facility utilized about 19 percent.4-81
The Scrap Tire Management Council reports that about 46 percent <strong>of</strong> discarded tires were utilizedby eight different pulp <strong>and</strong> paper facilities. 49Process DescriptionThe combustion processes <strong>and</strong> procedures for burning discarded tires are the sameas described previously within this section <strong>of</strong> this report.Emission Control TechniquesAvailable information <strong>from</strong> one tire-to-energy facility indicates the use <strong>of</strong> a spray50dryer combined with a fabric filter for an air pollution control device. These devices are capable<strong>of</strong> greater than 95 percent reduction <strong>and</strong> control <strong>of</strong> CDD/CDF compounds. However, operational<strong>and</strong> control device information for other tire incineration facilities in the United States is notknown.Emission Factors<strong>Emissions</strong> data <strong>and</strong> test reports <strong>from</strong> tire incineration facilities available at the timethis report was prepared were limited. One test report available was <strong>from</strong> a study conducted at a50tire-to-energy facility in California. The facility consists <strong>of</strong> two excess air incinerators equippedwith steam boilers for energy recovery. Whole tires were fed at a rate <strong>of</strong> 1364 lb/hr (3000 kg/hr).The facility uses a spray dryer <strong>and</strong> flue gas desulfurization followed by a fabric filter to controlemissions. 50Emission factors for total CDD/CDF <strong>and</strong> TEQ in units <strong>of</strong> mg/kg <strong>of</strong> tires50combusted were developed <strong>from</strong> emissions test results at this one facility. From these data,4-82
average CDD/CDF emission factors were estimated <strong>and</strong> are presented in Table 4-19. Extremecaution should be used in applying these emission factors to any other incinerator. If anotherfacility was not equipped with the same devices, then the uncontrolled emissions <strong>of</strong> CDD/CDFcould be much greater.TABLE 4-19. CDD/CDF EMISSION FACTORS FROM WASTE TIREINCINERATIONSCC 5-03-001-08FACTOR QUALITY RATING: EIsomer lb/ton tires burned mg/kg tires burned-11 -82,3,7,8-TCDD 2.16x10 1.08x10⁻¹¹ -82,3,7,8-TCDF 5.42x10 2.71x10⁻⁹ -72,3,7,8-TCDD TEQ 1.08x10 5.40x10⁻⁹ -6Total CDD 6.50x10 3.25x10⁻⁸ -5Total CDF 2.14x10 1.07x10Source: Reference 50.Source LocationsBecause the burning <strong>of</strong> tires as waste occurs nationwide for various types <strong>of</strong>industries <strong>and</strong> combustors, no attempt was made to list specific sources or sites.4.3 CREMATORIES4.3.1 Process DescriptionPropane-fired Eclipse Burners (afterburner <strong>and</strong> ignition) are used at cemeteries forhuman body cremation. Eclipse Burners are rated at 2,115,000 Btu per hour capacity. Newer4-83
units installed in the late 1980's are equipped with a modulating ignition burner. When afterburnertemperatures reach about 1800 F (980 C), the ignition burner modulates to a low-fire mode thatwill reduce the Btu per hour usage.When the crematory reaches an operating temperature <strong>of</strong> 1,250 F (680 C) thebody container is placed on the combustion chamber grate <strong>and</strong> the ignition burner is fired to attaina target combustion temperature sufficient for the proper reduction <strong>of</strong> human remains. Thechamber preheat by the afterburner reaches 1,250 F (680 C) in about 30 to 45 minutes prior toash removal. When the body container is introduced into the combustion chamber, <strong>and</strong> the burneris ignited, cremation begins at about 1600 to 1800 F (870 to 980 C). Flame impingement on thebody takes two to three minutes; cremation occurs for about two hours. The remains are thenraked towards the ignition burner for about two minutes. Cooldown follows for 45 minutes to1.5 hours. During normal operation, three bodies per day are cremated in each retort.4.3.2 Emission FactorsEvaluation tests on two propane fired crematories at a cemetery in California wereconducted through a cooperative effort with the Sacramento Metropolitan Air Quality51Management District to determine emissions <strong>of</strong> toxic substances <strong>from</strong> a crematory. The unitswere calibrated to operate at a maximum <strong>of</strong> 1,450,000 Btu/hour. <strong>Emissions</strong> testing wasperformed over a two week period; thirty-six bodies were cremated during the test period. Thisequates to two bodies per crematory per day for nine days. The body <strong>and</strong> cardboard weights <strong>and</strong>wood process rates for each test per crematory were reported.CDD/CDF sampling, recovery, <strong>and</strong> analysis were performed in accordance withCalifornia Air Resources Board (CARB) Method 428, which is based on the use <strong>of</strong> EPAReference Modified Method 5 sampling train. Data <strong>from</strong> stack gas measurements <strong>from</strong> each <strong>of</strong>the nine tests performed during the evaluation program were tabulated <strong>and</strong> reported. Emissionfactors developed <strong>from</strong> these data are presented in Table 4-20.4-84
TABLE 4-20. CDD/CDF EMISSION FACTORS FROM A CREMATORYIsomerAverage Emission Factor in lb/bodyincinerated(kg/body incinerated)2,3,7,8-TCDD 4.58x10 -14-14(2.08x10 )Total TCDD 8.86x10 -13-13(4.03x10 )1,2,3,7,8-PeCDD 1.44x10 -13-14(6.53x10 )Total PeCDD 1.37x10 -12-13(6.21x10 )1,2,3,4,7,8-HxCDD 1.73x10 -13-14(7.85x10 )1,2,3,6,7,8-HxCDD 2.50x10 -13-13(1.13x10 )1,2,3,7,8,9-HxCDD 3.12x10 -13-13(1.42x10 )Total HxCDD 3.55x10 -12-12(1.61x10 )1,2,3,4,6,7,8-HpCDD 2.37x10 -12-12(1.08x10 )Total HpCDD 5.09x10 -12-12(2.31x10 )Total OCDD 3.77x10 -12-12(1.71x10 )Total CDD 1.47x10 -11-12(6.67x10 )2,3,7,8-TCDF 3.31x10 -13-13(1.50x10 )Total TCDF 6.90x10 -12-12(3.13x10 )1,2,3,7,8-PeCDF < 2.01x10 -13-14(< 9.12x10 )2,3,4,7,8-PeCDF < 5.76x10 -13-13(< 2.61x10 )Range <strong>of</strong> Datalb/body incinerated(kg/body incinerated)-14 -141.69x10 - 9.54x10⁻¹⁵ -14(7.67x10 - 4.33x10 )-13 -121.76x10 - 1.91x10⁻¹⁵ -14(7.67x10 - 4.33x10 )-14 -133.60x10 - 2.79x10⁻¹⁴ -13(1.63x10 - 1.27x10 )-13 -124.33x10 - 3.23x10⁻¹³ -12(1.96x10 - 1.47x10 )-14 -134.85x10 - 3.96x10⁻¹⁴ -13(2.20x10 - 1.80x10 )-14 -135.21x10 - 6.02x10⁻¹⁴ -13(2.36x10 - 2.73x10 )-14 -133.96x10 - 8.08x10⁻¹⁴ -13(1.80x10 - 3.67x10 )-13 -129.54x10 - 8.08x10⁻¹³ -12(4.33x10 - 3.67x10 )-13 -123.60x10 - 5.29x10⁻¹³ -12(1.63x10 - 2.40x10 )-12 -118.08x10 - 1.10x10⁻¹² -12(3.67x10 - 4.99x10 )-13 -126.53x10 - 6.46x10⁻¹³ -12(3.02x10 - 2.93x10 )-12 -113.02x10 - 3.07x10⁻¹² -11(1.37x10 - 1.39x10 )-14 -139.03x10 - 5.07x10⁻¹⁴ -13(4.10x10 - 2.30x10 )-12 -112.28x10 - 1.62x10⁻¹² -12(1.03x10 - 7.35x10 )-14 -138.81x10 - 4.26x10⁻¹⁴ -13(3.40x10 - 1.93x10 )-13 -121.10x10 - 1.10x10⁻¹⁴ -13(4.99x10 - 4.99x10 )4-85
TABLE 4-20. CDD/CDF EMISSION FACTORS FROM A CREMATORY (CONTINUED)IsomerAverage Emission Factor in lb/bodyincinerated(kg/body incinerated)Range <strong>of</strong> Datalb/body incinerated(kg/body incinerated)Total PeCDF 4.06x10 -12-12(1.84x10 )1,2,3,4,7,8-HxCDF 5.97x10 -13-13(2.71x10 )1,2,3,6,7,8-HxCDF 5.38x10 -13-13(2.44x10 )1,2,3,7,8,9-HxCDF 1.05x10 -12-13(4.76x10 )2,3,4,6,7,8-HxCDF 2.16x10 -13-14(9.80x10 )Total HxCDF 6.85x10 -12-12(3.11x10 )1,2,3,4,6,7,8-HpCDF < 3.08x10 -12-12(< 1.40x10 )1,2,3,4,7,8,9-HpCDF < 1.89x10 -13-14(< 8.57x10 )Total HpCDF < 3.62x10 -12-12(< 1.64x10 )Total OCDF 1.01x10 -12-13(4.58x10 )Total CDF < 2.24x10 -11-11(
4.3.3 Source LocationIn 1991, there were about 400,500 cremations in more than 1,000 crematorieslocated throughout the United States. Table 4-21 lists the number <strong>of</strong> crematories located in eachstate <strong>and</strong> the estimated number <strong>of</strong> cremations performed in each state for the year 1990, where52itemized data were available.4.4 IRON AND STEEL FOUNDRIES/SCRAP METAL MELTING4.4.1 Process DescriptionIron <strong>and</strong> steel foundries can be defined as those that produce gray, white, ductile,or malleable iron <strong>and</strong> steel castings. Both cast irons <strong>and</strong> steels are solid solutions <strong>of</strong> iron, carbon,<strong>and</strong> various alloying materials. Iron foundries produce iron castings <strong>from</strong> scrap iron, pig iron, <strong>and</strong>foundry returns by melting, alloying, <strong>and</strong> molding. The major operations include: (1) rawmaterial h<strong>and</strong>ling <strong>and</strong> preparation, (2) metal melting, (3) mold <strong>and</strong> core production,<strong>and</strong> (4) casting <strong>and</strong> finishing. A generic flow diagram for iron <strong>and</strong> steel foundries is shown inFigure 4-15. Figure 4-16 depicts the emission points in a typical iron foundry.Iron <strong>and</strong> steel castings are produced in a foundry by injecting or pouring moltenmetal into cavities <strong>of</strong> a mold made <strong>of</strong> s<strong>and</strong>, metal, or ceramic material. The metal melting processis accomplished primarily in cupola (or blast) furnaces, <strong>and</strong> to a lesser extent in electric arcfurnaces (EAF). The cupola, which is the major type <strong>of</strong> furnace used in industry today, istypically a vertical, cylindrical steel shell with either a refractory lined or water cooled inner wall.Refractory linings usually consist <strong>of</strong> silica brick, or dolomite or magnesium brick. Cupolas arecharged with alternate layers <strong>of</strong> coke, metallics, <strong>and</strong> fluxes. Combustion air is introduced into thecupola through tuyeres located at the base. About 70 percent <strong>of</strong> all iron castings are producedusing cupolas, while steel foundries rely almost exclusively on EAFs or induction furnaces formelting purposes.4-87
TABLE 4-21. 1991 U.S. CREMATORY LOCATIONS BY STATEStateNo. <strong>of</strong>CrematoriesNo. <strong>of</strong>Cremations aStateNo. <strong>of</strong>CrematoriesNo. <strong>of</strong>Cremations aAlabama 6 1,138 Montana 12 2,502Alaska 7 790 Nebraska 6 1,139Arizona 26 10,189 Nevada 11 5,009Arkansas 13 1,787 New Hampshire 6 1,842California 141 86,374 New Jersey 16 14,427Colorado 28 7,432 New Mexico 9 2,134Connecticut 10 4,260 New York 40 23,946Delaware 4 1,165 North Carolina 24 4,749District <strong>of</strong>Columbia1 b North Dakota 1 bFlorida 95 46,775 Ohio 41 12,552Georgia 14 2,684 Oklahoma 9 1,372Hawaii 10 3,495 Oregon 34 9,020Idaho 12 1,949 Pennsylvania 44 12,153Illinois 44 12,083 Rhode Isl<strong>and</strong> 5 1,842Indiana 21 3,636 South Carolina 10 1,764Iowa 15 2,241 South Dakota 4 bKansas 10 1,559 Tennessee 8 1,712Kentucky 5 1,192 Texas 36 9,340Louisiana 6 1,853 Utah 5 769Maine 4 2,656 Vermont 5 1,570Maryl<strong>and</strong> 17 5,587 Virginia 25 6,097Massachusetts 13 8,104 Washington 46 15,673Michigan 38 13,431 West Virginia 6 582Minnesota 18 5,662 Wisconsin 29 5,541Mississippi 4 450 Wyoming 2 bMissouri 19 4,637Source: Reference 52.a 1990 data. Data allocated by state for 1991 were not available.b No information available.4-88
New S<strong>and</strong>AdditivesS<strong>and</strong>PreparationMoldingNew S<strong>and</strong>Chemical Resins,Binders & CatalystsS<strong>and</strong>PreparationCore Making4-89Hot Metal Transfer,Slagging<strong>and</strong>TreatmentMold Pouring<strong>and</strong> CoolingReturn S<strong>and</strong> Transfer,Processing <strong>and</strong> StorageMelting<strong>and</strong>AlloyingShakeoutScrap Metal <strong>and</strong>Ingot (Also Fuel<strong>and</strong> Flux)ChargePreparationCleaning<strong>and</strong>FinishingFinished Casting (Product)Figure 4-15. Process Flow Diagram for a Typical S<strong>and</strong>-cast Iron <strong>and</strong> Steel FoundrySource: Reference 53.
Figure 4-16. Emission Points in a Typical Iron <strong>and</strong> Steel FoundrySource: Reference 53.4-90
The heat produced by the burning coke melts the iron, which flows down <strong>and</strong> istapped <strong>from</strong> the bottom <strong>of</strong> the cupola. Fluxes combine with non-metallic impurities in the charge<strong>and</strong> form slag, which is removed through tap holes at the bottom <strong>of</strong> the cupola. Cupola capacitiesrange <strong>from</strong> 1 to 30 tons (1 to 27 Mg) per hour, with a few large units capable <strong>of</strong> producing closeto 100 tons (90 Mg) per hour. Larger furnaces are operated continuously, with periodicinspections <strong>and</strong> cleanings between burn cycles. 53In either type <strong>of</strong> foundry, when the poured metal has solidified, the molds areseparated <strong>and</strong> the castings removed <strong>from</strong> the mold flasks on a casting shakeout unit. Abrasive(shotblasting) cleaning, grinding, <strong>and</strong> heat treating are performed as necessary. The castings arethen inspected <strong>and</strong> shipped to another industry for machining <strong>and</strong>/or assembly into a finalproduct. 544.4.2 Emission Control Techniques<strong>Emissions</strong> <strong>from</strong> cupolas can vary widely, depending on blast rate, blasttemperature, melt rate, coke-to-melt ratio <strong>and</strong> control technologies. Control technologiescommonly used to control emissions <strong>from</strong> iron <strong>and</strong> steel foundry metal melting operations includebaghouses, wet scrubbers, <strong>and</strong> afterburners. Additionally, emissions due to coke combustion maybe reduced by substitution <strong>of</strong> gas for heat or the use <strong>of</strong> graphite as a carbon source. 53Scrap preparation with heat will emit smoke, organic compounds, <strong>and</strong> carbonmonoxide, <strong>and</strong> scrap preparation with solvent degreasers will emit organics. Catalyticincinerators <strong>and</strong> afterburners can control about 95 percent <strong>of</strong> organic <strong>and</strong> carbon monoxideemissions. <strong>Emissions</strong> released <strong>from</strong> the melting furnaces include particulate matter, carbonmonoxide, organic compounds, sulfur dioxide, nitrogen oxides, <strong>and</strong> small quantities <strong>of</strong> chloride<strong>and</strong> fluoride compounds.4-91
4.4.3 Emission FactorsScrap metal melting processes have been found to be one source <strong>of</strong> CDD/CDF.The use <strong>of</strong> chlorinated compounds in iron <strong>and</strong> steel processes <strong>and</strong> the use <strong>of</strong> recycled scrap metalcontaminated with cutting oils <strong>and</strong> plastics containing chlorine provide all conditions required forthe formation <strong>of</strong> chlorinated aromatic compounds.A study funded by the Swedish Steel Producers Association noted that the amount<strong>of</strong> chlorine loaded (into a furnace) is <strong>of</strong> importance, but the design <strong>of</strong> the charging process seemsto be the determining factor for the formation <strong>of</strong> CDD/CDF. The Swedish study was carried outin a pilot plant with a 10-ton electric furnace charging scrap metal under different operationalconditions, either continuously through the furnace or batchwise into the open furnace.CDD/CDF were detected in the range <strong>of</strong> 0.1 to 1.5 ng TCDD-equivalents per normal cubic meter3(Nm ) dry gas. The largest emissions were observed during charging <strong>of</strong> scrap metal containing53PVC plastics.The emission factors presented in Table 4-22 were developed <strong>from</strong> a facility test55reporgenerated to comply with the requirements <strong>of</strong> California Assembly Bill (AB2588). The testprogram quantified emissions <strong>from</strong> a batch-operated cupola furnace charged with pig iron, scrapiron, steel scrap, coke, <strong>and</strong> limestone. Emission control devices operating during the tests werean oil-fired afterburner <strong>and</strong> a baghouse.Coke combined with combustion air provided the heat necessary to melt the metal,which was continuously tapped <strong>from</strong> the cupola, converted to ductile iron, <strong>and</strong> poured into steelpipe molds. Combustion gases <strong>from</strong> the cupola were vented to a gas-/oil-fired afterburnerfollowed by a baghouse.4-92
TABLE 4-22. CDD/CDF EMISSION FACTORS FROM A CUPOLA FURNACE aSCC 3-04-003-01FACTOR QUALITY RATING: DIsomer4-93Average Emission Factorlb/tonkg/Mg b2,3,7,8-TCDD 6.61x10 -11 3.31x10 -11Total TCDD 7.92x10 -9 3.96x10 -91,2,3,7,8-PeCDD 1.71x10 -10 8.55x10 -11Total PeCDD 3.52x10 -9 1.76x10 -91,2,3,6,7,8-HxCDD 1.01x10 -10 5.05x10 -11Total HxCDD 1.10x10 -9 5.50x10 -101,2,3,4,6,7,8-HpCDD 1.85x10 -10 9.25x10 -11Total HpCDD 3.81x10 -10 1.91x10 -10Total OCDD NR NRTotal CDD 1.34x10 -8 6.72x10 -92,3,7,8-TCDF 1.04x10 -9 5.20x10 -10Total TCDF 5.16x10 -8 2.58x10 -81,2,3,7,8-PeCDF 6.10x10 -10 3.05x10 -102,3,4,7,8-PeCDF 6.99x10 -10 3.50x10 -10Total PeCDF 1.70x10 -8 8.50x10 -71,2,3,4,7,8-HxCDF 3.79x10 -10 1.90x10 -101,2,3,6,7,8-HxCDF 3.39x10 -10 1.70x10 -102,3,4,6,7,8-HxCDF 2.02x10 -10 1.01x10 -10Total HxCDF 3.47x10 -9 1.74x10 -91,2,3,4,6,7,8-HpCDF 3.85x10 -10 1.93x10 -10Total HpCDF 4.87x10 -10 2.44x10 -10Total OCDF 1.17x10 -10 5.85x10 -11Total CDF 7.63x10 -8 8.8x10 -7Source: Reference 55.a Control device: Afterburner/baghouse.b Emission factors are lb (kg) <strong>of</strong> pollutant per ton (Mg) <strong>of</strong> metal charged.
4.4.4 Source LocationBased on a survey conducted by the EPA in support <strong>of</strong> the iron <strong>and</strong> steel foundrymaximum achievable control technology (MACT) st<strong>and</strong>ard development, there were 756 iron <strong>and</strong>56steel foundries in the United States in 1992. Foundry locations can be correlated with areas <strong>of</strong>heavy industry <strong>and</strong> manufacturing <strong>and</strong>, in general, with the iron <strong>and</strong> steel production industry(Ohio, Pennsylvania, <strong>and</strong> Indiana).Additional information on iron <strong>and</strong> steel foundries <strong>and</strong> their locations may beobtained <strong>from</strong> the following trade associations:American Foundrymen's Society, Des Plaines, Illinois;National Foundry Association, Des Plaines, Illinois;Ductile Iron Society, Mountainside, New Jersey;Iron Casting Society, Warrendale, Pennsylvania; <strong>and</strong>Steel Founders' Society <strong>of</strong> America, Des Plaines, Illinois.4.5 COMBUSTION-AIDED METAL RECOVERYThis section discusses CDD/CDF emissions <strong>from</strong> secondary metals recoveryfacilities that use combustion to eliminate combustible materials present in scrap raw material.During combustion, various solids (e.g., plastics) <strong>and</strong> liquids (e.g., solvents or oils) are burned <strong>of</strong>fin initial processing steps, leaving the metals free <strong>of</strong> combustible contaminants <strong>and</strong> suitable forfurther processing. The combustion <strong>of</strong> chlorine-containing plastics or liquids in these processescan produce CDD/CDF emissions.This section describes the processes used for five types <strong>of</strong> secondary metalrecovery: (1) secondary copper smelters, (2) secondary aluminum production, (3) secondary lead4-94
production, (4) scrap metal reclamation furnaces, <strong>and</strong> (5) drum <strong>and</strong> barrel reclamation furnaces.CDD/CDF emission factors are given for each process. Each emission factor presented for thesesources represents a unique furnace. A factor for one furnace should not be applied to anothersimilar furnace without considering differences in feedstock <strong>and</strong> combustion conditions.In addition to the five listed above, secondary ferrous metals recovery processescould produce CDD/CDF emissions. However, CDD/CDF emissions test data are not currentlyavailable for those processes.4.5.1 Secondary Copper SmeltersSecondary copper smelters recover copper <strong>from</strong> copper-bearing scrap materials,including electronic materials scrap, brass, iron-bearing copper scrap, <strong>and</strong> other copper-bearingmaterials. Some <strong>of</strong> the scrap materials contain chlorinated plastics such as polyvinyl chloride(PVC). CDD/CDF are produced as the plastic <strong>and</strong> other combustible materials are combusted inthe blast furnace. Figure 4-17 presents a general process flow diagram <strong>of</strong> a secondary coppersmelter.Process DescriptionThe feed material used in secondary copper recovery can be pretreated usingseveral different procedures, either separately or in combination. Feed scrap is concentrated bymanual or mechanical methods such as sorting, stripping, shredding, <strong>and</strong> magnetic separation.Feed scrap is sometimes formed into briquettes in a hydraulic press. Pyrometallurgicalpretreatment may include sweating, burning <strong>of</strong> insulation (especially <strong>from</strong> wire scrap), <strong>and</strong> drying(burning <strong>of</strong>f oil <strong>and</strong> volatiles) in rotary kilns. These techniques may cause the formation <strong>of</strong>CDD/CDF. Hydrometallurgical methods include flotation <strong>and</strong> leaching with chemical recovery.4-95
Source: Reference 57.Figure 4-17. Secondary Copper Recovery Process Flow Diagram4-96
Pretreated scrap that contains 10 to 30 percent copper is normally smelted in acupola-type blast furnace. A cupola furnace is a vertical, refractory-lined cylinder open at the top<strong>and</strong> equipped with vents at the bottom. Alternative charges <strong>of</strong> scrap, coke, <strong>and</strong> limestone areplaced on top <strong>of</strong> a burning bed <strong>of</strong> coke. As the scrap is heated, the metal melts <strong>and</strong> is drawn <strong>of</strong>fthrough a tap hole <strong>and</strong> spout at the bottom <strong>of</strong> the furnace; the combustibles are burned <strong>of</strong>f <strong>and</strong>combustion gases <strong>and</strong> PM exit the furnace. Oxides <strong>of</strong> copper <strong>and</strong> heavy metals are chemicallyreduced. Various impurities, such as iron, combine to form a slag, which collects on top <strong>of</strong> themolten metal <strong>and</strong> can be drawn <strong>of</strong>f separately.In a typical system, further smelting <strong>and</strong> refining are accomplished using areverberatory holding furnace, a converter, <strong>and</strong> a reverberatory or rotary refining furnace. Theholding furnace retains the melt until a sufficient batch is accumulated to form a charge to theconverter, <strong>and</strong> allows for tapping the slag. (An electric arc furnace can also be used for thispurpose.) Feed with a low-copper value can also be smelted in electric crucible or pot furnaces,where pure oxygen is used in place <strong>of</strong> air for oxidation.A converter consists <strong>of</strong> a cylindrical steel shell that can be rotated about itslongitudinal axis. An opening in one side emits the molten charge <strong>and</strong> vents gases. Air is blownthrough the melt by means <strong>of</strong> a horizontal row <strong>of</strong> pipes with openings (tuyeres) that are below theliquid metal when the furnace is rotated. A silica flux is added to remove iron <strong>from</strong> the metal,whereas zinc <strong>and</strong> any sulfur are converted to their respective oxides by the air that is blown in.The product <strong>from</strong> the converter is blister copper, usually 90 to 99 percent pure.This material may be poured <strong>and</strong> cast into ingots or it may be transferred while molten to anotherfurnace for a final pyrometallurgical process known as fire refining.Blister copper is typically purified further by fire refining to about 99.9 percentcopper. Fire-refined copper is cast into wirebar as well as ingots. The refining processes areessentially the same in secondary smelting as in primary copper smelting. Fire-refining furnaces4-97
are typically reverberatory or rotary furnaces. In both furnaces, air is blown through the moltenmetal to oxidize impurities that are removed as oxides in the slag, which is skimmed or poured<strong>of</strong>f. Copper oxide, formed to the extent <strong>of</strong> less than 1 percent <strong>of</strong> copper, is reduced by "poling"(submerging wooden poles in the molten metal) or by supplying a reducing atmosphere <strong>of</strong> gas (byfuel-rich combustion). The usual sequence <strong>of</strong> events in fire refining is (1) charging, (2) melting,(3) skimming, (4) blowing, (5) adding fluxes, (6) reducing, (7) reskimming, <strong>and</strong> (8) pouring.Electrolytic refining may be done as an additional step to produce electrolyticcopper. Electrolytic refining separates impurities <strong>from</strong> the copper by electrolysis in a solutioncontaining both copper sulfate <strong>and</strong> sulfuric acid. Metallic impurities form a sludge that can beremoved <strong>and</strong> treated for recovery <strong>of</strong> precious metals.Emission Control TechniquesGenerally, afterburners (usually natural gas-fired) are located at the top <strong>of</strong> thecupola furnace <strong>and</strong> serve to complete the combustion <strong>of</strong> the exhaust gases. These afterburnerscontrol emissions <strong>of</strong> unburned combustible PM <strong>and</strong> organic compounds.Exhaust gases <strong>from</strong> the furnace after the afterburners are typically cooled withwater in a spray chamber <strong>and</strong> mixed with ventilation gases <strong>from</strong> the furnace charge floor <strong>and</strong>/orambient air. Generally, this gas stream is then passed through a fabric filter (baghouse) beforerelease to the atmosphere.Emission FactorsEmission factors were identified for a secondary copper recovery cupola furnacefiring scrap materials that included shredded telephone equipment, other copper-bearing metallic58scrap, metallurgical slags, <strong>and</strong> plant revert, along with coke <strong>and</strong> limestone. The shreddedtelephone equipment was composed <strong>of</strong> circuit boards, switching gear, telephone parts, <strong>and</strong> other4-98
miscellaneous plastic parts. Some <strong>of</strong> the plastic contained in the scrap was PVC. The totalamount <strong>of</strong> telephone scrap processed accounted for 22 percent by weight <strong>of</strong> the total scrap feed.No other scrap materials contained plastic materials.The facility was equipped with natural gas-fired afterburners <strong>and</strong> a fabric filter.Flue gas temperature after the afterburners averaged 1,610 F (877 C). After water spraycooling, flue gas temperatures at the inlet to the fabric filter averaged 320 F (146 C).<strong>Emissions</strong> <strong>of</strong> TCDD/TCDF through OCDD/OCDF were measured after the fabricfilter at the stack outlet. Table 4-23 presents CDD/CDF emissions on a flue gas-concentrationbasis <strong>and</strong> as emission factors. Emission factors are based on the total weight <strong>of</strong> scrap metal(plastic <strong>and</strong> nonplastic-bearing metal) fed to the furnace.4.5.2 Secondary Aluminum ProductionSecondary aluminum producers recycle aluminum <strong>from</strong> aluminum-containingscrap, while primary aluminum producers convert bauxite ore into aluminum. The secondaryaluminum industry was responsible for 27.5 percent <strong>of</strong> domestic aluminum produced in 1989.There are approximately 116 plants with a recovery capacity <strong>of</strong> approximately 2.6 million tons(2.4 million megagrams) <strong>of</strong> aluminum per year. Actual total secondary aluminum production wasrelatively constant during the 1980s. However, increased dem<strong>and</strong> for aluminum by theautomobile industry has doubled in the last 10 years to an average <strong>of</strong> 173 pounds (78.5 kilograms)per car. Recycling <strong>of</strong> used aluminum beverage cans (UBC) increased more than 26 percent <strong>from</strong>1986 to 1989. In 1989, 1.4 million tons (1.3 million megagrams) <strong>of</strong> UBCs were recycled,representing over 60 percent <strong>of</strong> cans shipped. Recycling a ton <strong>of</strong> aluminum requires only5 percent <strong>of</strong> the energy required to refine a ton <strong>of</strong> primary aluminum <strong>from</strong> bauxite ore, making thesecondary aluminum economically viable.4-99
TABLE 4-23. CDD/CDF EMISSION CONCENTRATIONS AND EMISSION FACTORS FORSECONDARY COPPER SMELTING -COPPER RECOVERY CUPOLA FURNACESCC 3-04-002-11FACTOR QUALITY RATING: DIsomerDIOXINSFlue GasConcentration in lb/ft 3 Emission Factor in lb/ton(µg/dscm at 3% O 2 ) ( g/kg scrap feed) a,b,c-8 -72,3,7,8-TCDD 1.45x10 (232)2.54x10 (0.127)-8 -6Total Other TCDD 7.12x10 (1,140)1.22x10 (0.609)-7Total PeCDD 1.13x10 (1,810)-7Total HxCDD 1.45x10 (2,320)-7Total HpCDD 2.43x10 (3,890)-7Total OCDD 1.57x10 (2,520)-7Total CDD 7.43x10 (11,900)-61.94x10 (0.970)-62.52x10 (1.26)-64.16x10 (2.08)-62.70x10 (1.35)-51.28x10 (6.39)FURANS-72,3,7,8-TCDF 3.17x10 (5,070)-6Total Other TCDF 1.29x10 (20,600)-6Total PeCDF 1.00x10 (16,100)-7Total HxCDF 4.86x10 (7,790)-7Total HpCDF 3.98x10 (6,380)-7Total OCDF 2.93x10 (4,700)-6Total CDF 3.79x10 (60,700)-6TOTAL CDD/CDF 4.53x10 (72,600)-65.44x10 (2.72)-52.20x10 (11.0)-51.73x10 (8.64)-68.48x10 (4.24)-66.84x10 (3.42)-65.04x10 (2.52)-56.50x10 (32.5)-57.78x10 (38.89)Source: Reference 58.a <strong>Emissions</strong> measured in the stack gases after an afterburner <strong>and</strong> a fabric filter.b Includes all scrap feed (plastic <strong>and</strong> nonplastic-bearing) including coke <strong>and</strong> limestone.c The feed scrap for this furnace contained 22 percent by weight plastic-containing scrap.4-100
Process DescriptionSecondary aluminum production involves two general categories <strong>of</strong> operations--scrap pretreatment <strong>and</strong> smelting/refining. Pretreatment operations include sorting, processing,<strong>and</strong> cleaning scrap. Smelting/refining operations include cleaning, melting, refining, alloying, <strong>and</strong>pouring <strong>of</strong> aluminum recovered <strong>from</strong> scrap. The processes used to convert scrap aluminum toproducts such as lightweight aluminum alloys for industrial castings are in involved at any onefacility. Some steps may be combined or reordered, depending on the type <strong>of</strong> scrap used (seeFigures 4-18a <strong>and</strong> 4-18b). Some or all the steps in these figures may be quality, source <strong>of</strong> scrap,auxiliary equipment available, furnace design, <strong>and</strong> product specifications. Plant configuration,scrap type usage, <strong>and</strong> product output varies throughout the secondary aluminum industry.Scrap Pretreatment--Aluminum scrap comes <strong>from</strong> a variety <strong>of</strong> sources. "New"scrap is generated by pre-consumer sources, such as drilling <strong>and</strong> machining <strong>of</strong> aluminum castings,scrap <strong>from</strong> aluminum fabrication <strong>and</strong> manufacturing operations, <strong>and</strong> aluminum bearing residualmaterial (dross) skimmed <strong>of</strong>f molten aluminum during smelting operations. "Old" aluminum scrapis material that has been used by the consumer <strong>and</strong> discarded. Examples <strong>of</strong> old scrap include usedappliances, aluminum foil, automobile <strong>and</strong> airplane parts, aluminum siding, <strong>and</strong> beverage cans. 59Scrap pretreatment involves sorting <strong>and</strong> processing scrap to remove contaminants<strong>and</strong> to prepare the material for smelting. Sorting <strong>and</strong> processing separates the aluminum <strong>from</strong>other metals, dirt, oil, plastics, <strong>and</strong> paint. Pretreatment cleaning processes are based onmechanical, pyrometallurgical, <strong>and</strong> hydrometallurgical techniques.Mechanical Cleaning: Mechanical cleaning includes the physical separation <strong>of</strong>aluminum <strong>from</strong> other scrap, with hammer mills, ring rushers, <strong>and</strong> other machines to break scrapcontaining aluminum into smaller pieces. This improves the efficiency <strong>of</strong> downstream recovery bymagnetic removal <strong>of</strong> iron. Other recovery processes include vibratory screens <strong>and</strong> air classifiers.4-101
Figure 4-18a. Process Diagram fora Typical Secondary Aluminum Processing IndustrySource: Reference 59.4-102
Figure 4-18b. Process for a Typical Secondary Aluminum Processing Industry(Source Classification Codes in parentheses)Source: Reference 59.4-103
An example <strong>of</strong> mechanical cleaning is the dry milling process. Cold aluminumladendross <strong>and</strong> other residues are processed by milling <strong>and</strong> screening to obtain a productcontaining at least 60 to 70 percent aluminum. Ball, rod, or hammer mills can be used to reduceoxides <strong>and</strong> nonmetallic particles to fine powders for ease <strong>of</strong> removal during screening.Pyrometallurgical Cleaning: Pyrometallurgical techniques (called drying in theindustry) use heat to separate aluminum <strong>from</strong> contaminates <strong>and</strong> other metals. Pyrometallurgicaltechniques include roasting <strong>and</strong> sweating. The roasting process involves heating aluminum scrapthat contains organic contaminates in rotary dryers to temperatures high enough to vaporize orcarbonize organic contaminates, but not high enough to melt aluminum (1,220 F [660 C]). Anexample <strong>of</strong> roasting is the APROS delacquering <strong>and</strong> preheating process used during theprocessing <strong>of</strong> used beverage cans (shown in Figure 4-19). The sweating process involves heatingaluminum scrap containing other metals in a sweat furnace to temperatures above the meltingtemperature <strong>of</strong> aluminum, but below that <strong>of</strong> the other metal. 59In addition to roasting <strong>and</strong> sweating, a catalytic technique may also be used toclean aluminum dross. Dross is a layer <strong>of</strong> impurities <strong>and</strong> semisolid flux that has been skimmed<strong>from</strong> the surface <strong>of</strong> molten aluminum. Aluminum may be recovered <strong>from</strong> dross by batch fluxingwith a salt/cryolite mixture in a mechanically rotated, refractory-lined barrel furnace. Cryolite actsas a catalyst that decreases aluminum surface tension <strong>and</strong> therefore increases recovery rates.Aluminum is tapped periodically through a hole in the base <strong>of</strong> the furnace.Hydrometallurgical Cleaning: Hydrometallurgical techniques use water to clean<strong>and</strong> process aluminum scrap. Hydrometallurgical techniques include leaching <strong>and</strong> heavy metalseparation. Leaching is used to recover aluminum <strong>from</strong> dross, furnace skimmings, <strong>and</strong> slag. Itrequires wet milling, screening, drying, <strong>and</strong> finally magnetic separation to remove fluxing salts <strong>and</strong>other waste products <strong>from</strong> the aluminum.4-104
Source: Reference 59.Figure 4-19. APROS Delacquering <strong>and</strong> Preheating Process4-105
The heavy metal separation hydrometallurgical process separates high densitymetal <strong>from</strong> low density metal using a viscous medium, such as copper <strong>and</strong> iron, <strong>from</strong> aluminum.Heavy metal separation has been used to concentrate aluminum recovered <strong>from</strong> shredded cars.The cars are shredded after large aluminum components have been removed (shredded materialcontains approximately 30 percent aluminum) <strong>and</strong> processed in heavy media to furtherconcentrate aluminum to 80 percent or more.Smelting/Refining--After scrap pretreatment, smelting <strong>and</strong> refining is performed.Smelting <strong>and</strong> refining in secondary aluminum recovery takes place primarily in reverberatoryfurnaces. These furnaces are brick-lined <strong>and</strong> constructed with a curved ro<strong>of</strong>. The termreverberatory is used because heat rising <strong>from</strong> ignited fuel is reflected (reverberated) back down<strong>from</strong> the curved furnace ro<strong>of</strong> <strong>and</strong> into the melted charge. A typical reverberatory furnace has anenclosed melt area where the flame heatsource operates directly above the molten aluminum. Thefurnace charging well is connected to the melt area by channels through which molten aluminum ispumped <strong>from</strong> the melt area into the charging well. Aluminum flows back into the melt section <strong>of</strong>the furnace under gravity.Most secondary aluminum recovery facilities use batch processing in smelting <strong>and</strong>59refining operations. It is common for one large melting reverberatory furnace to support theflow requirements for two or more smaller holding furnaces. The melting furnace is used to meltthe scrap, <strong>and</strong> remove impurities <strong>and</strong> entrained gases. The molten aluminum is then pumped intoa holding furnace. Holding furnaces are better suited for final alloying, <strong>and</strong> for making anyadditional adjustments necessary to ensure that the aluminum meets product specifications.Pouring takes place <strong>from</strong> holding furnaces, either into molds or as feedstock for continuouscasters.Smelting <strong>and</strong> refining operations can involve the following steps: charging,melting, fluxing, demagging, degassing, alloying, skimming, <strong>and</strong> pouring.4-106
The crucible smelting/refining process is used to melt small batches <strong>of</strong> aluminumscrap, generally limited to 1,100 lb (500 kg) or less. The metal-treating process steps areessentially the same as those <strong>of</strong> reverberatory furnaces.The induction smelting <strong>and</strong> refining process is designed to produce aluminumalloys with increased strength <strong>and</strong> hardness by blending aluminum <strong>and</strong> hardening agents in anelectric induction furnace. The process steps include charging scrap, melting, adding <strong>and</strong> blendingthe hardening agent, skimming, pouring, <strong>and</strong> casting into notched bars. Hardening agents includemanganese <strong>and</strong> silicon.<strong>Emissions</strong>The major sources <strong>of</strong> emissions <strong>from</strong> scrap pretreatment processes are scrap driers,60sweat furnaces, <strong>and</strong> UBC delacquering systems. Tables 4-24 <strong>and</strong> 4-25 present CDD/CDFemission factors for two separate delacquering systems. Control devices included a venturiscrubber (Table 4-24) <strong>and</strong> multiple cyclones (Table 4-25).Controls--Mechanical cleaning techniques involve crushing, shredding, <strong>and</strong>screening <strong>and</strong> produce metallic <strong>and</strong> nonmetallic particulates. Burning <strong>and</strong> drying operations(pyrometallurgic techniques) emit particulates <strong>and</strong> organic vapors. <strong>Emissions</strong> <strong>from</strong> reverberatoryfurnaces represent a significant fraction <strong>of</strong> the total particulate <strong>and</strong> gaseous effluent generated inthe secondary aluminum industry. Afterburners are frequently used to incinerate unburned VOCs.Oxidized aluminum fines blown out <strong>of</strong> the dryer by the combustion gases contain particulateemissions. Wet scrubbers or fabric filters are sometimes used in conjunction with afterburners.Mechanically generated dust <strong>from</strong> rotating barrel dross furnaces constitutes themain air emission <strong>of</strong> hot dross processing. Some fumes are produced <strong>from</strong> the fluxing reactions.4-107
TABLE 4-24. CDD/CDF EMISSION FACTORS FOR SECONDARY ALUMINUMSHREDDING AND DELACQUERING SYSTEM - SCRUBBER OUTLETCONTROL DEVICE - VENTURI SCRUBBERSCC 3-04-001-09FACTOR QUALITY RATING: DPollutantlb/tonAverage Emission Factor akg/Mg2,3,7,8-TCDD 3.94x10 -9 1.97x10 -9Total TCDD 9.56x10 -8 4.78x10 -81,2,3,7,8-PeCDD 1.42x10 -8 7.10x10 -9Total PeCDD 1.28x10 -7 6.40x10 -81,2,3,4,7,8-HxCDD 8.52x10 -9 4.26x10 -91,2,3,6,7,8-HxCDD 1.06x10 -8 5.30x10 -91,2,3,7,8,9-HxCDD 1.06x10 -8 5.30x10 -9Total HxCDD 1.56x10 -7 7.80x10 -81,2,3,4,6,7,8-HpCDD 5.78x10 -8 2.89x10 -8Total HpCDD 1.17x10 -7 5.85x10 -8Total OCDD 6.64x10 -8 3.32x10 -82,3,7,8-TCDF 4.64x10 -8 2.32x10 -8Total TCDF 1.24x10 -6 6.20x10 -71,2,3,7,8-PeCDF 6.76x10 -8 3.38x10 -82,3,4,7,8-PeCDF 9.60x10 -8 4.80x10 -8Total PeCDF 1.17x10 -6 5.85x10 -71,2,3,4,7,8-HxCDF 9.22x10 -8 4.61x10 -81,2,3,6,7,8-HxCDF 9.22x10 -8 4.61x10 -81,2,3,7,8,9-HxCDF 4.40x10 -8 2.20x10 -82,3,4,6,7,8-HxCDF 7.80x10 -8 3.90x10 -8Total HxCDF 1.03x10 -6 5.15x10 -71,2,3,4,6,7,8-HpCDF 2.44x10 -7 1.22x10 -71,2,3,4,7,8,9-HpCDF 5.42x10 -8 2.71x10 -8Total HpCDF 4.94x10 -7 2.47x10 -7Total OCDF 1.21x10 -7 6.05x10 -8Total CDD 5.62x10 -7 2.81x10 -7Total CDF 4.04x10 -6 2.02x10 -6Source: Reference 60.a Emission factors are lb (kg) <strong>of</strong> pollutant emitted per ton (Mg) <strong>of</strong> aluminum produced.4-108
TABLE 4-25. CDD/CDF EMISSION FACTORS FOR SECONDARY ALUMINUMSHREDDING AND DELACQUERING SYSTEMCONTROL DEVICE - MULTIPLE CYCLONESSCC 3-04-001-09FACTOR QUALITY RATING: DAverage Emission FactoraPollutantlb/tonkg/Mg2,3,7,8-TCDD 1.69x10 -9 8.45x10 -101,2,3,7,8-PeCDD 7.28x10 -9 3.64x10 -91,2,3,4,7,8-HxCDD 5.64x10 -9 2.82x10 -91,2,3,6,7,8-HxCDD 8.24x10 -9 4.12x10 -91,2,3,7,8,9-HxCDD 4.04x10 -9 2.02x10 -9Total HxCDD 1.79x10 -8 8.95x10 -91,2,3,4,6,7,8-HpCDD 3.86x10 -8 1.93x10 -8Total OCDD 4.86x10 -8 2.43x10 -82,3,7,8-TCDF 9.68x10 -9 4.84x10 -91,2,3,7,8-PeCDF 2.36x10 -8 1.18x10 -92,3,4,7,8-PeCDF 4.66x10 -8 2.33x10 -8Total PeCDF 7.02x10 -8 3.51x10 -81,2,3,4,7,8-HxCDF 3.52x10 -8 1.76x10 -81,2,3,6,7,8-HxCDF 3.38x10 -8 1.69x10 -81,2,3,7,8,9-HxCDF 2.70x10 -9 1.35x10 -92,3,4,6,7,8-HxCDF 3.20x10 -8 1.60x10 -8Total HxCDF 1.04x10 -7 5.20x10 -81,2,3,4,6,7,8-HpCDF 8.52x10 -8 4.26x10 -81,2,3,4,7,8,9-HpCDF 1.24x10 -8 6.20x10 -9Total HpCDF 9.76x10 -8 4.88x10 -8Total OCDF 5.90x10 -8 2.95x10 -8Total CDD 1.14x10 -7 5.70x10 -8Total CDF 3.40x10 -7 1.70x10 -7Source: Reference 61.a Emission factors are lb (kg) <strong>of</strong> pollutant emitted per ton (Mg) <strong>of</strong> aluminum produced.4-109
Fugitive emissions are controlled by enclosing the barrel furnace in a hood system <strong>and</strong> by ductingthe emissions to a fabric filter. Furnace <strong>of</strong>fgas emissions, mainly fluxing salt fume, are <strong>of</strong>tencontrolled by a venturi scrubber.4.5.3 Secondary Lead ProductionIn 1990, primary <strong>and</strong> secondary smelters in the United States produced1,380,000 tons (1,255,000 Mg) <strong>of</strong> lead. Secondary lead smelters produced 948,000 tons(860,000 Mg) or about 69 percent <strong>of</strong> the total refined lead produced in 1990; primary smelters62produced 434,000 tons (395,000 Mg). Table 4-26 lists U.S. secondary lead smelters accordingto their annual lead production capacity.Process DescriptionThe secondary lead smelting industry produces elemental lead <strong>and</strong> lead alloys byreclaiming lead, mainly <strong>from</strong> scrap automobile batteries. Blast, reverberatory, rotary, <strong>and</strong> electricfurnaces are used for smelting scrap lead <strong>and</strong> producing secondary lead. Smelting is the reduction<strong>of</strong> lead compounds to elemental lead in a high-temperature furnace. It requires highertemperatures (2,200 to 2,300 F [1,200 to 1,260 C]) than those required for melting elementallead (621 F [327 C]). Secondary lead may be refined to produce s<strong>of</strong>t lead (which is nearly purelead) or alloyed to produce hard lead alloys. Fifty percent <strong>of</strong> the lead produced by secondary leadsmelters is hard lead, <strong>and</strong> fifty percent is s<strong>of</strong>t. About 80 percent <strong>of</strong> all lead in the United States62goes to producing new batteries.Lead-acid batteries represent about 90 percent <strong>of</strong> the raw materials at a typicalsecondary lead smelter, although this percentage may vary <strong>from</strong> one plant to the next. Thesebatteries contain approximately 18 lb (8.2 kg) <strong>of</strong> lead per battery consisting <strong>of</strong> 40 percent leadalloys <strong>and</strong> 60 percent lead oxide. Other types <strong>of</strong> lead-bearing raw materials recycled by secondarylead smelters include drosses (lead-containing byproducts <strong>of</strong> lead refining), which may be4-110
TABLE 4-26. U.S. SECONDARY LEAD SMELTERSSmelterSmall Capacity: less than 22,000 ton/yr (20,000 Mg/yr)Delatte MetalsGeneral Smelting <strong>and</strong> Refining CompanyMaster Metals, Inc.Metals Control <strong>of</strong> KansasMetals Control <strong>of</strong> OklahomaLocationPonchatoula, LACollege Grove, TNClevel<strong>and</strong>, OHHillsboro, KSMuskogee, OKMedium Capacity: 22,000 to 82,000 ton/yr (20,000 to 75,000 Mg/yr)Doe Run CompanyEast Penn Manufacturing CompanyExide CorporationExide CorporationGNB, Inc.GNB, Inc.Gulf Coast Recycling, Inc.Refined Metals CorporationRefined Metals CorporationRSR CorporationRSR CorporationSchuylkill Metals CorporationTejas Resources, Inc.Boss, MOLyon Station, PAMuncie, INReading, PAColumbus, GAFrisco, TXTampa, FLBeech Grove, INMemphis, TNCity <strong>of</strong> Industry, CAMiddletown, NYForest City, MOTerrell, TXLarge Capacity: greater than 82,000 ton/yr (75,000 Mg/yr)Gopher Smelting <strong>and</strong> Refining, Inc.GNB, Inc.RSR CorporationS<strong>and</strong>ers Lead CompanySchuylkill Metals CorporationEagen, MNVernon, CAIndianapolis, INTroy, ALBaton Rouge, LASource: Reference 62.4-111
purchased <strong>from</strong> companies that perform lead alloying or refining but not smelting; battery plantscrap, such as defective grids or paste; <strong>and</strong> scrap lead, such as old pipes or ro<strong>of</strong> flashing. Otherscrap lead sources include cable sheathing, solder, <strong>and</strong> babbitt metal. 62As illustrated in Figure 4-20, the normal sequence <strong>of</strong> operations in a secondarylead smelter is scrap receiving, charge preparation, furnace smelting, <strong>and</strong> lead refining <strong>and</strong>alloying. In all plants, scrap batteries are first sawed or broken open to remove the lead alloyplates <strong>and</strong> lead oxide paste material. At blast furnace smelters, a slow-speed saw is used toremove the top <strong>of</strong> the case, the plates are dumped <strong>from</strong> the case, <strong>and</strong> whole grids are charged tothe furnace. At other types <strong>of</strong> smelters, hammermills or other crushing/shredding devices are usedto break open the battery cases. Float/sink separation systems are typically used to separateplastic battery parts, lead terminals, lead oxide paste, <strong>and</strong> hard rubber used in older batteries. Themajority <strong>of</strong> lead smelters recover the crushed polypropylene plastic materials for recycling. Hardrubber materials are usually charged to the furnace.Paste desulfurization is an optional feed material processing step used by somesecondary lead smelters. It involves the separation <strong>of</strong> lead sulfate <strong>and</strong> lead oxide paste <strong>from</strong> thelead grid metal, polypropylene plastic cases, separators, <strong>and</strong> hard rubber battery cases. The nextstep is the chemical conversion <strong>of</strong> lead sulfate in the lead battery paste to lead oxide. This processimproves furnace efficiency by reducing the need for fluxing agents to reduce lead-sulfurcompounds to lead metal. The process also reduces SO furnace emissions. However, SO2 2emissions reduction is usually a less important consideration because many plants that performpaste desulfurization are also equipped with SO scrubbers. About half <strong>of</strong> all smelters perform2paste desulfurization. 62After removing the lead components <strong>from</strong> the scrap batteries, the lead scrap iscombined with other charge materials such as refining drosses, flue dust, furnace slag, coke,limestone, <strong>and</strong> s<strong>and</strong> <strong>and</strong> fed to either a reverberatory, blast, rotary or electric smelting furnace.4-112
Batteries Arriveby TruckPolypropylenePlastic toRecyclingBatteryBreakingOPTIONALLead PasteAcid toWater Treatmentor RecyclingGrid Metal,Hard Rubber,SeparatorsPasteDesulfurizationOther Lead-Bearing Materials<strong>and</strong> ScrapMaterialsStorageChargePreparationSmeltingFurnaceSlagDisposalRefining/AlloyingCastingFinishedProductFigure 4-20. Simplified Process Flow Diagram for Secondary Lead SmeltingSource: Reference 62.4-113
Smelting furnaces are used to produce crude lead bullion, which is refined <strong>and</strong>/or alloyed into finallead products.Refining, the final step in secondary lead production, consists <strong>of</strong> removingimpurities <strong>and</strong> adding alloying metals to the molten lead obtained <strong>from</strong> the smelting furnaces tomeet a customer's specifications. Refining kettles are used for the purifying <strong>and</strong> alloying <strong>of</strong>molten lead.Blast <strong>and</strong> reverberatory furnaces are currently the most common types <strong>of</strong> smeltingfurnaces in the industry, although some new plants are using rotary furnaces. There areapproximately 15 reverberatory furnaces, 24 blast furnaces, 5 rotary furnaces, <strong>and</strong> 1 electric62furnace in the secondary lead industry. The following discussion provides process descriptions<strong>of</strong> these four types <strong>of</strong> secondary lead smelters.Reverberating Furnaces--A reverberatory furnace as shown in Figure 4-21, is arectangular refractory-lined furnace. Reverberatory furnaces are operated on a continuous basis.Natural gas- or fuel oil-fired jets located at one end or at the sides <strong>of</strong> the furnace are used to heatthe furnace <strong>and</strong> charge material to an operating temperature <strong>of</strong> about 2,000 F (1,100 C).Oxygen enrichment may be used to decrease the combustion air requirements. Reverberatoryfurnaces are maintained at negative pressure by an induced draft fan.Reverberatory furnace charge materials include battery grids <strong>and</strong> paste, batteryplant scrap, rerun reverberatory furnace slag, flue dust, drosses, iron, silica, <strong>and</strong> coke. A typicalcharge over one hour may include 9.3 tons (8.4 Mg) <strong>of</strong> grids <strong>and</strong> paste to produce 6.2 tons(5.6 Mg) <strong>of</strong> lead. 62Charge materials are <strong>of</strong>ten fed to a natural gas- or oil-fired rotary drying kiln,which dries the material before it reaches the reverberatory furnace. The temperature <strong>of</strong> thedrying kiln is about 400 F (200 C), <strong>and</strong> the drying kiln exhaust is drawn directly into the4-114
FlueCharge ChuteBurner4-115Slag TapSlag LayerMoltenLeadLead Well <strong>and</strong> TapHydraulic Charge RamFigure 4-21. Cross-sectional View <strong>of</strong> a Typical Stationary Reverberatory FuranceSource: Reference 62.
everberatory furnace or ventilated to a control device. From the rotary drying kiln, the feed iseither dropped into the top <strong>of</strong> the furnace through a charging chute, or fed into the furnace atfixed intervals with a hydraulic ram. In furnaces that use a feed chute, a hydraulic ram is <strong>of</strong>tenused as a stoker to move the material down the furnace. 62Reverberatory furnaces are used to produce a s<strong>of</strong>t (nearly pure) lead product <strong>and</strong> alead-bearing slag. This is done by controlling the reducing conditions in the furnace so that leadcomponents are reduced to metallic lead bullion <strong>and</strong> the alloying elements (antimony, tin, arsenic)in the battery grids, posts, straps, <strong>and</strong> connectors are oxidized <strong>and</strong> removed in the slag. Thereduction <strong>of</strong> PbSO <strong>and</strong> PbO is promoted by the carbon-containing coke added to the charge4material:PbSO 4C Pb CO 2SO 22PbO C 2Pb CO 2The PbSO <strong>and</strong> PbO also react with the alloying elements to form lead bullion <strong>and</strong>4oxides <strong>of</strong> the alloying elements; the latter are removed in the slag.The molten lead collects in a pool at the lowest part <strong>of</strong> the hearth. Slag collects ina layer on top <strong>of</strong> this pool <strong>and</strong> retards further oxidation <strong>of</strong> the lead. The slag is made up <strong>of</strong>molten fluxing agents such as iron, silica, <strong>and</strong> lime, <strong>and</strong> typically has significant quantities <strong>of</strong> lead.Slag is usually tapped continuously <strong>and</strong> lead is tapped intermittently. The slag is tapped into acrucible. The slag tap <strong>and</strong> crucible are hooded <strong>and</strong> vented to a control device. Reverberatoryfurnace slag usually has a high lead content (as much as 70 percent by weight) <strong>and</strong> is used as feedmaterial in a blast or electric furnace to recover the lead content. Reverberatory furnace slag mayalso be rerun through the reverberatory furnace during special slag campaigns before being sent toa blast or electric furnace. Lead may be tapped into a crucible or directly into a holding kettle.The lead tap is usually hooded <strong>and</strong> vented to a control device. 624-116
Blast Furnaces--A blast furnace as shown in Figure 4-22, is a vertical furnace thatconsists <strong>of</strong> a crucible with a vertical cylinder affixed to the top. The crucible is refractory-lined<strong>and</strong> the vertical cylinder consists <strong>of</strong> a steel water jacket. Oxygen-enriched combustion air isintroduced into the furnace through tuyeres located around the base <strong>of</strong> the cylinder.Charge materials are pre-weighed to ensure the proper mixture <strong>and</strong> thenintroduced into the top <strong>of</strong> the cylinder using a skip hoist, a conveyor, or a front-end loader. Thecharge fills nearly the entire cylinder. Charge material is added periodically to keep the level <strong>of</strong>the charge at a consistent working height while lead <strong>and</strong> slag are tapped <strong>from</strong> the crucible. Cokeis added to the charge as the primary fuel, although natural gas jets may be used to start thecombustion process. Combustion is self-sustaining as long as there is sufficient coke in the chargematerial. Combustion occurs in the layer <strong>of</strong> the charge nearest the tuyeres.At plants that operate only blast furnaces, the lead-bearing charge materials mayinclude broken battery components, drosses <strong>from</strong> the refining kettles, agglomerated flue dust, <strong>and</strong>lead-bearing slag. A typical charge over one hour may include 4.8 tons (4.4 Mg) <strong>of</strong> grids <strong>and</strong>paste, 0.3 tons (0.3 Mg) <strong>of</strong> coke, 0.1 tons (0.1 Mg) <strong>of</strong> calcium carbonate, 0.07 tons (0.06 Mg) <strong>of</strong>silica, 0.5 tons (0.4 Mg) <strong>of</strong> cast iron, <strong>and</strong> 0.2 tons (0.2 Mg) <strong>of</strong> rerun blast furnace slag, to produce3.7 tons (3.3 Mg) <strong>of</strong> lead. At plants that also have a reverberatory furnace, the charge materialswill also include lead-bearing reverberatory furnace slag. 62Blast furnaces are designed <strong>and</strong> operated to produce a hard (high alloy content)lead product by achieving more reducing furnace conditions than those typically found in areverberatory furnace. Fluxing agents include iron, soda ash, limestone, <strong>and</strong> silica (s<strong>and</strong>). Theoxidation <strong>of</strong> the iron, limestone, <strong>and</strong> silica promotes the reduction <strong>of</strong> lead compounds <strong>and</strong>prevents oxidation <strong>of</strong> the lead <strong>and</strong> other metals. The soda ash enhances the reaction <strong>of</strong> PbSO <strong>and</strong> 4PbO with carbon <strong>from</strong> the coke to reduce these compounds to lead metal.4-117
Charge HopperExhaust Offtake to AfterburnerChargeConeCool WaterAverage Level <strong>of</strong> ChargeCharge HoleShaftWorking Height<strong>of</strong> Charge2.4 to 3.0 mWater JacketHot WaterCool WaterDiameter at Tuyeres68 to 120 cmTuyereHot WaterSlag LayerLead SpoutLead Well <strong>and</strong> SiphonDamCrucibleDrain TapSlag SpoutLead LayerSource: Reference 62.Figure 4-22. Cross-section <strong>of</strong> a Typical Blast Furnace4-118
Lead tapped <strong>from</strong> a blast furnace has a higher content <strong>of</strong> alloying metals (up to25 percent) than lead produced by a reverberatory furnace. In addition, much less <strong>of</strong> the lead <strong>and</strong>alloying metals are oxidized <strong>and</strong> removed in the slag, so the slag has a low metal content(e.g., 1 to 3 percent) <strong>and</strong> frequently qualifies as a nonhazardous solid waste.Because air is introduced into the blast furnace at the tuyeres, blast furnaces areoperated at positive pressure. The operating temperature at the combustion layer <strong>of</strong> the charge isbetween 2,200 <strong>and</strong> 2,600 F (1,200 <strong>and</strong> 1,400 C), but the temperature <strong>of</strong> the gases exiting the top<strong>of</strong> the charge material is only between 750 <strong>and</strong> 950 F (400 <strong>and</strong> 500 C).Molten lead collects in the crucible beneath a layer <strong>of</strong> molten slag. As in areverberatory furnace, the slag inhibits the further oxidation <strong>of</strong> the molten metal. Lead is tappedcontinuously <strong>and</strong> slag is tapped intermittently, slightly before it reaches the level <strong>of</strong> the tuyeres. Ifthe tuyeres become blocked with slag, they are manually or automatically "punched" to clear theslag. A sight glass on the tuyeres allows the furnace operator to monitor the slag level <strong>and</strong> ensurethat they are clear <strong>of</strong> slag. At most facilities, the slag tap is temporarily sealed with a clay plug,which is driven out to begin the flow <strong>of</strong> slag <strong>from</strong> the tap into a crucible. The slag tap <strong>and</strong>crucible are enclosed in a hood, which is vented to a control device.A weir dam <strong>and</strong> siphon in the furnace are used to remove the lead <strong>from</strong> beneaththe slag layer. Lead is tapped <strong>from</strong> a blast furnace into either a crucible or directly to a refiningkettle designated as a holding kettle. The lead in the holding kettle is kept molten before beingpumped to a refining kettle for refining <strong>and</strong> alloying. The lead tap on a blast furnace is hooded<strong>and</strong> vented to a control device.Rotary Furnaces--As noted above, rotary furnaces (sometimes referred to as rotaryreverberatory furnaces) (Figure 4-23) are used at only a few recently constructed secondary leadsmelters in the United States. Rotary furnaces have two advantages over other furnace types: itis easier to adjust the relative amount <strong>of</strong> fluxing agents because the furnaces are operated on a4-119
Rotary Furnace ShellHygiene HoodRiding RingsHygiene HoodMobile FlueDoorJetPouring SpoutDrive TrainSource: Reference 62.Figure 4-23. Side-view <strong>of</strong> a Typical Rotary Reverbatory Furnace4-120
atch rather than a continuous basis, <strong>and</strong> they achieve better mixing <strong>of</strong> the charge materials th<strong>and</strong>o blast or reverberatory furnaces. 62A rotary furnace consists <strong>of</strong> a refractory-lined steel drum mounted on rollers.Variable-speed motors are used to rotate the drum. An oxygen-enriched natural gas or fuel oil jetat one end <strong>of</strong> the furnace heats the charge material <strong>and</strong> the refractory lining <strong>of</strong> the drum. Theconnection to the flue is located at the same end as the jet. A sliding door at the end <strong>of</strong> thefurnace opposite <strong>from</strong> the jet allows charging <strong>of</strong> material to the furnace. Charge materials aretypically placed in the furnace using a retractable conveyor or charge bucket, although othermethods are possible.Lead-bearing raw materials charged to rotary furnaces include broken batterycomponents, flue dust, <strong>and</strong> drosses. Rotary furnaces can use the same lead-bearing raw materialsas reverberatory furnaces, but they produce slag that is relatively free <strong>of</strong> lead, less than 2 percent.As a result, a blast furnace is not needed for recovering lead <strong>from</strong> the slag, which may be disposed<strong>of</strong> as a nonhazardous waste.Fluxing agents for rotary furnaces may include iron, silica, soda ash, limestone, <strong>and</strong>coke. The fluxing agents are added to promote the conversion <strong>of</strong> lead compounds to lead metal.Coke is used as a reducing agent rather than as a primary fuel. A typical charge may consist <strong>of</strong>12 tons (11 Mg) <strong>of</strong> wet battery scrap, 0.8 tons (0.7 Mg) <strong>of</strong> soda ash, 0.6 tons (0.5 Mg) <strong>of</strong> coke,<strong>and</strong> 0.6 tons (0.5 Mg) <strong>of</strong> iron. This charge will yield approximately 9 tons (8 Mg) <strong>of</strong> leadproduct. 62The lead produced by rotary furnaces is a semi-s<strong>of</strong>t lead with an antimony contentsomewhere between that <strong>of</strong> lead <strong>from</strong> reverberatory <strong>and</strong> blast furnaces. Lead <strong>and</strong> slag are tapped<strong>from</strong> the furnace at the conclusion <strong>of</strong> the smelting cycle. Each batch takes 5 to 12 hours toprocess, depending on the size <strong>of</strong> the furnace. Like reverberatory furnaces, rotary furnaces areoperated at a slightly negative pressure.4-121
Electric Furnaces--An electric furnace consists <strong>of</strong> a large, steel, kettle-shapedcontainer that is refractory-lined (Figure 4-24). A cathode extends downward into the container<strong>and</strong> an anode is located in the bottom <strong>of</strong> the container. Second-run reverberatory furnace slag ischarged into the top <strong>of</strong> the furnace. Lead <strong>and</strong> slag are tapped <strong>from</strong> the bottom <strong>and</strong> side <strong>of</strong> thefurnace, respectively. A fume hood covering the top <strong>of</strong> the furnace is vented to a control device.In an electric furnace, electric current flows <strong>from</strong> the cathode to the anode throughthe scrap charge. The electrical resistance <strong>of</strong> the charge causes the charge to heat up <strong>and</strong> become62molten. There is no combustion process involved in an electric furnace .There is only one electric furnace in operation in the U.S. secondary lead industry.It is used to process second-run reverberatory furnace slag, <strong>and</strong> it fulfills the same role as a blastfurnace used in conjunction with a reverberatory furnace. However, the electric furnace has twoadvantages over a blast furnace. First, because there are no combustion gases, ventilationrequirements are much lower than for blast or reverberatory furnaces, <strong>and</strong> the potential forformation <strong>of</strong> organics is greatly reduced. Second, the electric furnace is extremely reducing, <strong>and</strong>produces a glass-like, nearly lead-free slag that is nonhazardous.Emission Control TechniquesControls used to reduce organic emissions <strong>from</strong> smelting furnaces in the secondarylead smelting industry include afterburners on blast furnaces <strong>and</strong> combined blast <strong>and</strong> reverberatoryexhausts. Reverberatory <strong>and</strong> rotary furnaces have minimal dioxin/furan emissions because <strong>of</strong> highexhaust temperatures <strong>and</strong> turbulence, which promote complete combustion <strong>of</strong> organics. No62controls for total hydrocarbons (THC) are necessary for these process configurations.CDD/CDF emissions <strong>from</strong> blast furnaces are dependent on the type <strong>of</strong> add-oncontrol used. An afterburner operated at 1,300 F (700 C) achieves about 84 percent destruction62efficiency <strong>of</strong> total hydrocarbons (THC). Several facilities with blast <strong>and</strong> reverberatory furnaces4-122
ElectrodeFlueBath LevelSlag TapLead TapElectrodeFigure 4-24. Cross-section View <strong>of</strong> an Electrical Furnace for Processing SlagSource: Reference 62.4-123
combine the exhaust streams <strong>and</strong> vent the combined stream to an afterburner. The higheroperating temperature <strong>of</strong> the reverberatory furnace reduces the fuel needs <strong>of</strong> the afterburner sothat the afterburner is essentially "idling." Any temperature increase measured across theafterburner is due to the heating value <strong>of</strong> organic compounds in the blast furnace exhaust. Acombined reverberatory <strong>and</strong> blast furnace exhaust stream ducted to an afterburner with an exittemperature <strong>of</strong> 1,700 F (930 C) can achieve 99 percent destruction efficiency for THC. 62Additional controls used by secondary lead smelters include baghouses forparticulate <strong>and</strong> metal control, hooding <strong>and</strong> ventilation to a baghouse for process fugitives, <strong>and</strong>62scrubbers for HCl <strong>and</strong> SO 2 control.Emission FactorsProcess emissions (i.e., those emitted <strong>from</strong> the smelting furnace's main exhaust)contain metals, organics (including dioxins/furans), hydrogen chloride (HCl), <strong>and</strong> chlorine (Cl ). 2Process emissions also contain criteria pollutants, including PM, VOCs, CO, <strong>and</strong> SO . The 2primary source <strong>of</strong> CDD/CDF at secondary lead smelters is PVC used as separators in lead-acidbatteries. The Battery Council International (BCI) recently provided EPA with data (gathered in1995) showing that less than one-tenth <strong>of</strong> one percent <strong>of</strong> U.S.-manufactured batteries were found63to contain PVC separators. It is important to note here that BCI also reports that no U.S.manufacturer <strong>of</strong> lead-acid automotive batteries currently uses PVC in production. 63Blast furnaces are greater sources <strong>of</strong> dioxin/furan emissions than reverberatory orrotary furnaces. Low exhaust temperatures <strong>from</strong> the charge column [about 800 F (430 C)]result in the formation <strong>of</strong> products <strong>of</strong> incomplete combustion (PIC) <strong>from</strong> the organic material inthe feed material. Uncontrolled THC emissions (which correlate closely with organic pollutantemissions) <strong>from</strong> a typical 55,000-ton/yr (50,000 Mg/yr) blast furnace are about 309 tons/yr(280 Mg/yr). 624-124
The EPA does not have sufficient data to link dioxin/furan emissions to specific62control technologies currently in use in the industry. Rotary <strong>and</strong> reverberatory furnaces havemuch higher exhaust temperatures than blast furnaces, about 1,800 to 2,200 F (980 to 1,200 C),<strong>and</strong> much lower THC emissions because <strong>of</strong> more complete combustion. Total hydrocarbonemissions <strong>from</strong> a typical rotary furnace (16,500 ton/yr [15,000 Mg/yr] capacity) are about 38ton/yr (34 Mg/yr). The majority <strong>of</strong> these emissions occur during furnace charging, when thefurnace's burner is cut back <strong>and</strong> the temperature is reduced. <strong>Emissions</strong> drop <strong>of</strong>f sharply when62charging is completed <strong>and</strong> the furnace is brought to normal operating temperature. CDD/CDFemissions <strong>from</strong> reverberatory furnaces are even lower than those <strong>from</strong> rotary furnaces becausereverberatory furnaces are operated continuously rather than on a batch basis.Three test reports <strong>from</strong> three secondary lead smelters were used to develop64-66CDD/CDF emission factors. All testing was conducted in support <strong>of</strong> the EPA's SecondaryLead National Emission St<strong>and</strong>ards for Hazardous Air Pollutants (NESHAP) program. The threefacilities tested represent the following process configurations: a rotary smelting furnaceequipped with a baghouse <strong>and</strong> SO scrubber; a blast furnace equipped with an afterburner,2baghouse, <strong>and</strong> SO scrubber; <strong>and</strong> a reverberatory <strong>and</strong> blast furnace with exhaust <strong>from</strong> each2furnace combined prior to a single afterburner, baghouse, <strong>and</strong> SO scrubber.2<strong>Emissions</strong> were measured at all three facilities, <strong>and</strong> emission factors were derived<strong>from</strong> the test reports <strong>of</strong> the three facilities representing the three principal furnace types in use.These emission factors represent emissions with a baghouse <strong>and</strong> scrubber, <strong>and</strong> are shown inTable 4-27. However, the effect <strong>of</strong> these controls on CDD/CDF emissions is unclear.4.5.4 Scrap Metal IncineratorsScrap metal incinerators are used to burn <strong>of</strong>f combustible contaminants(e.g., plastics, rubber, paper, oils) contained in scrap metal. This process renders a cleaner metalscrap that can be further processed into a refined, saleable metal product. Scrap metal4-125
TABLE 4-27. CDD/CDF EMISSION FACTORS FOR SECONDARY LEAD SMELTINGSCC 3-04-004-02, -03, -04FACTOR QUALITY RATING: DIsomerROTARY FURNACE (3-04-004-04)Baghouse OutletEmission Factorlb/ton (kg/Mg)aScrubber Outlet-10 -10 -10 -102,3,7,8-TCDD 3.16x10 (1.58x10 ) 3.96x10 (1.98x10 )-9 -9 -9 -92,3,7,8-TCDF 2.00x10 (1.00x10 ) 2.00x10 (1.00x10 )-9 -10 -10 -112,3,7,8-TCDD TEQ 1.42x10 (7.10x10 ) 1.21x10 (6.05x10 )-8 -9Total CDD 1.49x10 (7.45x10 )-8 -8Total CDF 5.16x10 (2.58x10 )BLAST FURNACE (3-04-004-03)-9 -92,3,7,8-TCDD 4.46x10 (2.23x10 )-8 -92,3,7,8-TCDF 1.85x10 (9.25x10 )-8 -92,3,7,8-TCDD TEQ 1.76x10 (8.80x10 )-7 -7Total CDD 2.94x10 (1.47x10 )-7 -7Total CDF 5.10x10 (2.55x10 )BLAST/REVERB FURNACE (3-04-004-02)-10 -112,3,7,8-TCDD 1.48x10 (7.40x10 )-9 -92,3,7,8-TCDF 8.34x10 (4.67x10 )-9 -92,3,7,8-TCDD TEQ 2.68x10 (1.34x10 )-8 -9Total CDD 1.12x10 (5.60x10 )-8 -8Total CDF 7.66x10 (3.83x10 )Source: References 64-67.a Emission factors are in lb (kg) <strong>of</strong> pollutant emitted per ton (Mg) <strong>of</strong> lead produced.-9 -101.85x10 (9.25x10 )-8 -85.16x10 (2.58x10 )-10 -105.38x10 (2.69x10 )-9 -101.97x10 (9.85x10 )-9 -101.68x10 (8.40x10 )-8 -82.26x10 (1.13x10 )-8 -84.74x10 (2.37x10 )-10 -111.75x10 (8.75x10 )-9 -92.88x10 (1.44x10 )-10 -108.14x10 (4.07x10 )-8 -91.42x10 (7.10x10 )-8 -83.16x10 (1.58x10 )4-126
incinerators operate in an oxidizing atmosphere, as opposed to metal smelters, which operate in areducing atmosphere. The purpose <strong>of</strong> a scrap metal incinerator is simply to burn <strong>of</strong>f contaminantsprior to smelting.Process DescriptionMany types <strong>of</strong> scrap materials are processed in incinerators prior to smelting,including wire <strong>and</strong> cable, drained transformer cores, automobile bodies, electric motors, <strong>and</strong>various other types <strong>of</strong> metal-bearing scrap. The combustible portion <strong>of</strong> scrap metal comprises agreat variety <strong>of</strong> materials, including rubber, paper, cotton, asphalt-impregnated fabrics, silk, <strong>and</strong>plastics such as polyethylene, polypropylene <strong>and</strong> PVC. Additionally, the metals themselves mayhave baked-on coatings <strong>of</strong> plastic, paint, or varnish. The chlorine present in PVC wire insulationor automobile parts <strong>and</strong> other sources <strong>of</strong> chlorinated organic materials provide sufficient chlorine68to produce CDD/CDF <strong>from</strong> the combustion <strong>of</strong> these materials.Figure 4-25 shows a process flow diagram <strong>of</strong> a scrap metal reclamationincinerator. There are many different designs <strong>of</strong> scrap metal reclamation incinerators; however,there are some commonalities. A typical scrap metal reclamation incinerator consists <strong>of</strong> one ormore chambers <strong>and</strong> an afterburner connected to a stack. The older designs are normally limited toa single primary or charging chamber <strong>and</strong> afterburner. Newer designs generally incorporate asecondary or settling chamber prior to the afterburner. The designs also differ in the placement <strong>of</strong>burners <strong>and</strong> use <strong>of</strong> water sprays for quenching. 69A typical scrap reclamation incinerator is operated in batch mode 8 hours per day,5 days per week. However, operation is variable <strong>and</strong> largely dependent on scrap availability. Atthe beginning <strong>of</strong> a batch, a charge <strong>of</strong> scrap material is placed in the primary chamber <strong>and</strong> is ignitedusing paper or the primary chamber burner, if one exists. Gases <strong>from</strong> the primary chamber flowthrough the secondary chamber, where some settling <strong>of</strong> large particulate occurs, <strong>and</strong> then to theafterburner, where the flue gases are heated to 1,800 to 2,000 F (980 to 1090 C) to control4-127
Burned Scrapto SmeltingOpen Air CoolingStackBurned ScrapScrap MetalSupplemental Fuel(Natural Gas)Primary FurnaceChamberFurnaceExhaustGasSettlingChamberAfter BurnerSettling ChamberAshPrimary ChamberAshNatural GasSource: Reference 69.Figure 4-25. Scrap Metal Incinerator Process Flow Diagram4-128
emissions prior to discharge to the atmosphere. Natural gas is typically used as the auxiliary fuelfor a scrap incinerator; however, liquid propane or No. 2 fuel oil can be used.Most incinerators operate with very little or no instrumentation to measuretemperature or control draft <strong>and</strong> oxygen level. Combustion conditions can be controlled byvarying the amount <strong>of</strong> air allowed into the primary chamber during combustion. The amount <strong>of</strong>air is controlled by opening or closing the doors <strong>and</strong> the draft registers. The primary chambertemperature can go as high as 800 to 1,200 F (427 to 649 C) when an auxiliary burner is used.However, many operators restrict the temperatures <strong>and</strong> amount <strong>of</strong> oxygen in order to increaseyield. 68Emission Control TechniquesMost scrap metal incinerators use afterburners to complete the combustion <strong>of</strong> theexhaust gases, thereby controlling emissions <strong>of</strong> PM <strong>and</strong> gaseous organic compounds. Theseafterburners are typically fired with natural gas, <strong>and</strong> temperatures <strong>of</strong> 1,800 to 2,000 F (980 to1,090 C) are achieved. Some scrap metal incinerators may be equipped with particulatecollection devices such as fabric filters, but most have no additional controls other than theafterburner. 68Emission FactorsEmission factors were identified for a scrap metal incinerator that burns68combustibles <strong>from</strong> scrap wire <strong>and</strong> drained transformer cores. The scrap wire burned at thefacility contains some PVC plastic insulation, <strong>and</strong> the drained transformer cores containtransformer oil residues containing less than 500 ppm <strong>of</strong> PCBs.4-129
Temperatures in the primary chamber furnace during incineration were about1,050 F (570 C). The facility is equipped with a natural gas-fired afterburner that achievestemperatures <strong>of</strong> 1,800 to 2,000 F (980 to 1,090 C). 68<strong>Emissions</strong> <strong>of</strong> TCDD/TCDF through OCDD/OCDF were measured in the stackafter the afterburner. Table 4-28 presents emissions on a flue gas-concentration basis <strong>and</strong> asemission factors. Emission factors are based on the total weight <strong>of</strong> wire <strong>and</strong> transformer scrapfeed to the furnace. The HpCDD/HpCDF <strong>and</strong> OCDD/OCDF were the primary species present,but measurable quantities <strong>of</strong> the TCDD/TCDF through HxCDD/HxCDF were also present.4.5.5 Drum <strong>and</strong> Barrel Reclamation FurnacesDrum <strong>and</strong> barrel reclamation facilities recondition used steel drums for resale.Combustion is used to remove drum paints, interior linings, labels, residual liquids in the drum,<strong>and</strong> other contaminants. Residual materials include organic solvents, inks, paints, food, <strong>and</strong> avariety <strong>of</strong> other products.Process DescriptionFigure 4-26 shows a flow diagram <strong>of</strong> a typical drum reclamation facility. Mostfacilities use a tunnel furnace to burn contaminants. The tunnel furnace is equipped with multiplenatural gas burners on each side. Dirty drums are loaded onto a conveyor <strong>and</strong> conveyed to thefurnace. Before entering the furnace, any free contents in the drums are drained into a collectionvessel. The drums pass through the furnace, where temperatures reach about 1,000 F (540 C),69<strong>and</strong> are air-cooled as they exit the furnace. After cooling, the drums are shotblasted with anabrasive to clean the drum to bare metal. The drums are then repainted prior to sale.4-130
TABLE 4-28. CDD/CDF FLUE GAS CONCENTRATIONS AND EMISSION FACTORS FORA SCRAP WIRE AND TRANSFORMER INCINERATORSCC 3-04-900-13FACTOR QUALITY RATING: DIsomerDIOXINSFlue GasConcentration3lb/ft ( g/dscm) at 3% 0 a Emission Factor2 lb/ton (µg/kg) scrap feed-6 -1 -10 -42,3,7,8-TCDD 7.86x10 (1.26x10 ) 7.47x10 (3.74x10 )-5 -9 -3Total Other TCDD 9.37x10 (1.50)8.10x10 (4.05x10 )-4Total PeCDD 3.22x10 (5.15)-3Total HxCDD 2.05x10 (32.8)-2Total HpCDD 1.04x10 (167)-2Total OCDD 3.11x10 (498)-2Total CDD 4.40x10 (705)-8 -22.74x10 (1.37x10 )-7 -21.42x10 (7.11x10 )-7 -16.94x10 (3.47x10 )-62.00x10 (1.0)-62.88x10 (1.44)FURANS-5 -12,3,7,8-TCDF 5.70x10 (9.13x10 )-3Total Other TCDF 2.80x10 (44.8)-3Total PeCDF 2.62x10 (42.0)-3Total HxCDF 5.92x10 (94.8)-2Total HpCDF 1.83x10 (293)-2Total OCDF 2.44x10 (390)-2Total CDF 5.41x10 (866)-9 -35.34x10 (2.67x10 )-7 -12.08x10 (1.04x10 )-7 -21.95x10 (9.74x10 )-7 -14.06x10 (2.03x10 )-6 -11.25x10 (6.23x10 )-6 -11.61x10 (8.07x10 )-63.68x10 (1.84)-2TOTAL CDD/CDF 9.81x10 (1,571)-66.56x10 (3.28)Source: Reference 68.Note: The composition <strong>and</strong> combustible portion <strong>of</strong> the scrap metal was not stated in this report.a <strong>Emissions</strong> measured in the stack gas after an afterburner.4-131
GasAirDirty DrumsBurning FurnaceBurnedDrumsShotblastingRepainting<strong>and</strong>ReliningSaleFurnaceAshGasAirAfterburnerFurnace FlueGasTo AtmosphereStackAfterburnerAshSource: Reference 69.Figure 4-26. Drum <strong>and</strong> Barrel Incinerator Process Flow Diagram4-132
Emission Control TechniquesNatural gas-fired afterburners are typically used to combust unburnedhydrocarbons in the exhaust gases <strong>from</strong> the furnace, thereby controlling emissions <strong>of</strong> gaseousorganic compounds.Emission FactorsEmission factors were identified for a drum <strong>and</strong> barrel reclamation furnace thatprocesses drums previously containing lacquer, organic solvents, inks, enamel-type paints <strong>and</strong>69other materials. The residue in the drums was analyzed for total organic halides (TOX). TheTOX content <strong>of</strong> the residue in the drums during testing was about 800 ppm.The facility is equipped with an afterburner. The afterburner operated at anaverage <strong>of</strong> 1,500 F (827 C) during testing. <strong>Emissions</strong> <strong>of</strong> TCDD/TCDF through OCDD/OCDFwere measured both before <strong>and</strong> after the afterburner. Table 4-29 presents emissions on a flue gasconcentrationbasis <strong>and</strong> as emission factors. Emission factors are on a per-drum basis (55-gallondrum). These data show that the afterburner achieved greater than 95 percent control <strong>of</strong>CDD/CDF emissions.Source LocationsApproximately 2.8 to 6.4 million 55-gallon drums are reconditioned annually in the47United States. This estimate is based on the assumptions that there are 23 to 26 incineratorscurrently in operation, each incinerator h<strong>and</strong>les 500 to 1,000 drums per day, <strong>and</strong> each incinerator47operates 5 days a week with 14 days down time for maintenance. Exact locations <strong>of</strong> theincinerators were not confirmed at the time this document was developed.4-133
TABLE 4-29. CDD/CDF EMISSION CONCENTRATIONS AND EMISSION FACTORS FORA DRUM AND BARREL RECLAMATION FACILITYSCC 3-09-025-01FACTOR QUALITY RATING: DIsomerDIOXINSFlue GasConcentration3lb/ft (µg/dscm)at 3% O 2Before AfterburnerEmission Factorlb/drum(µg/drum) aFlue GasConcentration3lb/ft (µg/dscm)at 3% O 2After AfterburnerEmission Factorlb/drum(µg/drum) a-9 -10 -12 -12 -32,3,7,8-TCDD 1.024x10 (16.4) 4.61x10 (0.209) 3.22x10 (0.0516) 4.61x10 (2.09x10 )-9 -9 -11 -10Total Other TCDD 4.78x10 (76.6) 2.01x10 (0.912) 7.43x10 (1.19) 1.06x10 (0.0482)-9 -9 -11 -11Total PeCDD 6.49x10 (104) 2.69x10 (1.22) 4.49x10 (0.719) 6.44x10 (0.0292)-9 -9 -11 -11Total HxCDD 8.49x10 (136) 3.29x10 (1.49) 4.95x10 (0.793) 7.10x10 (0.0322)-8 -9 -11 -10Total HpCDD 1.66x10 (266) 8.11x10 (3.68) 8.18x10 (1.31) 1.18x10 (0.0534)-9 -9 -11 -11Total OCDD 5.43x10 (86.9) 2.78x10 (1.26) 5.74x10 (0.919) 8.27x10 (0.0375)-8 -8 -10 -10Total CDD 4.29x10 (687) 1.93x10 (8.78) 3.11x10 (4.98) 4.48x10 (0.203)FURANS-9 -9 -11 -112,3,7,8-TCDF 3.90x10 (62.5) 1.67x10 (0.756) 5.60x10 (0.897) 8.05x10 (0.0365)-8 -8 -10 -9Total Other TCDF 5.81x10 (930) 2.38x10 (10.8) 8.93x10 (14.3) 1.29x10 (0.586)-8 -8 -10 -10Total PeCDF 3.89x10 (610) 1.62x10 (7.34) 3.87x10 (6.2) 5.58x10 (0.253)-8 -9 -10 -10Total HxCDF 1.46x10 (234) 5.67x10 (2.57) 1.87x10 (2.99) 2.69x10 (0.122)-8 -9 -10 -10Total HpCDF 1.60x10 (256) 7.74x10 (3.51) 1.26x10 (2.02) 1.81x10 (0.0822)-9 -9 -11 -11Total OCDF 4.61x10 (73.8) 2.31x10 (1.05) 3.43x10 (0.549) 4.94x10 (0.0224)-7 -8 -9 -9Total CDF 1.35x10 (2,170) 5.73x10 (26.0) 1.69x10 (27.0) 2.42x10 (1.10)-7 -8 -9 -9TOTAL CDD/CDF 1.78x10 (2,857) 7.67x10 (34.8) 2.00x10 (32.0) 2.87x10 (1.3)Source: Reference 69.Note: These emissions would originate <strong>from</strong> drums previously storing chlorine-containing lacquers, solvent, etc.a Based on a 55-gallon drum.4-134
4.6 PULP AND PAPER PRODUCTION - KRAFT RECOVERY BOILERSChemical wood pulping involves the extraction <strong>of</strong> cellulose <strong>from</strong> wood bydissolving the lignin that binds the cellulose together. Kraft pulping is the major form <strong>of</strong> chemicalwood pulping in the United States, accounting for over 80 percent <strong>of</strong> the chemically produced70,71pulp, <strong>and</strong> is expected to continue as the dominant pulp process. The following sections focuson the pulp mill thermal chemical recovery processes associated with CDD/CDF emissions.Black liquor is a digestion byproduct <strong>of</strong> the kraft pulping process that consists <strong>of</strong>soluble lignin <strong>and</strong> cooking chemicals. Concentrated black liquor is fired in a recovery furnaceprimarily to recover inorganic chemicals for reuse in the kraft process <strong>and</strong>, secondarily, to provideheat for process steam. Relative to other sources, particularly waste incineration, the combustion<strong>of</strong> black liquor has minimal potential for CDD/CDF emissions. 724.6.1 Process DescriptionThe kraft pulping process involves the cooking or digesting <strong>of</strong> wood chips at anelevated temperature 340 to 360 F (about 175 C) <strong>and</strong> pressure (100 to 135 psig) in "whiteliquor," which is a water solution <strong>of</strong> sodium sulfide (Na S) <strong>and</strong> sodium hydroxide (NaOH). The2lignin that binds the cellulose fibers together is chemically dissolved by the white liquor in adigester. This process breaks the wood into soluble lignin <strong>and</strong> alkali-soluble hemicellulose <strong>and</strong>insoluble cellulose or pulp. A typical kraft sulfite pulping <strong>and</strong> recovery process is shown inFigure 4-27.Two types <strong>of</strong> digester systems are used in chemical pulping: batch <strong>and</strong> continuous.In a batch digester, the contents <strong>of</strong> the digester are transferred to an atmospheric tank, usuallyreferred to as a blow tank, after cooking is completed (2 to 6 hours). In a continuous digester,wood chips <strong>and</strong> white liquor continuously enter the system <strong>from</strong> the top while pulp iscontinuously withdrawn <strong>from</strong> the bottom into a blow tank. In both types <strong>of</strong> digesters, the entire4-135
4-136Figure 4-27. Typical Kraft Pulping <strong>and</strong> Recovery ProcessSource: Reference 70.
contents <strong>of</strong> the blow tank are diluted <strong>and</strong> pumped to a series <strong>of</strong> brown-stock washers, where thespent cooking liquor (called black liquor) is separated <strong>from</strong> the pulp. The pulp, which may thenbe bleached, is pressed <strong>and</strong> dried into the finished product.The balance <strong>of</strong> the kraft process is designed to recover the cooking chemicals <strong>and</strong>heat. The diluted spent cooking liquor, or weak black liquor, which is 12 to 18 percent dissolvedsolids, is extracted <strong>from</strong> the brownstock washers <strong>and</strong> concentrated in a multiple-effect evaporatorsystem to about 55 percent solids. The liquor is then further concentrated to 65 percent solids(strong black liquor) in a direct contact evaporator (DCE) or a nondirect contact evaporator(NDCE), depending on the configuration <strong>of</strong> the recovery furnace in which the liquor iscombusted. (DCE <strong>and</strong> NDCE recovery furnace schematics are shown in Figures 4-28 <strong>and</strong> 4-29,respectively.)In older recovery furnaces, the furnace's hot combustion gases concentrate theblack liquor in a DCE prior to combustion. NDCEs include most furnaces built since the early1970s <strong>and</strong> modified older furnaces that have incorporated recovery systems that eliminate theconventional direct contact evaporators. These NDCEs use a concentrator rather than a DCE toconcentrate the black liquor prior to combustion. In another type <strong>of</strong> NDCE system, the multipleeffect evaporator system is extended to replace the direct contact system.The strong black liquor is sprayed into a recovery furnace with air control tocreate both reducing <strong>and</strong> oxidizing zones within the furnace chamber. The combustion <strong>of</strong> theorganics dissolved in the black liquor provides heat for generating process steam <strong>and</strong>, moreimportantly, reduces sodium sulfate to sodium sulfide to be reused in the cooking process.Sodium sulfate, which constitutes the bulk <strong>of</strong> the particulates in the furnace flue gas, may berecovered by an ESP <strong>and</strong> recycled. After combustion, most <strong>of</strong> the inorganic chemicals present inthe black liquor collect as a molten smelt in the form <strong>of</strong> sodium carbonate (Na CO ) <strong>and</strong> sodium2 3sulfide at the bottom <strong>of</strong> the furnace, where they are continuously withdrawn into a smeltdissolvingtank.4-137
4-138Figure 4-28. Direct Contact Evaporator Recovery FurnaceSource: Reference 70.
4-139Figure 4-29. Nondirect Contact Evaporator Recovery FurnaceSource: Reference 70.
CDD/CDF emissions <strong>from</strong> black liquor combustion will be affected by furnaceemission control devices as well as recovery process operating characteristics, furnace design <strong>and</strong>operation, <strong>and</strong> the characteristics <strong>of</strong> the black liquor feed. Furnace design <strong>and</strong> operation affectcombustion efficiency, which is inversely related to CDD/CDF emissions. The black liquorrecovery process determines the concentration <strong>of</strong> solids in the black liquor feed. Feeds containinga greater concentration <strong>of</strong> organic compounds will exhibit better combustion properties.Preliminary emissions test results <strong>from</strong> kraft recovery furnaces indicate that the CDD/CDF levelsrange <strong>from</strong> extremely low to nondetectable. 9,41Organic <strong>and</strong> inorganic chlorine inputs to the black liquor circuit increase theprobability <strong>of</strong> CDD/CDF formation. The two primary sources <strong>of</strong> chlorine that enter the blackliquor circuit are caustic makeup <strong>and</strong> mill water. 72In addition to straight kraft process liquor, semi-chemical pulping process spentliquor, known as brown liquor, may also be recovered in kraft recovery furnaces. The semichemicalpulping process is a combination <strong>of</strong> chemical <strong>and</strong> mechanical pulping processes that wasdeveloped to produce high-yield chemical pulps. In the semi-chemical process, wood chips arepartially digested with cooking chemicals to weaken the bonds between the lignin <strong>and</strong> the wood.Oversize particles are removed <strong>from</strong> the s<strong>of</strong>tened wood chips <strong>and</strong> the chips are mechanicallyreduced to pulp by grinding them in a refiner.The most common type <strong>of</strong> semi-chemical pulping is referred to as neutral sulfitesemi-chemical (NSSC). The major difference between the semi-chemical process <strong>and</strong> kraft/sulfitepulping process is that the semi-chemical digestion process is shorter <strong>and</strong> wood chips are onlypartially delignified. Based on a survey conducted by EPA in 1993 under the pulp <strong>and</strong> paperindustry MACT st<strong>and</strong>ard development program, no U.S. semi-chemical mills currently practicechemical recovery. However, some semi-chemical pulp mills are, as <strong>of</strong> 1997, using chemical73recovery. Also, some mills combine spent liquor <strong>from</strong> on-site semi-chemical process with spentliquor <strong>from</strong> adjacent kraft process for chemical recovery. 394-140
4.6.2 Emission Control TechniquesParticulate emissions <strong>from</strong> the kraft recovery process are regulated by st<strong>and</strong>ards <strong>of</strong>performance in 40 CFR 60, Subpart BB. Particulate emissions consist primarily <strong>of</strong> sodium sulfate<strong>and</strong> sodium carbonate, with some sodium chloride <strong>and</strong> potentially trace quantities <strong>of</strong> CDD/CDF.Particulate control is provided on recovery furnaces in a variety <strong>of</strong> ways, which should have aneffect on CDD/CDF emissions since CDD/CDF usually condense on particulate. Furtherparticulate control is necessary for direct contact evaporators equipped with either a cyclonicscrubber or cascade evaporator because these devices are generally only 20 to 50 percent efficient70for particulates. Most <strong>of</strong>ten in these cases, an ESP is employed after the direct contactevaporator, for an overall particulate control efficiency range <strong>of</strong> 85 percent to more than99 percent. At existing mills, auxiliary scrubbers may be added to supplement older <strong>and</strong> lessefficient primary particulate control devices.The most commonly used control device on NDCE recovery furnaces is an ESP.Both wet <strong>and</strong> dry bottom ESPs are in use within the industry. The control devices generallyemploy mechanisms to return captured particulate to the process, thus improving the efficiency <strong>of</strong>chemical recovery.4.6.3 Emission Factors<strong>Emissions</strong> <strong>from</strong> kraft pulp <strong>and</strong> paper mills will vary with variations in the kraft39pulping processes <strong>and</strong> the type <strong>of</strong> wood pulped. The National Council <strong>of</strong> the Paper Industry forAir <strong>and</strong> Stream Improvement, Inc. (NCASI) recently evaluated <strong>and</strong> summarized CDD/CDFemissions data <strong>from</strong> seven mills burning black liquor. The individual test reports <strong>and</strong> sitelocations are considered confidential <strong>and</strong> were not made available for inclusion in this report. Theinformation presented here was taken <strong>from</strong> NCASI's technical project summary. All TEFsprovided in the summary <strong>and</strong> discussed in this section are based on the I-TEF/89 scheme, which4-141
has been adopted by EPA as an interim procedure for assessing the risks associated withCDD/CDF exposure.Detailed specific emissions data for CDD/CDF were reported for seven kraftrecovery furnaces. The furnaces at five mills were NDCE furnaces, while the other two mills haddirect contact furnaces. All seven furnaces were controlled with ESPs <strong>and</strong> two (one <strong>of</strong> each type)furnaces were followed by wet scrubbers (probably for added particulate emissions control).The total CDD/CDF TEQs for all furnaces were small (
TABLE 4-30. SUMMARY OF TOTAL CDD/CDF EMISSIONS AND EMISSION FACTORS FROMKRAFT RECOVERY FURNACESSCC 3-07-001-04, 3-07-001-10FACTOR QUALITY RATING: EUnit ID RFB4a RFCb RFDc RFEd RFFe RFGfAverage Max MinI-TEF TEQ, lb/dscf-161.2x10-161.5x10-161.9x10-179.9x10-162.0x10-161.3x10-161.5x10-162.0x10-179.9x10(ng/dscm) at 8.0% O-3(2.0x10 )-3(2.4x10 )-3(3.0x10 )-3(1.6x10 )-3(3.3x10 )-3(2.1x10 )-3(2.1x10 )-3(3.3x10 )-3(1.6x10 )2Emission factor lb-112.2x10TEQ/ton (ug/kg) bls-5(1.1x10 )Source: Reference 41.4-143Note: All results were reported at 12 percent CO . Unit identification codes are confidential for the mills, boilers, <strong>and</strong> units tested.2a NDCE furnace with ESP <strong>and</strong> scrubber, 1990 tests in California - Scrubber Outlet.b NDCE furnace with ESP, 1993 tests in Minnesota.c NDCE furnace with ESP, 1992 tests in New York.d DCE furnace with ESP <strong>and</strong> scrubber, 1992 tests in Louisiana - Scrubber Outlet.e DCE furnace with wet bottom ESP, 1992 tests in North Carolina.f NDCE furnace with ESP, 1990 tests in Michigan.bls = Black liquor solids.
State Kraft Pulp Mills State Kraft Pulp MillsAlabama 14 Montana 1Arizona 1 New Hampshire 1Arkansas 7 New York 1California 2 North Carolina 6Florida 7 Ohio 1Georgia 12 Oklahoma 1Idaho 1 Oregon 7Kentucky 2 Pennsylvania 3Louisiana 10 South Carolina 6Maine 7 Tennessee 2Maryl<strong>and</strong> 1 Texas 6Michigan 3 Virginia 4Minnesota 2 Washington 6Mississippi 6 Wisconsin 4Total 124Source: Reference 72.TABLE 4-31. DISTRIBUTION OF KRAFT PULP MILLS IN THEUNITED STATES (1997)4.7.1 Process DescriptionCombustion generates the heat that takes place inside the combustion chamber.Internal combustion engines are generally fueled by gasoline, diesel fuel, or gasoline/oil mixtures,<strong>and</strong> can make use <strong>of</strong> either a two-stroke or a four-stroke cycle.In a four-stroke cycle, the piston strokes are intake, compression, power, <strong>and</strong>exhaust. The two-stroke cycle gasoline engine is designed to eliminate the intake <strong>and</strong> exhauststrokes <strong>of</strong> the four-stroke cycle. The two-stroke cycle engine operates on a mixture <strong>of</strong> oil <strong>and</strong>gas, with the oil in the gas being the sole source <strong>of</strong> lubrication for the system. 73Most passenger cars <strong>and</strong> some trucks are gasoline-fueled, but large trucks, buses,<strong>and</strong> farm <strong>and</strong> heavy equipment are usually diesel-fueled. Motorcycles, outboard motors, lawnmowers, <strong>and</strong> chain saws are examples <strong>of</strong> equipment that typically use two-cycle engines.4-144
Temperatures in the combustion chamber <strong>and</strong> exhaust system <strong>and</strong> volume flow11,74rates influence CDD/CDF formation in internal combustion engines. Gasoline enginecombustion occurs at temperatures around 6,332 F (3,500 C) at near-stoichiometric oxygenlevels. Gasoline engine exhaust temperatures generally range between 752 <strong>and</strong> 1,112 F (400 <strong>and</strong>600 C). Diesel engines operate at combustion temperatures <strong>of</strong> about 3,657.6 F (2,000 C) withan excess <strong>of</strong> oxygen. Diesel engine exhaust temperatures range between 392 <strong>and</strong> 752 F (200 <strong>and</strong>400 C).The gasoline engine derives its power <strong>from</strong> the explosion <strong>of</strong> a mixture <strong>of</strong> air <strong>and</strong>gasoline, whereas in the diesel engine the fuel burns rather than explodes. The air-fuel mixture,when ignited, exp<strong>and</strong>s rapidly in a cylinder, forcing a piston <strong>from</strong> the top <strong>of</strong> the cylinder to thebottom. The exhaust gases <strong>from</strong> internal combustion engines are potential sources <strong>of</strong> CDD/CDF11emissions. After exhaust is released <strong>from</strong> a vehicle, it is diluted approximately 1,000-fold in thefirst few seconds <strong>and</strong> cools very rapidly.Particulate emissions <strong>from</strong> diesels contain a significant amount <strong>of</strong> organic carbon.CDD/CDF may accumulate in engine oil <strong>and</strong> be emitted when the oil leaks into the combustionchamber or exhaust system <strong>and</strong> survives the emission process. 11,76A number <strong>of</strong> factors may affect CDD/CDF emissions <strong>from</strong> gasoline automobiles<strong>and</strong> trucks, including: 11 Air-to-fuel ratio;Mode <strong>of</strong> vehicle operation;Vehicle mileage;Fuel content;Presence <strong>of</strong> additives or lubricants; <strong>and</strong>Presence <strong>of</strong> emission controls.4-145
Air-to-fuel ratios less than stoichiometric promote incomplete combustion <strong>and</strong>increase emissions. The effect <strong>of</strong> vehicle operation mode is related to the air-to-fuel ratio. Coldstartoperation will cause higher emissions because the engine is operating in a fuel-rich condition.Higher engine load may also increase emissions during cold starts. Frequent engine start-ups <strong>and</strong>shut-downs will decrease the air-to-fuel ratio, thereby decreasing the amount <strong>of</strong> fuel oxidized. 11CDD/CDF emissions are expected to increase with vehicle mileage, primarilybecause <strong>of</strong> increased oil consumption. The higher quantities <strong>of</strong> oil consumed in older, more worncylinders provide more intermediates for CDD/CDF formation; in addition, the CDD/CDF76become concentrated in the oil. Another cause <strong>of</strong> increased CDD/CDF emissions with increasedmileage is the formation <strong>of</strong> deposits in the combustion chamber. <strong>Emissions</strong> increase with mileageuntil the deposits become stabilized.Several studies have identified strong correlations between chlorinated additives in8,75,76gasoline <strong>and</strong> motor oil <strong>and</strong> CDD/CDF emissions during combustion tests. Unleaded gasolinemay have a chlorine content <strong>of</strong> approximately 0.2 lb/ton (10 ppm), whereas the chlorine content in77leaded gasoline may be 5 to 10 times higher. In addition, it has been suggested that theconcentration <strong>of</strong> aromatics in the fuel may contribute to these emissions.76CDD/CDF emissions are higher in cars using leaded gasoline. One reason maybe that leaded gasoline contains chlorine in the form <strong>of</strong> dichloroethane, which is added as a "leadscavenger." However, the amount <strong>of</strong> lead in leaded gasoline has decreased, <strong>and</strong> leaded gasolinewas totally phased out in 1996.4.7.2 Emission Control TechniquesEmission control devices such as catalytic converters have reduced automobile76emissions significantly since the early 1970s. In one study, no dioxins were detected in cars4-146
76equipped with catalytic converters using unleaded gasoline. A subsequent study revealed someCDD <strong>and</strong> CDF in catalyst-equipped cars, but at much lower levels than in the cars using leaded77gasoline. It is theoretically possible that the CDD/CDF formed in cars using unleaded gasoline76could be destroyed in the catalytic converter. However, the lower levels <strong>of</strong> CDD/CDF found incars equipped with catalytic converters using unleaded gasoline cannot be attributed solely to thecatalytic converter. It appears the combination <strong>of</strong> the unleaded gasoline <strong>and</strong> the catalyticconverter lowers CDD/CDF levels.4.7.3 Emission FactorsCDD/CDF can be formed <strong>from</strong> mobile sources. However, emission factorsrelevant to the United States are not readily available. A low confidence or quality rating isassigned to the results <strong>and</strong> emission factors derived <strong>from</strong> European studies because the fuels <strong>and</strong>control technologies used in these cars most likely differ <strong>from</strong> U.S. fuels <strong>and</strong> technologies.In a 1987 study in Sweden, automobile exhaust emissions were analyzed for4CDD/CDF. No CDD/CDF were identified <strong>from</strong> cars equipped with catalytic converters usingunleaded gasoline (representative <strong>of</strong> cars in the United States). The reported results <strong>from</strong> carswithout catalytic converters <strong>and</strong> burning leaded gasoline is not representative <strong>of</strong> cars in the UnitedStates because the normal scavenger mixture <strong>of</strong> dichloro- <strong>and</strong> dibromoethane were not used.-8 -7Reported CDD/CDF emissions were approximately 2.6x10 to 4.7x10 lb/ton (13 to 235 ng/kg)-11 -9or 8.6x10 to 1.6x10 lb/gal (39 to 704 ng/gal) <strong>of</strong> gasoline burned.A 1991 Norwegian study reported CDD/CDF emission factors for on-roadvehicles measured in a tunnel experiment. The length <strong>of</strong> the tunnel was not specified in thereport, but since complex ventilation was not stated, the length was probably relatively short.Measurements <strong>of</strong> traffic density, traffic composition, <strong>and</strong> ventilation rate were also performed.Most <strong>of</strong> the emissions were observed up a grade <strong>and</strong> were not measured on a flat road. Roadtunnel studies can represent an opportunity to obtain exhaust emission factors which can be4-147
epresentative for the car population <strong>and</strong> the various traffic conditions that usually prevail in atunnel.The data presented in Table 4-32 differentiates between emission factors for lightduty (LDV) <strong>and</strong> heavy duty diesel vehicles (HDDV). Although weekday <strong>and</strong> weekend samplingoccurred, the study did not differentiate between the fraction <strong>of</strong> light- <strong>and</strong> heavy-duty fleetssampled during this period. Depending upon driving conditions, the estimated emission factors-13 -12were in the order <strong>of</strong> 1.4x10 to 1.8x10 lb/mile (0.04 to 0.5 ng/km) 2,3,7,8-TEQ (Nordic-10 -11Model) for LDV <strong>and</strong> 2.5x10 to 3.4x10 lb/mile (0.7 to 9.5 ng/km) for HDDV. The emissionfactors for LDV, expressed as ng/km 2,3,7,8-TEQ, were obtained by dynamometer experimentsusing leaded gasoline with dichloroethane added as a scavenger, which is not representative <strong>of</strong> onroadmotor vehicles in the United States.The reader is cautioned in using the emission factors presented in Table 4-32 <strong>and</strong>should recognize that this experiment was conducted with a mixture <strong>of</strong> new <strong>and</strong> old cars (whichare not always properly maintained). At the time <strong>of</strong> the measurements, the average age <strong>of</strong> the carwas about 9 years, <strong>and</strong> unleaded gasoline usage was only 25 to 30 percent <strong>of</strong> total consumption,which also is not representative <strong>of</strong> on-road vehicles in the United States.4.7.4 Source LocationsInternal combustion engines can be found in numerous vehicles, includingpassenger cars, small <strong>and</strong> large trucks, buses, motorcycles, trains, ships, aircraft, farm machinery,<strong>and</strong> military vehicles. Because these vehicles can be found nationwide, attempting to list specificsource/sites is not feasible. It may be reasonable to assume, however, that there is a direct4-148
TABLE 4-32. EMISSION FACTORS FOR ON-ROAD MOBILE SOURCESAMS 22-01-001-000FACTOR QUALITY RATING: USource2,3,7,8-TCDD TEQ alb/VMT(ng/VkmT)2,3,7,8-TCDD lb/VMT(ng/VkmT)2,3,7,8-TCDF lb/VMT(ng/VkmT)-13 -12Light Duty Vehicles 1.35x10 - 1.84x10⁻² -1(3.80x10 - 5.20x10 )--- ---Heavy Duty DieselVehicles-12 -112.55x10 - 3.37x10⁻¹(7.20x10 - 9.5)--- ---Total on-road vehicles b 8.85x10 -14-2(2.50x10 )3.6x10 -15-3(1.00x10 )5.65x10 -14-2(1.60x10 )a Source: Reference 78.b Source: Reference 79.VMT= vehicle miles travelled.correlation between population density <strong>and</strong> the number <strong>of</strong> mobile vehicles in an area (i.e., therewould be more vehicles in a densely populated area than in a rural area).4.8 CARBON REGENERATIONActivated carbon is used primarily for adsorbing pollutants <strong>from</strong> water or air (e.g.,in industrial or municipal wastewater treatment plants). Because <strong>of</strong> increasing environmentalawareness <strong>and</strong> tighter regulations, the dem<strong>and</strong> for activated carbon is increasing. Theconsumption <strong>of</strong> activated carbon in water <strong>and</strong> wastewater treatment operations in 1990 was8 7 80reported at 1.44x10 lb (71,900 tons) (6.54x10 kg).Used carbon can be regenerated (reactivated) by essentially the same process asused for the original activation. The regeneration process creates the potential for CDD/CDFformation.4-149
4.8.1 Process DescriptionIn the regeneration process, organics adsorbed on carbon during use are burned <strong>of</strong>fby placing the spent carbon in continuous internally or externally fired rotary retorts or, most81commonly, in multiple-hearth furnaces. Figure 4-30 shows a cross-section <strong>of</strong> a typical multiple-hearth furnace. In this type <strong>of</strong> furnace, the charge (carbon) is stirred <strong>and</strong> moved <strong>from</strong> one hearthto the next lower hearth by rotating rabble arms. For smaller-scale regeneration operations,fluidized-bed <strong>and</strong> infrared furnaces can be used. The various furnace types used for carbonregeneration <strong>and</strong> the approximate number <strong>of</strong> furnaces <strong>of</strong> each type are shown in Table 4-33. 82In a typical regeneration process, spent carbon in a water slurry form is fed <strong>from</strong> asurge tank to a dewatering screw, which feeds the spent carbon to the top <strong>of</strong> the furnace. In thefurnace, the spent carbon is dried <strong>and</strong> the organics on the carbon are volatilized <strong>and</strong> burned as thecarbon is regenerated. The regenerated carbon drops <strong>from</strong> the bottom hearth <strong>of</strong> the furnace to a81quench tank <strong>and</strong> is stored as a slurry. A flow diagram <strong>of</strong> the carbon regeneration process isshown in Figure 4-31. 81A hot gas, such as steam or carbon dioxide, is introduced into the furnace attemperatures <strong>of</strong> approximately 1498 to 1858 F (800 to 1,000 C), although some excess oxygen83is typically present throughout the furnace. The regeneration process is exothermic, using theheating value <strong>of</strong> the volatile carbon plus heat supplied <strong>from</strong> supplemental fuel (e.g., natural gas).A typical furnace may fire an average <strong>of</strong> 459,089 cubic feet (13,000 cubic meters/day) <strong>of</strong> naturalgas. 81Typical industrial carbon regeneration plants may process up to 109,127 lbs/day(49,500 kg/day) <strong>of</strong> spent carbon <strong>from</strong> numerous industrial or municipal facilities that use activated81carbon for wastewater treatment. Regeneration plants may operate 24 hrs/day, 7 days/wk formuch <strong>of</strong> the year, with periodic shut-downs for furnace maintenance.4-150
Furnace Exhaustto AfterburnerFloatingDamperFeedMaterialPyrolysisGasesProductCooling <strong>and</strong> CombustionAirSource: Reference 18.Figure 4-30. Cross Section <strong>of</strong> a Typical Multiple-Hearth Furnace4-151
Furnace TypeApproximate No.<strong>of</strong> Units in U.S.Multiple-hearth
Refractory Lined DuctExhaust Gasto Atmosphere4-153Spent Carbon <strong>from</strong>Industrial WastewaterTreatment Plant UsersSpentCarbonStorageTanksAfterburnerExhaustFurnaceExhaustAfterburnerNatural GasAirSodium CarbonateSolutionAtomizingAirSprayCoolerSurgeTankDewateringScrewSpent CarbonSpray CoolerExhaustStackMultiple-HearthFurnaceNatural GasAirRegenerated Carbon toIndustrial WastewaterTreatment Plant UsersBaghouseBaghouseExhaustID FanQuenchTankRegeneratedCarbonStorageTanksBaghouseCatchFigure 4-31. Process Flow Diagram <strong>of</strong> a Carbon Regeneration ProcessSource: Reference 82.
<strong>Emissions</strong> <strong>from</strong> carbon activation <strong>and</strong> regeneration processes contain a number <strong>of</strong>toxic air pollutants. Regeneration has an even greater potential for producing toxic emissionsbecause the carbon has <strong>of</strong>ten been used in adsorbing compounds classified as toxic airpollutants. 83Of special interest is the potential for CDD/CDF formation in the hightemperature,low-oxygen environment <strong>of</strong> the regeneration furnace. One study found no evidence<strong>of</strong> CDD/CDF emissions <strong>from</strong> the regeneration <strong>of</strong> virgin carbon, but did detect both families <strong>of</strong>84compounds when regenerating spent carbon <strong>from</strong> wastewater treatment facilities. The dataindicate that these byproducts formed <strong>from</strong> the adsorbed organics on the spent carbon rather than<strong>from</strong> impurities in the virgin carbon.4.8.2 Emission Control TechniquesThe primary point source <strong>of</strong> emissions <strong>from</strong> the carbon regeneration process is thefurnace exhaust. These emissions are typically controlled by afterburners followed by water81scrubbers. The afterburner may consist <strong>of</strong> a short vertical section with natural gas-fired burners<strong>and</strong> a long horizontal section <strong>of</strong> refractory-lined duct with no burners. Afterburner combustiontemperatures <strong>of</strong> 1822 F (980 C) or greater <strong>and</strong> residence times in excess <strong>of</strong> two seconds are83typical. Temperatures greater than 1625 F (871 C) <strong>and</strong> residence times longer than810.5 seconds are recommended. There are no available data on destruction removal efficiency(DRE) for an afterburner control system in this application. However, the conditions <strong>and</strong>configuration are similar to those used for controlling hazardous waste incinerator emissions,where DREs <strong>of</strong> 99.99 percent are typical. 83Exhaust gases <strong>from</strong> the afterburner can be cooled by an alkaline (e.g., sodiumcarbonate) spray cooler in which an atomized dilute alkaline solution is mixed with the exhaustgas. The alkaline medium neutralizes acid gases to permit compliance with regulatory emission83limits. From the spray cooler, the exhaust gases may enter centrifugal or fabric filter (baghouse)4-154
collectors, which are used to control particulate <strong>and</strong> reaction products <strong>from</strong> upstreamcomponents. Collection efficiencies <strong>of</strong> 65 percent for centrifugal collection <strong>and</strong> 99 percent for83fabric filtration have been reported. The collected particulate is ultimately disposed <strong>of</strong> in al<strong>and</strong>fill.4.8.3 <strong>Emissions</strong> <strong>and</strong> Emission FactorsSeveral studies have been conducted to test CDD/CDF emissions <strong>from</strong> carbonregeneration facilities. Table 4-34 summarizes the results <strong>of</strong> two studies in which emissions <strong>from</strong>9a fluidized-bed system were tested. The first study tested emissions <strong>from</strong> the system before anafterburner was installed; the second study took place after its installation. The carbonregenerated during the first study had been in service for approximately one year, <strong>and</strong> the carbonin the second study for 200 days.In the first study, concentrations <strong>of</strong> 2,3,7,8-TCDD in the flue gas ranged <strong>from</strong>-16 -14 3 3 -15 36.24x10 to 1.31x10 lb/ft (0.01 to 0.21 ng/m ), with an average <strong>of</strong> 6.24x10 lb/ft3(0.1 ng/m ). In the second study, emissions <strong>from</strong> the stack <strong>and</strong> afterburner were tested.2,3,7,8-TCDD was not detected in any <strong>of</strong> the samples.In another study, a horizontal infrared regeneration furnace was fitted with anafterburner designed to provide a 20-second residence time at a temperature <strong>of</strong> 1876 F (1010 C).Table 4-35 shows CDD/CDF emissions <strong>from</strong> this study. 84Results <strong>of</strong> CDD/CDF emissions testing at a carbon regeneration facility with a81multiple-hearth furnace are shown in Table 4-36. The emissions at this facility were controlledby an afterburner, a sodium carbonate spray cooler, <strong>and</strong> a baghouse. Sampling was performed atthe spray cooler inlet location <strong>and</strong> the baghouse outlet exhaust stack. Samples <strong>of</strong> the baghouse4-155
TABLE 4-34. CDD/CDF CONCENTRATIONS IN THE FLUE GAS AND ASHFROM A FLUIDIZED-BED CARBON REGENERATION FURNACE2,3,7,8-TCDD Total CDD Total CDF3Mean in lb/ft3Range in lb/ft3Mean in lb/ft3Range in lb/ft3Mean in lb/ft Range in lb/ftType <strong>of</strong> Facility Sample3(ng/m )3(ng/m )3(ng/m )3(ng/m )3(ng/m )3(ng/m )Fluidized-Bed w/o FG-156.2x10-150.62 - 13.11x10-1511.2x10-153.75 - 18.7x10-1518.7x10-155.0 - 31.8x10Afterburner (0.1) (0.01 - 0.21) (0.18) (0.06 - 0.3) (0.3) (0.08 - 0.51)PM-650x10 lb/ton-68.6 - 102.4x10-696x10 lb/ton-672-132x10 lb/ton-6206x10 lb/ton-6ND - 490x10(25 ng/g) lb/ton (48 ng/g) (36 - 66 ng/g) (103 ng/g) lb/ton(4.3 - 51.2 ng/g) (ND - 245 ng/g)34-156-15Fluidized Bed FG (Stack) ND 98.7x10 3.1x10w/Afterburner (1.58) a(0.05) bFG (Recup) ND-1599.3x10 ND - 2.32x10 85.5x10 0.94 - 297.2x10(1.59) (ND - 3.71) (1.37) (0.015 - 4.76)FG ND-157.5x10-1527.5x10(Afterburner (0.12) (0.44)1 sec.)-15-13 -13 -15FG ND-1443.7x10-14ND - 8.74x10-141.81x10-1511.8 - 24.4x10(Afterburner (0.7) (ND - 1.4) (0.29) (0.19 - 0.39)2 sec.)Source: Reference 9.a HpCDD <strong>and</strong> OCDD homologues only.b HxCDF, HpCDF, OCDF homologues only.FG = Flue gas.PM = Particulate matter.ND = Not detected.
TABLE 4-35. CDD/CDF CONCENTRATIONS AND EMISSION FACTORS FOR AHORIZONTAL INFRARED CARBON REGENERATION FURNACE a,bSCC 3-99-999-93FACTOR QUALITY RATING: UIsomerDIOXINS2,3,7,8-TCDDAverage Concentration inlb/dscf (ng/dscm)NDEmission Factors inlb/ton (mg/kg) <strong>of</strong>carbon regenerated-14 -2 -5 -2Total Other TCDD 7.50x10 (1.20x10 ) 4.80x10 (2.40x10 )Total PeCDD ND ---16 -1Total HxCDD 2.80x10 (4.48x10 )-15 -2Total HpCDD 2.00x10 (3.20x10 )-16 -1Total OCDD 1.56x10 (2.50x10 )-14 -1Total CDD 7.74x10 (7.42x10 )-3 -11.80x10 (9.00x10 )-4 -21.20x10 (6.40x10 )-4 -11.28x10 (5.02x10 )-32.10x10 (1.49)FURANS-15 -22,3,7,8-TCDF 4.20x10 (6.80x10 )-16 -1Total Other TCDF 1.18x10 (1.89x10 )-15 -2Total PeCDF 4.70x10 (7.50x10 )-15 -2Total HxCDF 1.87x10 (3.00x10 )-15 -2Total HpCDF 2.68x10 (4.30x10 )-15 -2Total OCDF 2.06x10 (3.30x10 )-14 -1Total CDF 1.56x10 (4.38x10 )-4 -12.74x10 (1.37x10 )-4 -17.60x10 (3.80x10 )-4 -13.02x10 (1.51x10 )-4 -21.20x10 (6.00x10 )-4 -21.72x10 (8.60x10 )-4 -21.32x10 (6.60x10 )-3 -11.76x10 (8.8x10 )Source: Reference 84.abCombustion gas flow rate was 196 dscm/hr. Facility operated 7,000 hr/yr. Operating rate <strong>of</strong> system was 97.5kg <strong>of</strong> spent activated carbon per hour.Control device consists <strong>of</strong> afterburner sized for a 0.3-minute (20-second) residence time at 1,850 F (1,010 C).ND = Not detected.U = Unratable.4-157
TABLE 4-36. CDD/CDF EMISSIONS DATA FROM A MULTIPLE-HEARTH CARBONREGENERATION FURNACE aSCC 3-99-999-93FACTOR QUALITY RATING: DIsomerINLET:Concentration inlb/dscf (ng/dscm)Emission Factor inlb/ton (ng/kg)-15 -2 -9 -12,3,7,8-TCDD 5.62x10 (9.00x10 ) 1.78x10 (8.90x10 )-18 -11Total CDD 1.79x10 (28.8)6.00x10 (300)-18 -12Total CDF 3.13x10 (50.1)1.40x10 (700)OUTLET:2,3,7,8-TCDD ND ND-17Total CDD 2.30x10 (3.69)-17Total CDF 2.07x10 (3.32)-106.26x10 (31.3)-105.46x10 (27.3)BAGHOUSE ASH:-16Total CDD 6.86x10 (1.1)-16 -1Total CDF 3.12x10 (5.00x10 )NRNRSource: Reference 81.a Control devices consist <strong>of</strong> afterburner, sodium carbonate spray cooler, <strong>and</strong> baghouse.ND = Not detected.NR = Not reported.4-158
dust were also collected <strong>and</strong> analyzed for CDD/CDF. In addition, ambient air sampling wasperformed near the atomizing air intake point at the spray cooler.Detectable quantities <strong>of</strong> all targeted dioxin <strong>and</strong> furan species except 2,3,7,8-TCDD<strong>and</strong> 2,3,7,8-TCDF were found in the stack gas at the baghouse outlet exhaust stack. At the spraycooler inlet, all targeted CDD/CDF species were detected. Dioxin <strong>and</strong> furan homologues except2,3,7,8-TCDD were detected at low concentrations in the baghouse ash.Results <strong>of</strong> 1991 emissions tests performed at a county water treatment facility inCalifornia were recently made available. The tests were conducted on the lime recalcing unit <strong>and</strong>the charcoal furnace. Each unit was tested for speciated organic compounds, including dioxins<strong>and</strong> furans. Emission factors developed <strong>from</strong> the test results are presented in Table 4-37. Notethat the configuration <strong>and</strong> type <strong>of</strong> furnace tested is not known. However, the test report did statethat the furnace was controlled by an afterburner <strong>and</strong> a scrubber. 85TABLE 4-37. CARBON REGENERATION FURNACE EMISSION FACTORSSCC 3-99-999-93FACTOR QUALITY RATING: UPollutantlb/ton carbonreactivatedEmission FactorKg/Mg carbonreactivated2,3,7,8-TCDD 2.10x10 -10 1.05x10 -102,3,7,8-TCDF 1.36x10 -9 6.80x10 -102,3,7,8-TCDD TEQ 3.46x10 -9 1.73x10 -9Total CDD 4.64x10 -8 2.32x10 -8Total CDF 4.76x10 -8 2.38x10 -8Source: Reference 85. The type <strong>of</strong> configuration <strong>of</strong> the furnace were not specified. Control devices used were anafterburner <strong>and</strong> a scrubber.4-159
In summary, the studies indicated that, in most cases, detectable quantities <strong>of</strong>targeted dioxin <strong>and</strong> furan species were found at various locations (stack outlets, spray coolerinlets, ambient air) at carbon regeneration facilities. However, emission control devices reducedCDD/CDF emissions. The sites chosen for these studies were considered representative <strong>of</strong> othercarbon regeneration facilities in the United States; therefore, the emission factors developed <strong>from</strong>the data are considered reliable.4.8.4 Source LocationsActivated carbon is used primarily to adsorb organics <strong>from</strong> water at industrial ormunicipal wastewater treatment plants. Carbon regeneration may be performed at the site wherethe carbon was used (on-site regeneration) or at a commercial regeneration facility that processesspent carbon <strong>from</strong> multiple industries. Because <strong>of</strong> the numbers <strong>of</strong> potential individual emissionsources, listing specific sites in this document is not feasible.4.9 OPEN BURNING AND ACCIDENTAL FIRESThis section describes CDD/CDF formation <strong>from</strong> forest fires, agricultural <strong>and</strong> openrefuse burning, <strong>and</strong> structure (building) <strong>and</strong> PCB fires, <strong>and</strong> their associated emission factors.4.9.1 Forest Fires <strong>and</strong> Agricultural BurningProcess DescriptionThe burning <strong>of</strong> forest l<strong>and</strong>s occurs through controlled prescribed burning <strong>and</strong>through uncontrolled accidental forest fires. Prescribed burning is the application <strong>and</strong>confinement <strong>of</strong> fire under specified weather, fuel moisture, <strong>and</strong> soil moisture conditions toaccomplish planned benefits such as fire hazard reduction, control <strong>of</strong> undesired species, seedbed<strong>and</strong> site preparation, wildlife habitat improvement, <strong>and</strong> tree disease control. Uncontrolled forest4-160
fires (wildfires) are fires that are started naturally (e.g., by lightening), accidentally, orintentionally that burn <strong>and</strong> spread in generally unpredictable patterns.Agricultural burning involves the purposeful combustion <strong>of</strong> field crop, row crop,<strong>and</strong> fruit <strong>and</strong> nut crop residues to achieve one or a combination <strong>of</strong> desired objectives. The typicalobjectives <strong>of</strong> agricultural burning are:Removal <strong>and</strong> disposal <strong>of</strong> agricultural residue at a low cost;Preparation <strong>of</strong> farml<strong>and</strong>s for cultivation;Cleaning <strong>of</strong> vines <strong>and</strong> leaves <strong>from</strong> fields to facilitate harvest operations;Disease control;Direct weed control by incinerating weed plants <strong>and</strong> seeds;Indirect weed control by providing clean soil surface for soil-activeherbicides; <strong>and</strong>Selective destruction <strong>of</strong> mites, insects, <strong>and</strong> rodents.The types <strong>of</strong> agricultural waste subject to burning include residues such as ricestraw <strong>and</strong> stubble, barley straw <strong>and</strong> stubble, wheat residues, orchard prunings <strong>and</strong> natural attritionlosses, grass straw <strong>and</strong> stubble, potato <strong>and</strong> peanut vines, tobacco stalks, soybean residues, hayresidues, sugarcane leaves <strong>and</strong> tops, <strong>and</strong> farml<strong>and</strong> grass <strong>and</strong> weeds.Emission FactorsAlthough the potential for emissions exists, CDD/CDF emission factors have notbeen identified for agricultural burning. As discussed above, CDD/CDF have been detected inwood-fired boiler emissions <strong>and</strong> in the ash <strong>from</strong> residential wood stoves. Although thecombustion processes that take place in agricultural burning are different <strong>from</strong> those in woodfiredboilers or wood stoves, the fuels are <strong>of</strong> similar composition. Reported chloride4-161
86concentrations range <strong>from</strong> 100 to 10,000 ppm in wood <strong>and</strong> agricultural vegetative matter.Emission factors based on the mass <strong>of</strong> pollutant emitted per mass <strong>of</strong> material combusted would beexpected to be low for agricultural burning; however, total emissions could be substantial because<strong>of</strong> the large amounts <strong>of</strong> materials combusted.Two separate studies reviewed indicated that wood burned in forest fires may87,88reasonably be considered a source <strong>of</strong> CDD/CDF. Another study reviewed reported directmeasurements <strong>of</strong> CDD/CDF in the actual emissions <strong>from</strong> forest fires at detected levels <strong>of</strong> 15 to3 89400 pg/m for total CDD/CDF. These concentrations cannot accurately be converted to anemission factor because the rate <strong>of</strong> wood combustion is not known. However, an alternativeapproach assumes that the emission factor for residential wood burning (using natural wood <strong>and</strong>an open door) applies to forest fires. This approach suggests an emission factor <strong>of</strong> about 1 ngTEQ/kg <strong>of</strong> material burned for total CDD/CDF. It should be noted that forest fire <strong>and</strong> woodstove combustion conditions differ significantly. Thus, this emission factor is considered highlyuncertain <strong>and</strong> is assigned a low quality rating <strong>of</strong> U (unratable because it was developed <strong>from</strong>engineering judgment based on theoretical data).Source LocationsAccording to the U.S. Forest Service, the majority <strong>of</strong> prescribed burning in theUnited States occurs in the southern/southeastern region <strong>of</strong> the United States (60 percent in1984), followed by the Pacific Northwest (almost 20 percent), <strong>and</strong> California (10 percent). 87,88The locations <strong>of</strong> uncontrolled forest fires are not as definable as those <strong>of</strong>prescribed burning sites, but historical records <strong>of</strong> fires <strong>and</strong> a knowledge <strong>of</strong> the locations <strong>of</strong>primary forest resources can be used to predict where the majority <strong>of</strong> forest fires are likely tooccur. The southern <strong>and</strong> western regions <strong>of</strong> the country (including California, the PacificNorthwest, <strong>and</strong> western mountain states) appear to represent the greatest potential for forestwildfires. Forest Service data for 1983 indicate that 67 percent <strong>of</strong> the total number <strong>of</strong> acres4-162
urned by wildfires nationally were in the southern/southeastern region. The western regionscontained 17 percent <strong>of</strong> the wildfire-burned acreage, <strong>and</strong> the northern region (Idaho, Montana,North Dakota) contained another 6 percent.Agricultural burning is directly tied to the agriculture industry. Major agriculturalstates--including California, Louisiana, Florida, Hawaii, North Carolina, Mississippi, <strong>and</strong> Kansas--conduct the majority <strong>of</strong> agricultural burning.4.9.2 Miscellaneous Open Refuse Burning <strong>and</strong> Structure FiresProcess DescriptionThe most readily identifiable types <strong>of</strong> open-burned refuse materials are municipalrefuse, bulky items such as furniture <strong>and</strong> bedding, construction debris, <strong>and</strong> yard waste. Structurefires are similar to open refuse burning in that the types <strong>of</strong> materials combusted are similar (e.g.,wood, paper, plastic, textiles, etc.).The procedure <strong>of</strong> open burning is relatively simple. The material to be burned iscollected <strong>and</strong> aggregated in an open space fully exposed to the atmosphere. The materials areignited <strong>and</strong> allowed to burn <strong>and</strong> smolder until all combustible material is consumed or the desireddegree <strong>of</strong> volume reduction is achieved. Structure fires are highly variable in nature <strong>and</strong> <strong>of</strong>tenresult in smoldering heaps similar to open refuse piles.In open refuse burning <strong>and</strong> structure fires, combustion conditions are typicallypoor <strong>and</strong> are highly variable because <strong>of</strong> variations in air flow, fuel moisture content, oxygenlevels, material configuration, <strong>and</strong> degree <strong>of</strong> exposed surface area. In addition, some refuse orbuilding materials may contain organic constituents that are CDD/CDF precursors or thataccelerate CDD/CDF formation.4-163
Emission FactorsCDD/CDF emission factors have not been identified for miscellaneous openburning or structure fires. However, CDD/CDF emissions would be expected because thecomposition <strong>of</strong> materials burned in these fires may be the same or similar to that <strong>of</strong> municipalwaste combusted in MWCs. CDD/CDF emissions <strong>from</strong> MWCs measured at the inlet to pollutioncontrol equipment (i.e., uncontrolled emissions) were previously presented (in Section 4.1). Thecombustion processes occurring in open-burning refuse piles or structure fires are much lessefficient than those in an MWC <strong>and</strong> may provide an enhanced environment for CDD/CDFformation.Open burning <strong>of</strong> municipal waste or construction debris containing chlorinatedplastics or other chlorine-containing materials would be expected to emit levels <strong>of</strong> CDD/CDFcomparable to or higher than those <strong>from</strong> uncontrolled MWC emissions. On the other h<strong>and</strong>, openburning or structure fires in which the materials being burned are low in chlorine content (e.g.,wood, yard waste) would be expected to have lower CDD/CDF emissions.4.9.3 Polychlorinated Biphenyls FiresProcess DescriptionFires involving polychlorinated biphenyls (PCB)-containing electrical equipmentsuch as transformers <strong>and</strong> capacitors can result in CDD/CDF formation <strong>and</strong> emissions. Electricalequipment containing PCB may catch fire or explode as a result <strong>of</strong> a fire in a building containingsuch equipment, or during lightening strikes or electrical surges.Regulations established by EPA have reduced the chances <strong>of</strong> PCB fires by(1) requiring the removal <strong>of</strong> some large networks <strong>of</strong> PCB transformers near commercial buildings;(2) banning the installation <strong>of</strong> new PCB transformers; (3) requiring existing PCB transformers to4-164
e equipped with enhanced electrical protection; (4) requiring the removal <strong>of</strong> combustiblematerials <strong>from</strong> PCB transformer locations; <strong>and</strong> (5) requiring that all PCB transformers be90registered with building owners <strong>and</strong> emergency response personnel. However, many PCBtransformers <strong>and</strong> other electrical equipment are still in use <strong>and</strong> subject to accidental fires orexplosions.<strong>Emissions</strong> DataGaseous emissions <strong>from</strong> PCB fires have not been measured <strong>and</strong> CDD/CDFemission factors are not available. However, the presence <strong>of</strong> CDD/CDF in soot <strong>from</strong> PCB fires91has been confirmed in several studies. The data identified <strong>from</strong> these studies are presentedbelow.In Binghamton, New York, in 1981, an electrical transformer containing about1,100 gallons <strong>of</strong> PCB was involved in an explosion. Total CDD/CDF in the soot was initiallyfound to be as high as 4.3 lb/ton (2,160,000 ng/g). 2,3,7,8-TCDF accounted for 0.02 lb/ton(12,000 ng/g) <strong>of</strong> total CDF. HxCDF alone accounted for 1.9 lb/ton (965,000 ng/g) <strong>of</strong> total CDF.-3Total CDD were found at a concentration <strong>of</strong> 0.04 lb/ton (20,000 ng/g), including 1.2x10 lb/ton(600 ng/g) 2,3,7,8-TCDD.In January 1982, an electrical fire involving PCB occurred in a Boston,Massachusetts, <strong>of</strong>fice building. One bulk soot sample contained a total <strong>of</strong> 0.23 lb/ton(115,000 ng/g) CDF, including 0.12 lb/ton (60,000 ng/g) TCDF. CDD were not detected above-4 91an analytical detection limit <strong>of</strong> 2x10 (100 ng/g).In Miami, Florida, in April 1982, a fire <strong>and</strong> explosion occurred when anunderground transformer vault exploded, releasing approximately 100 gallons (379 liters) <strong>of</strong> PCBtransformer oil onto the floor. Smoke ejector fans were set up to ventilate the vault. Samples <strong>of</strong>soot <strong>and</strong> other residue <strong>from</strong> the fire were collected <strong>from</strong> surfaces near the fire scene. CDD were4-165
-5not detected in these samples at an analytical detection limit <strong>of</strong> 2x10 lb/ton (10 ng/g). One soot-3<strong>and</strong> dust sample contained 3.4x10 lb/ton (1,710 ng/g) TCDF through OCDF homologues <strong>and</strong>-3another soot sample contained 1.3x10 lb/ton (670 ng/g) TCDF through OCDF homologues.-5The 2,3,7,8-TCDF isomer was not detected at an analytical detection limit <strong>of</strong> 2x10 lb/ton(10 ng/g). 91 A fire in Washington State in 1984 involved transformer oil <strong>and</strong> cores. A grab-5sample <strong>of</strong> the ash was analyzed <strong>and</strong> found to contain 8.2x10 lb/ton (41.4 ng/g) CDF <strong>and</strong>-6 -65.4x10 lb/ton (2.7 ng/g) <strong>and</strong> 5x10 lb/ton (2.5 ng/g) <strong>of</strong> the HpCDD <strong>and</strong> OCDD homologues,respectively. 91 Source LocationsTransformers <strong>and</strong> capacitors containing PCBs are widely distributed throughoutthe United States. They are located at electrical substations, in commercial <strong>and</strong> industrialbuildings, mounted on utility poles, in railroad locomotives, <strong>and</strong> in mining equipment motors.Although the installation <strong>of</strong> new PCB-containing equipment has been banned <strong>and</strong> regulationsregarding existing ones have been implemented, there are millions <strong>of</strong> existing PCB transformers<strong>and</strong> capacitors currently in use in the United States. Table 4-38 provides estimates <strong>of</strong> thenumbers <strong>and</strong> types <strong>of</strong> PCB-containing electrical equipment in the United States in 1988.4.10 MUNICIPAL SOLID WASTE LANDFILLSA municipal solid waste (MSW) l<strong>and</strong>fill unit is a discrete area <strong>of</strong> l<strong>and</strong> or anexcavation that receives household waste, but is not a l<strong>and</strong> application unit (i.e., for receivingsewage sludge). An MSW l<strong>and</strong>fill unit may also receive other types <strong>of</strong> wastes, such ascommercial solid waste, nonhazardous sludge, <strong>and</strong> industrial solid waste. CDD/CDF emissions<strong>from</strong> MSW l<strong>and</strong>fills are expected to originate <strong>from</strong> the non-household sources <strong>of</strong> MSW.4-166
TABLE 4-38. ESTIMATES OF THE NUMBER AND TYPE OF PCB-CONTAININGELECTRICAL EQUIPMENT IN THE UNITED STATES (1988)Equipment PCB Content Approximate UnitsTransformers 70% (by wt.) 32,000Capacitors 70% (by wt.) 1,500,000Mineral OilTransformers/CapacitorsMineral OilTransformers/CapacitorsMineral OilTransformers/Capacitors>500 ppm 200,00050-500 ppm 1,500,000
heavy equipment. A daily soil cover is spread over the compacted waste. The trench methodentails excavating trenches designed to receive a day's worth <strong>of</strong> waste. The soil <strong>from</strong> theexcavation is <strong>of</strong>ten used for cover material <strong>and</strong> wind breaks. The ramp method is typicallyemployed on sloping l<strong>and</strong>, where waste is spread <strong>and</strong> compacted in a manner similar to the areamethod; however, the cover material obtained is generally <strong>from</strong> the front <strong>of</strong> the working face <strong>of</strong>the filling operation. The trench <strong>and</strong> ramp methods are not commonly used, <strong>and</strong> are not thepreferred methods when liners <strong>and</strong> leachate collection systems are utilized or required by law.Modern l<strong>and</strong>fill design <strong>of</strong>ten incorporates liners constructed <strong>of</strong> soil(e.g., recompacted clay) or synthetics (e.g., high density polyethylene) or both to provide animpermeable barrier to leachate (i.e., water that has passed through the l<strong>and</strong>fill) <strong>and</strong> gas migration<strong>from</strong> the l<strong>and</strong>fill.4.10.2 Emission Control TechniquesL<strong>and</strong>fill gas collection systems are either active or passive systems. Activecollection systems provide a pressure gradient in order to extract l<strong>and</strong>fill gas by use <strong>of</strong> mechanicalblowers or compressors. Passive systems allow the natural pressure gradient created by theincrease in l<strong>and</strong>fill pressure <strong>from</strong> l<strong>and</strong>fill gas generation to mobilize the gas for collection.L<strong>and</strong>fill gas control <strong>and</strong> treatment options include (1) combustion <strong>of</strong> the l<strong>and</strong>fillgas, <strong>and</strong> (2) purification <strong>of</strong> the l<strong>and</strong>fill gas. Combustion techniques include techniques that do notrecover energy (e.g., flares <strong>and</strong> thermal incinerators) <strong>and</strong> techniques that recover energy <strong>and</strong>generate electricity <strong>from</strong> the combustion <strong>of</strong> the l<strong>and</strong>fill gas (e.g., gas turbines <strong>and</strong> internalcombustion engines). Boilers can also be employed to recover energy <strong>from</strong> l<strong>and</strong>fill gas in theform <strong>of</strong> steam. Flares involve an open combustion process that requires oxygen for combustion;the flares can be open or enclosed. Thermal incinerators heat an organic chemical to a highenough temperature in the presence <strong>of</strong> sufficient oxygen to oxidize the chemical to CO 2 <strong>and</strong>4-168
water. Purification techniques can also be used to process raw l<strong>and</strong>fill gas to pipeline qualitynatural gas by using adsorption, absorption, <strong>and</strong> membranes.4.10.3 Emission FactorsDuring the development <strong>of</strong> this document, no data were identified that indicateCDD/CDF are emitted in l<strong>and</strong>fill gas. However, one test report on a l<strong>and</strong>fill gas flare was93obtained that presents CDD/CDF emissions results. Emission factors developed <strong>from</strong> datapresented in the report are provided in Table 4-39. Results <strong>of</strong> the emissions test on the flareindicate that combustion <strong>of</strong> l<strong>and</strong>fill gas may be a source <strong>of</strong> CDD/CDF emissions.4.11 ORGANIC CHEMICALS MANUFACTURE AND USEChemical reactions involved in the manufacture <strong>of</strong> halogenated organic chemicalscan produce small quantities <strong>of</strong> dioxin <strong>and</strong> furan by-products. These pollutants may be lost to theair during product manufacture or emitted later during the use <strong>of</strong> the contaminated products. Thissection documents potential mechanisms for CDD/CDF formation <strong>and</strong> the potential occurrence <strong>of</strong>these contaminants in the production <strong>and</strong> use <strong>of</strong> specific halogenated organic chemicals. Inaddition, data on actual product analysis for some <strong>of</strong> these compounds is presented. Thepresented information has been limited to chlorinated <strong>and</strong> brominated compounds currentlyproduced in the United States that are most likely to be contaminated with dioxins <strong>and</strong> furans.4.11.1 General Chemical Formation MechanismsFour major mechanisms have been postulated for the formation <strong>of</strong> halogenated94,95dioxins <strong>and</strong> furans in the manufacture <strong>of</strong> halogenated organic chemicals: (1) directhalogenation <strong>of</strong> dioxins or furans (Figure 4-32a); (2) reaction <strong>of</strong> an ortho halogen with a phenate(Figure 4-32b); (3) loss <strong>of</strong> the halogen (e.g., chlorine or bromine) <strong>from</strong> a halogenated phenate to4-169
TABLE 4-39. EMISSION FACTORS FROM A LANDFILL GASCOMBUSTION SYSTEMaSCC: 5-02-006-01FACTOR QUALITY RATING: DIsomer lb/MMBtu g/MJ2,3,7,8-TCDD 2.30x10 -12 9.89x10 -131,2,3,7,8-PeCDD 1.15x10 -11 4.95x10 -121,2,3,4,6,8-HxCDD 9.20x10 -12 3.96x10 -121,2,3,4,7,8-HxCDD 9.20x10 -12 3.96x10 -121,2,3,7,8,9-HxCDD 3.23x10 -11 1.39x10 -111,2,3,4,6,7,8-HpCDD 9.45x10 -11 4.06x10 -11Total OCDD 5.52x10 -10 2.37x10 -10Total CDD 7.11x10 -10 3.05x10 -102,3,7,8-TCDF 1.76x10 -9 7.57x10 -101,2,3,7,8-PeCDF 4.82x10 -11 2.07x10 -112,3,4,7,8-PeCDF 1.42x10 -10 6.11x10 -111,2,3,4,7,8-HxCDF 1.82x10 -10 7.83x10 -111,2,3,6,7,8-HxCDF 5.28x10 -11 2.27x10 -111,2,3,7,8,9-HxCDF 1.38x10 -11 5.93x10 -122,3,4,6,7,8-HxCDF 8.52x10 -11 3.66x10 -111,2,3,4,6,7,8-HpCDF 1.52x10 -10 6.54x10 -111,2,3,4,7,8,9-HpCDF 9.19x10 -12 3.95x10 -12Total OCDF 7.99x10 -11 3.44x10 -11Total CDF 2.53x10 -9 1.09x10 -9Source: Reference 93.a Control device is an afterburner where test was taken.4-170
+(x+y)Cl 2ClxCly+(x+y)HCla. Halogenation <strong>of</strong> <strong>Dioxins</strong> or FuransYO-XXO-M+YYXOX O-M +--Xb. Reaction <strong>of</strong> an Ortho Halogen with a PhenateYOOYX = Leaving Group(e.g., Cl, Br, F, I, NO2)M = Alkali Metal CationY = Substituent Group+MX2ClClONaClClClOCl ClCl+NaClONaClClOCl+Cl 2ONac. Loss <strong>of</strong> Halogen (e.g., Chlorine or Bromine) <strong>from</strong> aHalogenated Phenate to form Halogenated FuransY- O +NaO-Br+-NaBrOBrNa +O-BrYBrYYOY-OBrYOY-OO-OBrYOYYOYYOYd. Reactions Between Ortho - <strong>and</strong> Meta Substituted HalogensFigure 4-32(a-d). Mechanisms for Halogenated Dioxin <strong>and</strong> Furan ProductionSource: References 94, 95.4-171
form halogenated furans (Figure 4-32c); <strong>and</strong> (4) reactions between ortho- <strong>and</strong> meta-substitutedhalogens (Figure 4-32d).A number <strong>of</strong> factors influence the amount <strong>of</strong> dioxins <strong>and</strong> furans that may beformed in a given manufacturing process, including temperature, pH, catalyst, <strong>and</strong> reactionkinetics. 95The effect <strong>of</strong> temperature on the formation <strong>of</strong> halogenated dioxins <strong>and</strong> furans iswell recognized. A mathematical relationship between temperature <strong>and</strong> dioxin formation has been95proposed to calculate the theoretical amount <strong>of</strong> dioxins that can be expected. This relationshipis expressed as:7y 0.025t 2 e3 (t 200)/200where:y = dioxin concentrationt = temperatureThis relationship, graphically represented in Figure 4-33, shows that dioxinformation peaks at 392 F (200 C) <strong>and</strong> decreases unsymmetrically with increasing temperature.The use <strong>of</strong> this predictive model also assumes that (1) impurities in the feedstock (including anydioxins) are carried through to the final product, based on the chemical stability <strong>and</strong> lowconcentration <strong>of</strong> dioxins formed; (2) there is a catalyst present to promote the reaction; <strong>and</strong>(3) there is no purification <strong>of</strong> the product. 954.11.2 ChlorophenolsFormation mechanisms <strong>and</strong> potential emissions <strong>of</strong> dioxins <strong>and</strong> furans for theproduction <strong>and</strong> use <strong>of</strong> chlorophenols are discussed in this subsection.4-172
Source: Reference 95.Figure 4-33. Dioxin Concentration Versus Temperature4-173
Chlorophenol UseSince the 1950s, chlorophenols have been used as herbicides, insecticides,fungicides, mold inhibitors, antiseptics, disinfectants <strong>and</strong>, most importantly, woodpreservatives.Polychlorinated phenols (PCP) are currently used in the United States as industrialwood preservatives. The principal <strong>and</strong> most effective method <strong>of</strong> application is pressure treating,which forces PCP into wood fibers. The bactericide, fungicide, <strong>and</strong> insecticide properties <strong>of</strong> PCPhelp to preserve outdoor lumber, including railroad ties, marine pilings, highway barriers, <strong>and</strong>,primarily, utility poles. All other United States uses <strong>of</strong> PCP have been discontinued. 962,4-dichlorophenol (2,4-DCP) is produced commercially for use as an intermediatein the manufacture <strong>of</strong> industrial <strong>and</strong> agricultural products. One <strong>of</strong> the primary uses <strong>of</strong> 2,4-DCPincludes feedstock for the production <strong>of</strong> 2,4-dichlorophenoxyacetic acid (2,4-D) <strong>and</strong> derivatives,which are used as pesticides, germicides, <strong>and</strong> soil sterilants. 2,4-DCP is also used in theproduction <strong>of</strong> certain methyl compounds used in mothpro<strong>of</strong>ing, antiseptics, <strong>and</strong> seed disinfectants.Furthermore, 2,4-DCP may be chlorinated with benzene sulfonyl chloride to produce miticides, orfurther chlorinated to produce PCP. 95Dioxin <strong>and</strong> Furan Contamination in the Manufacture <strong>and</strong> Use <strong>of</strong> ChlorophenolsChlorinated phenols, including DCP <strong>and</strong> PCP, are manufactured by thechlorination <strong>of</strong> the phenols using catalysts or by the alkaline hydrolysis <strong>of</strong> a chlorobenzene. Both<strong>of</strong> these reactions can produce CDD/CDF by-products that show up as contaminants incommercially produced chlorophenols <strong>and</strong> chlorophenol derivatives such as phenoxy acids.Potentially contaminated chlorophenol products <strong>and</strong> their derivatives are listed in Table 4-40.Although most <strong>of</strong> the following discussion are pertains to the formation <strong>of</strong> CDD, the reactionmechanisms for the formation <strong>of</strong> CDF the same. 944-174
TABLE 4-40. SOME COMMERCIAL CHLOROPHENOL PRODUCTS ANDDERIVATIVES THAT MAY BE CONTAMINATED WITH DIOXINS OR FURANSCommon Name Chemical Name Primary Use2,4-D (esters <strong>and</strong> salts)2,4-dichlorophenoxyacetic acid<strong>and</strong> esters <strong>and</strong> saltsPesticide2,4-DB <strong>and</strong> salts 2,4-dichlorophenoxybutyric Pesticide2,4-DP2-2,4-dichlorophenoxy propionicacidPesticidePCP <strong>and</strong> salts Pentachlorophenol <strong>and</strong> salts Wood treatmentSource: Reference 95.<strong>Dioxins</strong> may form as a contaminant in commercial products by the intermolecularcondensation <strong>of</strong> polyhalophenols to polyhalodibenzo-p-dioxins, including the condensation <strong>of</strong>phenates with various chlorine substituents. Condensation reactions <strong>of</strong> chlorophenols areinfluenced by the following factors: 95The total number <strong>of</strong> chlorine substituents, which determines the ease <strong>of</strong>chlorine removal <strong>and</strong> the ether-bond formation.In the case <strong>of</strong> solid-state reactions, the arrangement <strong>of</strong> the molecules withina crystal are influenced by the metal cation involved.Steric effects <strong>from</strong> molecular conformations that impact site-specificnucleophilic substitution.Electronic effects, which allow chlorine atoms in some positions to beremoved more readily than those in the other positions on the ring.In laboratory preparations, yields <strong>of</strong> 10-20 percent have been reported for the94,95Ullman-type self-condensation <strong>of</strong> 2,4-DCP to 2,7-dichlorodibenzo-p-dioxin. Another study onthe chemistry <strong>of</strong> chlorinated dioxins obtained 80 percent OCDD in the solid-state condensation <strong>of</strong>94,95sodium pentachlorophenate molecules. This high yield was attributed to lattice or steric4-175
effects <strong>of</strong> sodium pentachlorophenate, which open the oxygen atom to attack <strong>and</strong> thus lead todioxin formation. The same study yielded 30 percent HxCDD in the solid-state condensation <strong>of</strong>sodium 2,3,4,6-tetrachlorophenate. The lower yield <strong>and</strong> the finding <strong>of</strong> two isomers <strong>of</strong> HxCDDindicate that the tetrachlorophenate is less stereo-specific than the pentachlorophenate.CDD Formation in PCP Manufacture--PCP may be manufactured commercially bydirect chlorination <strong>of</strong> phenol or as a mixture <strong>of</strong> chlorophenols, as shown below:In one manufacturing process, phenol is chlorinated under anhydrous conditions,with aluminum chloride as the catalyst. In this process, three to four chlorine atoms are added tothe phenol. The <strong>of</strong>f-gas <strong>from</strong> the chlorinator (primarily HCl with some chlorine) is passedthrough a scrubber-reactor system containing excess phenol. The temperature is held at the pointwhere the chlorine is almost completely reacted to give the lower chlorinated phenols, which maybe either separated or fed back to the reactor for further chlorination.PCP manufacture can produce a variety <strong>of</strong> CDD via phenoxy radical reactions.Specifically, phenoxy radicals are produced <strong>from</strong> decomposition <strong>of</strong> polychlorocyclohexadienonesproduced by excess chlorination <strong>of</strong> tri-, tetra-, or PCP. The electrophilic phenoxy radical attackselectronegative sites (ortho or para positions) on a polychlorophenol molecule to formphenoxyphenols, which undergo further reactions to form CDD. In the PCP manufacturingprocess, chlorination is normally stopped when 3 to 7 percent tetrachlorophenol remains. Furtherchlorination results in increased decomposition.4-176
CDD/CDF <strong>Emissions</strong> <strong>from</strong> PCP Wood Treatment--Concentrations <strong>of</strong> CDD/CDFvary greatly over time <strong>and</strong> are a function <strong>of</strong> heat, sunlight, <strong>and</strong> co-solvents. PCP pressuretreatment <strong>of</strong> wood varies <strong>from</strong> facility to facility. However, the treatment method generallyinvolves the following steps. First, the pre-cut wood is loaded into a pressure cylinder, which isthen filled with PCP dissolved in a petroleum solvent. The cylinder is then pressurized with steamuntil the required amount <strong>of</strong> the preservative has been absorbed. The cylinder is thendepressurized <strong>and</strong> the preservative returned to storage, <strong>and</strong> the wood is placed in a vacuum toremove excess preservative. In the final step, the wood is removed <strong>from</strong> the cylinder <strong>and</strong> allowedto cool. Figure 4-34 displays a schematic <strong>of</strong> a pressure treating plant. 97Wood treatment cylinders emit PCP in the steam that is released to the atmospherewhen the cylinder is opened to remove the treated lumber. Typically, these cylinders are openedonly once a day for a period <strong>of</strong> roughly 30 minutes. Evaporative losses <strong>of</strong> PCP <strong>from</strong> the hotwood surface as well as fugitive emissions <strong>from</strong> pipes <strong>and</strong> fittings occur but are roughly twoorders <strong>of</strong> magnitude less than the losses <strong>from</strong> the pressure cylinder.<strong>Emissions</strong> data <strong>from</strong> five wood treatment facilities were used to develop a-6 972,3,7,8-TCDD TEQ emission factor <strong>of</strong> 7.06x10 lb/ton <strong>of</strong> PCP used.CDD Formation in DCP Manufacture--Commercial manufacture <strong>of</strong> DCP involves97the alkaline hydrolysis <strong>of</strong> trichlorobenzene. 1,2,4-trichlorobenzene is reacted with sodiumhydroxide in methanol at approximately 93 F (200 C) to yield the sodium salt <strong>of</strong> 2,5-, 2,4-, <strong>and</strong>3,4-DCP, followed by acidification to produce the 2,5-, 2,4-, <strong>and</strong> 3,4-DCP products.4-177
CondenserAir-VacuumPumpCylinderControl PanelPressure PumpMix TankStorage TankTransfer PumpManualAutomaticSource: Reference 96.Figure 4-34. Schematic Drawing <strong>of</strong> a Pressure Treating Plant4-178
The alkaline hydrolysis <strong>of</strong> 1,2,4-trichlorobenzene in the manufacture <strong>of</strong> PCP may95produce CDD such as 2,7-dichlorodibenzo-p-dioxin. In addition to alkaline hydrolysis <strong>of</strong>1,2,4-trichlorobenzene, the use <strong>of</strong> other chlorobenzenes in the manufacture <strong>of</strong> chlorophenols mayform CDD contaminants as shown in Table 4-41.TABLE 4-41. DIOXIN CONTAMINANTS ASSOCIATED WITH CHLOROBENZENESChlorobenzene Dioxin Contaminant1,2-Dichlorobenzene1,2,3-Trichlorobenzene1,2,4-Trichlorobenzene1,2,3,4-Tetrachlorobenzene1,2,3,5-Tetrachlorobenzene1,2,4,5-TetrachlorobenzeneDibenzo-p-dioxin1,6-Dichlorodibenzo-p-dioxin2,7-Dichlorodibenzo-p-dioxin1,2,6,7-TCDD1,3,6,8-TCDD2,3,7,8-TCDDSource: Reference 94.4.11.3 Brominated CompoundsExtensive research on CDD/CDF has produced much information on theirchemistry. However, much less is known about their brominated counterparts. On the basis<strong>of</strong> laboratory studies on the formation <strong>of</strong> polybrominated dibenzo-p-dioxins (BDD) <strong>and</strong>polybrominated dibenz<strong>of</strong>urans (BDF) <strong>from</strong> certain brominated compounds, an assumption can bemade that the mechanisms <strong>of</strong> dioxin <strong>and</strong> furan formation for brominated substances are similar to94those for chlorinated substances. Thus, bromine analogues <strong>of</strong> chlorinated compounds that havebeen associated with dioxin contamination could reasonably be expected to be associated withBDD/BDF contamination. However, unlike the high-temperature chlorination process,bromination <strong>of</strong> organic compounds is a low-temperature process. These low-temperaturebromination conditions are not as conducive to the formation <strong>of</strong> dioxins.4-179
Information on the formation <strong>of</strong> BDD/BDF provided by one study demonstratedthat they could be formed during the chemical synthesis <strong>of</strong> flame retardants such as2,4,6-tribromophenol, pentabromophenol, <strong>and</strong> tetrabromobisphenol A. Combustion <strong>of</strong> theseflame retardants also resulted in formation <strong>of</strong> BDD/BDF. High-resolution capillary column gaschromatography coupled with mass spectrometry (HRGC/MS) analysis <strong>of</strong> 2,4,6-tribromophenolindicated the presence <strong>of</strong> di- <strong>and</strong> tri-BDD, TBDD, PeBDF, HxBDF, HpBDF, <strong>and</strong> OBDF. 94Table 4-42 contains pr<strong>of</strong>iles <strong>of</strong> some industrial brominated chemicals, <strong>and</strong> includeinformation on the manufacturing process, possible contaminants, <strong>and</strong> most likely BDD/BDFisomers. The predicted number <strong>of</strong> possible BDD/BDF formation pathways are given inTable 4-43.4.12 PORTLAND CEMENT PRODUCTIONMost <strong>of</strong> the hydraulic cement produced in the United States is Portl<strong>and</strong> cement,which is a cementitious, crystalline compound composed <strong>of</strong> metallic oxides. The end-productcement, in its fused state, is referred to as "clinker." Raw materials used in the process can becalcium carbonate- <strong>and</strong> aluminum-containing limestone, iron, silicon oxides, shale, clay, <strong>and</strong>98s<strong>and</strong>. There are four primary components in Portl<strong>and</strong> cement manufacturing: raw materialsh<strong>and</strong>ling, kiln feed preparation, pyroprocessing, <strong>and</strong> finished cement grinding. Pyroprocessing,the fuel intensive process accomplished in cement kilns, has been identified as a potential source<strong>of</strong> CDD/CDF emissions <strong>and</strong> constitutes the primary focus <strong>of</strong> this chapter.4.12.1 Process DescriptionIn Portl<strong>and</strong> cement production, most raw materials typically are quarried on site<strong>and</strong> transferred by conveyor to crushers <strong>and</strong> raw mills. After the raw materials are reduced to thedesired particle size, they are blended <strong>and</strong> fed to a large rotary kiln. The feed enters the kiln at theelevated end, <strong>and</strong> the burner is located at the opposite end. The raw materials are then changedinto cementitious oxides <strong>of</strong> metal by a countercurrent heat exchange process. The materials are4-180
TABLE 4-42. INDUSTRIAL BROMINATED COMPOUNDSCompound Manufacturing Process Possible Contaminants Most Likely BDD/BDF Isomers4-1812,4-Dibromophenol Bromination <strong>of</strong> phenol in water or another polar 2,4,6-Tribromophenol; 2,7-Dibromodibenzo-p-dioxin.hydroxylic solvent.2,4,5-tribromophenol; <strong>and</strong>possibly tetrabromophenol<strong>and</strong> pentabromophenol.2,4,6-Tribromophenol Bromination <strong>of</strong> phenol in the presence <strong>of</strong> water 2,4,5-Tribromophenol; 2,4,7,9-Tetrabromodibenzo-p-dioxin.or other polar hydroxylic solvent; reaction is tetrabromophenols.uncatalyzed.Bromophenols (o-,m-, <strong>and</strong> Bromination <strong>of</strong> phenol in water or another Phenol, dibromophenol. Unfavorable kinetics <strong>and</strong> thermodynamicp-isomers) hydroxylic solvent. conditions. Low probability <strong>of</strong> BDDs <strong>and</strong>/orBDFs formation. Possiblemono/dibromdibenzodioxin isomer.2,6-Dibromo-4-nitrophenol Bromination <strong>of</strong> p-nitrophenol with excess Br 2; 2,5-Dibromo-4-nitrophenol. None, due to steric hindrance <strong>and</strong> othercatalyst is probably not necessary.effects <strong>from</strong> NO 2 groups on aromatic ring.Decabromodiphenyloxide Perbromination <strong>of</strong> diphenyloxide with at least Diphenyloxide with varying Octabromodibenz<strong>of</strong>uran.150 percent excess Br 2 in the presence <strong>of</strong> AlBr3degrees <strong>of</strong> bromination.at 95 F (35 C), followed by an increase intemperature to around 140 F (60 C).Octabromodiphenyloxide Bromination <strong>of</strong> benzene with Br 2 <strong>and</strong> FeCl 3 as Varying degrees <strong>of</strong> Depends on the particular bromobenzene.catalyst 176 to 212 F (80 to 100 C).brominated benzene.Pentabromotoluene Perbromination at room temperature in presence Varying brominated toluenes. BDDs <strong>and</strong> BDFs could be formed under<strong>of</strong> catalyst (U.S. Patent No. 4287373, Greatcombustion conditions similar to that <strong>of</strong> theLakes Chemical Corporation, 1981).chlorinated benzenes in PCBs transformers.The specific isomers depends on thecondensation <strong>of</strong> the particular brominatedtoluenes, several dimethyl polybrominateddioxins <strong>and</strong> furans are possible.
TABLE 4-42. INDUSTRIAL BROMINATED COMPOUNDS (CONTINUED)Compound Manufacturing Process Possible Contaminants Most Likely BDD/BDF Isomers4-182Tetrabromophthalic U.S. Patent No. 3382254, Chemische Fabrik Phthalic anhydride with None.Anhydride Kalk GMBH DE, 1968: phthalic anhydride, in varying degrees <strong>of</strong>50-80 percent oleum, is brominated using bromination.halogenation catalyst at 176 to 194 F (80 to90 C); then, temperature is raised to about221 F (100 to 110 C) at end <strong>of</strong> Br 2 addition;then, heat to 248 to 302 F (120 to 150 C) toget rid <strong>of</strong> excess SO 3 <strong>and</strong> Br reactants.1,2,4-Tribromobenzene By-product <strong>from</strong> the preparation <strong>of</strong> See bromobenzene <strong>and</strong> See bromophenols <strong>and</strong> pentabromotoluene.1,3,5-tribromobenzene.pentabromotoluene.1,3,5-Tribromobenzene Bromination <strong>of</strong> benzene with Br 2 using AlBr 3 as See 1,2,4-tribromobenzene. See 1,2,4-tribromobenzene.catalyst; since 1,3,5-isomer is most stable, willtend toward this configuration (yield1,3,5-isomer 50 percent).Tetrabromobisphenol A Bromination <strong>of</strong> bisphenol A in organic solvent Brominated phenols. Octabromodibenzo-p-dioxin.with Br 2 at 68 to 104 F (20 to 40 C) <strong>and</strong> thenincreasing incubation temperature to 149 to158 F (65 to 70 C).Source: Reference 94.
TABLE 4-43. BROMINATED COMPOUNDS WITH THE POTENTIALFOR BDD/BDF FORMATIONChemical Name2,4-Dibromophenol 52,4,6-Tribromophenol 2o-, m-, <strong>and</strong> p-Bromophenol 22,6-Dibromo-4-nitrophenol 1Decabromodiphenyloxide 1Octabromodiphenyloxide 1Predicted Number <strong>of</strong> Possible BDD/BDFFormation PathwaysBromobenzene (mono- <strong>and</strong> di-) 0 aPentabromotolueneTetrabromophthalic anhydride 01,2,4-Tribromobenzene1,3,5-TribromobenzenePentabromodiphenyloxide 1Tetrabromobisphenol A 1Source: Reference 94.0b0a,b0a,babUnder combustion conditions, brominated benzenes could condense to BDD <strong>and</strong> BDF similar to chlorinatedbenzenes.BDD <strong>and</strong> BDF could be formed under combustion conditions similar to those <strong>of</strong> chlorinated benzenes in PCBtransformers.4-183
continuously <strong>and</strong> slowly moved to the low end by the rotation <strong>of</strong> the kiln while being heated tohigh temperatures (2,700 F [1,482 C]) by direct firing. In this stage, chemical reactions occur,<strong>and</strong> a rock-like substance called "clinker" is formed. This clinker is then cooled, crushed, <strong>and</strong>98blended with gypsum to produce Portl<strong>and</strong> cement. The cement is then either bagged orbulk-loaded <strong>and</strong> transported out. 98Cement may be made via a wet or a dry process. Many older kilns use the wetprocess. In the past, wet grinding <strong>and</strong> mixing technologies provided more uniform <strong>and</strong> consistentmaterial mixing, resulting in a higher quality clinker. Dry process technologies have improved,100however, to the point that all <strong>of</strong> the new kilns since 1975 use the dry process. In the wetprocess, water is added to the mill while the raw materials are being ground. The resulting slurryis fed to the kiln. In the dry process, raw materials are also ground finely in a mill, but no water isadded <strong>and</strong> the feed enters the kiln in a dry state.More fuel is required for the wet process then the dry process to evaporate thewater <strong>from</strong> the feed. However, for either the wet or dry process, Portl<strong>and</strong> cement production isfuel-intensive. The primary fuel burned in the kiln may be natural gas, oil, or coal. Many cementplants burn supplemental fuels such as waste solvents, chipped rubber, shredded municipal98garbage, <strong>and</strong> coke. A major trend in the industry is the increased use <strong>of</strong> waste fuels. In 1989,33 plants in the United States <strong>and</strong> Canada reported using waste fuels; the number increased to55 plants in 1990. 98The increased use <strong>of</strong> hazardous waste-derived fuels (HWDFs) for the kilns isattributed to lower cost <strong>and</strong> increased availability. As waste generators reduce or eliminatesolvents <strong>from</strong> their waste steams, the streams contain more sludge <strong>and</strong> solids. As a result, twonew hazardous waste fueling methods have emerged at cement kilns. The first method pumpssolids (either slurried with liquids or dried <strong>and</strong> ground) into the hot end <strong>of</strong> the kiln. The secondmethod (patented by cement kiln processor <strong>and</strong> fuel blender Cadence, Inc.) introduces containers<strong>of</strong> solid waste into the calcining zone <strong>of</strong> the kiln. 1004-184
The kiln system for the manufacture <strong>of</strong> Portl<strong>and</strong> cement by dry process withpreheater is shown in Figure 4-35. The raw material enters a four-stage suspension preheater,where hot gases <strong>from</strong> the kiln heat the raw feed <strong>and</strong> provide about 40-percent calcination beforethe feed enters the kiln. Some installations include a precalcining furnace, which provides about85-percent calcination before the feed enters the kiln. 98Facilities that burn HWDF are subject to the Boilers <strong>and</strong> Industrial Furnaces (BIF)rule under the Resource Conservation <strong>and</strong> Recovery Act (RCRA) promulgated February 21,1991. The BIF rule requires that a facility that burns hazardous waste demonstrate a 99.99percent destruction efficiency for principal organic hazardous constituents in the waste stream.To guard against products <strong>of</strong> incomplete combustion, the BIF rule limits CO levels in the kiln <strong>and</strong>100,101or total hydrocarbon levels in stack gases. In addition, a NESHAP for control <strong>of</strong> HAPs <strong>from</strong>Portl<strong>and</strong> cement kilns is under development by the Emission St<strong>and</strong>ards Division <strong>of</strong> OAQPS.4.12.2 Emission Control TechniquesFuel combustion at Portl<strong>and</strong> cement plants can emit a wide range <strong>of</strong> pollutants insmall quantities. If the combustion reactions do not reach completion, CO <strong>and</strong> VOCs can beemitted. When waste fuels are burned, incomplete combustion can lead to emissions <strong>of</strong> specificHAPs, such as CDD/CDF. These pollutants are generally emitted at low levels.In the pyroprocessing units, control devices employed are fabric filters (reverse air,pulse jet, or pulse plenum) <strong>and</strong> ESPs. Typical control measures for the kiln exhaust are reverse2air fabric filters with an air-to-cloth ratio <strong>of</strong> 0.41:1 meter per minute (m/min) (1.5:1 acfm/ft ) <strong>and</strong>ESPs with a net specific collecting area (SCA) <strong>of</strong> 1,140 to 1,620 square meters per thous<strong>and</strong> m 32 3 3 2 3(m /1,100 m ) (350 to 500 square feet per thous<strong>and</strong> ft [ft /1,000 ft ]). Clinker cooler systems arecontrolled most frequently with pulse jet or pulse plenum fabric filters. The potential forsecondary CDD/CDF formation exists within the ESP. CDD/CDF formation can occur in the4-185
AHot Gases toRoller MillBRaw Material FeedRoller Mill14-186DustCollector23FuelToGrindingMillFanDustBinRotating KilnAirClinkerCoolerClinker StorageSource: Reference 98.Figure 4-35. Process Diagram <strong>of</strong> Portl<strong>and</strong> Cement Manufacturing by Dry Process with Preheater
presence <strong>of</strong> excess oxygen over a wide range <strong>of</strong> temperatures. Refer to Section 4.1.1 for adetailed discussion.4.12.3 Emission FactorsThe raw materials used by some facilities may contain organic compounds, whichconstitute a precursor to potential CDD/CDF formation during the heating step. However, fuelcombustion to heat the kiln is believed to be the greater source <strong>of</strong> CDD/CDF emissions. The datacollected <strong>and</strong> presented in this section indicate that CDD/CDF are emitted when either fossil fuels,HWDFs, or combinations <strong>of</strong> the two are combusted in the kiln. 98,101CDD/CDF emissions data for Portl<strong>and</strong> cement kilns with various process, fuel, <strong>and</strong>101control configurations were compiled by the U.S. EPA's Office <strong>of</strong> Solid Waste in 1994. Testingwas conducted at 35 Portl<strong>and</strong> cement manufacturing facilities to certify compliance with the BIFRule. Emission factors developed <strong>from</strong> the study are presented in Tables 4-44 <strong>and</strong> 4-45.It should be noted that Table 4-44 presents emission factors for kilns that burnhazardous waste (HW) <strong>and</strong> also kilns that do not burn hazardous waste (NHW). In addition, thisdocument presents separate emissions estimates for HW <strong>and</strong> NHW kilns.4.12.4 Source LocationsThe Portl<strong>and</strong> cement manufacturing industry is dispersed geographicallythroughout the United States. Thirty-six states have at least one facility. As <strong>of</strong> December 1990,there were 112 operating Portl<strong>and</strong> cement plants in the United States, operating 213 kilns with atotal annual clinker capacity <strong>of</strong> approximately 80 million tons (73.7 million Mg). The kiln98population included 80 wet process kilns <strong>and</strong> 133 dry process kilns. Table 4-46 presents thenumber <strong>of</strong> Portl<strong>and</strong> cement plants <strong>and</strong> kilns in the United States by State <strong>and</strong> the associatedproduction capacities as <strong>of</strong> December 1990.4-187
TABLE 4-44. CDD/CDF EMISSION FACTORS FOR DRY PROCESS PORTLANDCEMENT KILNSSCC 3-05-006-06FACTOR QUALITY RATING: DFuel Type Control Device PollutantAverage EmissionFactor in lb/ton(kg/Mg) aNatural Gas Electrostatic Precipitator b -10 -112,3,7,8-TCDD 1.20x10 (6.00x10 )-9 -9Total TCDD 4.93x10 (2.47x10 )-9 -10Total PeCDD 1.12x10 (5.60x10 )-10 -10Total HxCDD 4.73x10 (2.37x10 )-10 -10Total HpCDD 3.07x10 (1.54x10 )-9 -10Total OCDD 1.98x10 (9.90x10 )-9 -9Total CDD 8.81x10 (4.41x10 )-9 -92,3,7,8-TCDF 2.98x10 (1.49x10 )-8 -8Total TCDF 2.24x10 (1.12x10 )-9 -9Total PeCDF 4.29x10 (2.15x10 )-10 -10Total HxCDF 5.47x10 (2.74x10 )-11 -11Total HpCDF 3.55x10 (1.78x10 )-11 -11Total OCDF 6.62x10 (3.31x10 )-8 -8Total CDF 2.72x10 (1.36x10 )Coal/Coke Electrostatic Precipitator b -11 -112,3,7,8-TCDD 5.72x10 (2.86x10 )-7 -8Total TCDD 1.73x10 (8.65x10 )-9 -9Total PeCDD 2.62x10 (1.31x10 )-9 -9Total HxCDD 2.53x10 (1.27x10 )-9 -10Total HpCDD 1.61x10 (8.05x10 )-9 -10Total OCDD 1.42x10 (7.10x10 )-8 -9Total CDD 1.01x10 (5.05x10 )-9 -92,3,7,8-TCDF 4.48x10 (2.24x10 )-8 -8Total TCDF 2.43x10 (1.22x10 )4-188
TABLE 4-44. CDD/CDF EMISSION FACTORS FOR DRY PROCESS PORTLANDCEMENT KILNS (CONTINUED)Fuel Type Control Device PollutantAverage EmissionFactor in lb/ton(kg/Mg) aCoal/Coke, continuedElectrostatic Precipitator, bcontinued-8 -9Total PeCDF 1.20x10 (6.00x10 )-9 -9Total HxCDF 7.79x10 (3.90x10 )-9 -9Total HpCDF 2.12x10 (1.06x10 )-10 -10Total OCDF 2.86x10 (1.43x10 )-8 -8Total CDF 4.64x10 (2.32x10 )Coal Electrostatic Precipitator c -8 -82,3,7,8-TCDD 5.14x10 (2.57x10 )-6 -6Total TCDD 2.54x10 (1.27x10 )-6 -6Total PeCDD 2.67x10 (1.34x10 )-6 -6Total HxCDD 2.73x10 (1.37x10 )-7 -7Total HpCDD 5.42x10 (2.71x10 )-8 -8Total OCDD 8.87x10 (4.44x10 )-6 -6Total CDD 8.62x10 (4.31x10 )-7 -72,3,7,8-TCDF 3.30x10 (1.65x10 )-6 -6Total TCDF 8.45x10 (4.23x10 )-6 -6Total PeCDF 4.53x10 (2.27x10 )-6 -7Total HxCDF 1.71x10 (8.55x10 )-7 -7Total HpCDF 3.15x10 (1.58x10 )-8 -8Total OCDF 5.08x10 (2.54x10 )-5 -6Total CDF 1.54x10 (7.69x10 )Coke/HazardousWasteElectrostatic Precipitator d -8 -82,3,7,8-TCDD 3.42x10 (1.71x10 )-7 -7Total TCDD 5.86x10 (2.93x10 )-7 -7Total PeCDD 4.67x10 (2.34x10 )-7 -7Total HxCDD 4.59x10 (2.30x10 )-8 -8Total HpCDD 5.45x10 (2.73x10 )-8 -9Total OCDD 1.88x10 (9.40x10 )-6 -7Total CDD 1.62x10 (8.10x10 )4-189
TABLE 4-44. CDD/CDF EMISSION FACTORS FOR DRY PROCESS PORTLANDCEMENT KILNS (CONTINUED)Fuel Type Control Device PollutantAverage EmissionFactor in lb/ton(kg/Mg) aCoke/HazardousWaste, continuedElectrostatic Precipitator, dcontinued-7 -72,3,7,8-TCDF 2.07x10 (1.04x10 )-6 -6Total TCDF 5.18x10 (2.59x10 )-7 -7Total PeCDF 9.95x10 (4.98x10 )-7 -7Total HxCDF 5.70x10 (2.85x10 )-8 -8Total HpCDF 2.28x10 (1.14x10 )-9 -9Total OCDF 7.74x10 (3.87x10 )-6 -6Total CDF 6.98x10 (3.49x10 )Coke Multicyclone/Fabric Filter e -11 -122,3,7,8-TCDD 1.19x10 (5.95x10 )Source: Reference 101.-9 -9Total TCDD 2.47x10 (1.24x10 )-9 -9Total PeCDD 3.28x10 (1.64x10 )-9 -9Total HxCDD 7.67x10 (3.84x10 )-10 -10Total HpCDD 8.52x10 (4.26x10 )-8 -9Total OCDD 1.88x10 (9.40x10 )-8 -8Total CDD 3.31x10 (1.65x10 )-10 -102,3,7,8-TCDF 5.83x10 (2.92x10 )-9 -9Total TCDF 3.80x10 (1.90x10 )-10 -10Total PeCDF 7.84x10 (3.92x10 )-10 -10Total HxCDF 2.25x10 (1.13x10 )-11 -11Total HpCDF 4.68x10 (2.34x10 )-10 -10Total OCDF 2.81x10 (1.41x10 )-9 -9Total CDF 5.72x10 (2.86x10 )abcdeEmission factors in lb (kg) <strong>of</strong> pollutant emitted per ton (Mg) <strong>of</strong> clinker produced.Kiln operating conditions: high combustion temperature; minimum electrostatic precipitator power.Kiln operating conditions: maximum feed, kilns 1 <strong>and</strong> 2.Kiln operating conditions: maximum hazardous waste feed.Kiln operating conditions: high combustion temperature; maximum production.4-190
TABLE 4-45. CDD/CDF EMISSION FACTORS FOR WET PROCESSPORTLAND CEMENT KILNSSCC 3-05-007-06FACTOR QUALITY RATING: DFuel Type Control Device PollutantAverage EmissionFactor in lb/ton(kg/Mg) aCoal Electrostatic Precipitator b -9 -92,3,7,8-TCDD 6.41x10 (3.21x10 )-7 -7Total TCDD 4.74x10 (2.37x10 )-7 -7Total PeCDD 6.63x10 (3.32x10 )-7 -7Total HxCDD 6.52x10 (3.26x10 )-7 -8Total HpCDD 1.02x10 (5.10x10 )-7 -7Total OCDD 2.21x10 (1.11x10 )-6 -6Total CDD 2.12x10 (1.06x10 )-8 -82,3,7,8-TCDF 3.73x10 (1.87x10 )-7 -8Total TCDF 1.77x10 (8.85x10 )-8 -8Total PeCDF 9.52x10 (4.76x10 )-7 -8Total HxCDF 1.21x10 (6.05x10 )-8 -8Total HpCDF 2.90x10 (1.45x10 )-9 -9Total OCDF 7.92x10 (3.96x10 )-7 -7Total CDF 4.67x10 (2.34x10 )Coal/Coke Electrostatic Precipitator b -10 -102,3,7,8-TCDD 2.65x10 (1.33x10 )-7 -8Total TCDD 1.13x10 (5.65x10 )-7 -8Total PeCDD 1.61x10 (8.05x10 )-7 -7Total HxCDD 2.77x10 (1.39x10 )-8 -8Total HpCDD 3.50x10 (1.75x10 )-8 -9Total OCDD 1.02x10 (5.10x10 )-7 -7Total CDD 5.96x10 (2.98x10 )-8 -92,3,7,8-TCDF 1.55x10 (7.75x10 )-8 -8Total TCDF 8.07x10 (4.04x10 )-8 -8Total PeCDF 3.37x10 (1.69x10 )4-191
TABLE 4-45. CDD/CDF EMISSION FACTORS FOR WET PROCESSPORTLAND CEMENT KILNS (CONTINUED)Fuel Type Control Device PollutantAverage EmissionFactor in lb/ton(kg/Mg) aCoal/Coke,continuedElectrostaticbPrecipitator, continued-8 -9Total HxCDF 1.03x10 (5.15x10 )-9 -9Total HpCDF 2.27x10 (1.14x10 )-10 -10Total OCDF 2.42x10 (1.21x10 )-7 -8Total CDF 1.27x10 (6.35x10 )Source: Reference 101.Electrostatic Precipitator b -10 -102,3,7,8-TCDD 4.17x10 (2.09x10 )-7 -7Total TCDD 2.08x10 (1.04x10 )-7 -7Total PeCDD 2.96x10 (1.48x10 )-7 -7Total HxCDD 8.51x10 (4.26x10 )-7 -8Total HpCDD 1.02x10 (5.10x10 )-8 -8Total OCDD 2.54x10 (1.27x10 )-6 -7Total CDD 1.48x10 (7.41x10 )-8 -82,3,7,8-TCDF 2.54x10 (1.27x10 )-7 -8Total TCDF 1.34x10 (6.70x10 )-8 -8Total PeCDF 5.00x10 (2.50x10 )-8 -8Total HxCDF 2.31x10 (1.16x10 )-9 -9Total HpCDF 8.71x10 (4.36x10 )-9 -9Total OCDF 4.30x10 (2.15x10 )-7 -7Total CDF 2.46x10 (1.23x10 )a Emission factors in lb (kg) <strong>of</strong> pollutant emitted per ton (Mg) <strong>of</strong> clinker produced.b Kiln operating conditions: high combustion temperature; minimum electrostatic precipitator power.4-192
TABLE 4-46. SUMMARY OF PORTLAND CEMENTPLANT CAPACITY INFORMATIONLocationNumber <strong>of</strong> Plants(kilns)Capacity3 310 tons/yr (10 Mg/yr)Alabama 5 (6) 4,260 (3,873)Alaska 1 (0) a 0 (0)Arizona 2 (7) 1,770 (1,609)Arkansas 2 (5) 1,314 (1,195)California 12 (20) 10,392 (9,447)Colorado 3 (5) 1,804 (1,640)Florida 6 (8) 3,363 (3,057)Georgia 2 (4) 1,378 (1,253)Hawaii 1 (1) 263 (239)Idaho 1 (2) 210 (191)Illinois 4 (8) 2,585 (2,350)Indiana 4 (8) 2,830 (2,573)Iowa 4 (7) 2,806 (2,551)Kansas 4 (11) 1,888 (1,716)Kentucky 1 (1) 724 (658)Maine 1 (1) 455 (414)Maryl<strong>and</strong> 3 (7) 1,860 (1,691)Michigan 5 (9) 4,898 (4,453)Mississippi 1 (1) 504 (458)Missouri 5 (7) 4,677 (4,252)Montana 2 (2) 592 (538)Nebraska 1 (2) 961 (874)Nevada 1 (2) 415 (377)New Mexico 1 (2) 494 (449)New York 4 (5) 3,097 (2,815)Ohio 4 (5) 1,703 (1,548)4-193
TABLE 4-46. SUMMARY OF PORTLAND CEMENTPLANT CAPACITY INFORMATION (CONTINUED)LocationNumber <strong>of</strong> Plants(kilns)Capacity3 310 tons/yr (10 Mg/yr)Oklahoma 3 (7) 1,887 (1,715)Oregon 1 (1) 480 (436)Pennsylvania 11 (24) 6,643 (6,039)South Carolina 3 (7) 2,579 (2,345)South Dakota 1 (3) 766 (696)Tennessee 2 (3) 1,050 (955)Texas 12 (20) 8,587 (7,806)Utah 2 (3) 928 (844)Virginia 1 (5) 1,117 (1,015)Washington 1 (1) 473 (430)West Virginia 1 (3) 822 (747)Wyoming 1 (1) 461 (419)Source: Reference 98.a Grinding plant only.4-194
SECTION 5.0SOURCE TEST PROCEDURESSeveral sampling <strong>and</strong> analysis techniques have been employed for determiningCDD <strong>and</strong> CDF emissions. Measurement <strong>of</strong> CDD <strong>and</strong> CDF involves three steps: (1) samplecollection; (2) sample recovery <strong>and</strong> preparation; <strong>and</strong> (3) quantitative analysis. This section brieflydescribes general methodologies associated with each <strong>of</strong> these steps. The purpose <strong>of</strong> this sectionis to present basic sampling <strong>and</strong> analysis principles used to gather emissions data on CDD <strong>and</strong>CDF <strong>from</strong> stationary sources. The presentation <strong>of</strong> non-EPA methods in this report does notconstitute endorsement or recommendation or signify that their contents necessarily reflect EPA'sviews <strong>and</strong> policies.5.1 SAMPLE COLLECTIONCollection <strong>of</strong> CDD <strong>and</strong> CDF <strong>from</strong> stationary sources is achieved by using asampling system that captures both particulate <strong>and</strong> condensibles. The most prevalent method isEPA Method 0010, also referred to as the Modified Method 5 (MM5) Sampling Train, which isequipped with a sorbent resin for collecting condensibles. A schematic <strong>of</strong> the MM5 samplingtrain used for collecting CDD <strong>and</strong> CDF is shown in Figure 5-1.The Source Assessment Sampling System (SASS), a high-volume variation <strong>of</strong>MM5 capable <strong>of</strong> sampling particulate <strong>and</strong> vapor emissions <strong>from</strong> stationary sources has also been102,103used. A schematic <strong>of</strong> the SASS train is shown in Figure 5-2.5-1
5-2Figure 5-1. Modified Method 5 Sampling Train ConfigurationSource: References 102,103.
Source: References 102,103.Figure 5-2. Schematic <strong>of</strong> a SASS Train5-3
The general characteristics <strong>of</strong> the SASS <strong>and</strong> MM5 trains are compared inTable 5-1. The major differences between the two methods are in the sampling rate <strong>and</strong> volume<strong>of</strong> gas collected. The smaller gas volume used in the MM5 train (about 10 times smaller than the®SASS train) requires less XAD-2 resin. Also, in a SASS train, the filter is normally held at ahigher temperature than in the MM5 train. 102,103TABLE 5-1. COMPARISON OF MM5 AND SASS CHARACTERISTICSCharacteristics MM5 SASSInert materials <strong>of</strong> construction Yes NoPercent isokineticity achievable 90 - 110 70 - 150 aTypically used to traverse Yes NoParticle sizing <strong>of</strong> sample No YesSample size over a 4-6 hour period (dscm) 3 30Sampling flow rate (dscmm) 0.02 - 0.03 0.09 - 0.14Source: References 103aAssuming reasonably uniform, non-stratified flow.®In the MM5 sampling train, a water-cooled condenser <strong>and</strong> XAD-2 resin cartridge®are placed immediately before the impinger section. XAD-2 is designed to adsorb a broad range<strong>of</strong> volatile organic species. The gas stream leaving the filter is cooled <strong>and</strong> conditioned in the®condenser prior to entering the sorbent trap, which contains the XAD-2 resin. From the sorbenttrap, the sample gas is routed through impingers, a pump, <strong>and</strong> a dry gas meter. The MM5 train isdesigned to operate at flow rates <strong>of</strong> approximately 0.015 dry st<strong>and</strong>ard cubic meters per minute(dscmm) or, equivalently, 0.5 dry st<strong>and</strong>ard cubic feet per minute (dscfm) over a 4-hour samplingperiod. Sample volumes <strong>of</strong> 3 dscm (100 dscf) are typical. 1035-4
An advantage <strong>of</strong> using the MM5 train is that it is constructed <strong>of</strong> inert materials. Adisadvantage is that long sampling periods (2 hours) are required to collect sufficient sample forquantitative analysis.The SASS train is a multi-component sampling system designed for collectingparticulates, volatile organics, <strong>and</strong> trace metals. The train contains three heated cyclones <strong>and</strong> aheated filter that allow size fractionation <strong>of</strong> the particulate sample. Volatile organic material is®collected in a sorbent trap containing XAD-2 resin. Volatile inorganic species are collected in aseries <strong>of</strong> impingers before the sample gas exits the system through a pump <strong>and</strong> a dry gas meter.Large sample volumes are required to ensure adequate recovery <strong>of</strong> sample fractions. The systemis designed to operate at a flow rate <strong>of</strong> 0.113 scmm (4.0 scfm), with typical sample volumes <strong>of</strong>30 dscm (1,000 dscf). 102An advantage <strong>of</strong> the SASS train is that a large quantity <strong>of</strong> sample is collected. Adisadvantage is that the system does not have the ability to traverse the stack. Also, becauseconstant flow is required to ensure proper size fractionation, the SASS train is less amenable tocompliance determinations because isokinetic conditions are not achieved. Another disadvantageis the potential <strong>of</strong> corrosion <strong>of</strong> the stainless steel components <strong>of</strong> the SASS train by acidic stackgases. 11Other methods that have been used to collect <strong>and</strong> determine concentrations <strong>of</strong>104CDD <strong>and</strong> CDF <strong>from</strong> stationary sources are EPA Reference Method 23, California Air105Resources Board (CARB) Method 428, <strong>and</strong> a draft ASME (American Society <strong>of</strong> MechanicalEngineers) protocol that was distributed in December 1984. 106EPA Reference Method 23 is a combined sampling <strong>and</strong> analytical method that usesa sampling train identical to the one described in EPA Method 5, with the exceptions <strong>and</strong>modifications specified in the method. 1045-5
CARB Method 428 is another combined sampling <strong>and</strong> analytical method. WithMethod 428, particulate <strong>and</strong> gaseous phase CDD <strong>and</strong> CDF are extracted isokinetically <strong>from</strong> a®stack <strong>and</strong> collected on a filter, on XAD-2 resin, in impingers, or in upstream sampling traincomponents. The sampling train in Method 428 is similar to the train in EPA Method 23 exceptthat the CARB Method 428 train includes one impinger containing either water or ethylene glycol<strong>and</strong> the EPA Method 23 train includes two impingers containing water.The draft ASME protocol assumes that all <strong>of</strong> the compounds <strong>of</strong> interest are®collected either on XAD-2 resin or in upstream sampling train (MM5) components. Theminimum detectable stack gas concentration should generally be in the nanogram/cubic meter3(ng/m ) or lower range.5.2 SAMPLE RECOVERY AND PREPARATIONQuantitative recovery <strong>of</strong> CDD <strong>and</strong> CDF requires the separation <strong>of</strong> thesecompounds <strong>from</strong> the remainder <strong>of</strong> the collected material, as well as efficient removal <strong>from</strong> thecollection media. A technique commonly used for recovery <strong>of</strong> CDD <strong>and</strong> CDF <strong>from</strong> filters, <strong>and</strong>adsorbent <strong>and</strong> liquid media is soxhlet extraction.Most recovery methods entail (1) the addition <strong>of</strong> isotopically labeled internalst<strong>and</strong>ards <strong>and</strong>/or surrogate compounds, (2) concentration <strong>of</strong> the sample volume to 1-5 mL or less,(3) sample cleanup involving a multi-column procedure, <strong>and</strong> (4) concentration <strong>of</strong> the sample tothe final desired volume.EPA Method 23, CARB Method 428, <strong>and</strong> the draft ASME protocol employsoxhlet extraction for the extraction <strong>of</strong> CDD <strong>and</strong> CDF <strong>from</strong> both filter <strong>and</strong> sorbent catches. Theprimary difference among these methods is in the recovery solvents used.5-6
EPA Method 23 sample recovery solvent for rinsing the sample train glassware isacetone, with a final quality assurance rinse <strong>of</strong> toluene; however, the results <strong>from</strong> the toluene rinseare not used in calculating total CDD <strong>and</strong> CDF emissions. Toluene is used for soxhlet extraction.The columns used for sample cleanup include silica gel, modified silica gel, basic alumina, <strong>and</strong>carbon/celite.In CARB 428, sample recovery solvents for rinsing the sample train glasswareinclude methanol, benzene, methylene chloride <strong>and</strong> distilled deionized water. The filter <strong>and</strong>sorbent catches are dried with sodium sulfate (NA SO ) prior to soxhlet extraction with benzene2 4or toluene. A minimum two-column cleanup system (silica gel/alumina) is required. A thirdcolumn, the carbon/celite cleanup procedure, may be necessary.The draft ASME protocol specifies the use <strong>of</strong> acetone followed by hexane assample recovery solvents <strong>and</strong> toluene as the soxhlet extraction solvent. Silica <strong>and</strong> alumina columncleanup procedures are the minimum requirement, with cleanup on carbon/celite <strong>and</strong> silica/diolcolumns if necessary.EPA Reference Methods 8280 <strong>and</strong> 8290 are analytical methods used to determineTCDD/TCDF through OCDD/OCDF in chemical wastes, including still bottoms, fuel oils,sludges, fly ash, reactor residues, soil, <strong>and</strong> water. Both methods involve the addition <strong>of</strong> internalst<strong>and</strong>ards to the sample prior to a matrix-specific extraction procedure as specified in the method.The extracts are submitted to an acid-base washing treatment <strong>and</strong> dried. Following a solventexchange step, the residue is cleaned up by column chromatography on neutral alumina <strong>and</strong>102,105carbon on celite.13 37EPA Method 8280 employs seven C labeled st<strong>and</strong>ards <strong>and</strong> one Cl labeledst<strong>and</strong>ard. Two are used as recovery st<strong>and</strong>ards, five are used as internal st<strong>and</strong>ards, <strong>and</strong> one is usedas a cleanup st<strong>and</strong>ard. There are no labeled st<strong>and</strong>ards for the PeCDD/PeCDF homologues, theHxCDF homologues, <strong>and</strong> the HpCDD homologues. This means that for these CDD/CDF5-7
107homologues, the efficiency <strong>of</strong> the extraction <strong>and</strong> cleanup procedures cannot be measured. Themethod does not include the use <strong>of</strong> surrogate st<strong>and</strong>ards, which are normally added to theadsorbent trap, because Method 8280 is only an analytical method.13EPA Method 8290 employs eleven C labeled st<strong>and</strong>ards. Two are used asrecovery st<strong>and</strong>ards <strong>and</strong> nine are used as internal st<strong>and</strong>ards. TCDD/TCDF throughHpCDD/HpCDF <strong>and</strong> OCDD are represented by the internal st<strong>and</strong>ards. This use <strong>of</strong> st<strong>and</strong>ardsallows for monitoring <strong>of</strong> all but OCDF for extraction <strong>and</strong> cleanup recoveries. 106,1075.3 QUANTITATIVE ANALYSISThe analytical techniques employed to identify <strong>and</strong> quantify CDD/CDF inenvironmental samples include high-resolution capillary column gas chromatography coupled withlow-resolution mass spectrometry (HRGC/LRMS) or high-resolution mass spectrometry(HRGC/HRMS). EPA Method 8280 <strong>and</strong> the draft ASME protocol use HRGC/LRMS; EPAMethod 23 <strong>and</strong> EPA Reference Method 8290 use HRGC/HRMS. Either technique can be used inCARB 428.Separation <strong>of</strong> isomers or series <strong>of</strong> isomers is accomplished by HRGC, <strong>and</strong>quantification is accomplished by operating the mass spectrometer in the selected ion monitoring(SIM) mode. A high-resolution fused silica capillary column (60 m DB-5) is used to resolve asmany CDD/CDF isomers as possible; however, no single column is known to resolve all isomers.Identification is based on gas chromatograph retention time <strong>and</strong> correct chlorineisotope ratio. Strict identification criteria for CDD/CDF are listed in each individual method.Quantification generally involves relative response factors determined <strong>from</strong> multi-level calibrationst<strong>and</strong>ards. An initial calibration curve is required prior to the analysis <strong>of</strong> any sample <strong>and</strong> thenintermittent calibrations (i.e., analysis <strong>of</strong> a column performance-check solution <strong>and</strong> a mid-rangeconcentration solution) are performed throughout sample analyses.5-8
In the draft ASME protocol, two different columns are required if data on both2,3,7,8-TCDD <strong>and</strong> 2,3,7,8-TCDF, as well as on total CDD/CDF by chlorinated class, are desired.The appropriate columns are a fused silica capillary column (60 m DB-5) <strong>and</strong> a 30 mcapillary (DB-225). The DB-5 column is used to separate several groups <strong>of</strong> TCDD/TCDFthrough OCDD/OCDF. Although this column does not resolve all <strong>of</strong> the isomers within eachchlorinated group, it effectively resolves each <strong>of</strong> the chlorinated groups <strong>from</strong> all <strong>of</strong> the otherchlorinated groups, thereby providing data on the total concentration <strong>of</strong> each group (that is, totalTCDD/TCDF through OCDD/OCDF). The DB-225 column is used to quantify 2,3,7,8-TCDFbecause it adequately resolves this isomer <strong>from</strong> the other TCDF isomers. 106The capillary gas chromatographic columns recommended in CARB Method 428<strong>and</strong> EPA Method 23 include the 60 m DB-5 or the SP-2331. The peak areas for the two ionsmonitored by the mass spectrometer for each analyte are summed to yield the total response foreach analyte. Each internal st<strong>and</strong>ard is used to quantify the CDD/CDF in its homologous series.A DB-5 (30 m) or SP-2250 capillary column is recommended for EPAMethods 8280 <strong>and</strong> 8290. The analytical procedures specified in EPA Method 8290 are similar tothose in Method 23, with the addition <strong>of</strong> the surrogate st<strong>and</strong>ards used to measure samplecollection efficiency. Identification <strong>of</strong> the compounds for which an isotopically labeled st<strong>and</strong>ard isused is based on elution at the exact retention time established by analysis <strong>of</strong> st<strong>and</strong>ards <strong>and</strong>simultaneous detection <strong>of</strong> the two most abundant ions in the molecular ion region. Compoundsfor which no isotopically labeled st<strong>and</strong>ard is available are identified by their relative retentiontimes, which must fall within the established retention windows, <strong>and</strong> the simultaneous detection <strong>of</strong>the two most abundant ions in the molecular ion region in the correct abundance ratio. Theretention windows are established by analysis <strong>of</strong> a GC performance evaluation solution.Identification is confirmed by comparing the ratio <strong>of</strong> the integrated ion abundance <strong>of</strong> themolecular ion species to the theoretical abundance ratio.5-9
Quantification <strong>of</strong> the individual homologues <strong>and</strong> total CDD/CDF is based upon a107,108multi-point calibration curve for each homologue. The major difference betweenMethod 8280 <strong>and</strong> Method 8290 is the resolving power <strong>of</strong> the mass spectrometer. The HRMSprovides a higher-quality analysis than does the LRMS because <strong>of</strong> its ability to incorporateadditional labeled st<strong>and</strong>ards to cover almost all <strong>of</strong> the TCDD/TCDF through OCDD/OCDFhomologues.5-10
SECTION 6.0REFERENCES1. U.S. EPA. Compilation <strong>of</strong> Air Pollutant Emission Factors, 5th ed. (AP-42), Vol. I:Stationary Point <strong>and</strong> Area <strong>Sources</strong>. Research Triangle Park, North Carolina:U.S. Environmental Protection Agency, 1995.2. U.S. EPA. Technical Procedures for Developing AP-42 Emission Factors <strong>and</strong> PreparingAP-42 Sections. EPA-454/B-93-050. Research Triangle Park, North Carolina:U.S. Environmental Protection Agency, Office <strong>of</strong> Air Quality Planning <strong>and</strong> St<strong>and</strong>ards,1993.3. Pope, A. (U.S. Environmental Protection Agency, Emission Inventory Branch); R.B.Jones (Midwest Research Institute); <strong>and</strong> G. Brooks (Radian Corporation). Groupdiscussion on applying "U" rating to emission factors. Research Triangle Park, NorthCarolina. December 8, 1992.4. World Health Organization. <strong>Sources</strong> <strong>of</strong> Environmental Pollution. PolychlorinatedDibenzo-p-dioxins <strong>and</strong> Dibenz<strong>of</strong>urans, Environmental Health Criteria 88. Geneva,Switzerl<strong>and</strong>: World Health Organization, 1989.5. U.S. EPA. Health <strong>and</strong> Environmental Effects Pr<strong>of</strong>ile for Tetra-, Penta-, <strong>and</strong>Hexachlorodibenz<strong>of</strong>urans. EPA-600/X-84/114. Cincinnati, Ohio: U.S. EnvironmentalProtection Agency, Office <strong>of</strong> Health <strong>and</strong> Environmental Assessment, 1983. p. 1-1.6. U.S. EPA. Health Assessment Document for Polychlorinated Dibenzo-p-dioxins.EPA-600/8-84-014A. Washington, D.C.: U.S. Environmental Protection Agency, Office<strong>of</strong> Health <strong>and</strong> Environmental Assessment, 1984. pp. 3-5.7. Podoll, R.T., H.M. Jaber, <strong>and</strong> T. Mill. Tetrachlorodibenzodioxin: Rates <strong>of</strong> Volatilization<strong>and</strong> Photolysis in the Environment. Environmental Science <strong>and</strong> Technology.20(1986):490.6-1
8. Lustenhouwer, J.W.A., K. Olie, <strong>and</strong> O. Hutzinger. Chlorinated Dibenzo-p-dioxins <strong>and</strong>Related Compounds in Incinerator Effluents: A Review <strong>of</strong> Measurements <strong>and</strong>Mechanisms <strong>of</strong> Formation. Chemosphere. 9:512, 1990.9. U.S. EPA. National Dioxin Study Tier 4--Combustion <strong>Sources</strong>: Engineering AnalysisReport. EPA-450/4-84-014h. Research Triangle Park, North Carolina:U.S. Environmental Protection Agency, 1987.10. U.S. EPA. National Dioxin Study Tier 4--Combustion <strong>Sources</strong>: Project SummaryReport. EPA-450/4-84-014g. Research Triangle Park, North Carolina:U.S. Environmental Protection Agency, 1987.11. Barnes, D.G., F.W. Kutz (U.S. Environmental Protection Agency, Office <strong>of</strong> Research <strong>and</strong>Development); D.P. Bottimore (Versar, Inc.). Interim Procedures for <strong>Estimating</strong> RisksAssociated with Exposures to Mixtures <strong>of</strong> Chlorinated Dibenzo-p-dioxins <strong>and</strong>Dibenz<strong>of</strong>urans (CDD <strong>and</strong> CDF) <strong>and</strong> 1989 Update. EPA-625/3-89/016. Washington,D.C.: U.S. Environmental Protection Agency, 1989.12. National Dioxin Emission Estimates <strong>from</strong> Municipal Waste Combustors.U.S. Environmental Protection Agency, Emission St<strong>and</strong>ards Division, Office <strong>of</strong> AirQuality Planning <strong>and</strong> St<strong>and</strong>ards, Research Triangle Park, North Carolina. June 1996.Docket A-90-45, Item VII-A-001.13. National Dioxin Emission <strong>from</strong> Medical Waste Incinerators. U.S. EnvironmentalProtection Agency, Emission St<strong>and</strong>ards Division, Office <strong>of</strong> Air Quality Planning <strong>and</strong>St<strong>and</strong>ards, Research Triangle Park, North Carolina. June 1996.14. U.S. EPA. <strong>Locating</strong> <strong>and</strong> <strong>Estimating</strong> Air <strong>Emissions</strong> <strong>from</strong> <strong>Sources</strong> <strong>of</strong> Polycyclic OrganicMatter, Final Report. Research Triangle Park, North Carolina: U.S. EnvironmentalProtection Agency, November 1996.15. Fenn, D.A., <strong>and</strong> K.L. Nebel (Radian Corporation). Memor<strong>and</strong>um to W.H. Stevenson(U.S. Environmental Protection Agency, Emission St<strong>and</strong>ards Division) concerning MWCDatabase. March 1992.16. AP-42, 5th ed., op. cit., note 3. Section 2.1, Refuse Combustion, 1995.17. U.S. EPA. Municipal Waste Combustion Assessment: Technical Basis for GoodCombustion Practice. EPA-600/8-89-063. Research Triangle Park, North Carolina:U.S. Environmental Protection Agency, 1989.6-2
18. U.S. EPA. <strong>Locating</strong> <strong>and</strong> <strong>Estimating</strong> Air Toxics <strong>Emissions</strong> <strong>from</strong> Sewage SludgeIncinerators. EPA-450/2-90-009. Research Triangle Park, North Carolina:U.S. Environmental Protection Agency, 1990.19. U.S. EPA. St<strong>and</strong>ards <strong>of</strong> Performance for New Stationary <strong>Sources</strong>: Municipal WasteCombustors, 59 FR 48216, September 20, 1994.20. U.S. EPA. Municipal Waste Combustors--Background Information for ProposedSt<strong>and</strong>ards: Post-Combustion Technology Performance. EPA-450/3-89-27c. ResearchTriangle Park, North Carolina: U.S. Environmental Protection Agency, 1989.21. U.S. EPA. <strong>Locating</strong> <strong>and</strong> <strong>Estimating</strong> Air Toxic <strong>Emissions</strong> <strong>from</strong> Medical WasteIncinerators. EPA-454/R-93-053. Research Triangle Park, North Carolina:U.S. Environmental Protection Agency, 1993.22. AP-42, 5th ed., op. cit., note 3. Section 2.3, Medical Waste Incineration, 1995.23. Moody, T.K. (Radian Corporation), <strong>and</strong> R. Copl<strong>and</strong> (U.S. Environmental ProtectionAgency, Emission St<strong>and</strong>ards Division). Teleconference concerning hospital incinerators.July 17, 1995.24. Radian Corporation. Site 4 Final Emission Test Report, Sewage Sludge Test Program.Research Triangle Park, North Carolina: U.S. Environmental Protection Agency, 1989.25. ERT. Non-Criteria <strong>Emissions</strong> Monitoring Program for the Envirotech Nine-HearthSewage Sludge Incinerator at the Metropolitan Wastewater Treatment Facility. St. Paul,Minnesota: Metropolitan Waste Control Commission, 1986.26. U.S. EPA. National Dioxin Study Tier 4--Combustion <strong>Sources</strong>, Final Test Report--Site 1Sewage Sludge Incinerator SSI-A. EPA-450/4-84-014j. Research Triangle Park, NorthCarolina: U.S. Environmental Protection Agency, 1987.27. U.S. EPA. National Dioxin Study Tier 4--Combustion <strong>Sources</strong>, Final Test Report--Site 3Sewage Sludge Incinerator SSI-B. EPA-450/4-84-014l. Research Triangle Park, NorthCarolina: U.S. Environmental Protection Agency, 1987.28. U.S. EPA. National Dioxin Study Tier 4--Combustion <strong>Sources</strong>, Final Test Report--Site 12 Sewage Sludge Incinerator SSI-C. EPA-450/4-84-014l. Research Triangle Park,North Carolina: U.S. Environmental Protection Agency, 1987.29. Acurex Corporation. 1990 Source Test Data for the Sewage Sludge Incinerator.Prepared for the Palo Alto Water Quality Control Plant. Palo Alto, California: AcurexCorporation, 1991.6-3
30. Entropy Environmentalists, Inc. <strong>Emissions</strong> <strong>of</strong> Metals, Chromium <strong>and</strong> Nickel Species, <strong>and</strong>Organics <strong>from</strong> Municipal Wastewater Sludge Incinerators, Vol. I: Summary Report.Cincinnati, Ohio: U.S. Environmental Protection Agency, 1992.31. AP-42, 5th ed., op. cit., note 3. Section 2.2, Sewage Sludge Incineration, 1995.32. Whitworth, W.E., <strong>and</strong> L.R. Waterl<strong>and</strong>. Pilot-Scale Incineration <strong>of</strong> PCB-ContaminatedSediments <strong>from</strong> the Hot Spot <strong>of</strong> the New Bedford Harbor Superfund Site. Jefferson,Arkansas: Acurex Corporation, 1992.33. Oppelt, E.T. Incineration <strong>of</strong> Hazardous Waste--A Critical Review. Journal <strong>of</strong> AirPollution Control Association. 37(5):558-586, 1987.34. St<strong>and</strong>ards for Owners <strong>and</strong> Operators <strong>of</strong> Hazardous Waste Incinerators <strong>and</strong> Burning <strong>of</strong>Hazardous Wastes in Boilers <strong>and</strong> Industrial Furnaces. 40 CFR Parts 260, 261, 264, <strong>and</strong>270. Federal Register. 55(82):17-93, April 27, 1990.35. U.S. EPA. Permit Writer's Guide to Test Burn Data, Hazardous Waste Incineration.EPA-625/6-86-012. Cincinnati, Ohio: U.S. Environmental Protection Agency, 1986.36. U.S. EPA. National Dioxin Study Tier 4--Combustion <strong>Sources</strong>, Final Test Report--Site 2Industrial Solid Waste Incinerator ISW-A. EPA-450/4-84-014k. Research Triangle Park,North Carolina: U.S. Environmental Protection Agency, 1987.37. Radian Corporation. Summary <strong>of</strong> Trace <strong>Emissions</strong> <strong>from</strong> <strong>and</strong> Recommendations <strong>of</strong> RiskAssessment Methodologies for Coal <strong>and</strong> Oil Combustion <strong>Sources</strong>.DCN No. 86-203-024-41-10. Research Triangle Park, North Carolina:U.S. Environmental Protection Agency, 1986.38. Cole, J. (Research Triangle Institute). Memor<strong>and</strong>um to W. Maxwell (U.S. EnvironmentalProtection Agency) on HAP Emission Factors. January 19, 1995.39. Someshwar, A.V. <strong>and</strong> J.E. Pinkerton. Air Pollution Engineering Manual, Chapter 18:Wood Processing Industry. Air <strong>and</strong> Waste Management Association. New York, NewYork: Van Nostr<strong>and</strong> Reinhold, 1992.40. AP-42, 5th ed., op. cit., note 3. Section 1.6, Wood Waste Combustion Boilers, 1995.41. Someshwar, A.V. Summary <strong>of</strong> Mill Test Reports on Wood Residue Combustion, BlackLiquor Combustion, <strong>and</strong> Kraft Mill Sludge Burning. NCASI Files. Gainesville, Florida:National Council <strong>of</strong> the Paper Industry for Air <strong>and</strong> Stream Improvement, Inc., 1995.42. AP-42, 5th ed., op. cit., note 3. Section 1.10, Residential Wood Stoves, 1995.6-4
43. Johnson, N.D., <strong>and</strong> M.T. Schultz (ORTECH Corporation). MOE Toxic Chemical<strong>Emissions</strong> Inventory for Ontario <strong>and</strong> Eastern North America. Final ReportNo. P92-T61-5429/OG. Rexdale, Ontario: Ontario Ministry <strong>of</strong> the Environment, AirResources Branch, 1992.44. AP-42, 5th ed., op. cit., note 3. Section 1.9, Residential Fireplaces, 1995.45. AP-42, 5th ed., op. cit., note 3. Section 1.3, Fuel Oil Combustion, 1995.46. U.S. EPA. National Dioxin Study Tier 4--Combustion <strong>Sources</strong>: Final Test Report--Site 13 Residential Wood Stove WS-A. EPA-450/4-84-014v. Research Triangle Park,North Carolina: U.S. Environmental Protection Agency, 1987.47. U.S. EPA. <strong>Estimating</strong> Exposure to Dioxin-Like Compounds, Volume II: Properties,<strong>Sources</strong>, Occurrence, <strong>and</strong> Background Exposures, External Review Draft.EPA-600/6-88-005bC. Washington, D.C.: U.S. Environmental Protection Agency,Exposure Assessment Group, Office <strong>of</strong> Health <strong>and</strong> Environmental Assessment, June 1994.48. U.S. EPA. Markets for Scrap Tires. EPA/530-SW-90-074A. Washington, D.C.:U.S. Environmental Protection Agency, Office <strong>of</strong> Solid Waste <strong>and</strong> Emergency Response,1991.49. Scrap Tire Management Council. Scrap Tire Use/Disposal Study, 1992 Update. 1992.50. Radian Corporation. Modesto Energy Company Waste Tire-to-Energy Facility, Westley,California, Final Emission Test Report. Report No. 243-047-20. Research TrianglePark, North Carolina: Radian Corporation, 1988.51. California Air Resources Board. <strong>Emissions</strong> Testing <strong>of</strong> a Propane Fired Incinerator at aCrematorium. Report No. ERC-39. Sacramento, California: California Air ResourcesBoard, 1992.52. Cremation Association <strong>of</strong> North America. Cremation Statistics. Cremationist. Chicago,Illinois: Cremation Association <strong>of</strong> North America, 1992.53. U.S. EPA. Emission Factors for Iron Foundries--Criterion <strong>and</strong> Toxic Pollutants.EPA-60/2-90-044. Cincinnati, Ohio: U.S. Environmental Protection Agency, ControlTechnology Center, Office <strong>of</strong> Research <strong>and</strong> Development, 1990.54. U.S. EPA. Electric Arc Furnaces in Ferrous Foundries, Background Information forProposed St<strong>and</strong>ards. Report No. 3-80-020a. Research Triangle Park, North Carolina:U.S. Environmental Protection Agency, Office <strong>of</strong> Air Quality Planning <strong>and</strong> St<strong>and</strong>ards,1980.6-5
55. California Air Resources Board. <strong>Emissions</strong> Measurement <strong>of</strong> Toxic Compounds <strong>from</strong> aCupola Baghouse at a Steel Foundry. Report No. ERC-61. Sacramento, California:California Air Resources Board, 1993.56. Keller, P.A. (Radian Corporation). Teleconference with J. Maysilles, (U.S. EnvironmentalProtection Agency). April 2, 1994.57. AP-42, 5th ed., op. cit., note 3. Section 12.9, Secondary Copper Smelting <strong>and</strong> Alloying,1995.58. U.S. EPA. National Dioxin Study Tier 4--Combustion <strong>Sources</strong>: Final Test Report--Site10 Secondary Copper Recovery Cupola Furnace MET-A. EPA-450/4-84-0145. ResearchTriangle Park, North Carolina: U.S. Environmental Protection Agency, 1987.59. AP-42, 5th ed., op. cit., note 3. Section 12.8, Secondary Aluminum Operations, 1995.60. California Air Resources Board. Dioxin/Furan <strong>Emissions</strong> Estimates <strong>from</strong> a SecondaryAluminum Facility. Report No. ERC-9. Sacramento, California: California AirResources Board, 1992.61. California Air Resources Board. <strong>Emissions</strong> Measurements on Delacquering System.Report No. ERC-32. Sacramento, California: California Air Resources Board, 1992.62. U.S. EPA. Secondary Lead Smelting Background Information Document For ProposedSt<strong>and</strong>ards, Vol. 1. EPA-450/R-94-024a. Research Triangle Park, North Carolina:U.S. Environmental Protection Agency, Office <strong>of</strong> Air Quality Planning <strong>and</strong> St<strong>and</strong>ards,1994.63. Steinwurtzel, R.N. (Counsel for Association <strong>of</strong> Battery Recyclers), <strong>and</strong> D.W. Safreit(U.S. Environmental Protection Agency, Emission Factor <strong>and</strong> Inventory Group). Personalcommunication. May 4, 1995.64. U.S. EPA. HAP Emission Testing on Selected <strong>Sources</strong> at a Secondary Lead Smelter--Tejas Resources, Inc., Draft Emission Test Report. Prepared by Roy F. Weston, Inc.EPA Contract No. 68-D1-0104. Research Triangle Park: U.S. Environmental ProtectionAgency, 1992.65. U.S. EPA. HAP Emission Testing on Selected <strong>Sources</strong> at a Secondary LeadSmelter--Schuylkill Metals Corporation, Draft Emission Test Report. Prepared by Roy F.Weston, Inc. EPA Contract No. 68-D1-0104. Research Triangle Park:U.S. Environmental Protection Agency, 1992.6-6
66. U.S. EPA. HAP Emission Testing on Selected <strong>Sources</strong> at a Secondary LeadSmelter--East Penn Manufacturing Company, Draft Emission Test Report. Prepared byRoy F. Weston, Inc. EPA Contract No. 68-D1-0104. Research Triangle Park:U.S. Environmental Protection Agency, 1992.67. U.S. EPA. Secondary Lead Smelting Background Information Document For ProposedSt<strong>and</strong>ards, Vol. 2: Appendices. EPA-450/R-94-024b. Research Triangle Park, NorthCarolina: U.S. Environmental Protection Agency, Office <strong>of</strong> Air Quality Planning <strong>and</strong>St<strong>and</strong>ards, 1994.68. U.S. EPA. National Dioxin Study Tier 4--Combustion <strong>Sources</strong>: Final Test Report--Site6 Wire Reclamation Incinerator WRI-A. EPA-450/4-84-0140. Research Triangle Park,North Carolina: U.S. Environmental Protection Agency, 1987.69. U.S. EPA. National Dioxin Study Tier 4--Combustion <strong>Sources</strong>: Final Test Report--Site 11 Drum <strong>and</strong> Barrel Reclamation Furnace DBR-A. EPA-450/4-8-0144. ResearchTriangle Park, North Carolina: U.S. Environmental Protection Agency, 1987.70. AP-42, 5th ed., op. cit., note 3. Section 10.2, Chemical Wood Pulping, 1995.71. Dyer, H., S. Gajita, <strong>and</strong> D. Fisher. 1992 Lockwood-Post's Directory <strong>of</strong> the Pulp, Paper<strong>and</strong> Allied Trades. Miller Freeman Publications. San Francisco, California, 1991.72. Dyer, H., S. Gajita, <strong>and</strong> D. Fisher. 1997 Lockwood-Post's Directory <strong>of</strong> the Pulp, Paper<strong>and</strong> Allied Trades. Miller Freeman Publications. San Francisco, California, 1997.73. National Council <strong>of</strong> the Paper Industry for Air <strong>and</strong> Stream Improvement, Inc. A Study <strong>of</strong>Kraft Recovery Furnace Hydrochloric Acid <strong>Emissions</strong>. Technical Bulletin No. 674.Gainesville, Florida: National Council <strong>of</strong> the Paper Industry for Air <strong>and</strong> StreamImprovement, Inc., August, 1994.74. Carruth, G., ed. The Volume Library, Energy <strong>and</strong> Power <strong>Sources</strong>. Nashville, Tennessee:The Southwestern Company, 1986.75. Ballschmiter, K., et al. Automobile Exhausts Versus Municipal Waste Incineration as<strong>Sources</strong> <strong>of</strong> the Polychloro-dibenzodioxins (PCDD) <strong>and</strong> -furans (PCDF) Found in theEnvironment. Chemosphere. 15(7):901-915, 1986.76. Marklund, S., C. Rappe, M. Tysklind, <strong>and</strong> K. Egeback. Identification <strong>of</strong> PolychlorinatedDibenz<strong>of</strong>urans <strong>and</strong> <strong>Dioxins</strong> in Exhausts <strong>from</strong> Cars Run on Leaded Gasoline.Chemosphere. 16(1):29-36, 1987.6-7
77. Marklund, S., et al. <strong>Emissions</strong> <strong>of</strong> PCDDs <strong>and</strong> PCDFs in Gasoline <strong>and</strong> Diesel Fueled Cars.Chemosphere. 20(5):553-561, 1990.78. Oehme, M., S. Larson, <strong>and</strong> E.M. Bvevik. Emission Factors <strong>of</strong> PCDD <strong>and</strong> PCDF for RoadVehicles Obtained by Tunnel Experiment. Chemosphere. 23(11/12)1699-1708, 1991.79. U.S. Environmetnal Protection Agency. <strong>Emissions</strong> Inventory <strong>of</strong> Section 112(c)(6)Pollutants: Polycyclic Organic Matter (POM), 2,3,7,8-Tetrachlorodibenzo-P-Dioxin(TCDD)/2,3,7,8,-Tetrachlorodibenz<strong>of</strong>uran (TCDF), Polychlorinated BiphenylCompounds (PCBs), Hexachlorobenzene, Mercury, <strong>and</strong> Alkylated Lead. Draft Report.Office <strong>of</strong> Air Quality Planning <strong>and</strong> St<strong>and</strong>ards, Research Triangle Park, NorthCarolina, 1996.80. Humer, C. Activated Carbon Plant Starts for American Novit. Chemical MarketingReporter. June 8, 1992. p. 2.81. U.S. EPA. National Dioxin Study, Tier 4--Combustion <strong>Sources</strong>, Final Test Report--Site 9, Carbon Regeneration Furnace CRF-A. EPA-450/4-84-014r. Research TrianglePark, North Carolina: U.S. Environmental Protection Agency, Office <strong>of</strong> Air QualityPlanning <strong>and</strong> St<strong>and</strong>ards, 1987.82. Schuliger, W.G. <strong>and</strong> L.G. Knapil. Reactivation Systems. Paper presented at the annualconference <strong>of</strong> the American Water Works Association, June 1990.83. Byers, W.D. Charcoal/Activated Carbon. Air Pollution Engineering Manual.A.J. Buonicore <strong>and</strong> W.J. Davis, eds. New York, New York: Van Nostr<strong>and</strong> Reinhold,1991.84. K<strong>of</strong>fskey, W.E. <strong>and</strong> B.W. Lykins, Jr. GAC Adsorption <strong>and</strong> Infrared Reactivation: CaseStudy. Journal <strong>of</strong> American Water Works Association. (January 1990) 48-56.85. BTC Environmental, Inc. AB-2588 Toxic Emission Testing. Ventura, CA: OrangeCounty Water District, 1991.86. Raven, P.H. Biology <strong>of</strong> Plants. New York, New York: Worth Publishers, Inc., 1980.87. Bacher, R., M. Swerev, <strong>and</strong> K. Ballschmiter. Pr<strong>of</strong>ile <strong>and</strong> Pattern <strong>of</strong> Monochloro- throughOctachlorodibenzodioxins <strong>and</strong> -dibenz<strong>of</strong>urans in Chimney Deposits <strong>from</strong> Wood Burning.Environmental Science <strong>and</strong> Technology. 26(8):1649-1655, 1992.88. Nestrick, T.J., <strong>and</strong> L.L. Lamparski. Assessment <strong>of</strong> Chlorinated Dibenzo-p-dioxinFormation <strong>and</strong> Potential Emission to the Environment <strong>from</strong> Wood Combustion.Chemosphere. 12(4/5):617-626, 1983.6-8
89. Tashiro, C. et al. Preliminary Report: <strong>Dioxins</strong> <strong>and</strong> Furans in Prescribed Burns.Chemosphere. 20:1533-1536, 1990.90. U.S. Code <strong>of</strong> Federal Regulations. Title 40, Protection <strong>of</strong> the Environment, Part 761--Polychorinated Bi-phenyls (PCBs) Manufacturing, Processing, Distribution in Commerce,<strong>and</strong> Use Prohibitions. Washington, D.C.: U.S. Government Printing Office, 1994.91. U.S. EPA. National Dioxin Study Tier 4--Combustion <strong>Sources</strong>: Final Literature Review.EPA-450/4-84-014i. Research Triangle Park, North Carolina: U.S. EnvironmentalProtection Agency, 1986.92. AP-42, 5th ed., op. cit., note 3. Section 2.4, L<strong>and</strong>fills, 1995.93. California Air Resources Board. Compliance Testing for Non-Criteria Pollutants at aL<strong>and</strong>fill Flare. Report No. ERC-2. Sacramento, California: California Air ResourcesBoard, 1990.94. Lee, A. et al. <strong>Dioxins</strong> <strong>and</strong> Furan Contamination in the Manufacture <strong>of</strong> HalogenatedOrganic Chemicals. EPA/600/2-86/101. Cincinnati, Ohio: U.S. EnvironmentalProtection Agency, 1986.95. Sittig, M. H<strong>and</strong>book <strong>of</strong> Toxic <strong>and</strong> Hazardous Chemicals <strong>and</strong> Carcinogens, 2nd ed. ParkRidge, New Jersey: Noyer Publications, 1985.96. Wilkinson, J. (Vulcan Chemicals). Letter to D. Safriet (U.S. Environmental ProtectionAgency, Emission Factor <strong>and</strong> Inventory Group) concerning dioxin exposure assessmentcomments, technical information staff. June 20, 1995.97. Chinkin, L. et al. Inventory <strong>of</strong> Chlorophenol Use in the Forest Products Industry <strong>and</strong>Investigation <strong>of</strong> Related <strong>Emissions</strong> <strong>of</strong> Chlorinated Dibenzodioxins <strong>and</strong> Dibenz<strong>of</strong>urans.SYSAPP-87/078. Sacramento, California: California Air Resources Board, 1987.98. AP-42, 5th ed., op. cit., note 3. Section 11.6, Portl<strong>and</strong> Cement Manufacturing, 1995.99. Pierson, T. (Research Triangle Institute). Summary <strong>of</strong> Portl<strong>and</strong> Cement MACT Data.Report to T. Lahre, (U.S. Environmental Protection Agency, Office <strong>of</strong> Air QualityPlanning <strong>and</strong> St<strong>and</strong>ards). Research Triangle Park, North Carolina: Research TriangleInstitute, April 25, 1994.100. Kim, I. Incinerators <strong>and</strong> Cement Kilns Face Off. Chemical Engineering. April 1994.6-9
101. U.S. EPA. Technical Support for Revision <strong>of</strong> the Hazardous Waste CombustionRegulations for Cement Kilns <strong>and</strong> Other Thermal Treatment Devices, Second Draft.Prepared by Energy <strong>and</strong> Environmental Research Corporation, Irvine, California.Washington, D.C.: U.S. Environmental Protection Agency, Office <strong>of</strong> Solid Waste.May 17, 1994.102. U.S. EPA. IERL-RTP Procedure Manual: Level 1 Environmental Assessment (2nd ed.).EPA-600/7-78-201. Interagency Energy/Environment R&D Program Report.U.S. Environmental Protection Agency, October 1978.103. Cooke, M., F. DeRoos, <strong>and</strong> B. Rising. Hot Flue Gas Spiking <strong>and</strong> Recovery Study forTetrachlorodibenzodioxins (TCDD) Using Modified Method 5 <strong>and</strong> SASS (SourceAssessment Sampling System) Sampling with a Simulated Incinerator.EPA-600/2-84/159. Research Triangle Park, North Carolina: U.S. EnvironmentalProtection Agency, Industrial Environmental Research Laboratory, 1984.104. St<strong>and</strong>ards <strong>of</strong> Performance for New Stationary <strong>Sources</strong>, Appendix A, Test Method 23 -Determination <strong>of</strong> Polychlorinated Dibenzo-p-<strong>Dioxins</strong> <strong>and</strong> Polychlorinated Dibenz<strong>of</strong>urans<strong>from</strong> Stationary <strong>Sources</strong>. Federal Register, 60(104)28378-28426, May 31, 1995.105. California Air Resources Board. Stationary Source Test Methods, Volume III: Methodsfor Determining <strong>Emissions</strong> <strong>of</strong> Toxic Air Contaminants <strong>from</strong> Stationary <strong>Sources</strong>.Sacramento, California: California Air Resources Board, Monitoring <strong>and</strong> LaboratoryDivision, 1989.106. American Society <strong>of</strong> Mechanical Engineers. Analytical Procedures to Assay StackEffluent Samples <strong>and</strong> Residual Combustion Products for PolychlorinatedDibenzo-p-<strong>Dioxins</strong> (PCDD) <strong>and</strong> Polychlorinated Dibenz<strong>of</strong>urans (PCDF). Washington,D.C.: U.S. Department <strong>of</strong> Energy <strong>and</strong> U.S. Environmental Protection Agency, 1984.107. U.S. EPA. Test Methods for Evaluating Solid Waste, 3rd ed. Method 8280 - TheAnalysis <strong>of</strong> Polychlorinated Dibenzo-p-Dioxin <strong>and</strong> Polychlorinated Dibenz<strong>of</strong>urans.SW-846. Washington, D.C.: Office <strong>of</strong> Solid Waste, 1986.108. U.S. EPA. Test Methods for Evaluating Solid Waste, 3rd ed. Method 8290 - TheAnalysis <strong>of</strong> Polychlorinated Dibenzo-p-Dioxin <strong>and</strong> Polychlorinated Dibenz<strong>of</strong>urans byHigh-Resolution Gas Chromatography/High-Resolution Mass Spectrometry. SW-846.Washington, D.C.: Office <strong>of</strong> Solid Waste, 1986.6-10
APPENDIX AMETHODS FOR ESTIMATING NATIONAL CDD/CDF EMISSIONS
Note: The national emissions estimates presented here are those that were available at the timethis document was published. Ongoing efforts <strong>and</strong> studies by the U.S. EnvironmentalProtection Agency will most likely generate new estimates. The reader should contact theU.S. Environmental Protection Agency for the most recent estimates.ii
TABLE OF CONTENTSMunicipal Waste Combustion ................................................A-1Medical Waste Incineration .................................................A-14Sewage Sludge Incineration .................................................A-20Hazardous Waste Incineration ...............................................A-21Lightweight Aggregate Kilns (LWAKS) .......................................A-23Portl<strong>and</strong> Cement .........................................................A-24Waste Tire Incineration ....................................................A-26Utility Coal Combustion ...................................................A-27Utility Residual Oil Combustion ..............................................A-28Industrial Wood Combustion ................................................A-29Residential Coal Combustion ................................................A-31Residential Distillate Fuel Oil Combustion ......................................A-34Residential Wood Combustion ...............................................A-36Iron <strong>and</strong> Steel Foundries ...................................................A-38Secondary Copper Smelters .................................................A-40Secondary Lead Smelters ...................................................A-41Secondary Aluminum Smelters ..............................................A-43Drum <strong>and</strong> Barrel Reclamation/Incineration.....................................A-45On-road Mobile <strong>Sources</strong> ...................................................A-46Pulp <strong>and</strong> Paper--Kraft Recovery Furnaces ......................................A-48iii
TABLE OF CONTENTS (Continued)Wood Treatment .........................................................A-49Carbon Regeneration/Reactivation ............................................A-50Forest Fires .............................................................A-52Crematories .............................................................A-53Remaining Source Categories ...............................................A-54References ..............................................................A-55iv
MUNICIPAL WASTE COMBUSTIONBasis for CalculationThe national dioxin/furan emissions estimates for MWCs were obtained directly <strong>from</strong> work doneby EPA's Emission St<strong>and</strong>ards Division (ESD) to support MACT st<strong>and</strong>ards for this source1category. The estimates are based on dioxin data collected by the EPA during its "MWCSurvey" in 1994. The dioxin emissions data that were collected were combined with MWC plantdesign data, plant annual utilization rate data, <strong>and</strong> flue gas flow rate conversion factors tocalculate annual dioxin emission estimates. ESD calculated estimates for three different timeperiods (1993, 1995, <strong>and</strong> 2000), <strong>and</strong> the 1995 estimate is presented in this document because it isthe most recent estimate. A summary <strong>of</strong> the methods used to determine the estimates areprovided here. More detailed information on the derivation <strong>of</strong> the estimates can be obtained <strong>from</strong>the cited reference 1. 1There are three main types <strong>of</strong> municipal waste incinerators in the United States: mass burn (MB),refuse derived fuel (RDF), <strong>and</strong> modular combustors (MOD). Mass burn combustors are the mostcommon type <strong>of</strong> combustor, representing 54 percent <strong>of</strong> all municipal waste combustors (MWCs)in the United States, followed by modular facilities (32 percent) <strong>and</strong> RDF facilities (13 percent). 2According to the 1994 Maximum Achievable Control Technologies (MACT) Study there are158 existing MWC facilities with design capacities above 38.6 tons/day. The facilities designed toburn less than 38.6 tons/day account for less than one percent <strong>of</strong> the total waste flow to MWC2facilities. Of the total MWC capacity in the United States, about 58 percent <strong>of</strong> municipal wasteis treated in mass burn facilities, 29 percent in RDF-fired facilities, 9 percent in modularcombustors, <strong>and</strong> 4 percent in other MWC designs. 2A-1
Dioxin test results for 1993 were compiled <strong>from</strong> emission source tests performed between 1985<strong>and</strong> 1993 (see Table A-1). In a limited number <strong>of</strong> cases, test results <strong>from</strong> 1994 on individual unitswere used if there were no changes in MWC unit operation or air pollution control device(APCD) configurations since 1993. Where the emission test date in the table is noted as 1985through 1989, the data were gathered by OAQPS to develop the new source performancest<strong>and</strong>ards <strong>and</strong> emissions guidelines proposed for MWCs in 1989 (December 1989). Where theemission test date is noted as 1990 through 1994, the data were gathered by OAQPS, orsubmitted to OAQPS, as part <strong>of</strong> one <strong>of</strong> the following efforts:1. Data gathered by OAQPS to develop the revised new source performancest<strong>and</strong>ards <strong>and</strong> emission guidelines for MWCs proposed on September 20, 1994;2. Data submitted to OAQPS in response to the "MWC Survey" <strong>of</strong> dioxin emissions;or3. Data submitted to the docket (A-90-45) as public comments on the revised newsource performance st<strong>and</strong>ards <strong>and</strong> emission guidelines proposed on September 20,1994.For facilities with dioxin test data, the following criteria were used to determine the mostrepresentative test results for each facility for 1993:For facilities with more than one test result, the most recent test was used. Theseresults were chosen such that they were representative <strong>of</strong> plant operation at theend <strong>of</strong> 1993. Exceptions to this were in cases when two or more tests wereconducted at a MWC over a relatively short period <strong>of</strong> time. Then, the average <strong>of</strong>these tests was used to represent the 1993 emissions.At facilities with multiple units where not all units were tested, an average <strong>of</strong> thetest results <strong>from</strong> the tested units was used as a representative value for theuntested units.Test results were obtained for approximately 55 percent <strong>of</strong> the domestic MWCs. For the other45 percent, a set <strong>of</strong> default values was created <strong>and</strong> used to estimate dioxin concentrations. Theset <strong>of</strong> default values was compiled <strong>from</strong> test data, AP-42 emission factors, <strong>and</strong> <strong>from</strong> the EPAA-2
Table A-1Test Data Used for 1993 National Dioxin Estimates for MWCsA-3TotalAirDioxin/FuransPlant Pollution Combustor (ng/dscm @ 7% O 2 )Capacity Number <strong>of</strong> Combustor Control Combustor CapacityRegion Unit Name State (tpd) Combustors Type Devices Number (tpd) Total TEQaYear4 Huntsville Refuse-Fired Steam Fac. AL 690 2 MB/WW FF/SD 2 345 3 0.080 19909 Commerce Refuse-to-Energy Fac. CA 380 1 MB/WW FF/SD 1 380 10 NA 1998SNCR9 Long Beach (SERRF) CA 1380 3 MW/WW FF/SD 1 460 4 NA 1988SNCR9 Stanislaus (Modesto) CA 800 2 MB/WW FF/SD 1 400 32 NA 1993SNCR2 400 9 NA 19931 Bristol RRF CT 650 2 MB/WW FF/SD 1 325 75 1.670 19902 325 8 0.140 19901 Mid-Connecticut Project CT 2000 3 RDF FF/SD 1 667 1 NA 19881 Wallingford RRF CT 420 3 MOD/EA FF/SD 1 140 178 NA 19912 140 50 NA 19913 140 47 NA 19914 Dade Co. RRF FL 3000 4 RDF ESP 1 750 449 NA 19904 Hillsborough Co. RRF FL 1200 3 MB/WW ESP 1 400 178 NA 19944 McKay Bay REF FL 1000 4 MB/WW ESP 1 250 8533 265.000 19943 250 893 21.000 19944 250 2160 49.000 19944 Pasco Co. Solid Waste RRF FL 1050 3 MB/WW FF/SD 1 350 11 0.190 19944 Wheelabrator Pinellas RRF FL 3000 3 MB/WW ESP 3 1000 3400b71.800 199410 Honolulu Resource Recovery Venture HI 2160 2 RDF ESP/SD 1 1080 10 NA 19902 1080 3 NA 1990
Table A-1Test Data Used for 1993 National Dioxin Estimates for MWCs (Continued)A-4TotalAirDioxin/FuransPlant Pollution Combustor (ng/dscm @ 7% O 2 )Capacity Number <strong>of</strong> Combustor Control Combustor CapacityRegion Unit Name State (tpd) Combustors Type Devices Number (tpd) Total TEQaYear10 Waipahu Incinerator HI 600 2 MB/REF ESP 1 300 5690 NA 19945 Northwest WTE IL 1600 4 MB/WW ESP 2 400 65 NA 19935 Indianapolis RRF IN 2362 3 MB/WW FF/SD 2 787 12 0.120 19893 787 1 0.010 19931 Haverhill Lawrence RDF MA 710 1 RDF ESP/FSI 1 710 136 NA 19921 North Andover RESCO MA 1500 2 MB/WW ESP/FSI 1 750 53 NA 19891 SEMASS RRF MA 2700 3 RDF ESP/SD 1 900 9 NA 1989ESP/SD 2 900 12 NA 19891 Wheelabrator Millbury MA 1500 2 MB/WW ESP/SD 2 750 59 NA 19883 Hartford Co. WTE Fac. MD 360 4 MOD/SA ESP 1 90 300 5.580 19933 Pulaski MD 1500 5 MB/REF ESP 1 300 3313 37.000 19932 300 3313 37.000 19933 300 5894 85.200 19934 300 5894 85.200 19935 300 9045 104.000 19933 Southwest RRF (RESCO) MD 2250 3 MB/WW ESP 1 750 142 3.410 19932 750 102 2.380 19933 750 199 NA 19931 Greater Portl<strong>and</strong> Region RRF ME 500 2 MB/WW ESP/SD 1 250 173 NA 19871 Maine Energy Recovery (Biddeford) ME 600 2 RDF FF/SD 1 300 4 NA 19871 Penobscot Energy Recovery Comp. ME 700 2 RDF ESP 1 350 2 NA 19885 Central Wayne Co. Sanitation Auth. MI 500 2 RDF ESP 1 250 383 12.200 19945 Clinton Township MI 600 2 MB/REF ESP 1 300 3254 55.800 1994
Table A-1Test Data Used for 1993 National Dioxin Estimates for MWCs (Continued)A-5TotalAirDioxin/FuransPlant Pollution Combustor (ng/dscm @ 7% O 2 )Capacity Number <strong>of</strong> Combustor Control Combustor CapacityRegion Unit Name State (tpd) Combustors Type Devices Number (tpd) Total TEQaYear5 Greater Detroit RRF MI 3300 3 RDF ESP 1 1100 2851 NA 1993FF/SD 2 1100 2 NA 19945 Kent Co. WTE Fac. MI 625 2 MB/WW FF/SD 1 312 5 0.090 19922 312 12 0.310 19925 Hennepin Energy Recovery Facility MN 1200 2 MB/WW FF/SD 1 600 1 0.030 1992SNCR/CI2 600 2 0.020 19925 Olmstead WTE Facility MN 200 2 MB/WW ESP 1 100 219 NA 19945 Perham Renewable RF MN 114 2 MOD/SA ESP 1 57 35 NA 19945 Polk Co. Solid Waste Resource Recovery MN 80 2 MOD/SA ESP 1 40 269 8.990 19885 Pope-Douglas Solid Waste MN 72 2 MOD/SA ESP 2 36 446 7.440 19895 Ramsey-Washington MN 720 2 RDF ESP 2 360 31 NA 19885 Red Wing Solid Waste Boiler Facility MN 72 2 MOD/EA ESP 1 36 489 13.300 19905 Western Lake Superior Sanit. Distr. MN 260 2 RDF VS 2 130 16 NA 1992(Duluth)5 Wilmarth Plant (Mankato) MN 720 2 RDF FF/SD 1 360 2 NA 19884 University City RRF NC 235 2 MB/WW ESP 2 118 579 NA 19941 SES Claremont RRF NH 200 2 MB/WW FF/DSI 1 100 38 NA 19872 100 32 NA 19872 Camden RRF NJ 1050 3 MB/WW ESP/SD 1 350 75 NA 19922 Warren Energy RF NJ 400 2 MB/WW FF/SD 1 200 8 0.180 19882 Adirondack RRF NY 432 2 MB/WW ESP/SD 1 216 28 NA 19922 216 40 NA 1992
Table A-1Test Data Used for 1993 National Dioxin Estimates for MWCs (Continued)A-6TotalAirDioxin/FuransPlant Pollution Combustor (ng/dscm @ 7% O 2 )Capacity Number <strong>of</strong> Combustor Control Combustor CapacityRegion Unit Name State (tpd) Combustors Type Devices Number (tpd) Total TEQaYear2 Babylon RRF NY 750 2 MB/WW FF/SD 1 375 1 NA 19912 Babylon RRF NY 750 2 MB/WW FF/SD 2 375 1 NA 19932 Dutchess Co. RRF NY 400 2 MB/RC FF/DSI 1 200 5 NA 19892 200 18 NA 19892 Hempstead NY 2505 3 MB/WW FF/SD 2 835 1 0.010 19932 Huntington RRF NY 750 3 MB FF/SD 1 250 12 0.340 1993SNCR2 250 7 0.170 19933 250 7 0.180 19932 Long Beach RRF NY 200 1 MB/WW ESP 1 200 709 13.700 19922 MacArthur WTE NY 518 2 MB/RC FF/DSI 1 259 4 NA 19932 259 1 NA 19932 Niagara Falls RDF WTE NY 2200 2 RDF ESP 1 1100 1217 NA 19892 Oneida Co. ERF NY 200 4 MOD/SA ESP 1 50 462 NA 19852 Oswego Co. WTE NY 200 4 MPD/SA ESP 1 50 386 NA 19862 Westchester RESCO NY 2250 3 MB/WW ESP 1 750 183 NA 19935 Akron Recycle Energy System OH 1000 3 RDF ESP 1 333 370cNA 19942 333 370cNA 19945 City <strong>of</strong> Columbus SW Reduction Fac. OH 2000 6 RDF ESP 6 333 12998 NA 19925 Montgomery Co. North RRF OH 900 3 MB/RC/REF ESP 1 300 5500dNA 19892 300 5500dNA 19893 300 8097 148.000 1994
Table A-1Test Data Used for 1993 National Dioxin Estimates for MWCs (Continued)A-7TotalAirDioxin/FuransPlant Pollution Combustor (ng/dscm @ 7% O 2 )Capacity Number <strong>of</strong> Combustor Control Combustor CapacityRegion Unit Name State (tpd) Combustors Type Devices Number (tpd) Total TEQaYear5 Montgomery Co. South RRF OH 900 3 MB/RC/REF ESP 1 300 5500dNA 19892 300 5500dNA 19893 300 5500dNA 19896 Walter B. Hall RRF OK 1125 3 MB/WW ESP 1 375 34 NA 19862 375 49 NA 198710 Marion Co. WTE OR 550 2 MB/WW FF/SD 1 275 1 NA 19912 275 4 NA 19913 Delaware Co. RRF PA 2688 6 MB/RC/WW FF/SD 1 448 2 NA 19922 448 4 NA 19923 448 10 NA 19914 448 11 NA 19925 448 4 NA 19916 448 10 NA 19913 Harrisburg WTE PA 720 2 MB/WW ESP 2 360 1156 27.400 19943 Lancaster Co. RRF PA 1200 3 MB/WW FF/SD 1 400 114 2.380 19932 400 61 1.470 19933 400 49 1.300 19933 York Co. RR Center PA 1344 3 MB/RC/WW FF/SD 1 448 5 NA 19932 448 8 NA 19933 448 8 NA 19934 Foster Wheeler Charleston RR SC 600 2 MB/WW ESP/SD 2 300 44 NA 19904 Nashville Thermal Transfer Corp. TN 1050 3 MB/WW ESP 3 350 143 NA 1994
Table A-1Test Data Used for 1993 National Dioxin Estimates for MWCs (Continued)A-8TotalAirDioxin/FuransPlant Pollution Combustor (ng/dscm @ 7% O 2 )Capacity Number <strong>of</strong> Combustor Control Combustor CapacityRegion Unit Name State (tpd) Combustors Type Devices Number (tpd) Total TEQaYear3 Alex<strong>and</strong>ria/Arlington RRF VA 975 3 MB/WW ESP/DSI 1 325 14eNA 1987CI3 325 18eNA 19933 Hampton (NASA) Refuse-fired Steam Gen. VA 200 2 MB/WW ESP 1 100 102 2.520 19923 Harrisonburg RRF VA 100 2 MB/WW ESP 1 50 8459 115.000 19943 I-95 Energy RRF (Fairfax) VA 3000 4 MB/WW FF/SD 1 750 9 0.230 19932 750 6 0.170 19933 750 8 0.200 19934 750 7 0.150 19933 Norfolk Navy Yard VA 2000 4 RDF ESP 1 500 21129 429.000 19932 500 32237 595.000 19933 500 42955 1500.000 19944 500 26360 800.000 19935 LaCrosse Co. WI 400 2 RDF/FB DSI/EGB 1 200 63 NA 19935 St. Croix Co. WTE Fac. WI 115 3 MOD/SA 1 38 8 NA 1988a Dioxin concentrations are listed both in units <strong>of</strong> ng/dscm total mass <strong>and</strong> ng/dscm TEQ where both were available. The TEQ concentration data were used for TEQ emissionscalculations where TEQ data were available, <strong>and</strong> where TEQ data were not available a conversion ratio <strong>of</strong> 50:1 (total:TEQ) was used to convert the total mass data to TEQ.b Pinellas data are average <strong>of</strong> three separate tests done during one year.c Akron data were <strong>from</strong> 1994 test, <strong>and</strong> assumed to be representative <strong>of</strong> Akron pre-1994. MWC Survey discussion indicates that high ESP temperature was reported.d Montegomery North/South data (except for Unit No. 3 at North) are an average value determined based on numerous tests.e Alex<strong>and</strong>ria data in MWC survey were <strong>from</strong> a test run without carbon injection. Since the unit has carbon injection, an additional reduction <strong>of</strong> 75% was assumed.NA = Data not available
document EPA-450/3-89-27e "Municipal Waste Combustors - Background Information for3Proposed Guidelines for Existing Facilities" (this document presented the results <strong>of</strong> a study onAPCD retr<strong>of</strong>its on MWC units). Default values were generated for every MWC combustor type<strong>and</strong> APCD configuration for which a default value was needed. Test data available to OAQPS, as<strong>of</strong> January 15, 1995, were organized into groups based on MWC combustor type <strong>and</strong> APCDconfigurations <strong>and</strong> averaged. These averages were designated as the default values for thecorresponding combustor/APCD configurations. For the combustor/APCD configurations wherethere were no test data available, default values were obtained <strong>from</strong> the MWC section in AP-42, 4or <strong>from</strong> EPA document EPA-450/3-89-27e. A summary <strong>of</strong> the default values is given inTable A-2.To estimate annual emissions, a capacity factor for each unit is needed. This factor represents thepercentage <strong>of</strong> operational time a plant has operated during one year. By using the capacity factor<strong>and</strong> unit capacity, the annual throughput (combustion) <strong>of</strong> MSW or RDF can be calculated. Somefacilities provided data to OAQPS on the tonnage <strong>of</strong> municipal waste burned in year 1993. Forthese facilities, a capacity factor was estimated by dividing the tonnage burned in one year by theunit s rated yearly capacity <strong>and</strong> was used for the 1993 emissions calculation. For most units,however, the capacity factors used were default values taken <strong>from</strong> EPA documentEPA-450/3-89-27e. For all units except modular/starved-air combustors, the default capacityfactor was 91 percent (0.91). For modular/starved-air units, the default capacity factor was74 percent (0.74).For many test results <strong>and</strong> for all dioxin default concentrations, TEQ concentrations were notavailable. Similar to the development <strong>of</strong> the default dioxin concentrations, a default total mass-to-TEQ ratio was also developed. Test results <strong>from</strong> units for which there were both total mass <strong>and</strong>TEQ results available were used to develop a default ratio <strong>of</strong> total dioxin concentration to TEQconcentration. The total:TEQ ratios <strong>from</strong> these units were averaged, resulting in a default ratio <strong>of</strong>A-9
Table A-2Default Dioxin/Furan Emission LevelsFrom MWC ConfigurationsaAverage Dioxin ValueCombustor Type APCD Type (ng/dscm @ 7% O 2, total mass)MB/WW ESP* 222DSI/ESP 60DSI/FF 35SD/ESP 70SD/FF 16RDF (all except FB) ESP* 240DSI/FF 17SD/ESP 9SD/FF 8RDF/FB DSI/EGB 63MB/RC/WW ESP* 400DSI/ESP 100DSI/FF 7SD/ESP 40SD/FF 5MB/REF ESP* 500DSI/ESP 57DSI/FF 17SD/ESP 40SD/FF 5MOD/SA Uncontrolled 300ESP* 288DSI/ESP 98DSI/FF 8SD/ESP 40SD/FF 5MOD/EA Uncontrolled 200ESP* 468DSI/ESP 50DSI/FF 8SD/FF 92a Values presented in this table are averages <strong>of</strong> available data for various combustor type/APCD type combinations.Values were estimated based on a compilation <strong>of</strong> the MWC survey data, background information for the 1991 <strong>and</strong>1994 MWC rulemakings, public comments received on the 1994 MWC rulemaking, <strong>and</strong> AP-42 (5th edition). None<strong>of</strong> the data listed provides credit for supplemental dioxin control (polishing) by carbon injection. The use <strong>of</strong> carboninjection typically reduces dioxin emissions by an additional 75 percent or more. (See Air Docket A-90-45, itemsVI-B-013 <strong>and</strong> VI-B-014).* ESP operated at less than 440 F.APCD = air pollution control device MOD = modularDSI = duct sorbent injection RC = rotary combustorEA = excess air RDF = refuse derived fuelEGB = electrified gravel bed REF = refractory wallESP = electrostatic precipitator SA = starved airFB = fluidized bed SD = spray dryerFF = fabric filter WW = waterwallMB = mass burnA-10
50:1. This ratio was used for estimating TEQ emissions for all sources where TEQ test data werenot available.The F factor is a st<strong>and</strong>ard conversion factor used in combustion calculations to determinedexhaust flowrates based on heat input. Full documentation <strong>of</strong> F factors is given in 40 CFR 60,dAppendix A, Method 19. The specific F factor for municipal waste combustion, given bydMethod 19, is 9,570 dry st<strong>and</strong>ard cubic feet <strong>of</strong> flue gas per million Btu (dscf/MMBtu) <strong>of</strong>municipal waste combustion. This flow rate is based on 0 percent O in the flue gases.2Average heating values for fuels derived <strong>from</strong> municipal wastes are given in the RefuseCombustion section <strong>of</strong> AP-42. For unprocessed municipal solid waste (MSW), the heating valueis 4,500 Btu per pound. For RDF, the heating value is 5,500 Btu per pound. The heating valuefor RDF is higher than general MSW because RDF goes through some degree <strong>of</strong> pre-processingto remove non-combustible materials.The first step in calculating annual dioxin emissions <strong>from</strong> MWCs was to calculate the emissions<strong>from</strong> individual units. This task was accomplished with plant-specific information such as dioxinemission concentration, unit size, unit capacity factor, fuel heating value, <strong>and</strong> the F factor. dThe following equation was used to convert dioxin stack concentrations (total <strong>and</strong> TEQ) to gramsper year (g/yr) emitted:<strong>Emissions</strong>gyrC x V x T x CF10 9where:<strong>Emissions</strong> = Annual dioxin emissions (g/yr)C = Flue Gas Dioxin Concentration (ng/dscm @7 percent O ) 2V = Volumetric Flow Factor (dscm @7 percent O /ton waste fired)2A-11
T = Tons <strong>of</strong> MSW burned/year (@100 percent capacity for 365days/year)CF = Capacity Factor (unitless)The volumetric flow factor (V) is calculated as follows:VF d x HV x 2000 x 10 635.31x20.920.9 7where:HV = Heating Value (4,500 BtulbBtufor MSW <strong>and</strong> 5,500lbfor RDF)V =9,570 dscf @ 0% O 2MMBtu35.31 dscfdscm4,500 Btulb10 6 BtuMMBtu2,000 lbtonx20.920.9 7= 3,668 dscm @ 7%O 2ton MSWfor non RDF unitsV =9,570 dscf @ 0% O 2MMBtu35.31 dscfdscm5,500 Btulb10 6 BtuMMBtu2,000 lbtonx20.920.9 7= 4,482 dscm @ 7%O 2ton RDFfor RDF unitsA-12
Example CalculationFor a mass burn/waterwall (non-RDF) unit, rated at 500 tons/day capacity (365,000 tons/yr), witha dioxin concentration <strong>of</strong> 10 ng/dscm (total mass) @7 percent O , annual dioxin emissions are2calculated to be:10 ngdscm@ 7% O2= 6.1 g dioxin/yr (total mass), or= 6.1/50 = 0.12 g dioxin/yr (TEQ)dscm @ 7% O23,670ton10 9 ngg182,500 tonyr0.91Individual emission estimates were developed for all operational MWCs in the U.S., <strong>and</strong> theindividual estimates were summed to provide the 1993 national CDD/CDF emissions estimate forMWCs.The 1995 CDD/CDF estimate is based on the same data <strong>and</strong> methodology as that used to developthe 1993 estimate. To develop the 1995 estimate, data for 11 facilities were adjusted to reflectreduced emissions levels. During the 1993 inventory, 11 facilities were found to have elevateddioxin emission concentrations <strong>and</strong> corrective actions were initiated at these MWCs to reduceemissions. The 1995 CDD/CDF emissions estimate incorporates the expected emissionsreductions at these facilities after corrective actions have been taken. The development <strong>of</strong> the1995 CDD/CDF estimate is discussed in detail in Reference 1.The national emissions estimate <strong>of</strong> 2,3,7,8-TCDD TEQ <strong>from</strong> MWCs is 1.61 lb/yr.A-13
MEDICAL WASTE INCINERATIONBasis for Calculation2There are approximately 3,400 medical facilities in the United States. Using facility capacities, it5was estimated that about 846,000 tons <strong>of</strong> medical waste were incinerated in 1995. The nationaldioxin/furan emissions estimates for medical waste incinerations (MWIs) were obtained directly<strong>from</strong> work done by EPA's Emission St<strong>and</strong>ards Division (ESD) to support Maximum Achievable6Control Technology (MACT) st<strong>and</strong>ards for this source category. A summary <strong>of</strong> the methodsused to determine the estimates are provided here. More detailed information on the derivation <strong>of</strong>the estimates can be obtained <strong>from</strong> Reference 6.The starting point for the national estimates is a 1995 inventory <strong>of</strong> existing MWIs, which includesfor each MWI the location, type (batch or non-batch), <strong>and</strong> the design capacity <strong>of</strong> the unit. Theinformation used to develop the inventory was taken <strong>from</strong> a number <strong>of</strong> sources including a listing<strong>of</strong> MWIs prepared by the American Hospital Association (AHA), state air permits gathered byEPA, <strong>and</strong> a survey <strong>of</strong> MWIs in California <strong>and</strong> New York conducted by EPA in 1995. The AHAinventory was itself taken <strong>from</strong> two sources; an EPA "<strong>Locating</strong> <strong>and</strong> <strong>Estimating</strong>" document <strong>and</strong> avendor listing. Once this information was compiled, the inventory was reviewed <strong>and</strong> modifiedbased on updates <strong>from</strong> state surveys, commercial sources, <strong>and</strong> MWI vendors.The capacity <strong>of</strong> each MWI was provided in the inventory. The capacities for the continuous <strong>and</strong>intermittent MWIs in the inventory were expressed in terms <strong>of</strong> an hourly charging rate in poundsper hour (lb/hr). Batch MWI capacities were provided in pounds per batch (lb/batch). Therefore,batch MWIs were evaluated separately <strong>from</strong> the continuous <strong>and</strong> intermittent MWIs <strong>and</strong> the batchcapacities were not converted to hourly burning rates. 6Also included in the inventory was the applicable state particulate matter (PM) emission limit foreach MWI. The AHA listing <strong>of</strong> MWIs <strong>and</strong> the state air permits included PM limits for each MWI.A-14
Where PM limits were not listed, limits were applied based on State regulatory requirements usingthe same methods described in the MACT floor analysis for the proposed st<strong>and</strong>ards. PM limitscould be used to estimate the type <strong>of</strong> emission control at MWIs for which the control was notidentified for the MWI.Nationwide MWI emissions were calculated by first calculating MWI emissions on a unit specificbasis using the MWI inventory <strong>and</strong> considering unit specific parameters. Actual emission controldata was used where available <strong>and</strong> was estimated when not available. In calculating emissions <strong>and</strong>estimating operating parameters, there are three distinct types <strong>of</strong> MWIs as follows: batch,intermittent, <strong>and</strong> continuous. The difference in these three MWI types is in the methods <strong>of</strong>charging waste to the MWI <strong>and</strong> removing ash <strong>from</strong> the primary chamber <strong>of</strong> the MWI.Continuous MWIs, which are the largest <strong>of</strong> the three types, have mechanical ram feeders <strong>and</strong>continuous ash removal systems. These features allow the unit to operate 24 hours per day formany days at a time. Most intermittent MWIs also have mechanical ram feeders that chargewaste into the primary chamber. However, intermittent MWIs do not have an automatic ashremoval system, <strong>and</strong> can only be operated for a limited number <strong>of</strong> hours before the unit must beshut down for ash removal. In batch MWIs, all <strong>of</strong> the waste to be burned is loaded into theprimary chamber <strong>and</strong>, once the burning cycle begins, no additional waste is loaded. After the burncycle for a batch unit is complete <strong>and</strong> the unit has cooled down, the ash is removed manually. Inthe inventory <strong>of</strong> existing MWIs used to estimate the nationwide dioxin emissions, a differentiationwas made between batch <strong>and</strong> nonbatch (continuous <strong>and</strong> intermittent) MWIs. However, nodistinction was made between continuous <strong>and</strong> intermittent MWIs in the final inventory. 6The hours <strong>of</strong> operation were estimated for each MWI type in the inventory in order to determinethe annual waste incinerated. The hours <strong>of</strong> operation were defined as the hours during which theMWI combusts waste.For batch MWIs, it is estimated that a typical MWI charges waste 160 times per year (i.e., 160batches/yr; 3 batches per week). The amount <strong>of</strong> waste burned each year in a batch unit <strong>and</strong> theA-15
yearly emissions produced depend primarily on the unit capacity <strong>and</strong> the annual number <strong>of</strong>batches. Because <strong>of</strong> this relationship, it was unnecessary to determine the actual hours <strong>of</strong>operation for batch MWIs.For continuous <strong>and</strong> intermittent MWIs, operating hours were estimated for three size categories( 500, 501 to 1,000, <strong>and</strong> >1,000 lb/hr). All MWIs with capacities less than 500 lb/hr wereassumed to be intermittent MWIs. The waste charging hours for intermittent MWIs withcapacities less than 500 lb/hr were estimated at 1,250 hours per year (hr/yr). Since the inventorydoes not indicate whether an MWI is continuous or intermittent, a ratio <strong>of</strong> about 3 to 1,intermittent to onsite continuous, was used to estimate the hours <strong>of</strong> operation for onsitecontinuous <strong>and</strong> intermittent MWIs with capacities greater than 500 lb/hr. The average operatinghours for continuous MWIs in the 501 to 1,000 lb/hr size category was 2,916 hr/yr <strong>and</strong> theaverage charging hours for intermittent MWIs in this size category was 1,500 hr/yr. Theweighted average <strong>of</strong> the charging hours for the combined continuous <strong>and</strong> intermittent MWIs wasdetermined as follows:(1,500 hr/yr x 0.77) + (2,916 hr/yr x 0.23) = 1,826 hr/yrLarge MWIs with design capacities greater than 1,000 lb/hr were estimated to operate 2,174 hr/yr<strong>and</strong> all commercial MWIs were estimated to operate 7,776 hr/yr. A summary <strong>of</strong> the wastecharging hours for the continuous <strong>and</strong> intermittent MWIs is presented below. 6Charging Hours Capacity FactorMWI Capacity (hr/yr) (%)1,000 lb/hr 2,174 40All commercial MWIs 7,776 89NOTE:"Capacity factor" means ratio <strong>of</strong> tons <strong>of</strong> waste actually burned per yeardivided by the tons <strong>of</strong> waste that could be burned per year had the unit benoperating at full capacity.A-16
A capacity factor represents the percentage <strong>of</strong> operational time a MWI has operated in 1 year.Capacity factors were calculated for each MWI size category based on the ratio <strong>of</strong> the actualannual charging hours to the maximum annual charging hours. For intermittent MWIs, themaximum annual charging hours were estimated to be 4,380 hr/yr. This is based on 12 charginghours per day <strong>and</strong> 365 days per year because intermittent MWIs must shut down for daily ashremoval. The maximum annual charging hours for continuous MWIs were estimated to be8,760 hr/yr based on 24 charging hours per day <strong>and</strong> 365 days per year. All commercial MWIswere assumed to be continuous units. The maximum annual charging hours for onsite MWIs withcapacities greater than 500 lb/hr were estimated to be 5,475 hr/yr, based on the 3 to 1 ratio <strong>of</strong>intermittent to onsite continuous MWIs discussed previously. The calculated capacity factors foreach MWI size category are shown in the box on the previous page.Waste charging rates measured during emissions tests show the average hourly charging rates tobe about two-thirds <strong>of</strong> the MWI design rates specified by incinerator manufacturers. Therefore,waste was assumed to be charged at two-thirds <strong>of</strong> the MWI design capacity. Using the operatinghours per year (or number <strong>of</strong> batches per year for batch units) <strong>and</strong> the corrected waste charge rate(two-thirds <strong>of</strong> the design rate), the amount <strong>of</strong> waste burned annually was determined for eachMWI.Actual emission control data was used where available <strong>and</strong> was estimated when necessary. Whenemission control system type was unknown it was estimated based on (1) the average PMemission rates for the different types <strong>of</strong> emission controls <strong>and</strong> (2) the PM limit to which the MWIis subject. For example, the average PM emission rate for intermittent <strong>and</strong> continuous MWIs with1/4-second combustion control was estimated <strong>from</strong> test data to be 0.30 grains per dry st<strong>and</strong>ardcubic feet (gr/dscf). Thus, any MWI with a PM emission limit greater than 0.30 gr/dscf wasassumed to have a 1/4-second combustion system. The PM emission limit ranges for all <strong>of</strong> theemission controls are shown below.A-17
PM Emission Limit (gr/dscf at 7% O )Intermittent <strong>and</strong> continuous MWIs2Assumed Level <strong>of</strong> Emission Control0.3 1/4-sec combustion control0.16 x
In combination with the MWI parametric data, control technology data, <strong>and</strong> emission factors thefollowing equation calculates the annual dioxin emissions <strong>from</strong> each MWI in the MWI inventory:Where:<strong>Emissions</strong> = (C x H x C ) x F x Q1<strong>Emissions</strong> = Annual dioxin emissions, g/yrC = MWI capacity, lb/hrH = Charging hours, hr/yrC = Ratio <strong>of</strong> waste charging rate to design capacity, 2:31F = Emission factor for the appropriate level <strong>of</strong> control(lb dioxin/lb waste charged), <strong>and</strong>Q = Conversion factor for pounds to grams, 453.6 grams/lb.The CDD/CDF emissions <strong>from</strong> the individual MWIs in the inventory were calculated bymultiplying the annual amount <strong>of</strong> waste burned by the appropriate emission factor <strong>from</strong>Table A-3. Next, the annual emissions <strong>from</strong> each MWI were summed to estimate the total 1995CDD/CDF emissions <strong>from</strong> MWIs. CDD/CDF emissions <strong>from</strong> MWIs in 1995 are estimated to be16 pounds on a total mass basis <strong>and</strong> 0.332 pounds on a 2,3,7,8-TCDD TEQ basis. 6A-19
SEWAGE SLUDGE INCINERATIONBasis for Calculation2In 1995, there were 143 operating sewage sludge facilities in the United States, <strong>and</strong> more than780 percent <strong>of</strong> the facilities were multiple hearth incinerators. In 1992, approximately9.5x105 2tons <strong>of</strong> dry sewage sludge were incinerated. Emission factors for 2,3,7,8-TCDD <strong>and</strong>2,3,7,8-TCDF <strong>from</strong> a multiple hearth incinerator with an impingement tray scrubber in place were7obtained <strong>from</strong> AP-42. The emission factors were multiplied by the tons <strong>of</strong> sludge incinerated toestimate emissions.2,3,7,8-TCDD 2,3,7,8-TCDF 2,3,7,8-TCDD TEQActivity Level Emission Factor Emission Factor Emission Factor59.5x10-91.0x10-73.6x10-85.57x10ton incinerated lb/ton sludge lb/ton sludgelb/ton sludgeincineratedincineratedincineratedExample Calculation2,3,7,8 TCDD national emissions estimate = (9.5 x 10 5 ton/yr incinerated)x (1.0 x 10 9 lb/ton incinerated)= 9.5 x 10 4 lb/yr2,3,7,8 TCDF national emissions estimate = (9.5 x 10 5 ton/yr incinerated)x (3.6 x 10 7 lb/ton incinerated)= 3.42 x 10 1 lb/yr2,3,7,8 TCDD TEQ national emissions estimate = (9.5 x 10 5 ton/yr incinerated)x (5.57 x 10 8 lb/ton incinerated)= 5.29 x 10 2 lb/yrA-20
HAZARDOUS WASTE INCINERATIONBasis for CalculationThe activity data for dioxins/furans were derived <strong>from</strong> total quantities <strong>of</strong> hazardous wastegenerated. In 1992, approximately 249 million metric tons (274 million tons) <strong>of</strong> hazardous waste2were generated. It is estimated that <strong>of</strong> the total amount <strong>of</strong> hazardous waste generated, only1.3 million metric tons (1.43 million tons) were burned in dedicated hazardous waste facilities,<strong>and</strong> 1.2 million metric tons (1.32 millon tons) were burned in boilers <strong>and</strong> industrial furnaces(BIFs). 8Emission factors reported in Section 4.1.4 <strong>of</strong> this document for hazardous waste incinerators <strong>and</strong>the activity data reported in Reference 2 were used to estimate national emissions <strong>of</strong>2,3,7,8-TCDD/TCDF. The factors were developed <strong>from</strong> testing performed at the EPA'sIncineration Research Facility designed to evaluate PCB destruction <strong>and</strong> removal efficiency. Thewaste feed during testing was PCB-contaminated sediments. The test incinerator was equippedwith a venturi scrubber followed by a packed column scrubber. The activity level <strong>and</strong> emissionfactor were multiplied to calculate national 2,3,7,8-TCDD/TCDF emissions <strong>from</strong> hazardous wasteincinerators.2,3,7,8-TCDF EmissionActivity Level 2,3,7,8-TCDD Emission Factor Factor61.43x10-101.68x10-81.91x10ton incinerated lb/ton waste incinerated lb/ton waste incineratedCalculations2,3,7,8 TCDD national emissions estimate = (1.68 x 10 10 lb/ton waste incinerated)x (1.43 x 10 6 ton/yr waste incinerated)= 2.40 x 10 4 lb/yrA-21
2,3,7,8 TCDF national emissions estimate = (1.91 x 10 8 lb/ton waste incinerated)x (1.43 x 10 6 ton/yr waste incinerated)= 0.0273 lb/yrThe national emissions estimate for 2,3,7,8-TCDD TEQ <strong>from</strong> HWIs was developed as part <strong>of</strong>recent EPA regulatory programs for hazardous waste combustors. The TEQ estimate is 22grams/yr (0.049 lb/yr) <strong>and</strong> represents 1996 emissions. 9,10A-22
LIGHTWEIGHT AGGREGATE KILNS (LWAKs)Basis for CalculationThe national emissions for LWAKs was obtained <strong>from</strong> an EPA document that presents national10,11emissions estimates for hazardous waste combustor systems. The document presents an-3estimate <strong>of</strong> 6.92x10 lb/yr <strong>of</strong> 2,3,7,8-T-CDD TEQ emissions <strong>from</strong> LWAKs.A-23
PORTLAND CEMENTBasis for CalculationNational emissions estimates for the Portl<strong>and</strong> cement source category were developed for kilnsburning non-hazardous waste (NHW) <strong>and</strong> for kilns burning hazardous waste (HW). The estimatefor NHW kilns was taken directly <strong>from</strong> estimates prepared by the EPA to support the Portl<strong>and</strong>12,13Cement Manufacturing Industry NESHAP st<strong>and</strong>ards program. The estimate for HW kilns wasobtained <strong>from</strong> an EPA document that presents national emissions estimates for hazardous waste10,11combustor systems. The details <strong>of</strong> the estimation process <strong>and</strong> the data used to developnational estimates can be found in References 10 <strong>and</strong> 13.Non-Hazardous Waste (NHW) Kilns<strong>Emissions</strong> <strong>from</strong> NHW kilns were only estimated on the basis <strong>of</strong> a dioxin/furan TEQ. AverageTEQ concentrations were determined <strong>from</strong> actual test data for existing facilities <strong>of</strong> varying types,design, <strong>and</strong> control configurations. An average TEQ concentration <strong>of</strong> 0.25 ng/dry st<strong>and</strong>ard cubicmeter (dscm) <strong>of</strong> flow was determined <strong>and</strong> used to calculate national emissions. The national kilnclinker production rate used in the calculation was 67.6 million tons <strong>of</strong> clinker produced per year<strong>from</strong> NHW kilns. Additional information used in the calculation were 66,225 dscf <strong>of</strong> flow/ton dryfeed material <strong>and</strong> 1.65 ton dry feed/ton <strong>of</strong> clinker produced. The values for these variables areincluded in the Technical Background Document for the st<strong>and</strong>ard. The equation used to calculatethe national emissions estimate <strong>from</strong> NHW kilns is as follows: 12ngdscm x m 335.3 ft 3 x g10 9 ng x lb454 gx66,225 dscfton dry feed x1.65ton dry feedton clinkerxton clinkeryrlb TEQyrA-24
The national estimate <strong>of</strong> 2,3,7,8-TCDD TEQ emissions <strong>from</strong> NHW kilns is 0.12 lb/yr.Hazardous Waste KilnsThe national emissions for HW kilns was obtained <strong>from</strong> an EPA document that presents national10,11emissions estimates for hazardous waste combustor systems. This document presents anestimate <strong>of</strong> 0.13 lb/yr <strong>of</strong> 2,3,7,8-TCDD TEQ emissions <strong>from</strong> HW kilns.A-25
WASTE TIRE INCINERATIONBasis for CalculationEmission factors for 2,3,7,8-TCDD/TCDF emissions <strong>from</strong> waste tire incineration (tire-to-energyfacility using a spray dryer, flue gas desulfurization followed by a fabric filter) were obtained <strong>from</strong>14 5source testing. A national estimate <strong>of</strong> 5.5 x 10 tons <strong>of</strong> waste tires incinerated per year was15obtained <strong>from</strong> EPA's Office <strong>of</strong> Solid Waste. The activity data <strong>and</strong> emission factors weremultiplied to calculate national 2,3,7,8-TCDD/TCDF emissions <strong>from</strong> waste tire incinerators.2,3,7,8-TCDD 2,3,7,8-TCDF 2,3,7,8-TCDD TEQActivity Level Emission Factor Emission Factor Emission Factor55.5 x 10-112.16 x 10-115.42 x 10-91.08 x 10ton tires lb/ton tires incinerated lb/ton tires incinerated lb/ton tires incineratedincineratedCalculation2,3,7,8 TCDD national emissions estimate = (5.5 x 10 5 ton/yr tires incinerated)x (2.16 x 10 11 lb/ton tires incinerated)= 1.19 x 10 5 lb/yr2,3,7,8 TCDF national emissions estimate = (5.5 x 10 5 ton/yr tires incinerated)x (5.42 x 10 11 lb/ton tires incinerated)= 2.98 x 10 5 lb/yr2,3,7,8 TCDD TEQ national emissions estimate = (5.5 x 10 5 ton/yr tires incinerated)x (1.08 x 10 9 lb/ton tires incinerated)= 5.94 x 10 4 lb/yrA-26
UTILITY COAL COMBUSTIONBasis for CalculationThe national 2,3,7,8-TCDD, 2,3,7,8-TCDF, <strong>and</strong> 2,3,7,8-TCDD TEQ emissions estimates <strong>and</strong>factors for utility coal combustion were obtained <strong>from</strong> an EPA study on toxic pollutants <strong>from</strong>16utility boilers conducted over the past several years. The EPA is conducting this study inresponse to a Clean Air Act m<strong>and</strong>ate to prepare a Report to Congress on toxic emissions <strong>from</strong>utility sources. It is important to note that these data are preliminary <strong>and</strong> have not yet beenfinalized by the EPA. Also, the factors do not represent a specific source but are composites <strong>of</strong>individual factors for various furnace configurations <strong>and</strong> control devices. The factors <strong>and</strong>estimates developed <strong>from</strong> the utility boiler study are presented below.1990 1990Emission Factor Emission Estimate Emission EstimateCDD/CDF (lb/trillion Btu) (ton/yr) (lb/yr)-4 -52,3,7,8-TCDD 1.6 x 10 1.4 x 10 0.028-6 -52,3,7,8-TCDF 3.9 x 10 3.4 x 10 0.068-42,3,7,8-TCDD TEQ Not reported 1.5 x 10 0.30Note: These values are draft estimates <strong>and</strong> have not been finalized by the EPA.A-27
UTILITY RESIDUAL OIL COMBUSTIONBasis for CalculationThe national 2,3,7,8-TCDD, 2,3,7,8-TCDF, <strong>and</strong> 2,3,7,8-TCDD TEQ emissions estimates <strong>and</strong>factors for utility residual oil combustion were obtained <strong>from</strong> an EPA study on toxic pollutants16<strong>from</strong> utility boilers conducted over the past several years. The EPA is conducting this study inresponse to a Clean Air Act m<strong>and</strong>ate to prepare a Report to Congress on toxic emissions <strong>from</strong>utility sources. It is important to note that these data are preliminary <strong>and</strong> have not yet beenfinalized by the EPA. Also, the factors do not represent a specific source but are composites <strong>of</strong>individual factors for various furnace configurations <strong>and</strong> control devices. The factors <strong>and</strong>estimates developed <strong>from</strong> the utility boiler study are presented below.Emission Factor 1990 Emission 1990 <strong>Emissions</strong>CDD/CDF (lb/trillion Btu) Estimate (ton/yr) 9 Estimate (lb/yr)-6 -62,3,7,8-TCDD 6.5 x 10 4.0 x 10 0.008-6 -62,3,7,8-TCDF 4.6 x 10 2.9 x 10 0.0058-52,3,7,8-TCDD TEQ Not Reported 1.1 x 10 0.022Note: These values are draft estimates <strong>and</strong> have not been finalized by the EPA.A-28
INDUSTRIAL WOOD COMBUSTIONBasis for CalculationEmission factors for 2,3,7,8-TCDD <strong>and</strong> 2,3,7,8-TCDF emissions <strong>from</strong> industrial woodcombustion were obtained <strong>from</strong> source test data <strong>and</strong> used to estimate national emissions. The2emission factors represent the average <strong>of</strong> two processes, controls, <strong>and</strong> fuel types. Data <strong>from</strong> thenine boilers tested by the National Council <strong>of</strong> the Paper Industry for Air <strong>and</strong> StreamImprovements, Inc. (NCASI) were used to develop the 2,3,7,8-TCDD TEQ emission factor that17was used to estimate national emissions. A national estimate <strong>of</strong> the amount <strong>of</strong> wood combusted18in industrial boilers was obtained <strong>from</strong> the Department <strong>of</strong> Energy. The activity data <strong>and</strong> theemission factor were multiplied to calculate national 2,3,7,8-TCDD/TCDF emissions <strong>from</strong>industrial wood combustion.2,3,7,8-TCDD 2,3,7,8-TCDF 2,3,7,8-TCDD TEQActivity Level Emission Factor Emission Factor Emission Factor79.06 x 10-117.34 x 10-101.05 x 10-92.48 x 10ton dry wood lb/ton dry wood burned lb/ton dry wood burned lb/ton dry wood burnedburnedExample Calculation2,3,7,8 TCDD TEQ national emissions estimate = (9.06 x 10 7 ton/yr dry wood burned)x (2.48 x 10 9 lb/ton dry wood burned)= 2.25 x 10 1 lb/yr2,3,7,8 TCDD national emissions estimate = (9.06 x 10 7 ton/yr dry wood burned)x (7.34 x 10 11 lb/ton dry wood burned)= 6.65 x 10 3 lb/yrA-29
2,3,7,8 TCDF national emissions estimate = (9.06 x 10 7 ton/yr dry wood burned)x (1.05 x 10 10 lb/ton dry wood burned)= 9.51 x 10 3 lb/yrA-30
RESIDENTIAL COAL COMBUSTIONBasis for CalculationEmission factors based on dioxin/furan concentrations in soot samples collected <strong>from</strong> seven coalfurnaces <strong>and</strong> AP-42 particulate matter (PM) emission factors were obtained for both bituminous2<strong>and</strong> anthracite coal combustion. For the purposes <strong>of</strong> estimating emissions, it was assumed thatthe concentrations <strong>of</strong> CDD/CDF in the PM emitted <strong>from</strong> residential coal combustion are the sameas those measured in the soot samples. A 1990 national estimate <strong>of</strong> the amount <strong>of</strong> residential19coal combusted for the two coal types was obtained <strong>from</strong> the Department <strong>of</strong> Energy report. Theactivity levels <strong>and</strong> emission factors for the two coal types were multiplied <strong>and</strong> then added togetherto estimate national 2,3,7,8-TCDD/TCDF emissions <strong>from</strong> residential coal combustion.2,3,7,8-TCDD 2,3,7,8-TCDF 2,3,7,8-TCDD TEQActivity Level Emission Factor Emission Factor Emission Factor61.93 x 10 ton-94.79 x 10 lb/ton-71.26 x 10 lb/ton-71.97 x 10 lb/tonbituminous coal bituminous coal burned bituminous coal burned bituminous coal burned57.32 x 10 ton-93.20 x 10 lb/ton-88.39 x 10 lb/ton-71.20 x 10 lb/tonanthracite coal anthracite coal burned anthracite coal burned anthracite coal burnedNote: These values are draft estimates <strong>and</strong> have not been finalized by the EPA.A-31
Calculation2,3,7,8 TCDD national emissionsestimate, bituminuous coal= (4.79 x 10 9 lb/ton bituminous coal burned)x (1.93 x 10 6 ton/yr bituminous coal burned)= 9.24 x 10 3 lb/yr2,3,7,8 TCDD national emissionsestimate, anthracite coal= (3.20 x 10 9 lb/ton anthracite coal burned)x (7.32 x 10 5 ton/yr anthracite coal burned)= 2.34 x 10 3 lb/yr2,3,7,8 TCDD national emissionsestimate (both coal types)= 2.34 x 10 3 lb/yr 9.24 x 10 3 lb/yr= 1.16 x 10 2 lb/yr2,3,7,8 TCDF national emissionsestimate, bituminuous coal= (1.93 x 10 6 ton/yr bituminous coal burned)x (1.26 x 10 7 lb/ton bituminous coal burned)= 2.43 x 10 1 lb/yr2,3,7,8 TCDF national emissionsestimate, anthracite coal= (7.32 x 10 5 ton/yr anthracite coal burned)x (8.39 x 10 8 lb/ton anthracite coal burned)= 6.14 x 10 2 lb/yr2,3,7,8 TCDF national emissionsestimate (both coal types)= 2.43 x 10 1 lb/yr 6.14 x 10 2 lb/yr= 3.05 x 10 1 lb/yrA-32
2,3,7,8 TCDD TEQ national emissionsestimate, bituminuous coal= (1.93 x 10 6 ton/yr bituminous coal burned)x (1.97 x 10 7 lb/ton bituminous coal burned)= 3.80 x 10 1 lb/yr2,3,7,8 TCDD TEQ national emissionsestimate, anthracite coal= (7.32 x 10 5 ton/yr anthracite coal burned)x (1.20 x 10 7 lb/ton anthracite coal burned)= 8.78 x 10 2 lb/yr2,3,7,8 TCDD TEQ national emissionsestimate (both coal types)= 3.80 x 10 1 lb/yr 8.78 x 10 2 lb/yr= 4.68 x 10 1 lb/yrA-33
RESIDENTIAL DISTILLATE FUEL OIL COMBUSTIONBasis for CalculationEmission factors based on dioxin/furan concentrations in soot samples collected <strong>from</strong> 21 distillatefuel oil-fired furnaces used in central heating <strong>and</strong> AP-42 particulate emission (PM) factors for2,4residential distillate oil-fired furnaces were obtained. For the purpose <strong>of</strong> estimating emissions, itwas assumed that the concentrations <strong>of</strong> CDD/CDF in the PM emitted <strong>from</strong> residential distillatefuel oil combustion are the same as those measured in the soot samples. 2,3,7,8-TCDD/TCDFisomer specific emission factors <strong>and</strong> homologue totals were used in calculating 2,3,7,8-TCDDTEQs. A 1990 national estimate <strong>of</strong> the amount <strong>of</strong> residential fuel oil combusted was obtained19<strong>from</strong> the Department <strong>of</strong> Energy. The activity data <strong>and</strong> the emission factor were multiplied toestimate national CDD/CDF emissions <strong>from</strong> residential distillate fuel oil combustion.2,3,7,8-TCDD 2,3,7,8-TCDF 2,3,7,8-TCDD TEQActivity Level Emission Factor Emission Factor Emission Factor81.44 x 10 1.96 x 10 lb/10 1.86 x 10 lb/10 5.26 x 10 lb/10barrels burned barrels burned barrels burned barrels burnedCalculation-8 3 -8 3 -8 32,3,7,8 TCDD national emissions estimate = (1.44 x 10 8 barrels/yr burned)x (1.96 x 10 8 lb/10 3 barrels)= 2.82 x 10 3 lb/yr2,3,7,8 TCDF national emissions estimate = (1.44 x 10 8 barrels/yr burned)x (1.86 x 10 8 lb/10 3 barrels burned)= 2.68 x 10 3 lb/yrA-34
2,3,7,8 TCDD TEQ national emissions estimate = (1.44 x 10 8 barrels/yr burned)x (5.26 x 10 8 lb/10 3 barrels burned)= 7.57 x 10 3 lb/yrA-35
RESIDENTIAL WOOD COMBUSTIONBasis for Calculation29.1 million cords (33.8 million tons) <strong>of</strong> wood were combusted in residential wood combustors in20,211990. The nationwide percentage <strong>of</strong> wood consumption is 28 percent for fireplaces <strong>and</strong> 722percent for woodstoves. Of the 72 percent combusted in woodstoves, no more than five percent22is combusted in catalytic <strong>and</strong> noncatalytic stoves. For calculational purposes, it is assumed theremaining 95 percent (<strong>of</strong> the 72 percent) is combusted in conventional woodstoves.The dioxin/furan factors used to estimate emissions <strong>from</strong> residential wood combustion areweighted emission factors that represent fireplace <strong>and</strong> woodstove use. Dioxin/furan emissionestimates attributed to residential wood combustion were based on a methodology developed byEPA's Office <strong>of</strong> Health <strong>and</strong> Environmental Assessment (now named the National Center for23Environmental Assessment). Using two recent studies (conducted in Switzerl<strong>and</strong> <strong>and</strong> Denmark)that reported direct measurement <strong>of</strong> CDD/CDF emissions <strong>from</strong> wood stoves, an average emission-9factor <strong>of</strong> 2 x 10 lb TEQ/ton (1 ng TEQ/kg) was derived.2,3,7,8-TCDD 2,3,7,8-TCDF 2,3,7,8-TCDD TEQActivity Level Emission Factor Emission Factor Emission Factor73.38 x 10-112.55 x 10-108.90 x 10-92.00 x 10ton dry wood lb/ton dry wood burned lb/ton dry wood burned lb/ton dry wood burnedburnedExample Calculation2,3,7,8 TCDD TEQ national emissions estimate = (3.38 x 10 7 ton/yr dry wood burned)x (2.0 x 10 9 lb/ton dry wood burned)= 6.76 x 10 2 lb/yrA-36
2,3,7,8 TCDD national emissions estimate = (3.38 x 10 7 ton/yr dry wood burned)x (2.55 x 10 11 lb/ton dry wood burned)= 8.62 x 10 4 lb/yr2,3,7,8 TCDF national emissions estimate = (3.38 x 10 7 ton/yr dry wood burned)x (8.90 x 10 10 lb/ton dry wood burned)= 3.01 x 10 2 lb/yrA-37
IRON AND STEEL FOUNDRIESBasis for CalculationThe national activity level for iron <strong>and</strong> steel foundries for 1990 is 10,199,820 ton <strong>of</strong> iron/steel2 6product produced. The national activity level estimate for ferrous foundries includes 9.15x10⁶tons <strong>of</strong> iron castings <strong>and</strong> 1.10x10 tons <strong>of</strong> steel castings produced by approximately21100 foundries nationally in 1990. The emission factors used to estimate CDD/CDF emissions24<strong>from</strong> iron <strong>and</strong> steel foundries were derived <strong>from</strong> one facility test report. The test reportquantified emissions <strong>from</strong> a batch-operated cupola furnace charged with pig iron, scrap iron, steelscrap, coke, <strong>and</strong> limestone. Emission control devices in operation during the test were an oil-firedafterburner <strong>and</strong> a baghouse. Fully speciated dioxin/furan pr<strong>of</strong>iles were available to calculate2,3,7,8-TCDD TEQs. The emission factors <strong>and</strong> activity level were multiplied to calculate2,3,7,8-TCDD/TCDF emissions <strong>from</strong> iron <strong>and</strong> steel foundries.2,3,7,8-TCDD 2,3,7,8-TCDF 2,3,7,8-TCDD TEQActivity Level Emission Factor Emission Factor Emission Factor71.02 x 10-102.47 x 10-97.92 x 10-93.68 x 10ton iron/steel lb/ton product lb/ton product lb/ton productproductExample Calculation2,3,7,8 TCDD national emissions estimate = (1.02 x 10 7 ton/yr product)x (2.47 x 10 10 lb/ton product)= 2.52 x 10 3 lb/yr2,3,7,8 TCDF national emissions estimate = (1.02 x 10 7 ton/yr product)x (7.92 x 10 9 lb/ton product)= 8.08 x 10 2 lb/yrA-38
2,3,7,8 TCDD TEQ national emissions estimate = (1.02 x 10 7 ton/yr product)x (3.68 x 10 9 lb/ton product)= 3.75 x 10 2 lb/yrA-39
SECONDARY COPPER SMELTERSBasis for CalculationThe activity data for secondary copper smelters for 1990 is available, but there is no available25emission factor that can be used with the activity data to estimate emissions. Test data areavailable for 2,3,7,8-TCDD <strong>from</strong> one U.S. facility, but it is not possible to develop an emission25factor <strong>from</strong> the data. The test data were used to estimate annual 2,3,7,8-TCDD emissions <strong>from</strong>the single facility, <strong>and</strong> that estimate is reported as the national emissions estimate for thesecondary copper smelting source category in this document. Also, the 2,3,7,8-TCDD emissionsdata were used to calculate an annual 2,3,7,8-TCDD TEQ emissions estimate <strong>and</strong> the estimate ispresented in this document. Thus, it should be noted that the 2,3,7,8,-TCDD TEQ emissionsestimate is based on the 2,3,7,8,-TCDD congener only. <strong>Emissions</strong> <strong>of</strong> other congeners are not26accounted for in the 2,3,7,8-TCDD TEQ estimate because data were not available. Also, itshould be noted that the 2,3,7,8-TCDD <strong>and</strong> 2,3,7,8-TCDD TEQ national emissions estimatepresented in this document represent only one facility.The national emissions estimates for 2,3,7,8-TCDD <strong>and</strong> 2,3,7,8-TCDD TEQ <strong>from</strong> secondary-2 -2copper smelters are 1.36x10 lb/yr <strong>and</strong> 1.36x10 lb/yr, respectively. An estimate for2,3,7,8-TCDF emissions is not available.A-40
SECONDARY LEAD SMELTERSBasis for Calculation27The national activity level for secondary lead smelters for 1990 is 948,000 tons lead produced.National emission estimates were developed using emission factors, control technology, <strong>and</strong>production data compiled under the Secondary Lead Smelting NESHAP program. 28There are three principal furnace types in operation at secondary lead smelting facilities in theU.S.: the blast furnace, the rotary furnace <strong>and</strong> the reverberatory furnace. Emission controltechnologies used include baghouses or a baghouse with a scrubber.Table A-4 lists the emission factors that were used to develop the national CDD/CDF emissionsestimate for secondary lead smelters. The dioxin/furan emission factors were derived <strong>from</strong>29-31industry test reports <strong>of</strong> three facilities representing the three principal furnace types in use.Controlled (baghouse <strong>and</strong> scrubber) <strong>and</strong> uncontrolled (baghouse only) emission factors for eachfurnace type were input into the NESHAP industry database to estimate State level emissions.Fully speciated dioxin/furan pr<strong>of</strong>iles were available to calculate 2,3,7,8-TCDD toxicequivalency. 28Table A-4. Secondary Lead Smelting EmissionFactors (lb/ton Lead Produced)Pollutant Baghouse Outlet Scrubber OutletRotary Furnace-10 -102,3,7,8-TCDD 3.16 x 10 3.96 x 10⁻⁹ -92,3,7,8-TCDF 2.00 x 10 2.00 x 10⁻⁹ -102,3,7,8-TCDD TEQ 1.42 x 10 1.21 x 10⁻⁸ -9Total CDD 1.49 x 10 1.85 x 10⁻⁸ -8Total CDF 5.16 x 10 5.16 x 10A-41
Table A-4. Secondary Lead Smelting EmissionFactors (lb/ton Lead Produced) (Continued)Pollutant Baghouse Outlet Scrubber OutletBlast Furnace-9 -102,3,7,8-TCDD 4.46 x 10 5.38 x 10⁻⁸ -92,3,7,8-TCDF 1.85 x 10 1.97 x 10⁻⁸ -92,3,7,8-TCDD TEQ 1.76 x 10 1.68 x 10⁻⁷ -8Total CDD 2.94 x 10 2.26 x 10⁻⁷ -8Total CDF 5.10 x 10 4.74 x 10Blast/Reverb Furnace-10 -102,3,7,8-TCDD 1.48 x 10 1.75 x 10⁻⁹ -92,3,7,8-TCDF 8.34 x 10 2.88 x 10⁻⁹ -102,3,7,8-TCDD TEQ 2.68 x 10 8.14 x 10⁻⁸ -8Total CDD 1.12 x 10 1.42 x 10⁻⁸ -8Total CDF 7.66 x 10 3.16 x 10The NESHAP estimates for dioxins/furans emissions are as follows:-32,3,7,8-TCDD - 1.95 x 10 lb/yr-22,3,7,8-TCDF - 1.20 x 10 lb/yr-32,3,7,8-TCDD TEQ - 8.49 x 10 lb/yr-1Total CDD - 1.27 x 10 lb/yr-1Total CDF - 2.50 x 10 lb/yrA-42
SECONDARY ALUMINUM SMELTERSBasis for CalculationA national 2,3,7,8-TCDD TEQ emissions estimate for secondary aluminum production was32,33developed <strong>from</strong> data provided by The Aluminum Association to the U.S. EPA. Data thatcould be used to develop mass emissions estimates <strong>of</strong> dioxins/furans were not available.The emissions estimate is based on model processes that represent typical processes <strong>and</strong> emissioncontrols used by the secondary aluminum industry. An annual 2,3,7,8-TCDD TEQ emission ratewas developed for each process/control configuration, based on 8,760 hours <strong>of</strong> operation peryear. In addition, a utilization factor (the percent <strong>of</strong> time that the process is actually in operation)was developed for each configuration <strong>and</strong> the number <strong>of</strong> process units for each configurationwere identified. To estimate actual annual TEQ emissions <strong>from</strong> a process/control, the TEQemission rate (lb/yr) was multiplied by the utilization factor (percent or fraction) <strong>and</strong> the number<strong>of</strong> process units in operation. The data used to develop the emissions estimates are presented inTable A-5.A-43
Table A-5TEQ Emission Utilization NumberProcess Controls Rate (lb/yr) Factor <strong>of</strong> UnitsTEQ<strong>Emissions</strong>(lbs)-2 -1Scrap Dyers Afterburner 1.3x10 0.8 19 2.0x10Scrap Dyers Afterburner/-35.9x10 0.8 5-22.4x10Baghouse-4 -3Delacquering Units Afterburner 1.5x10 0.8 14 1.7x10Delacquering Units Afterburner/-52.0x10 0.8 7-41.1x10Baghouse-4 -2Foundry Side-wells Baghouse 5.1x10 0.7 41 1.5x10⁻³ -1Foundry Side-wells Uncontrolled 4.25x10 0.7 39 1.2x10⁻⁵ -4Nonfoundry Side-wells Uncontrolled 5.6x10 0.8 8 3.6x10⁻⁵ -2Other Reverberatory Furnaces Uncontrolled 5.6x10 0.8 564 2.5x10Total <strong>Emissions</strong> 3.8x10 -1A-44
DRUM AND BARREL RECLAMATION/INCINERATIONBasis for CalculationApproximately 2.8 to 6.4 million 55-gallon drums are reconditioned annually in the United2States. For purposes <strong>of</strong> this report, the average national activity for 1990 is 4,600,000 drums2reclaimed. National emission estimates were made using emission factors developed <strong>from</strong> onefacility test report <strong>and</strong> the reported total number <strong>of</strong> drums thermally reclaimed.2,3,7,8-TCDD/TCDF isomer specific emission factors <strong>and</strong> homologue totals were used incalculating 2,3,7,8-TCDD TEQs.2,3,7,8-TCDD 2,3,7,8-TCDF 2,3,7,8-TCDD TEQActivity Level Emission Factor Emission Factor Emission Factor64.60x10 55-gallon-9 34.61x10 lb/10-8 38.05x10 lb/10-7 31.09x10 lb/10drums/yr drums reclaimed drums reclaimed drums reclaimedreclaimedExample Calculation2,3,7,8 TCDD national emissions estimate = (4.60 x 10 6 drum/yr reclaimed)x (4.61 x 10 9 lb/10 3 drum)= 2.12 x 10 5 lb/yr2,3,7,8 TCDF national emissions estimate = (4.60 x 10 6 drum/yr reclaimed)x (8.05 x 10 8 lb/10 3 drum)= 3.70 x 10 4 lb/yr2,3,7,8 TCDD TEQ national emissions estimate = (4.60 x 10 6 drum/yr reclaimed)x (1.09 x 10 7 lb/10 3 drum)= 5.01 x 10 4 lb/yrA-45
ON-ROAD MOBILE SOURCESBasis for CalculationThe Federal Highway Administration's (FHWA) estimated 1992 national activity level for on-road12 34mobile sources is 2.2398x10 vehicle miles <strong>of</strong> travel (VMT). This national activity levelestimate was developed <strong>from</strong> the 1992 annual Highway Performance Monitoring System (HPMS)reports <strong>from</strong> each State in the nation; the HPMS reports are the st<strong>and</strong>ardized format for reportingvehicle activity levels expressed as VMT to the FHWA. The VMT estimates account for travelby passenger cars, trucks, <strong>and</strong> motorcycles on all urban <strong>and</strong> rural roadways within each State.The emission factors developed for this category reflect the level <strong>of</strong> pollution control <strong>and</strong> the fueltype for the vehicles <strong>from</strong> which the emissions were originally sampled. Using EPA's MOBILE5model, separate dioxin/furan emission factors were derived for unleaded gasoline poweredvehicles (0.36 pg TEQ/km, for a national annual emission range <strong>of</strong> 0.4 to 4.1 g TEQ/yr), leadedgasoline powered vehicles (range <strong>of</strong> 1.1 to 108 pg TEQ/km, for a national annual emission range<strong>of</strong> 0.2 to 19 g TEQ), <strong>and</strong> diesel powered vehicles (0.5 ng TEQ/km, for a national annual emissionrange <strong>of</strong> 27 to 270 g TEQ/yr). 35The VMT mix distribution in MOBILE5a represents the national average distribution <strong>of</strong> VMTamong eight gasoline <strong>and</strong> diesel vehicle classes. The combined fraction for gasoline vehicles inthe MOBILE5a distribution is 94 percent; for diesel vehicles it is 6 percent.2,3,7,8-TCDD 2,3,7,8-TCDF 2,3,7,8-TCDD TEQActivity Level Emission Factor Emission Factor Emission Factor12 -15 -14 -142.2398x10 VMT 3.60x10 lb/VMT 5.65x10 lb/VMT 8.85x10 lb/VMTA-46
Example Calculation2,3,7,8 TCDD TEQ national emissions estimate = (2.2398 x 10 12 VMT/yr)x (8.85 x 10 14 lb/VMT)= 1.98 x 10 1 lb/yr2,3,7,8 TCDD national emissions estimate = (2.2398 x 10 12 VMT/yr)x (3.60 x 10 15 lb/VMT)= 8.06 x 10 3 lb/yr2,3,7,8 TCDF national emissions estimate = (2.2398 x 10 12 VMT/yr)x (5.65 x 10 14 lb/VMT)= 1.27 x 10 1 lb/yrA-47
PULP AND PAPER--KRAFT RECOVERY FURNACESBasis for CalculationThe national activity level for pulp <strong>and</strong> paper industry kraft recovery furnaces for 1990 is3631,080,000 tons <strong>of</strong> black liquor solids burned. The emission factor for 2,3,7,8-TCDD TEQ, ascalculated <strong>from</strong> data collected by the National Council <strong>of</strong> the Paper Industry for Air <strong>and</strong> Stream17Improvement (NCASI), is presented below for kraft recovery furnaces. Emission factors <strong>and</strong>the national activity data <strong>from</strong> kraft recovery furnaces were used to estimate 2,3,7,8-TCDD TEQemissions.Activity Level2,3,7,8-TCDD TEQ Emission Factor7 -113.11x10 ton black liquor solids burned 2.20x10 lb/ton black liquor solidsExample Calculation2,3,7,8 TCDD TEQ national emissions estimate = (3.11 x 10 7 ton/yr black liquor solids burnedx (2.2 x 10 11 lb/ton black liquor solids)= 6.84 x 10 4 lb/yrA-48
WOOD TREATMENTBasis for CalculationThe most current national activity data acquired for PCP wood treatment is for 1988 <strong>and</strong> is210,800 tons <strong>of</strong> PCP used in wood treatment operations. The dioxin/furan emission factors werederived using reported average emissions <strong>of</strong> five pressure treatment facilities in California <strong>and</strong>37their average associated PCP consumption. The emission data used in factor development werederived using known concentrations <strong>of</strong> dioxin/furan species in PCP <strong>and</strong> calculated fugitiveemission rates. Homologue totals were used in calculating 2,3,7,8-TCDD TEQs. It was assumedthat because no 2,3,7,8-tetra congener contamination was detected in commercial PCP afterdilution <strong>and</strong> mixture with co-solvents, 2,3,7,8-TCDD would not be emitted to the atmosphere<strong>from</strong> the PCP wood treatment process. 37Activity Level2,3,7,8-TCDD TEQ Emission Factor4 -61.08x10 ton PCP used for wood treatment 7.06x10 lb/ton PCPExample Calculation2,3,7,8 TCDD TEQ national emissions estimate = (7.06 x 10 6 lb/ton PCP)x (1.08 x 10 4 ton/yr PCP)= 7.62 x 10 2 lb/yrA-49
CARBON REGENERATION/REACTIVATIONBasis for CalculationThe only data available for the amount <strong>of</strong> activated carbon consumed in a year is for water <strong>and</strong>wastewater treatment operations. The national activity level for activated carbon consumption inwater <strong>and</strong> wastewater treatment operations for 1990 is 71,900 tons <strong>of</strong> activated carbon38consumed. For calculational purposes, it is assumed that all activated carbon used in water <strong>and</strong>wastewater treatment is regenerated. The dioxin/furan emission factors were derived by a2weighted average <strong>of</strong> emission factors. The weighted emission factors reflect the followingassumptions: 50 percent <strong>of</strong> the total amount <strong>of</strong> activated carbon thermally reactivated is <strong>from</strong>industrial uses <strong>and</strong> occurs in large multiple-hearth or similar furnace types; 50 percent <strong>of</strong> the totalis used for municipal wastewater/potable water treatment applications. 2,3,7,8-TCDD/TCDFisomer specific emission factors <strong>and</strong> homologue totals were used in calculating 2,3,7,8-TCDDtoxic equivalency.2,3,7,8-TCDD 2,3,7,8-TCDF 2,3,7,8-TCDD TEQActivity Level Emission Factor Emission Factor Emission Factor47.19x10 ton carbon-102.10x10 lb/ton-91.36x10 lb/ton-93.46x10 lb/tonreactivated carbon reactivated carbon reactivated carbon reactivatedExample Calculation2,3,7,8 TCDD national emissions estimate = (7.19 x 10 4 ton/yr carbon)x (2.10 x 10 10 lb/ton carbon)= 1.51 x 10 5 lb/yrA-50
2,3,7,8 TCDF national emissions estimate = (7.19 x 10 4 ton/yr carbon)x (1.36 x 10 9 lb/ton carbon)= 9.78 x 10 5 lb/yr2,3,7,8 TCDD TEQ national emissions estimate = (7.19 x 10 4 ton/yr carbon)x (3.46 x 10 9 lb/ton carbon)= 2.49 x 10 4 lb/yrA-51
FOREST FIRESBasis for CalculationDioxin/furan emission estimates attributed to forest fires were based on a methodology developedby EPA's Office <strong>of</strong> Health <strong>and</strong> Environmental Assessment (this <strong>of</strong>fice is now named the National39Center for Environmental Assessment). An average <strong>of</strong> 5.1 million acres <strong>of</strong> biomass are burnedin wildfires each year in the U.S., based on 40 years <strong>of</strong> USDA Forest Service data. In 1989,5.1 million acres were burned as a result <strong>of</strong> prescribed burning. Biomass consumption rates wereestimated at 10.4 ton/acre for wildfires, <strong>and</strong> 8.2 ton/acre for prescribed fires. From theseestimates, the national activity level for wildfires was estimated at 53 million tons <strong>of</strong> biomassconsumed <strong>and</strong> was estimated for prescribed fires at 42 million tons, for a total <strong>of</strong> 95 million tons. 2Applying the emission factor developed for combustion in a woodstove [which is 0.19 lb TEQ/ton(1 ng TEQ/kg) biomass burned], annual TEQ emissions <strong>from</strong> forest fires were estimated at 0.19 lb(86 g), with projected range <strong>from</strong> 0.06 lb (27 g) to 0.6 lb (270 g) TEQ/yr. 40Activity Level2,3,7,8-TCDD TEQ Emission Factor7 -99.50x10 ton biomass burned 2.00x10 lb/ton biomass burnedExample Calculation2,3,7,8 TCDD TEQ national emissions estimate = (9.50 x 10 7 ton/yr biomass burned)x (2.00 x 10 9 lb/ton biomass burned)= 1.90 x 10 1 lb/yrA-52
CREMATORIESBasis for CalculationEmission estimates attributed to crematories were based on emission factors <strong>from</strong> a CARB source41 42test report <strong>and</strong> 1991 activity data regarding the number <strong>of</strong> cremations per year. The test reportincluded emission factor data for 2,3,7,8-TCDD <strong>and</strong> 2,3,7,8-TCDF but not for 2,3,7,8-TCDDTEQ. The 2,3,7,8-TCDD <strong>and</strong> 2,3,7,8-TCDF emission factors were multiplied by the activity levelto calculate national 2,3,7,8-TCDD/TCDF emissions <strong>from</strong> crematories. An emission factor for2,3,7,8-TCDD TEQ was not available <strong>and</strong>, therefore, a national emissions estimate for2,3,7,8-TCDD TEQ <strong>from</strong> crematories was not developed.Activity Level 2,3,7,8-TCDD Emission Factor 2,3,7,8-TCDF Emission Factor-14 -13400,500 bodies/yr 4.58x10 lb/body 3.31x10 lb/bodyExample Calculation-142,3,7,8-TCDD national emissions estimate = (4.58x10 lb/body) x (400,500 bodies/yr)-8= 1.83x10 lb/yr-132,3,7,8-TCDF national emissions estimate = (3.31x10 lb/body) x (400,500 bodies/yr)-7= 1.33x10 lb/yrA-53
REMAINING SOURCE CATEGORIESNational dioxin/furan emissions <strong>from</strong> the following source categories could not be calculatedbecause <strong>of</strong> lack <strong>of</strong> additional information (e.g., activity data):Industrial waste incineration;Scrap metal incineration;PCB fires;Municipal solid waste l<strong>and</strong>fills; <strong>and</strong>Organic chemical manufacturing.A-54
REFERENCES1. National Dioxin Emission Estimates <strong>from</strong> Municipal Waste Combustors.U.S. Environmental Protection Agency, Emission St<strong>and</strong>ards Division, Office <strong>of</strong> AirQuality Planning <strong>and</strong> St<strong>and</strong>ards, Research Triangle Park, North Carolina. June 1996.Docket A-90-45, Item VII-A-001.2. U.S. Environmental Protection Agency. <strong>Emissions</strong> Inventory <strong>of</strong> Section 112(c)(6)Pollutants: Polycyclic Organic Matter (POM),2,3,7,8-Tetrachlorodibenzo-P-Dioxin (TCDD)/2,3,7,8,-Tetrachlorodibenz<strong>of</strong>uran (TCDF),Polychlorinated Biphenyl Compounds (PCBs), Hexachlorobenzene, Mercury, <strong>and</strong>Alkylated Lead. Draft Report. Office <strong>of</strong> Air Quality Planning <strong>and</strong> St<strong>and</strong>ards, ResearchTriangle Park, North Carolina, 1996.3. U.S. EPA. Municipal Waste Combustors - Background Information for ProposedGuidelines for Existing Facilities. EPA-450/3-89-27e. August 1989.4. U.S. EPA. Compilation <strong>of</strong> Air Pollutant Emission Factors, 5th ed. , Vol. I: StationaryPoint <strong>and</strong> Area <strong>Sources</strong>. Research Triangle Park, North Carolina: U.S. EnvironmentalProtection Agency, 1995.5. Federal Register, Vol. 61, No. 120, June 20, 1996. St<strong>and</strong>ards <strong>of</strong> Performance for NewStationary <strong>Sources</strong> <strong>and</strong> Emission Guidelines for Existing <strong>Sources</strong>: Medical WasteIncinerators. Proposed Rule.6. National Dioxin <strong>Emissions</strong> From Medical Waste Incinerators. U.S. EnvironmentalProtection Agency, Emission St<strong>and</strong>ards Division, Office <strong>of</strong> Air Quality Planning <strong>and</strong>St<strong>and</strong>ards, Research Triangle Park, North Carolina. June 1996. Docket #A-91-61,ITCM, IV-A-007.7. U.S. EPA. Emission Factor Documentation for AP-42, Chapter 2.5 Sewage SludgeIncineration. Research Triangle Park, North Carolina: U.S. Environmental ProtectionAgency, 1993. pp. 2.5-13 to 2.5-17.8. Oppelt, E.T. Incineration <strong>of</strong> Hazardous Waste--A Critical Review. Journal <strong>of</strong> AirPollution Control Association. 37(5):558-586, 1987.9. Memor<strong>and</strong>um <strong>from</strong> G. Rizeq, EER Corporation, to F. Behan, U.S. EnvironmentalProtection Agency. "TEQ <strong>and</strong> Mercury National <strong>Emissions</strong> Estimate for HazardousWaste Incinerators." April 3, 1997.A-55
10. Draft Technical Support Document: HAPs National <strong>Emissions</strong> Estimate for HazardousWaste Combustor Systems. Prepared by EER Corporation for the EnvironmentalProtection Agency's Office <strong>of</strong> Solid Waste (OSW). April, 1997.11. Memor<strong>and</strong>um <strong>from</strong> G. Rizeq, EER Corporation, to F. Bekan, U.S. EnvironmentalProtection Agency. "National <strong>Emissions</strong> Estimates for TEQ <strong>and</strong> Mercury."April 7, 1997.12. Memor<strong>and</strong>um <strong>from</strong> E. Heath, Research Triangle Institute to J. Wood, U.S. EnvironmentalProtection Agency. March 18, 1996. "Dioxin/Furan Toxic Equivalent <strong>Emissions</strong> <strong>from</strong>Cement Kilns that do not Burn Hazardous Waste."13. Draft Technical Support Document for Hazardous Waste Combustion (HWC) MACTSt<strong>and</strong>ards, Volume II: HWC <strong>Emissions</strong> Database, Appendix A: Cement Kiln DetailedData Listing, U.S. Environmental Protection Agency, Office <strong>of</strong> Solid Waste <strong>and</strong>Emergency Response. September, 1995.14. Radian Corporation. Modesto Energy Company Waste Tire-to-Energy Facility, Westley,California, Final Emission Test Report. Report No. 243-047-20. Research Triangle Park,North Carolina: Radian Corporation, 1988.15. U.S. EPA. Summary <strong>and</strong> Markets for Scrap Tires. EPA/530-SW-90-074B. Washington,D.C.: Office <strong>of</strong> Solid Waste <strong>and</strong> Emergency Response, U.S. Environmental ProtectionAgency, 1992.16. Cole, J. (Research Triangle Institute). Memor<strong>and</strong>um to W. Maxwell, (U.S. EnvironmentalProtection Agency), Research Triangle Park, North Carolina. January 19, 1995.17. Someshwar, A.V. Summary <strong>of</strong> Mill Test Reports on Wood Residue Combustion, BlackLiquor Combustion, <strong>and</strong> Kraft Mill Sludge Burning. NCASI Files. Gainesville, Florida:National Council <strong>of</strong> the Paper Industry for Air <strong>and</strong> Stream Improvement, Inc., 1995.18. Energy Information Administration. Estimate <strong>of</strong> U.S. Bi<strong>of</strong>uels Consumption 1990.DOE/EIA-0548(90). Washington, D.C.: Office <strong>of</strong> Coal, Nuclear, Electric, <strong>and</strong>Alternative Fuels, U.S. Department <strong>of</strong> Energy, 1991. p. 9.19. Energy Information Administration. State Energy Data Report. Washington, D.C.:Office <strong>of</strong> Energy Markets <strong>and</strong> End Use, U.S. Department <strong>of</strong> Energy, 1992.20. Energy Information Administration. February, 1993. Household Energy Consumption<strong>and</strong> Expenditures 1990. DOE/EIA-0321(90).A-56
21. Energy Information Administration. February 1993. Household Energy Consumption <strong>and</strong>Expenditures 1990, Supplement: Regional. Office <strong>of</strong> Energy Markets <strong>and</strong> End Use.DOE/EIA-0321(90/S). pp. 30, 115, 205, <strong>and</strong> 297.22. Letter <strong>and</strong> attachments <strong>from</strong> David Menotti, Shaw, Potts, <strong>and</strong> Trowbridge, to Anne Pope,U.S. EPA. Comments to the draft 112(c)(6) emissions inventory report. November 27,1996.23. U.S. EPA. June 1994. <strong>Estimating</strong> Exposures to Dioxin-Like Compounds, Volume II:Properties, <strong>Sources</strong>, Occurrence, <strong>and</strong> Background Exposures. External Review Draft.EPA-600/6-88-005Cb. Office <strong>of</strong> Health <strong>and</strong> Environmental Assessment, Washington,DC. pp. 3-143-3-146.24. California Air Resources Board. <strong>Emissions</strong> Measurement <strong>of</strong> Toxic Compounds <strong>from</strong> aCupola Baghouse at a Steel Foundry. Report No. ERC-61. Sacramento, California:California Air Resources Board, 1993.25. Research Triangle Institute. 1994. Preliminary Source Assessment for the SecondaryCopper Smelting Industry. Prepared for the U.S. Environmental Protection Agency,Research Triangle Park, North Carolina.26. U.S. EPA. 1987. National Dioxin Study Tier 4-Combustion <strong>Sources</strong>. Final Test Report-Site 10 Secondary Copper Recovery Cupola Furnace MET-A. EPA-450/4-87-014s.Research Triangle Park, North Carolina.27. Larrabee, D.A. Lead. In: U.S. Industrial Outlook 1991. U.S. Department <strong>of</strong> Commerce,International Trade Administration, Washington, DC. 1991.28. U.S. EPA. Secondary Lead Smelting Background Information Document forPromulgated St<strong>and</strong>ards. EPA-453/R-95-008B. Research Triangle Park, North Carolina.29. U.S. EPA. Draft Emission Test Report. HAP Emission Testing a Selected <strong>Sources</strong> at aSecondary Lead Smelter. East Penn Manufacturing Company. Prepared by Roy F.Weston, Inc. 1993.30. U.S. EPA. Draft Emission Test Report. HAP Emission Testing on Selected <strong>Sources</strong> at aSecondary Lead Smelter. Tejas Resources, Inc. Prepared by Roy F. Weston, Inc. 1992.31. U.S. EPA. Draft Emission Test Report. HAP Emission Testing in Selected <strong>Sources</strong> at aSecondary Lead Smelter. Schulkill Metals Corporation. Prepared by Roy F. Weston, Inc.1993.A-57
32. Memor<strong>and</strong>um <strong>from</strong> Bob Strieter, The Aluminum Association, to Juan Santiago,U.S. Environmental Protection Agency. Annual Dioxin <strong>Emissions</strong> <strong>from</strong> SecondaryAluminum Production. May 17, 1996.33. Memor<strong>and</strong>um <strong>from</strong> Juan Santiago, U.S. Environmental Protection Agency, to JackJohnson, Eastern Research Group, Inc. New Dioxin/Furan <strong>Emissions</strong> Data Received <strong>from</strong>the Aluminum Association, Research Triangle Park, North Carolina. January 22, 1997.34. U.S. Federal Highway Administration's Highway Statistics. Washington, D.C.: U.S.Department <strong>of</strong> Transportation, 1992.35. U.S. EPA. MOBILE5a Emission Factor Model. Ann Arbor, Michigan: Office <strong>of</strong> Mobile<strong>Sources</strong>, U.S. Environmental Protection Agency, 1993.36. U.S. EPA. 1990 Census <strong>of</strong> Pulp, Paper <strong>and</strong> Paperboard Manufacturing Facilities.Response to 308 Questionnaire, Part A: Technical Information. Washington, D.C.:Office <strong>of</strong> Water, U.S. Environmental Protection Agency, 1992.37. California Air Resources Board. Inventory <strong>of</strong> Chlorophenol Use in the Forest ProductsIndustry <strong>and</strong> Investigation <strong>of</strong> Related <strong>Emissions</strong> <strong>of</strong> Chlorinated Dibenzodioxins <strong>and</strong>Dibenz<strong>of</strong>urans, Final Report. Sacramento, CA: California Air Resources Board, 1987.38. Humer, C. Activated Carbon Plant Starts for American Novit. Chemical MarketingReporter. June 1992.39. U.S. EPA. <strong>Estimating</strong> Exposure to Dioxin-like Compounds, Volume II: Properties,<strong>Sources</strong>, Occurrence, <strong>and</strong> Background Exposures, External Review Draft.EPA-600/6-88-005 Cb. Washington, D.C.: Exposure Assessment Group, Office <strong>of</strong>Health <strong>and</strong> Environmental Assessment, U.S. Environmental Protection Agency, 1994.40. Peterson, J. (Mt. Baker--Snoqualmie National Forest) <strong>and</strong> D. Ward (Forest Service FireLab). An Inventory <strong>of</strong> Particulate Matter <strong>and</strong> Air Toxic <strong>Emissions</strong> <strong>from</strong> Prescribed Firesin the United States for 1989. Proceedings <strong>of</strong> the Air <strong>and</strong> Waste ManagementAssociation 1993 Annual Meeting <strong>and</strong> Exhibition. Denver, Colorado. June 14 to 18,1993.41. California Air Resources Board. <strong>Emissions</strong> Testing <strong>of</strong> a Propane Fired Incinerator at aCrematorium. Report No. ERC-39. Sacramento, California: California Air ResourcesBoard, 1992.42. Cremation Association <strong>of</strong> North America. Cremation Statistics. Cremationist. Chicago,Illinois: Cremation Association <strong>of</strong> North America, 1992.A-58