Performance Of Generating Plant - World Energy Council
Performance Of Generating Plant - World Energy Council
Performance Of Generating Plant - World Energy Council
Create successful ePaper yourself
Turn your PDF publications into a flip-book with our unique Google optimized e-Paper software.
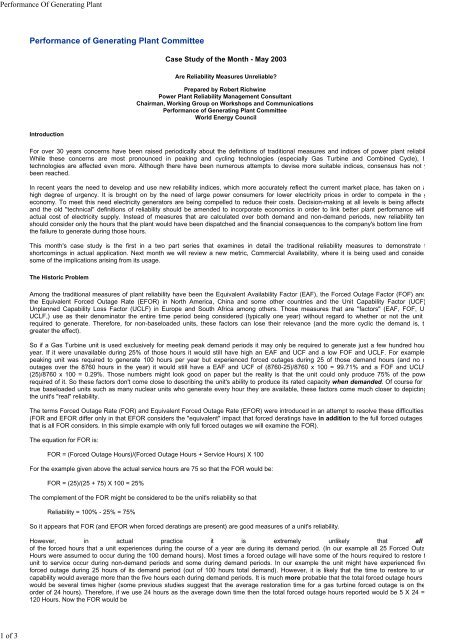
<strong>Performance</strong> <strong>Of</strong> <strong>Generating</strong> <strong>Plant</strong>1 of 3<strong>Performance</strong> of <strong>Generating</strong> <strong>Plant</strong> CommitteeCase Study of the Month - May 2003Are Reliability Measures Unreliable?Prepared by Robert RichwinePower <strong>Plant</strong> Reliability Management ConsultantChairman, Working Group on Workshops and Communications<strong>Performance</strong> of <strong>Generating</strong> <strong>Plant</strong> Committee<strong>World</strong> <strong>Energy</strong> <strong>Council</strong>IntroductionFor over 30 years concerns have been raised periodically about the definitions of traditional measures and indices of power plant reliabilWhile these concerns are most pronounced in peaking and cycling technologies (especially Gas Turbine and Combined Cycle), btechnologies are affected even more. Although there have been numerous attempts to devise more suitable indices, consensus has not ybeen reached.In recent years the need to develop and use new reliability indices, which more accurately reflect the current market place, has taken on ahigh degree of urgency. It is brought on by the need of large power consumers for lower electricity prices in order to compete in the geconomy. To meet this need electricity generators are being compelled to reduce their costs. Decision-making at all levels is being affecteand the old "technical" definitions of reliability should be amended to incorporate economics in order to link better plant performance withactual cost of electricity supply. Instead of measures that are calculated over both demand and non-demand periods, new reliability termshould consider only the hours that the plant would have been dispatched and the financial consequences to the company's bottom line fromthe failure to generate during those hours.This month's case study is the first in a two part series that examines in detail the traditional reliability measures to demonstrate tshortcomings in actual application. Next month we will review a new metric, Commercial Availability, where it is being used and considersome of the implications arising from its usage.The Historic ProblemAmong the traditional measures of plant reliability have been the Equivalent Availability Factor (EAF), the Forced Outage Factor (FOF) andthe Equivalent Forced Outage Rate (EFOR) in North America, China and some other countries and the Unit Capability Factor (UCF)Unplanned Capability Loss Factor (UCLF) in Europe and South Africa among others. Those measures that are "factors" (EAF, FOF, UUCLF,) use as their denominator the entire time period being considered (typically one year) without regard to whether or not the unitrequired to generate. Therefore, for non-baseloaded units, these factors can lose their relevance (and the more cyclic the demand is, tgreater the effect).So if a Gas Turbine unit is used exclusively for meeting peak demand periods it may only be required to generate just a few hundred houyear. If it were unavailable during 25% of those hours it would still have high an EAF and UCF and a low FOF and UCLF. For examplepeaking unit was required to generate 100 hours per year but experienced forced outages during 25 of those demand hours (and no ooutages over the 8760 hours in the year) it would still have a EAF and UCF of (8760-25)/8760 x 100 = 99.71% and a FOF and UCLF(25)/8760 x 100 = 0.29%. Those numbers might look good on paper but the reality is that the unit could only produce 75% of the powerequired of it. So these factors don't come close to describing the unit's ability to produce its rated capacity when demanded. <strong>Of</strong> course fortrue baseloaded units such as many nuclear units who generate every hour they are available, these factors come much closer to depictingthe unit's "real" reliability.The terms Forced Outage Rate (FOR) and Equivalent Forced Outage Rate (EFOR) were introduced in an attempt to resolve these difficulties(FOR and EFOR differ only in that EFOR considers the "equivalent" impact that forced deratings have in addition to the full forced outagesthat is all FOR considers. In this simple example with only full forced outages we will examine the FOR).The equation for FOR is:FOR = (Forced Outage Hours)/(Forced Outage Hours + Service Hours) X 100For the example given above the actual service hours are 75 so that the FOR would be:FOR = (25)/(25 + 75) X 100 = 25%The complement of the FOR might be considered to be the unit's reliability so thatReliability = 100% - 25% = 75%So it appears that FOR (and EFOR when forced deratings are present) are good measures of a unit's reliability.However, in actual practice it is extremely unlikely that allof the forced hours that a unit experiences during the course of a year are during its demand period. (In our example all 25 Forced OutaHours were assumed to occur during the 100 demand hours). Most times a forced outage will have some of the hours required to restore tunit to service occur during non-demand periods and some during demand periods. In our example the unit might have experienced fiveforced outage during 25 hours of its demand period (out of 100 hours total demand). However, it is likely that the time to restore to uncapability would average more than the five hours each during demand periods. It is much more probable that the total forced outage hourswould be several times higher (some previous studies suggest that the average restoration time for a gas turbine forced outage is on theorder of 24 hours). Therefore, if we use 24 hours as the average down time then the total forced outage hours reported would be 5 X 24 =120 Hours. Now the FOR would be
<strong>Performance</strong> <strong>Of</strong> <strong>Generating</strong> <strong>Plant</strong>2 of 3FOR = (120)/(120 + 75) X 100 = 61.5% and the unit's reliability = (100-61.5) = 38.5%, both of which are obviously unrealistic whenattempting to use these statistics to make decisions requiring the expected reliability of units to be used. And yet these values are very closeto actual FOR and EFOR statistics being reported for peaking types of generators!Does that mean that FOR and EFOR should not be used? Absolutely not! They are in fact reasonable indicators for baseload or neabaseload types of generating units. However, for cycling or peaking units they are inadequate and new metrics were needed.A few years ago a modification of EFOR was introduced to attempt to resolve this problem. The term Equivalent Forced OutageRate-Demand, EFOR(d), was developed which only used that portion of a unit's forced outage (or derating) that occurred during demaperiods. As we saw in the earlier example, that would resolve the issue nicely. However, demand periods are not currently part of stareporting systems so that an approximation technique was devised using a MARKOV approach. Although not perfect, this technique doeresult in a more accurate calculation of EFOR(d). See Ref. 3 for a more detailed discussion of this technique.The New ProblemAs the industry moves into a more competitive market-based business environment, the reliability indicators must be able to have a dirlinkage between a plant's performance and the corporate or portfolio cost and/or profit of electricity. They should incorporate the large (oftvery large) variation in the value of a unit's reliability. For example, in previous efforts the author has made to quantify the value of availabilityimprovement of an individual unit within a large company, he has found that even for efficient coal-fired units there can be a factor of 100!between its value during a low demand period compared to its value during a high demand period and other generators are havingunexpected forced outages. Even nuclear units have a significant variability in their value during different times. This variation will inevitaresult in different economically optimal decisions at different times.As an example of this the following example was developed from actual data at one large generating company using value-based availabilityto measure its plants' performance:On a Tuesday morning a small boiler tube leak was detected at one of its large efficient coal-fired units that ran close to baseload. Twooptions were identified:1.Remove the unit from service immediately and repair the tube as quickly as possible so as to minimize the downtime of the unit.2.Continue to operate the unit until the weekend when the demand is lower and the cost impact of the unit's unavailability is less perhour. However, the unit would be exposed to a risk of a longer duration outage due to possible additional tube damage.When the plant staff evaluated these options (using an O&M decision support tool discussed in our March 2003 Case Study) for an eventthat occurred during the non-peakseason, it was found that the cost was minimized by choosing Option 1. This was because the differential between the weekdayweekend-day cost per hour of this unit's unavailability at this time was not enough to offset the increased risk of a longer outage if the unitwas operated until the weekend.Total Cost - Non-Peak Season1.2.Option 1 - $115,000Option 2 - $184,000This choice also had the effect of minimizing the forced outage hours resulting from this event.However, when the exact event occurred during the company's peak season the cost were:Total Cost- Peak Season1.2.Option 1 - $354,000Option 2 - $265,000In this case, Option 2 is clearly the best economic choice, even though it had the effect of reducing the plant's availability beyond that ofOption 1.As we can see, often the objective of maximizing a unit's "technical" performance (in this case availability) brings it into direct conflict withthe company's goal of minimizing cost and/or maximizing profitability.This example is only one of thousands of decisions that a power plant staff must make every year and illustrates the vital importancdeveloping performance metrics that establish direct linkages between the plant's goals and the company's overall financial objectives. In thisway we will be encouraging the plant staff to make optimal economic decisions, not just ones that maximize their technical goals.None of the traditional statistics such as EAF, UCF, FOF, UCLF, FOR, EFOR or even EFOR(d) adequately make this linkage betweetechnical and economic goals. However, some companies have begun using a new measurement technique called Commercial Availabilitthat promises to do exactly that!Next MonthWe will conclude this series next month by examining this new concept of Commercial Availability and begin to consider some of timplications inherent in using this statistic.We would like for you to note that a panel session on Commercial Availability co-chaired by Robert Richwine and Michael Curley (chairmanof Working Group 2 of the <strong>World</strong> <strong>Energy</strong> <strong>Council</strong>'s <strong>Performance</strong> of <strong>Generating</strong> <strong>Plant</strong> Committee) will be held on Tuesday June 17, 2003 aspart of the co-located ASME Power Division's International Joint Power Generation Conference and ASME International Gas TurbineInstitute's Global Gas Turbine Exposition and Conference in Atlanta, Ga. For information click onhttp://www.asmeconferences.org/ijpgc03/TechnicalProgramOverview.cfm
<strong>Performance</strong> <strong>Of</strong> <strong>Generating</strong> <strong>Plant</strong>3 of 3Panelists will include senior managers from companies actually using Commercial Availability measures and will focus on interactionbetween the panelists and the audience. We encourage you to attend and share your thoughts, insights and questions.Robert R. RichwineReliability Management ConsultantChairman, Working Group for Workshops and Communications<strong>Performance</strong> of <strong>Generating</strong> <strong>Plant</strong> Committee<strong>World</strong> <strong>Energy</strong> <strong>Council</strong>References:1. Richwine, R. R.; Curley, G. M.; DellaVilla, S. A.; Lofe, J. J.; Reliability Measures Unreliable... It's Time for a Change; Published inthe IGTI's Global Gas Turbine News, 19982. Stallard, G. S.; Salvaderi, L.; Richwine, R.R.; Spiegleberg-Planer, R.; Glorian, D.; Corrigal, M.; Micali, V.; Neibo, R.; International DataExchange Within The Global Power Industry - A Critical Activity for the Evolving Competitive Power Market; Published at the17th <strong>World</strong> <strong>Energy</strong> <strong>Council</strong> Congress, 19983. Stallard, G. S.; Micali, V., deSabastian, A. L.; Salvaderi, L.; Richwine, R. R., Glorian, D.; Heithoff, J.; International Availability DataExchange for Thermal <strong>Generating</strong> <strong>Plant</strong>; published at the 18th WEC Congress, 20014. Stallard, G.S.; Richwine, R.R., Salvaderi, L.; Measuring <strong>Performance</strong> in a Co-Generation <strong>Plant</strong>, published at Power-Gen EuropeConference, 2000.


